
Abstract
Multiple-parametric small animal experiments require, by their very nature, a sufficient number of animals which may need to be large to obtain statistically significant results. 1 For this reason database-related systems are required to collect the experimental data as well as to support the later (re-) analysis of the information gained during the experiments. In particular, the monitoring of animal welfare is simplified by the inclusion of warning signals (for instance, loss in body weight >20%). Digital patient charts have been developed for human patients but are usually not able to fulfill the specific needs of animal experimentation. To address this problem a unique web-based monitoring system using standard MySQL, PHP, and nginx has been created. PHP was used to create the HTML-based user interface and outputs in a variety of proprietary file formats, namely portable document format (PDF) or spreadsheet files. This article demonstrates its fundamental features and the easy and secure access it offers to the data from any place using a web browser. This information will help other researchers create their own individual databases in a similar way. The use of QR-codes plays an important role for stress-free use of the database. We demonstrate a way to easily identify all animals and samples and data collected during the experiments. Specific ways to record animal irradiations and chemotherapy applications are shown. This new analysis tool allows the effective and detailed analysis of huge amounts of data collected through small animal experiments. It supports proper statistical evaluation of the data and provides excellent retrievable data storage.
Small animal experiments are still required for basic and translational cancer research. This is especially so for mouse xenograft models which help in learning more about local tumor growth and the systematic spread of tumor cells. Such experiments may require large numbers of animals hence databases are of vital importance for collecting the experimental data as well as for supporting further analysis. Monitoring animals’ health during experiments is an important legal requirement for these types of experiments. Therefore an accurate documentation of animal weight and physical condition according to standard scoring systems may help to identify animals in poor clinical condition immediately, and warning signals are generated if such endpoints are reached.
For human patients several digital patient management systems already exist. One example is the ‘Soarian’ system2–4 (Siemens Healthcare Diagnostics GmbH, Eschborn, Germany) which offers access to various different types of data (such as clinical chemistry, vital parameters of the patients, patient reports, etc.) with a unified graphical user interface. Some systems are commercially available for small animals undergoing experiments (examples are: ‘tick@lab’ by a-tune software AG, Darmstadt, Germany; 5 ‘Galilei Clinical Research System’ by Galilei Software GmbH, Bad Tölz, Germany; ‘AniBio’ by Noray Bioinformatics SLU, Derio, Bizkaia, Spain; and ‘PyRAT’ by Scionics Computer Innovation GmbH, Dresden, Germany). As these systems did not offer a solution to continue our ‘old analogue in-house documentation’ the need arose to create our own digital ‘patient chart’ for small animal experiments. In this way we did not have to discontinue all of our ‘traditional’ workflows and could combine them with our modern database.
Our clinical monitoring system had to fulfill the following requirements:
Easy and secure data access from any place via a web browser on a smartphone or a computer Collection of all regulatory data required for the experiment Identification (ID) of all animals and their samples collected during the experiment Collection of experimental data Functions to statistically evaluate the experimental data within the system Functions to export data into specific file formats like Adobe portable document format (PDF) (Adobe Systems Software Ireland Ltd, Dublin, Republic of Ireland), Microsoft Excel XLSX (Microsoft Corporation, Redmond, WA, USA)
The following sections describe how we were able to implement these requirements by means of a web-based database.
Animals, materials and methods
Experiment the monitoring system was designed for
Our monitoring system was originally developed for a large experiment using mice, which tried to answer the question of whether the number of metastases is influenced by the treatment of the primary tumor withradiochemotheray and/or chemotherapy (ethical approval according to German law). For this reason we worked with immunodeficient mice (SCID and pfp/rag2) that were inoculated with different human tumor cells to form a local primary tumor as well as consecutive distant metastases. The SCID mice used were CB17/Icr-Prkdcscid/IcrIcoCrl (Charles River Laboratories Inc, Wilmington, MA, USA) and were marked with picric acid on the fur. The pfp/rag2 mice used were B6-129S6-PfptmlClrk-Rag2tmlFwaN12 (Taconic, Hudson, NY, USA) and were punched with ear holes for ID purposes. A maximum of five animals were kept within a single isolated ventilated cage (530 cm2).
The animals were treated by local radiation therapy, 6 chemotherapy, radiochemotherapy, or no therapy at all as a control group. At the end of the experiments up to 13 different samples were taken from each animal for further analyses. As the experiments included more than 400 mice (100 per tumor cell line, 5 subgroups each) several thousand samples and data points were generated involving more than five researchers, making data collection and analysis with handwritten data or local databases on a single personal computer (PC) impractical. Hence this web-based database was developed.
Easy and secure data access from any place
As there are at present many researchers working with the data simultaneously from different places we decided to create a web-based MySQL database version 5.5.32.7,8 At present it consists of 54 single tables which are logically coupled. The graphical user interface was created using HTML and CSS. The HTML pages were created using PHP scripting version 5.3.107,8 running on an nginx version 1.5 web server to access the data from the database. Access on the system is possible via any kind of computer or handheld device that has an implemented web browser. This allows the use of PCs as well as smartphones or tablet computers to display and modify all data.
Login is possible with username and password only. For security reasons each user has individual rights to access or modify data. Whenever a new user logs in, a backup of the entire dataset is created on a high availability file transfer protocol (FTP) repository. For easy access of the data, ‘QR-codes’9–11 based on phpqrcode version 1.1.4 12 are used. This library allows the creation of our own QR-codes including the data needed. The translation of the information in QR-codes is included in our software. Not only does each animal have its own QR-code which can be displayed in the digital ‘animal chart’ but these codes can also be used for several system actions such as the login procedure. This is especially useful for smartphones and tablet computers. QR-codes can be created as individual ‘key cards’ that permit database access within a time period of 12 h. Whenever these codes are scanned with a common QR-code reading application, cookies are created on the local machine that enable data access. In the same way the data connection can be closed again with a log-off QR-code.
Collection of all regulatory data required for the experiment
Animal experiments are generally prohibited without prior official permission from the local authorities. Our database complies with the German animal experimentation licensing act. Scientists have to follow common recommendations given by FELASA 13 or GV-SOLAS. 14 The name and contact information has to be recorded for every reseracher who performs procedures on the animals. More specifically in Germany, the official animal experiment permission number has to be known for all animals. This function is implemented into our database. Additional information about the biological security level may also be included. In our database all experimenters involved in the experiment are recorded. Whenever an animal starts with an experiment it is associated with the project number and the scientists involved. Also the name of the experiment and its aims are included.
Identification of all animals and their samples
The unique ID of an individual experimental animal can be a problem. In our institute, for example, TBase 15 is used to assign numbers to the animals. It is impractical to always use the unique seven-digit long TBase ID code, therefore four-digit short codes are also used. Each experiment may also have a specific numbering of each animal. In our institute there is also a ‘traditional’ labeling of the histological samples associated with the animals. This code consists of a number starting each year with ‘1’ which counts for the number of the experiment in the year, followed by a second number which counts the animals within one experiment. The last number accounts for the year which is followed by a letter marking the organ of the probe (such as ‘A’ for primary tumor, ‘B’ for lung tissue, ‘C’ for liver tissue, etc.; example: ‘12–3–14 A’).
As these examples show, even within institutions there are many different identifiers for one and the same animal, hence in retrospect, the assignment of histological samples to individual animals, for example, can be mutually error-prone and time-consuming. For this reason our database system has a unique identifier for each animal and multiple translation tables that help to assign other information to that number. In this way traditional labeling methods do not have to be changed while identification of the samples is kept as easy as possible.
Collection of experimental data
In our experiment many different types of data were collected, such as:
Animal ward rounds (condition, weight, stress of the animals, etc.) Tumor size (volume of palpable node) Anesthesia (name of the gas, concentration, time, duration, etc.) Chemotherapy given (name of the chemotherapeutic agent, concentration, volume applied, way applied, maximum dose allowed, etc.) Radiation dose given (physical dose, time, maximum dose allowed, fractionation, etc.) Magnetic resonance image date Number of tumor cells (e.g. in blood, in the bone marrow, in different tissues) Supplemental nutrition Any further data to be included at the discretion of the experimenter
In particular, knowledge of the chemotherapy and radiation doses applied is vital for the well-being of the animal. As doses higher than intended might accidently kill the animals, we need a particularly strict monitoring protocol with warning messages whenever the prescribed doses were reached. Such ‘record and verify’ systems are essential in (radiation) oncology with human patients, but are also needed for small animal experimentation as well. All these data can be stored in our monitoring system.
Functions to evaluate the experimental data
The use of SQL databases is appropriate. The tables in the database can be queried with all kinds of SQL commands which are very powerful. This makes it easy to create a ‘general report’ for each animal describing all of its treatments, tumor sizes during therapy, condition score, etc. Using SQL commands, for example, only animals which received exactly the same treatment can be selected to create experimental subgroups. The data can be simply taken for further analysis in spreadsheet systems or calculated and analyzed within our system. As an export function for Microsoft Excel (Microsoft Corporation, Redmond, WA, USA) we used PHPExcel version 1.8.0. 16 All information is stored in one database and not spread over several files, which makes it easier to evaluate the data.
Results
Easy and secure data access from any place
The login procedure using a tablet computer is easy. Computers with enclosing that can be sterilized can be used to meet the hygiene standards. The user has to scan one QR-key-code with an arbitrary QR-code scanning application. After this initial login, the user has a 12 h period with free access onto the system without the need to re-register, and after this login any animal QR-code can be scanned to jump to the landing page of the animal which displays the basic information about that particular animal. Sufficient user rights are required for this access. Therefore, the QR-codes were printed on the cardboard cards of the animal cages (Figure 1).
Easy information access with a tablet computer scanning the QR-codes of the individual animals (the enclosing can be sterilized: e.g. Innervision Technology Ltd, Medstead, Alton, UK).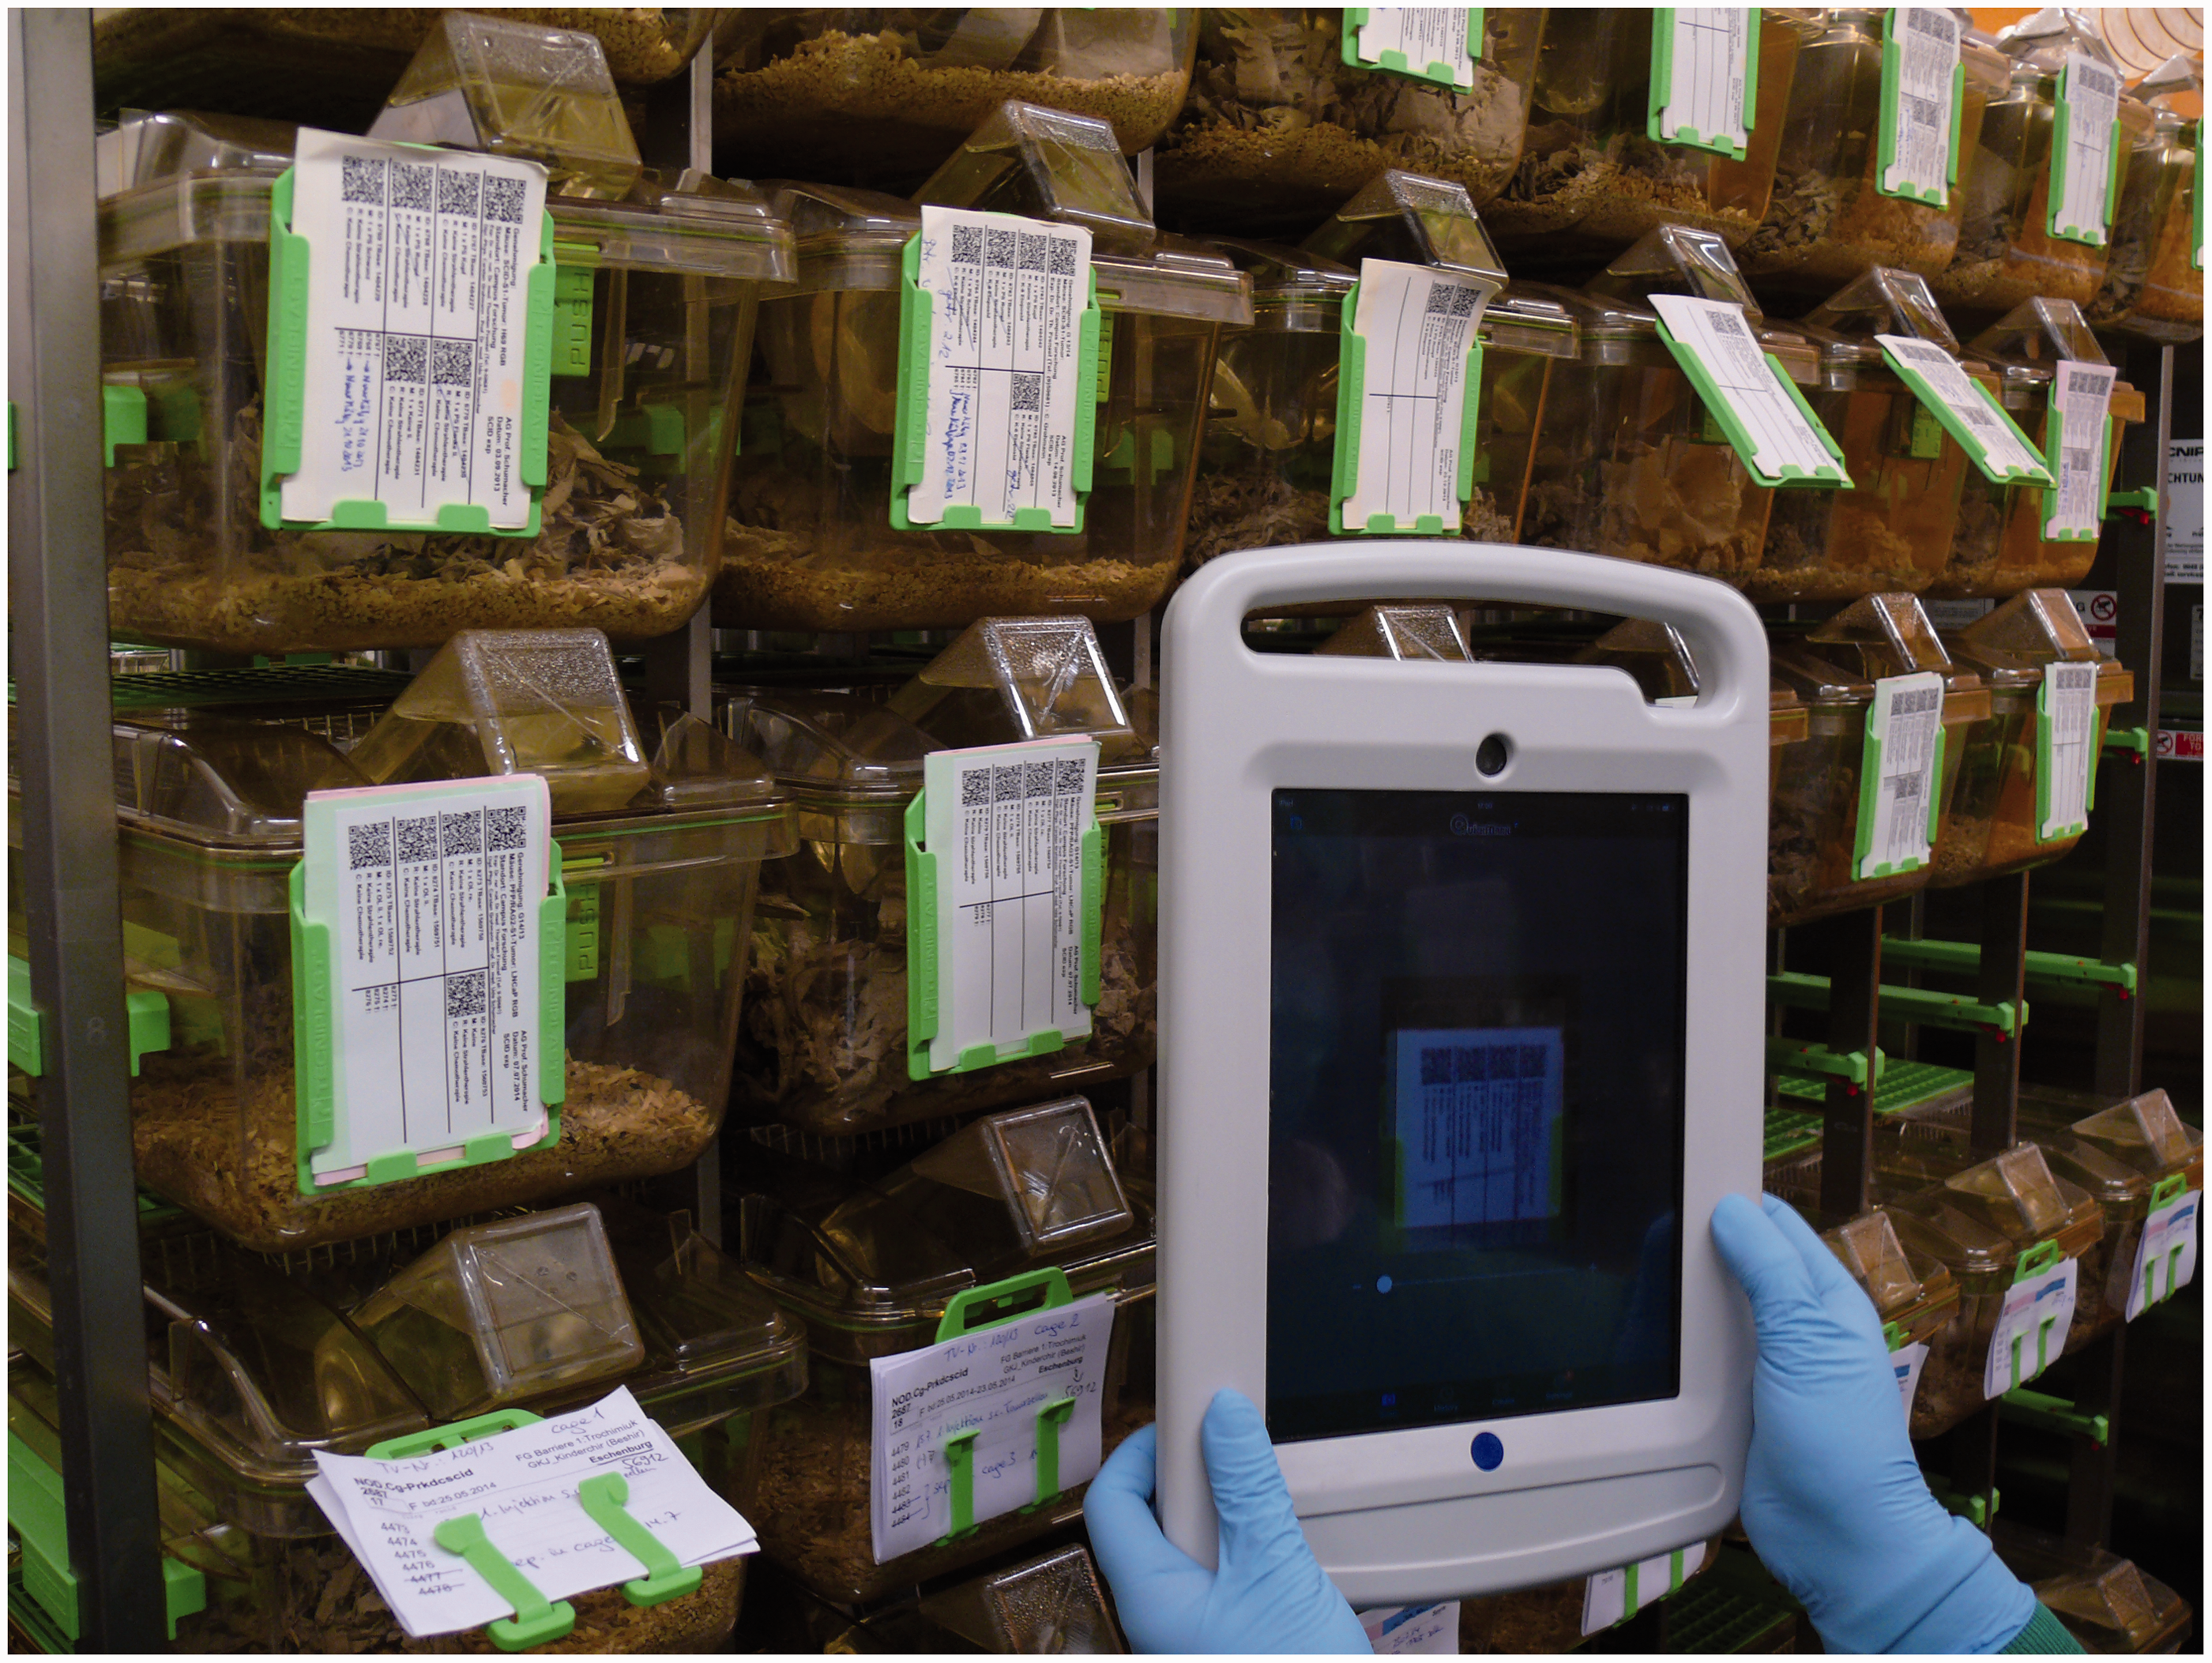
After completion of the login procedure the users have access to the functions of the monitoring system (Figure 2). The screenshot in Figure 2 demonstrates different options for selecting the animals, to apply radiation or chemotherapy, to enter the basic information of the animals, etc. using Fugue icons.
17
Main window of the database computer monitoring system with animal ward round list.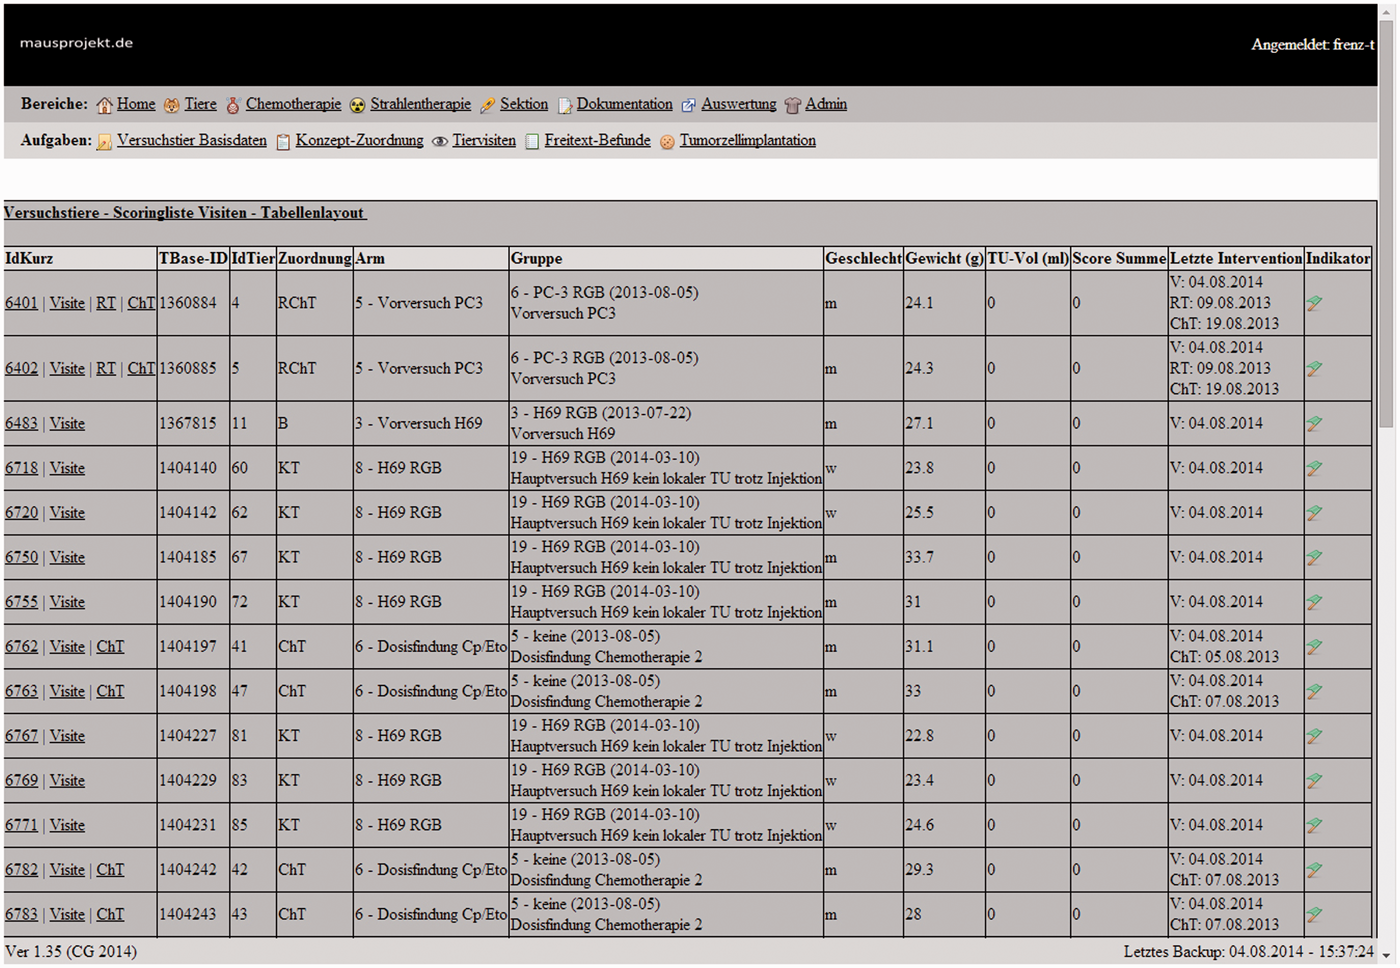
Especially for monitoring animal welfare the ‘Indikator’ column was added. A flag demonstrates the overall condition of the animal: a green flag corresponds to an ideal condition, a yellow flag indicates minor trouble and a red flag indicates the animal is approaching a critical condition. In this way it is very easy for animal caretakers to identify animals that need more attention.
Collection of all regulatory data required for the experiment
It is necessary that the names of the responsible scientist and principal investigator involved, their contact addresses, the name of the project, number of the project, genetic approval number, and specific information about the animals are printed on the cardboard cards of the animal cages (see Figure 3). The labels were created using the FPDF library version 1.7
18
and printed using a Brother QL-720NW label printer (Brother International GmbH, Bad Vilbel, Germany).
Example of a cardboard card of one animal cage with regulatory data (‘ID’ = existing short ID, ‘TBase’: ID from our hospital’s TBase system, ‘M’: method of marking, ‘R’: radiotherapy, ‘C’: chemotherapy).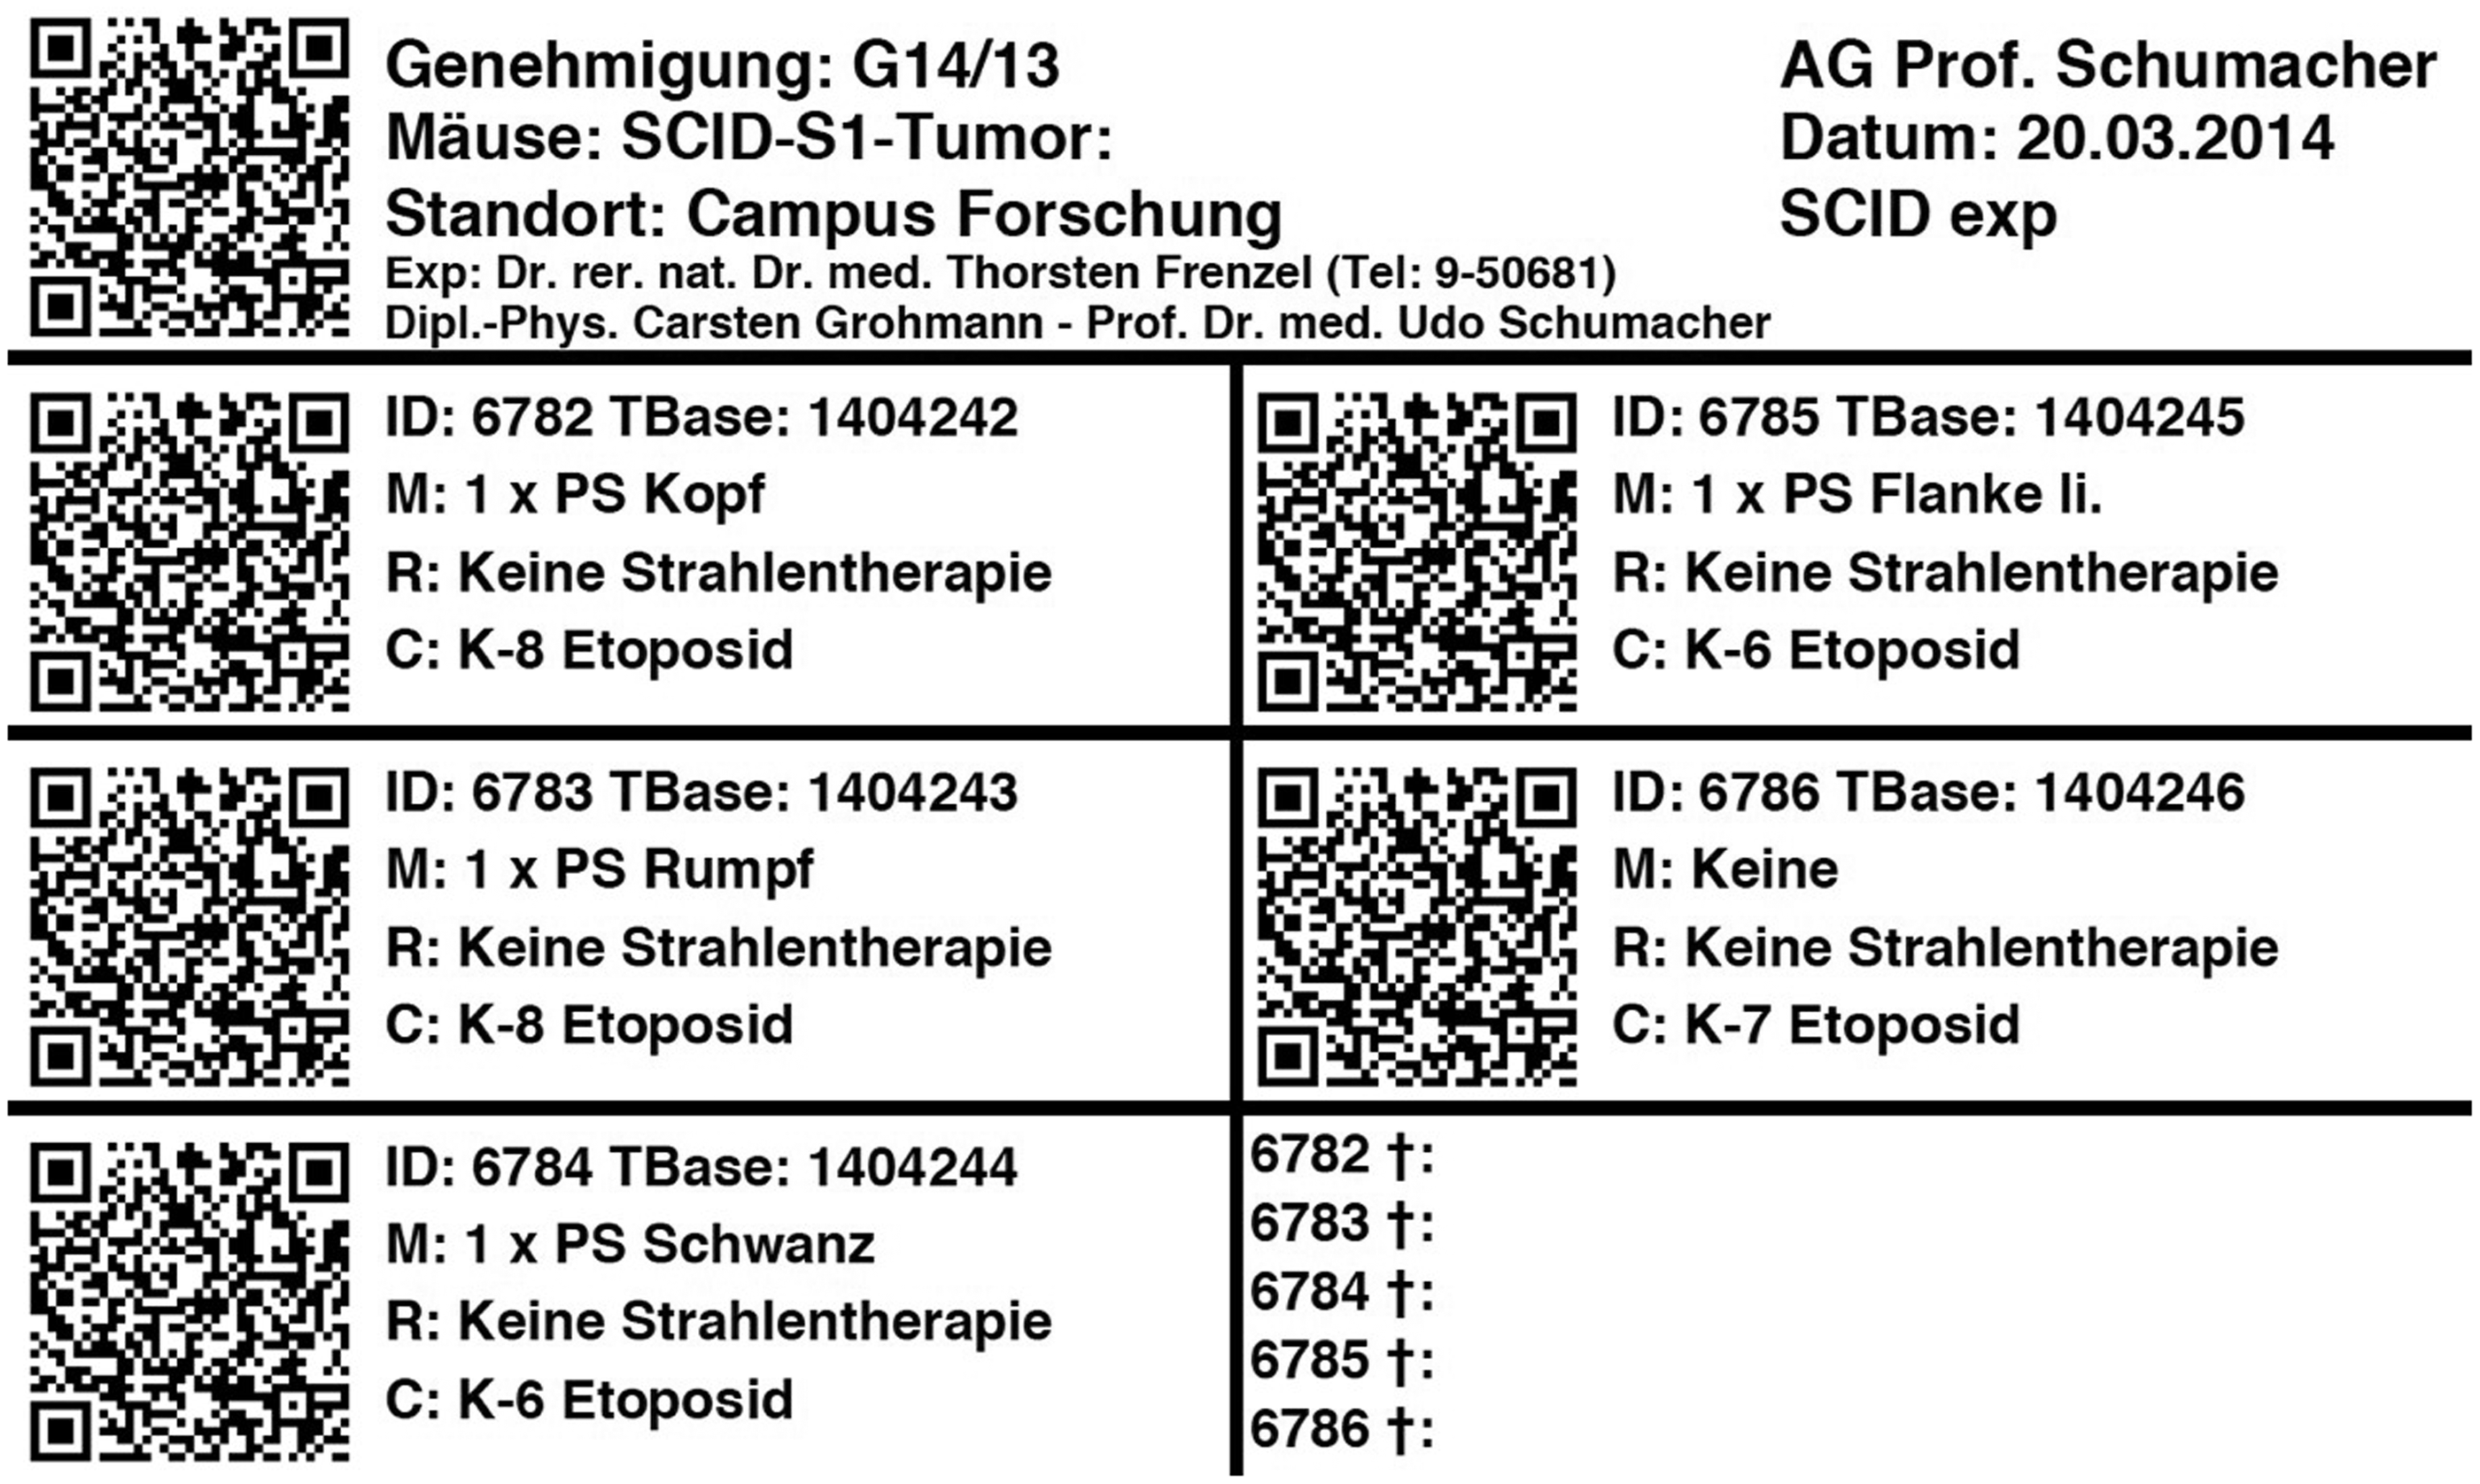
Identification of all animals and their samples
As previously explained in Figure 3 different numbers are assigned to the animals. Also various histological samples of the animal may be collected. In our example we have the short ID as well as the long but unique ID number (TBase-ID). We also had to mark our animals to allow for easy identification within the cage (‘PS’ = picric acid, ‘Kopf’ = head, ‘Rumpf’ = trunk, ‘Schwanz’ = tail, ‘Flanke’ = flank). Also abbreviations for the therapy of the animals were printed on the card (‘R’ = radiotherapy, ‘C’ = chemotherapy). There is also the traditional way of marking the day of death manually on the cardboard card.
Once all data are in the database it is very easy to print out labels for the samples of the animals like the histology wax blocks specimens (Figure 4). Or, alternatively, one can identify the probe in the database by scanning its QR-code. The ‘traditional’ code using numbers and letters is also printed on the labels, which makes it easy to use modern and traditional descriptions of the probes simultaneously.
Histology wax blocks with labels from the database which can be scanned with a QR-code scanner (shown on the right) for easy identification.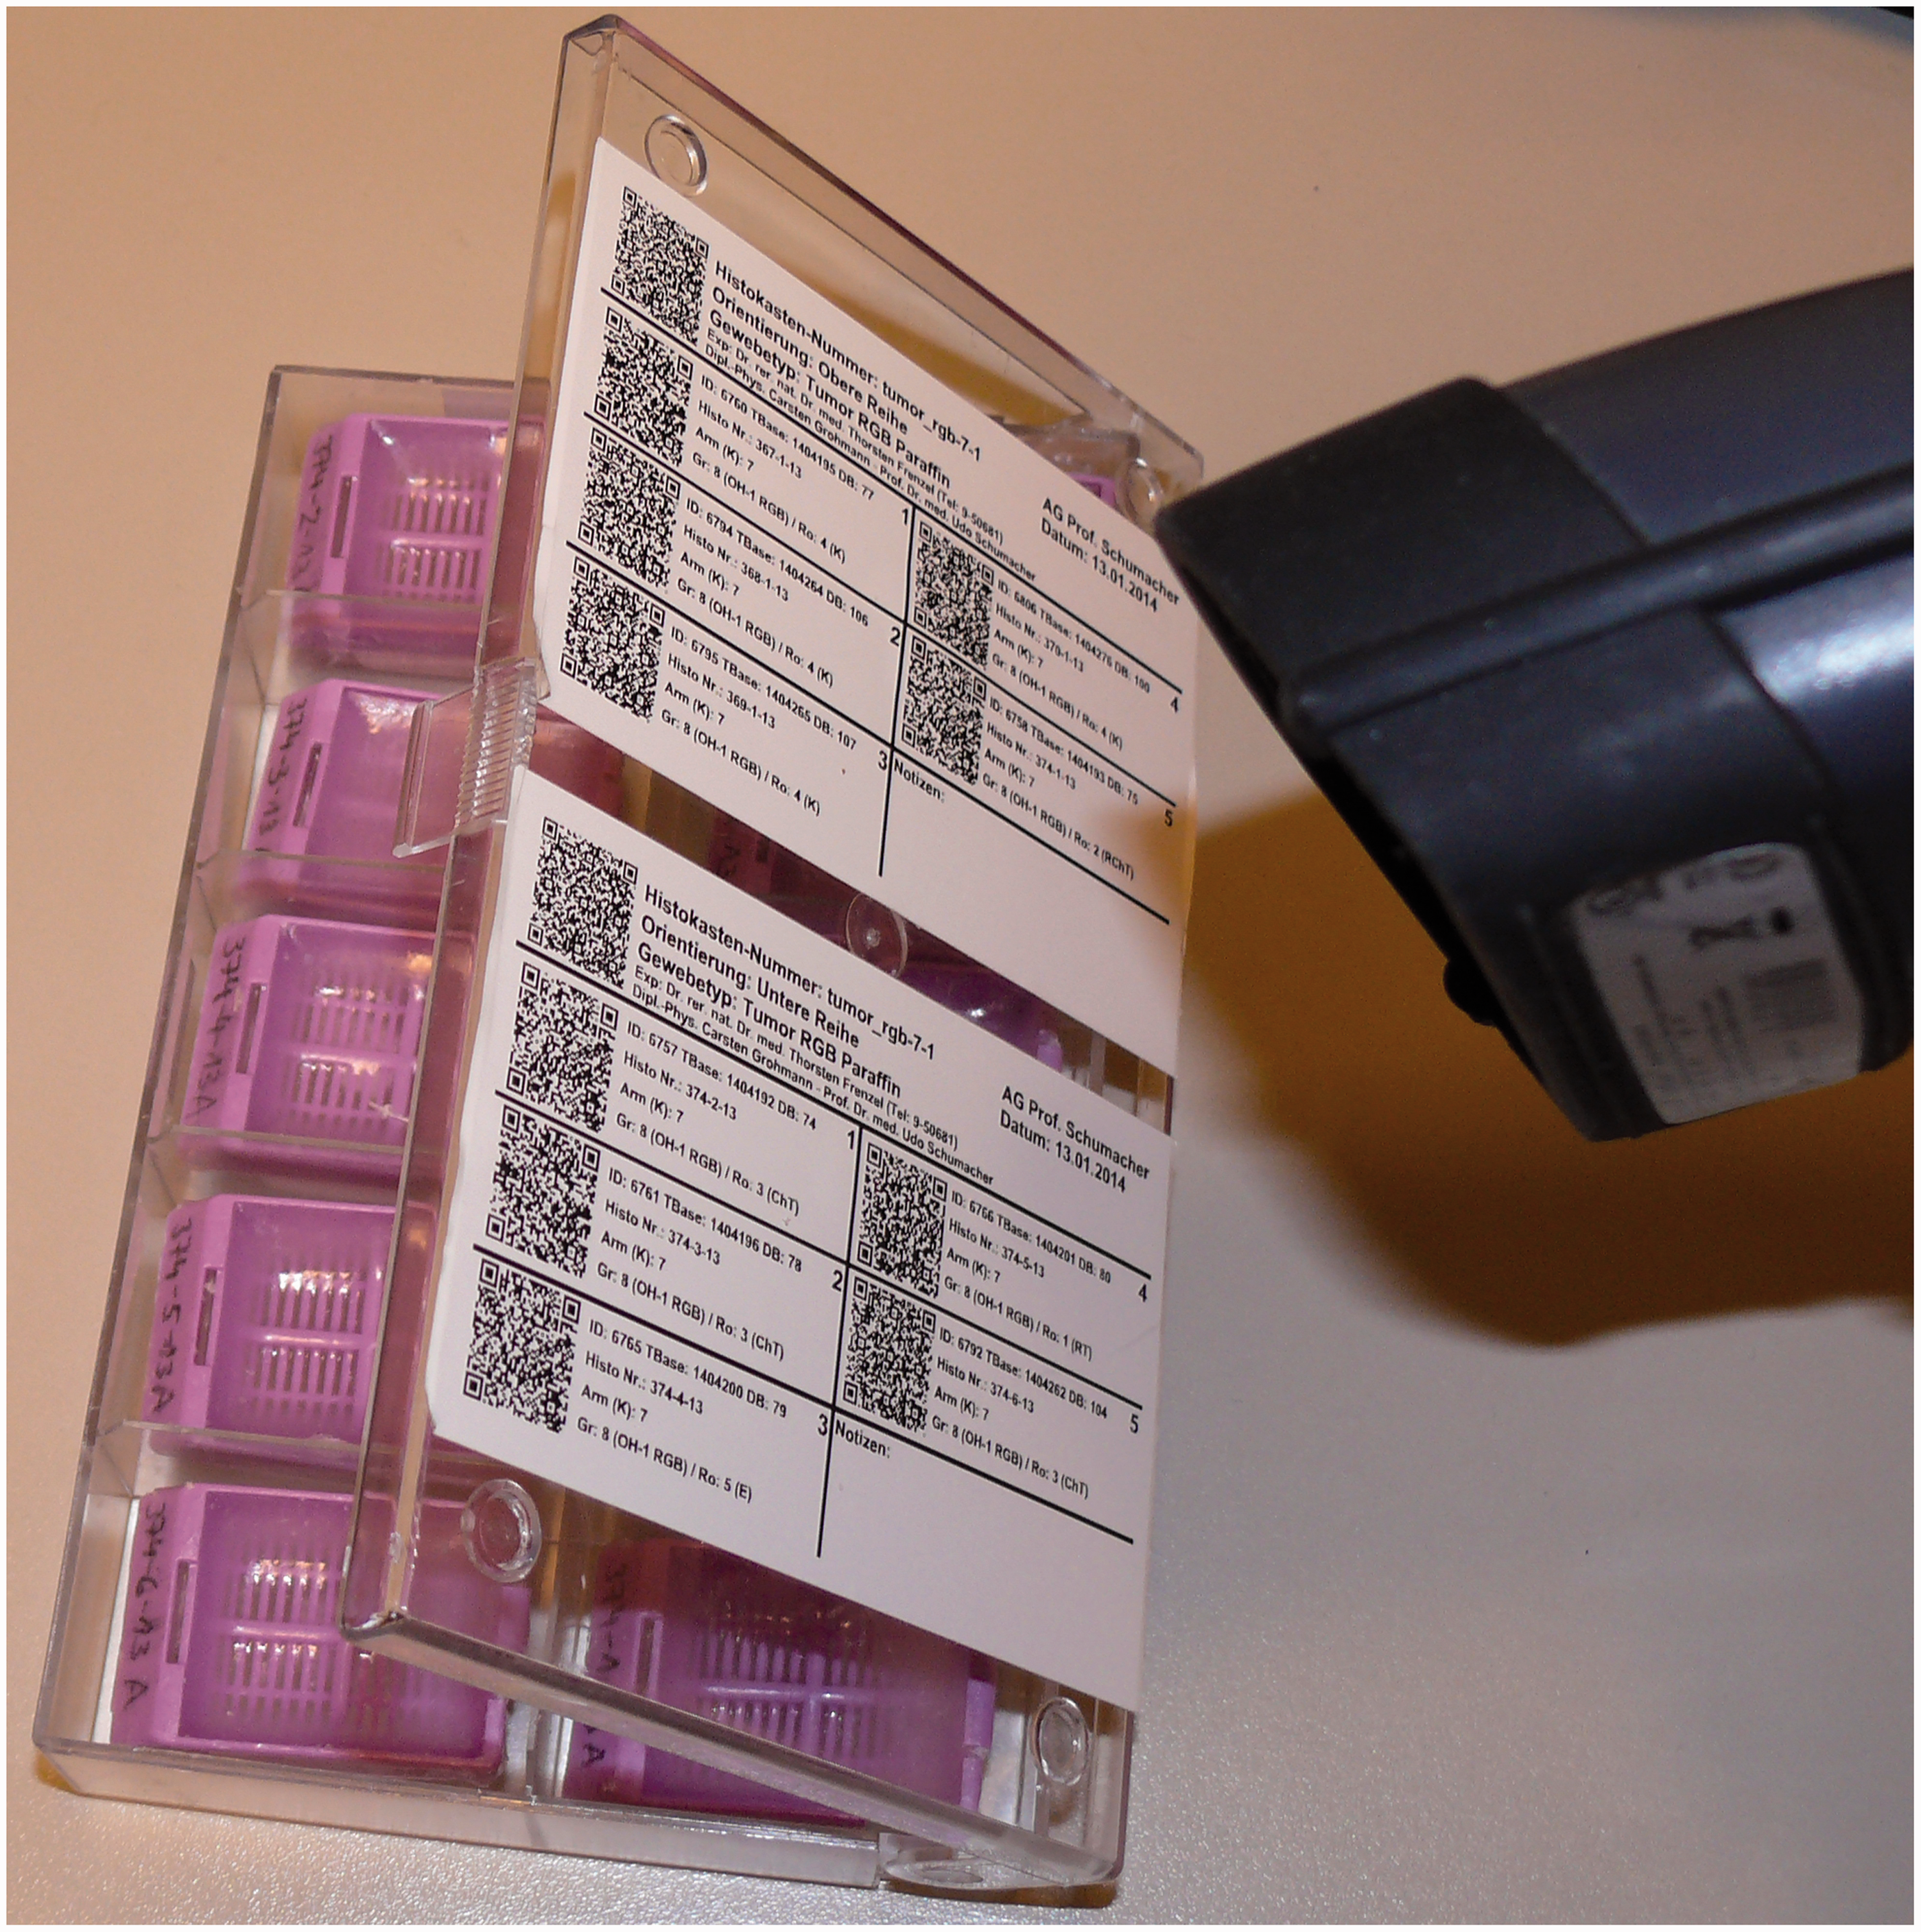
Collection of experimental data
In our experiments the radiation therapy (Figure 5) and the chemotherapy regimens used were the most important items documented. For this reason we could define radiotherapy and chemotherapy concepts with single doses and cumulative doses that were not to be exceeded (input mask not shown). In the example given in Figure 5 the animal had already received five fractions of radiotherapy (200 kV photons, single dose 10 Gy just on the tumor [planning target volume, PTV], maximum dose 50 Gy), as well as three courses of chemotherapy (docetaxel, 3 mg/ml, applied intraperitoneally). Warning messages were generated that no more radiotherapy and no more chemotherapy should be applied to the animal, which was important for its welfare.
Part of the general animal report for documentation of radiotherapy and chemotherapy applied (translated into English). d = day, PTV = planning target volume, SD = single dose, ED = maximum/end dose, KG = body weight.
Functions for the evaluation of the experimental data
With a large number of samples, the experimenters can lose track quickly. Altogether we made more than 3800 individual animal visitations documenting the weight, tumor size, and physical conditions for each of our mice. For later analysis we could create general animal reports showing the results of our therapy. As an example we exported weight curve, tumor size, and dates of radiation and chemotherapy applied to a pfp/rag2 mouse which had previously received PC3 tumor cells as a subcutaneous injection (Figure 6).
Weight curve and tumor size during radiochemotherapy of the animal. RT: radiotherapy, ChT: chemotherapy.
As can be seen in our example detailed information about weight gains or losses has been collated, along with measurements of the size of the developing tumor during radio-chemo-therapy. Additional information was also recorded such as hair loss in the radiation field and the regrowth of the hair later on. The monitoring system assisted us in monitoring the condition of the animals precisely and allowed us to notice whenever supportive therapy (e.g. additional food) was required for the animals. Animals in critical health condition were identified separately in a health condition monitoring table.
Discussion
This monitoring system became a very important tool in our mouse experiments. It is still a work-in-progress and new functions are implemented continuously based on our needs with the ongoing experiment. So far we have appreciated the value of the warning message that has prevented an overdose of radiation or chemotherapy, and which have been particularly useful. This is especially so for the display of previous animal weights when entering the actual current weights which in turn has helped to identify animals that are not doing well. Sometimes the weight loss can be less than 20% but this is already significant for animal welfare.
For more complex experiments our web-based database has an unlimited number of access points and build-in management of multiple data accesses at the same time that is far superior to conventional local small animal databases. The easy information exchange is especially important for sharing data with other groups worldwide. For this purpose options to allow or restrict access to specific data were already implemented. All actions done on the database are monitored so that any change in the data can be reconstructed. We have implemented a solid storage of the data with good retrievability. Compared with the conventional storage on paper or in EXCEL (Microsoft Corporation) files on local PCs for example, the data safety is considerably improved. It also allows for a much better documentation of the experimental conditions. In principle any data can be exported to SQL tables by creating SQL queries. Any commercial software supporting the import of SQL tables could implement the data.
In addition our database computer monitoring system has implemented multiple codes for different histological samples collected and from different animals, while using a unique identifier for all animals at the same time. We did not change the whole process to become digital. Digital components were introduced where they simplified our workflow, and ‘analogue use’ is still possible. This has made it easy to identify probes and to analyze the experimental data. It has made sense to use existing patient chart technology not only for human patients but also for animals undergoing medical experiments.
So far the database computer monitoring system is a single project solution. Everybody has to decide whether to buy a commercial software solution or to develop an in-house solution like we did for their own experiments. Questions like financial resources, human resources, possibilities for data exchange, and the cooperation of multiple research groups play an important role in choosing the appropriate system. In addition, maintenance issues have to be considered. With our ideas and experience we hope to help other researchers design their own specific databases. The requirements are: disk space on a web server running MySQL database, PHP, nginx, and SQL tools such as ‘MySQL’ or other equivalent programming tools. Of course frameworks like CakePHP 19 could be used. However, this would not simplify matters for other groups building similar applications as specific software functions like calculations, implementation of databases, growth curves, EXCEL files, QR-codes, etc. still have to be programmed. The flexibility and structure of any database may be limited by these frameworks.
In our case an experienced student could set up all the software within one year while also executing a part of the small animal experiments. The software tools used were free, and the only expenses involved a web-based server (e.g. Strato 20 ). On the one hand this allowed for maximum flexibility and very little expense, but on the other hand questions of long-term maintenance are still unsolved. The definition of the database is the most important job which can also affect other scientific areas other than cancer research. In an ideal case all personnel involved in a research project will add database items so that a centralized solution for an animal facility can become possible.
Should this article arouse interest, then this would be a motivation to continue the development of this project and to share our experience with other researchers as well. Individual requests on technical details like database schema and PHP applications are welcome.
Footnotes
Funding and Acknowledgements
This project was supported by the ‘Deutsche Krebshilfe Mildred-Scheel-Doktorandenprogramm’ and the ‘UCCH 1/3-Stipendium’. Open source software under different open source licensed was used: nginx, PHP, MySQL, FPDF, phpqrcode, PHPExcel. Fugue icons were also used. We thank Dr. Wikhart Reip (UKE, Hamburg, Germany) for providing us with an enclosing for a tablet computer that can be sterilized.
Declaration of conflicting interests
The authors declare that there is no conflict of interest.