
Abstract
Cardiac perfusion studies using computed tomography are a common tool in clinical practice. Recent technical advances and the availability of dedicated small animal scanners allow the transfer of these techniques to the preclinical sector in general and to mouse models of cardiac diseases in particular. This necessitates new requirements for contrast injection techniques as a rapid transport of contrast media from the intravenous access to the animal heart. Clinical contrast agents containing high iodine concentrations are used within small animal studies although they exhibit a high viscosity which might limit their transport within the vasculature. The authors provide a comparison of the transport of contrast media following an injection into the lateral tail vein and an injection into the retrobulbar sinus and discuss the anatomy involved. The temporal evolution of a contrast bolus and its in vivo distribution is visualized. It is demonstrated that injecting contrast agents into the lateral tail vein of mice results in a retrograde blood flow to the liver veins and therefore does not deliver a detectable contrast bolus to the heart, and thus it cannot be used for cardiac perfusion studies. By contrast, boli injected into the retrobulbar sinus are rapidly transported to the heart and provide ventricular contrast enabling perfusion studies similar to those in human patients. The results demonstrate that an injection into the retrobulbar sinus is superior to an injection into the lateral tail vein for the delivery of contrast boli to the animal heart, while all drawbacks of an injection into the lateral tail vein are overcome.
Cardiac perfusion examinations in human patients using computed tomography (CT) or magnetic resonance imaging (MRI) are a common tool in clinical practice. In the case of preclinical research in general and in small rodents, in particular, cardiac perfusion imaging is difficult due to rapid heart rates of up to 500 beats per minute (bpm) and respiratory rates of up to 300 respirations per minute (rpm) in mice. As a consequence, this creates high demands on temporal and spatial resolutions. Recent technical advances in detector technology and image reconstruction algorithms indicate that cardiac perfusion imaging in small rodents is possible, with the newest generation hardware allowing for the evaluation of animal models of cardiac diseases in a preclinical environment using dedicated small animal scanners.1–3 The following considerations will be restricted to mice due to their extensive usage in preclinical research and the availability of a multitude of cardiac disease models in these animals.4–7 However, a direct translation of clinical scan protocols into preclinical practice is difficult due to the contrast agents used. These clinical contrast agents, usually containing very high concentrations of gadolinium or iodine to increase the signal during imaging and to minimize the injected volume, exhibit very high viscosities of up to 8.7 mPa·s. 8 These viscosities are well tolerated by human subjects but might cause severe difficulties if applied to small animals with much smaller vessels. A dilution of the clinical contrast agents used would reduce their viscosity with the drawback of a reduction of signal intensity during imaging and is thus not desired. Furthermore, cardiac examinations require the transport of a defined contrast agent bolus to the heart without significant broadening. This requires the development of novel contrast agents as well as the evaluation of already known injection routes to meet the requirements of these new applications. Several intravenous access routes in small rodents have already been reported in the literature. In particular, injections into the lateral tail vein, 9 the external jugular vein, 10 and the retrobulbar sinus 11 have been described. Recent works provide an evaluation of the lateral tail vein as an intravenous access for radionuclides in positron emission tomography (PET). 12 A similar study was performed using an injection of tracers into the retrobulbar sinus. 13 Other authors have compared these two injection ports with respect to drug delivery over five days. 14 They conclude that both injection sites are similarly effective with regard to drug distribution and further emphasize that the retrobulbar injection seems less stressful to the animals than a tail vein injection. To date no study has evaluated the capabilities of the mentioned ports for the injection of clinical contrast agents. Furthermore, the transport of an injected contrast agent bolus to the heart has never been evaluated in small rodents before. The purpose of this prospective study is to evaluate the vasculature involved in the injection of clinical contrast media into the lateral tail vein and the retrobulbar sinus by means of a contrast-enhanced, high-resolution micro-computed tomography (micro-CT). The in vivo distribution following an injection into these ports will be visualized using a high-speed flat detector CT system and a quantitative comparison of the bolus behavior after injection in terms of reproducibility of both injection ports is provided. Another frequently used injection into the external jugular vein is not being considered, as a cannulation of this vein requires an invasive procedure and consequently might not be tolerated by animals with severe cardiac diseases. Recent studies also indicate that a contrast bolus injected into the external jugular vein might cause artifacts during imaging, caused particularly by the proximity of the needle that cannot be corrected during image reconstruction. 15
Materials and methods
Experimental design and animal handling
All experimental procedures were registered with the local authorities (Regierungspräsidium Karlsruhe, 35-9185.81/G-6/12). The animals were monitored according to the Federation of European Laboratory Animal Science Associations (FELASA) recommendations. 16 Thirty C57BL/6J mice with a mean body mass of 22 ± 3 g were used. The C57BL/6J strain was originally purchased from Charles River (Sulzfeld, Germany), and then bred in-house for at least eight generations. The animals were housed under barrier conditions with controlled environmental parameters, i.e. temperature (22 ± 2℃), humidity (55 ± 10%) and an air exchange rate of 12–15 changes per hour. A light–dark cycle of 14:10 h was followed with lights on at 06:00 h. The animals were housed in groups of five to six mice in polyphenylsulfone cages with an area of 435 cm2 (Type 1 superlong; Tecniplast, Hohenpreisen, Germany). The mice received an autoclaved standard diet (standard diet 3437; Kliba Nafag, Kaiseraugst, Switzerland) and autoclaved tap water ad libitum. The cages were enriched with wood-wool (Abedd, Lünen, Germany).
To assess the underlying anatomy using high resolution micro-CT scans all the mice (nanatomy = 10) were anesthetized via an intraperitoneal injection of a mixed solution of ketamine hydrochloride (100 mg/kg) and xylazine (14 mg/kg). A catheter was inserted into the lateral tail vein of the animals. This catheter was assembled from the tip of a G30 needle and a polyethylene tube with an appropriate diameter. The catheter was used to deliver 140 µL of a radiopaque, liposomal blood pool contrast agent (ExiTron nano 12000; Milteny Biotec GmbH, Bergisch Gladbach, Germany and nanoPET Pharma GmbH, Berlin, Germany) with a prolonged blood circulation time of more than 2 h. To ensure a complete transport of this contrast agent to the vasculature of the animals a chaser consisting of a sodium chloride solution with a volume of 10 µL was administered prior to the removal of the catheter.
The animals used for the retrobulbar injection (nretrobulbar = 10) were subcutaneously administered with metamizol (200 mg/kg, about 150 µL/mouse) prior to all examinations. The mice were placed in a plexiglas box and anesthesized by continuous inhalation of isoflurane (0.5–1.5 vol % in oxygen). As soon as the desired depth of anesthesia was reached, indicated by an absence of the corneal reflex and the toe reflex, a puncture of the retrobulbar sinus was performed using a catheter identical to the one described before. The process of puncture was performed as described previously. 11 The insertion of the catheter into the medial corner of the bulbus was considered to be successful as soon as a blood reflux into the catheter tube became visible. To prevent dehydration of the cornea, the eyes were covered with an eye ointment.
The mice for the tail vein injection (ntail = 10) were prepared as described above. A catheter was placed into the lateral tail vein. A correct placement of this catheter was assumed as soon as a blood reflux in the catheter tube was observed.
The injection of the contrast agent bolus (Ultravist 300; Bayer Schering Pharma, Berlin, Germany) with a volume of 20 µL was administered using a dedicated micro-injection pump assembled at the German Cancer Research Center (DKFZ). This computer-controlled pump allowed for a precise administration of small volumes down to 2 µL with a standard deviation between consecutive injections of less than 2 µL. Note that repetitive injections in the lateral tail vein and the retrobulbar sinus were performed during the experiments to assess the reproducibility of the contrast media flow.
The vital signals of the animals during all examinations, i.e. the anatomical and perfusion studies, were recorded using a dedicated small animal monitoring system (SA Instruments, Stony Brook, NY, USA). In particular, the electrocardiogram (ECG) was acquired using small animal electrodes attached to the paws of the mice, and the breathing signal was derived using a pressure sensor beneath the animals. The mice showed a heart rate of 325 ± 37 bpm and a respiratory rate of 190 ± 21 rpm indicating that the animals had a low stress level during the measurements. These signals were used to dynamically adjust the depth of anesthesia and to prevent any pain or discomfort. Furthermore the mice were placed on a heating pad during all experiments to ensure a body temperature of about 34℃. Following the examinations all animals were sacrificed in deep anesthesia by cervical dislocation.
Image acquisition
To acquire images for this study two different imaging systems were utilized. Static images of the anatomy and the vasculature, i.e. group nanatomy, were acquired using a dedicated cone beam, in vivo small animal imaging scanner (TomoScope Synergy Twin; CT Imaging, Erlangen, Germany). This scanner provided a source to isocenter distance of 170 mm and an isocenter to detector distance of 39 mm. 17 The detector’s resolution was 1024 × 1024 pixels, each of size 50 µm. This allowed for a theoretical spatial resolution in the center of rotation of about 40 µm which was sufficient to easily identify even small vessels. The scan protocol used acquired 7200 projections within 10 consecutive rotations over 5 min. Thus, the scanner rotated at a speed of 6°/s while providing a frame rate of 12 projections per second. All the scans were recorded using a tube voltage of 40 kV and a tube current of 1.0 mA. The dose was measured as 500 mGy using an ionization chamber (PWT–UNIDOS equipped with a CT Chamber Type 300009; PTW, Freiburg, Germany). This dose was far below the lethal whole body radiation dose (LD50) for mice of 5–7 Gy and far below to what is typically administered in high resolution micro-CT examinations. 18
The second scanner used was a VolumeCT prototype (Siemens Healthcare, Forchheim, Germany) consisting of a standard CT gantry equipped with a flat detector. 19 This flat detector’s resolution with its CsI scintillator was 1024 × 768 pixels in 2 × 2 binning mode, each of size 388 µm allowing for a theoretical spatial resolution in the center of rotation of 238 µm. To increase the detector frame rate from 30 to 100 projections per second, only data in the region of 1024 × 192 pixels in the detector center were produced. The high read-out rate and acceptable spatial resolution render this system the perfect choice for imaging the temporal evolution of a contrast agent bolus in vivo with the highest temporal resolution. The X-ray source providing a focal spot size of about 400 µm was mounted at a distance of 570 mm from the isocenter, and the flat panel was mounted at a distance of 360 mm from the isocenter. A digital subtraction angiography (DSA) scan in our case consisted of 8000 projections acquired within 80 s. The appropriate dose for a DSA was estimated as 50 mGy using an ionization chamber (PWT–UNIDOS equipped with the CT Chamber Type 300009).
Results
Anatomy
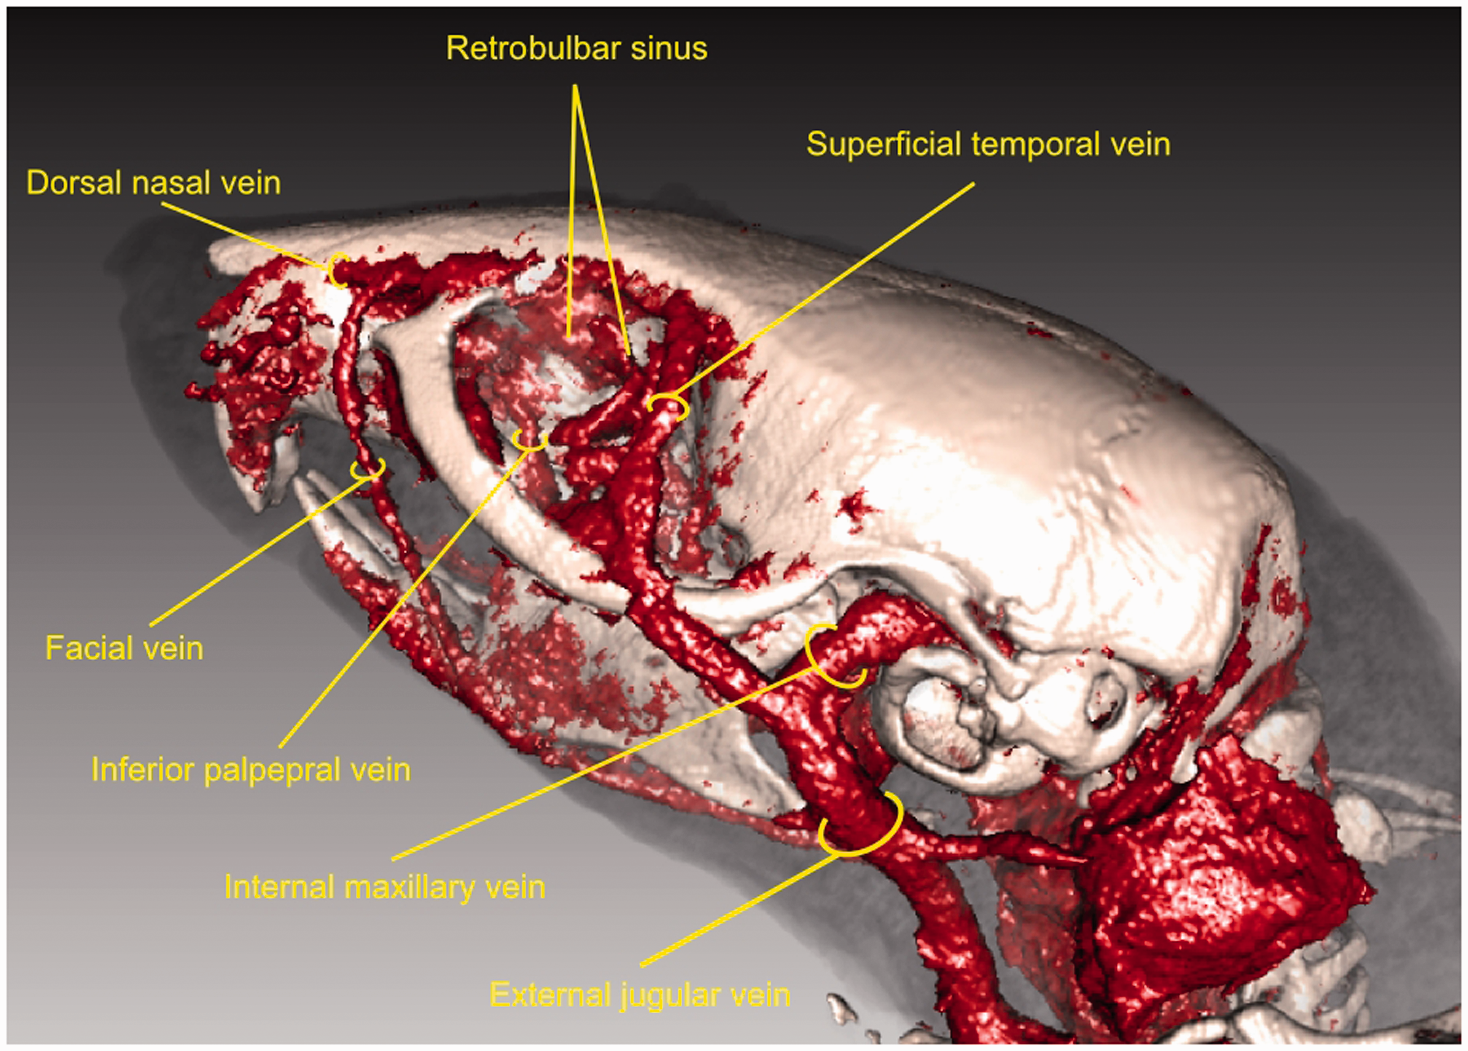
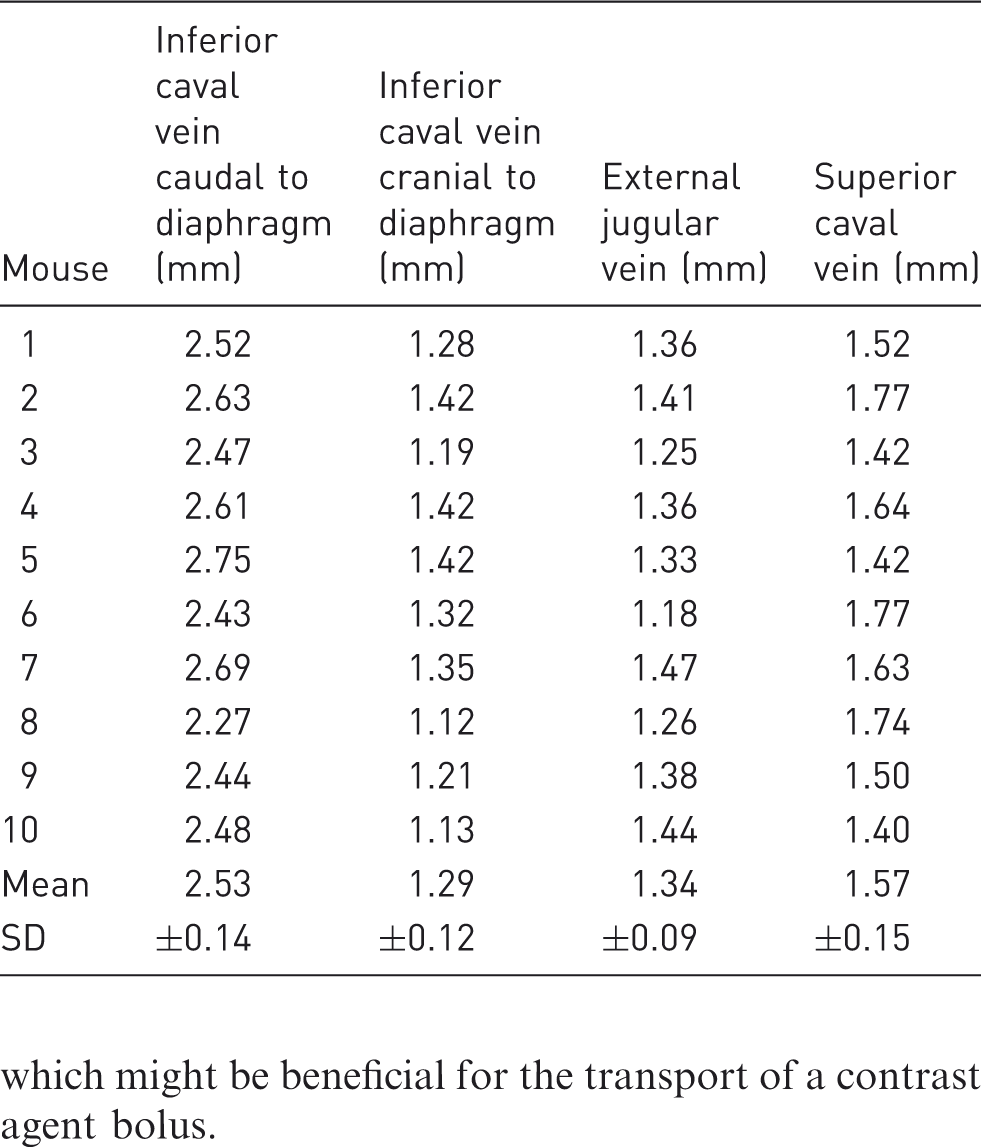
Contrast media injected into the lateral tail vein was transported into the middle caudal vein which merges with the left and right external iliac veins, respectively, forming the inferior caval vein. This major vessel drains deoxygenated blood from the lower part of the body to the right atrium as shown by the high-resolution, contrast-enhanced micro-CT scan in Figure 1a. Contributing veins from the kidneys and the liver are clearly visible in the figure. The course of this major vessel is further illustrated in a photograph of a dissected mouse in Figure 1b. Note that the digestive organs, the liver and the lungs have been removed. The heart was further flipped to the right hemibody to emphasize the connection between the inferior caval vein and the heart. Before entering the right atrium the inferior caval vein penetrates the diaphragm whose central tendon is required to keep the vessel open. As can be seen from Figures 1a and 1b the diameter of the inferior caval vein caudal to the diaphragm is significantly larger than the diameter cranial to the diaphragm. This is quantified in Table 1. The table shows the diameter of the inferior caval vein caudal and cranial to the diaphragm for all 10 mice undergoing the anatomical studies measured by micro-CT scans. The caudal diameter was obtained by the height of the last rib and the cranial diameter approximately halfway between the diaphragm and the right atrium. The caudal diameter of the inferior caval vein was 2.53 mm on average with a standard deviation of 0.14 mm, and the cranial diameter was 1.29 mm on average with a standard deviation of 0.12 mm, as shown in Table 1. Thus, the diameter of the inferior caval vein was seen to be significantly reduced as soon as the vessel passes the diaphragm, which consequently might affect the flow of viscous contrast media injected into the lateral tail vein. Figure 2 shows a volume rendering based on a contrast-enhanced micro-CT scan of a mouse skull and its vasculature. As can be seen in the figure, contrast media injected into the retrobulbar sinus was delivered to the heart from the superficial temporal vein, the inferior palpebral vein, and the ocular angle vein to the external jugular vein. These vessels merge to the subclavian vein and form the left and right superior caval veins, respectively. Table 1 further shows the average diameters of the external jugular vein and the superior caval vein for all 10 mice undergoing the high-resolution micro-CT scans. The average diameter of the external jugular vein was 1.34 mm with a standard deviation of 0.09 mm. The average diameter of the superior caval vein was 1.57 mm with a standard deviation of 0.15 mm. Thus, the diameter of the vessels participating in the transport of a contrast agent bolus injected into the retrobulbar sinus increased with diminishing distance to the heart, which might be beneficial for the transport of a contrast agent bolus.
Curved multiplanar reformation based on a contrast-enhanced micro-computed tomography scan showing the inferior caval vein in (a) and a corresponding dissection in (b). The position of the diaphragm is marked with a dashed line. Volume rendering of a contrast-enhanced micro-computed tomography scan of a mouse showing the major vessels participating in the transport of contrast media injected into the retrobulbar sinus. The diameters of the inferior caval vein caudal and cranial to the diaphragm, the diameters of the external jugular vein and the superior caval vein measured in high-resolution, contrast-enhanced micro-computed tomography scans.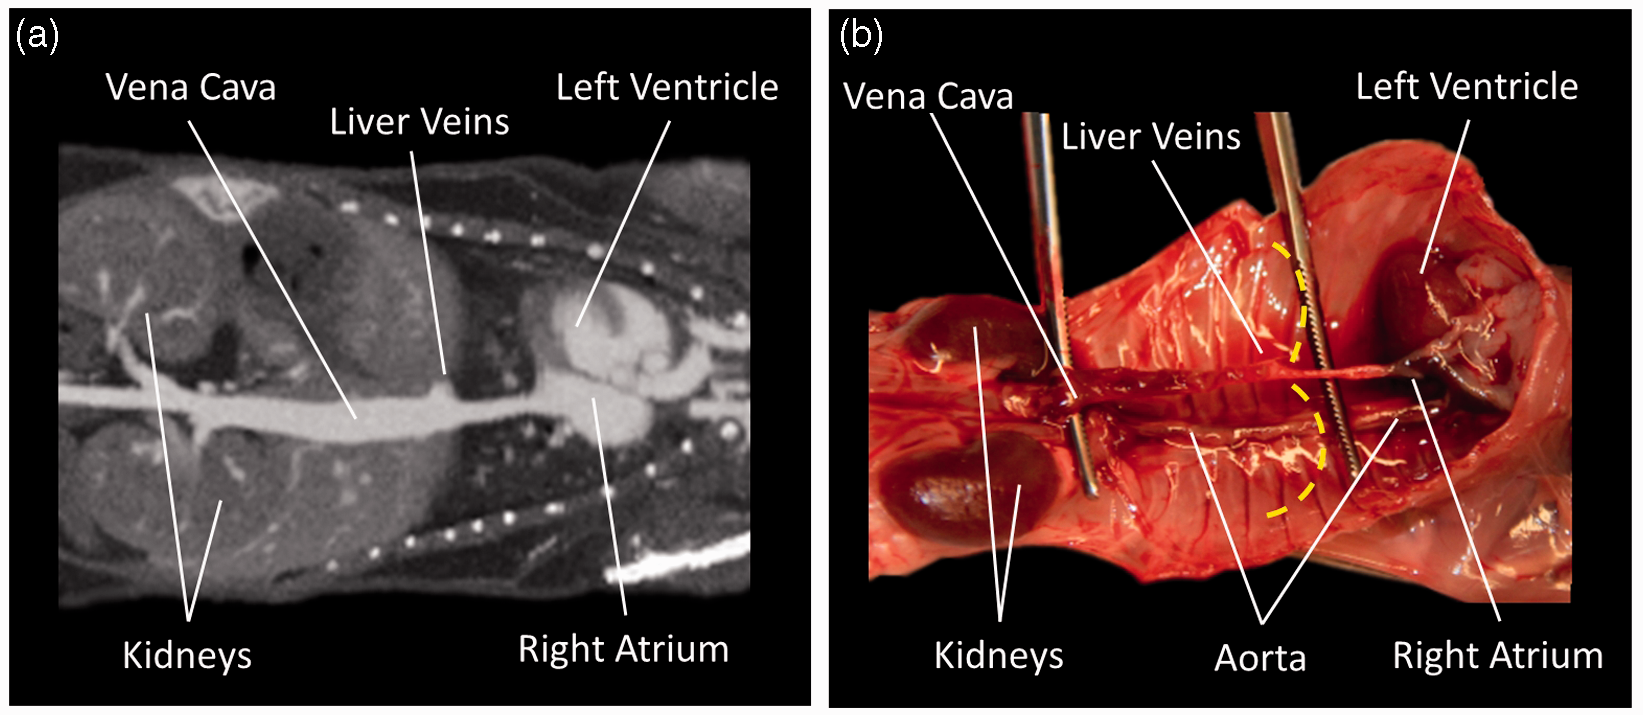
In vivo distribution
A good example of the in vivo distribution of a contrast agent bolus with a volume of 20 µL injected into the lateral tail vein and the retrobulbar sinus, respectively, is shown for a single mouse in Figure 3. The figure shows a DSA, i.e. a temporal bolus evolution, in a dorsoventral direction with time intervals of 0.5 s.
20
A bolus injected into the lateral tail vein ascended the inferior caval vein and arrived in the right ventricle about 0.5 s to 1.0 s after injection. It was transported into the pulmonary circulation, as can be seen by a contrast enhancement of the lungs after about 1.0 s. The contrast agent bolus was transported into the left ventricle and the body circulation. However, great parts of the bolus seemed to be located below the diaphragm as could be seen by a hyperenhancement of this region during the complete time of image acquisition, as shown in Figure 3. This indicates that the bolus was dissolved below the diaphragm which it cannot immediately pass due to the reduced diameter of the inferior caval vein cranial to the diaphragm. This assumption is further supported by the fact that a single ventricle can never be clearly distinguished from the surrounding lung tissue during image acquisition, indicating that only small parts of the bolus were located in the heart at a given time-step, and a contrast sufficient for imaging cannot be delivered. This observation was reproducible for all 10 mice undergoing a tail vein injection. A bolus injected into the retrobulbar sinus entered the external jugular vein less than 0.5 s after injection. It was further transported into the right ventricle and entered the pulmonary circulation, as could be seen by an enhancement of the lungs. It further entered the left ventricle and was transported into the body as could be seen by an enhancement of the aorta in Figure 3. The bolus was completely transported to the body circulation as could be seen by a rapid decay of contrast in the heart and lungs after about 3 s. Furthermore, the left and right ventricles could be clearly distinguished from the surrounding, contrast-enhanced lung tissue after 1.0 s and 2.0 s, respectively. This indicates that the bolus, in contrast to an injection into the lateral tail vein, was not dissolved during its transport to the heart and was not significantly dissolved due to its passage of the pulmonary circulation, and thus provided sufficient contrast for imaging.
Digital subtraction angiography of a bolus injected into the lateral tail vein (top) and the retrobulbar sinus (bottom). The arrows indicate the positions of the regions of interest described in the section reproducibility and in Figure 4.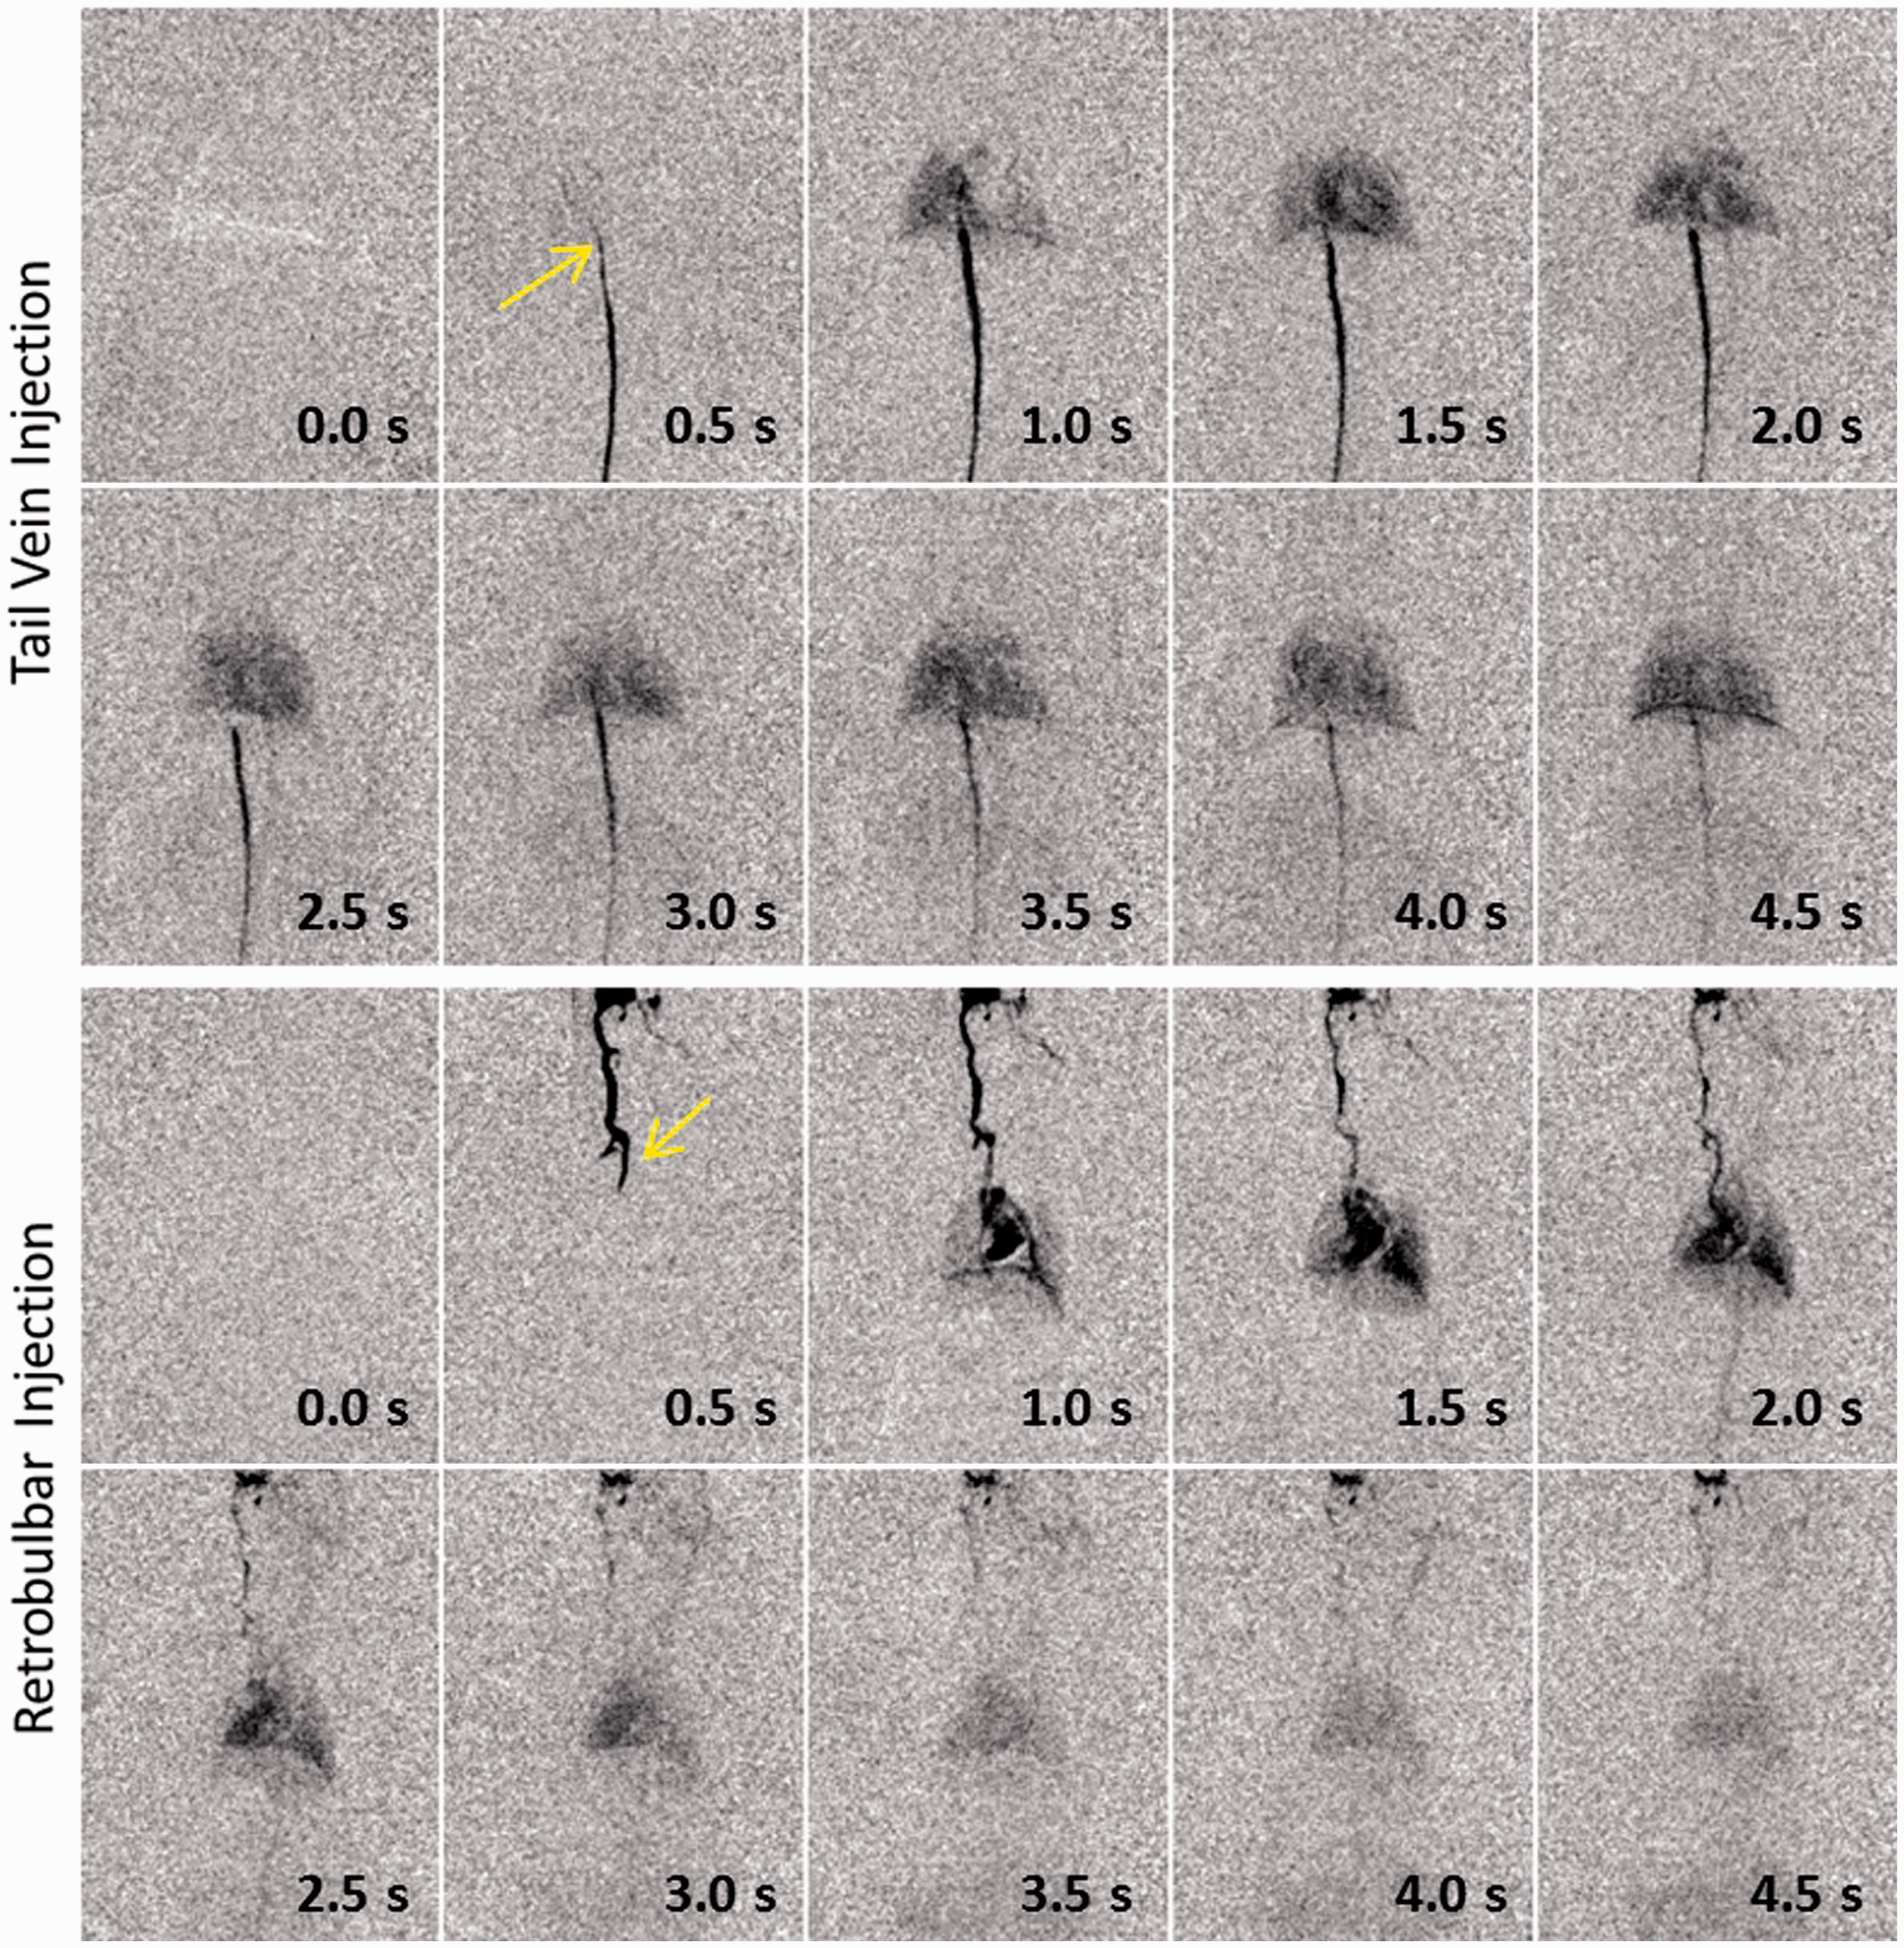
Reproducibility
To assess the reproducibility of an injection into the lateral tail vein and the retrobulbar sinus with regard to multiple, consecutive injections into the same animal, regions of interest (ROIs) in the DSA images were placed in the inferior caval vein below the diaphragm and the external jugular vein, respectively. The positions of these regions are indicated by arrows in Figure 3. The detector signals in these ROIs as a function of time were recorded and averaged over seven consecutive injections per mouse. The resulting time-signal curves are shown in red in Figure 4 for a single mouse in each case, and were normalized to a maximum signal intensity of one to ease interpretation. Figure 4 further shows the corresponding standard deviations in blue estimated from the seven measurements in each time-step. As can be seen in the figure, the bolus injection was initiated about 6 s after the recording started. The bolus arrived at the ROIs and resulted in an immediate rise to the maximum signal intensity in both cases. The signal in the external jugular vein following a retrobulbar injection exhibited a nearly exponential decay afterwards and reached the baseline after approximately 16 s. The signal decayed to half of its maximum only 1 s after the maximum signal intensity was measured. By contrast, a bolus injected into the lateral tail vein was significantly broadened below the diaphragm as shown in Figure 4. In particular, the contrast did not reduce to the baseline within the 16 s shown. Furthermore, the signal decayed to half of its maximum intensity after about 3 s, which further illustrates the significant broadening of the bolus. These quantitative results correspond well to what was qualitatively demonstrated in the DSA images (see Figure 3). The standard deviations calculated from the seven consecutive injections show that both injection sites provide good reproducibility, even with several consecutive injections.
Time-signal plots for a region of interest located in the inferior caval vein below the diaphragm (left) and in the external jugular vein (right).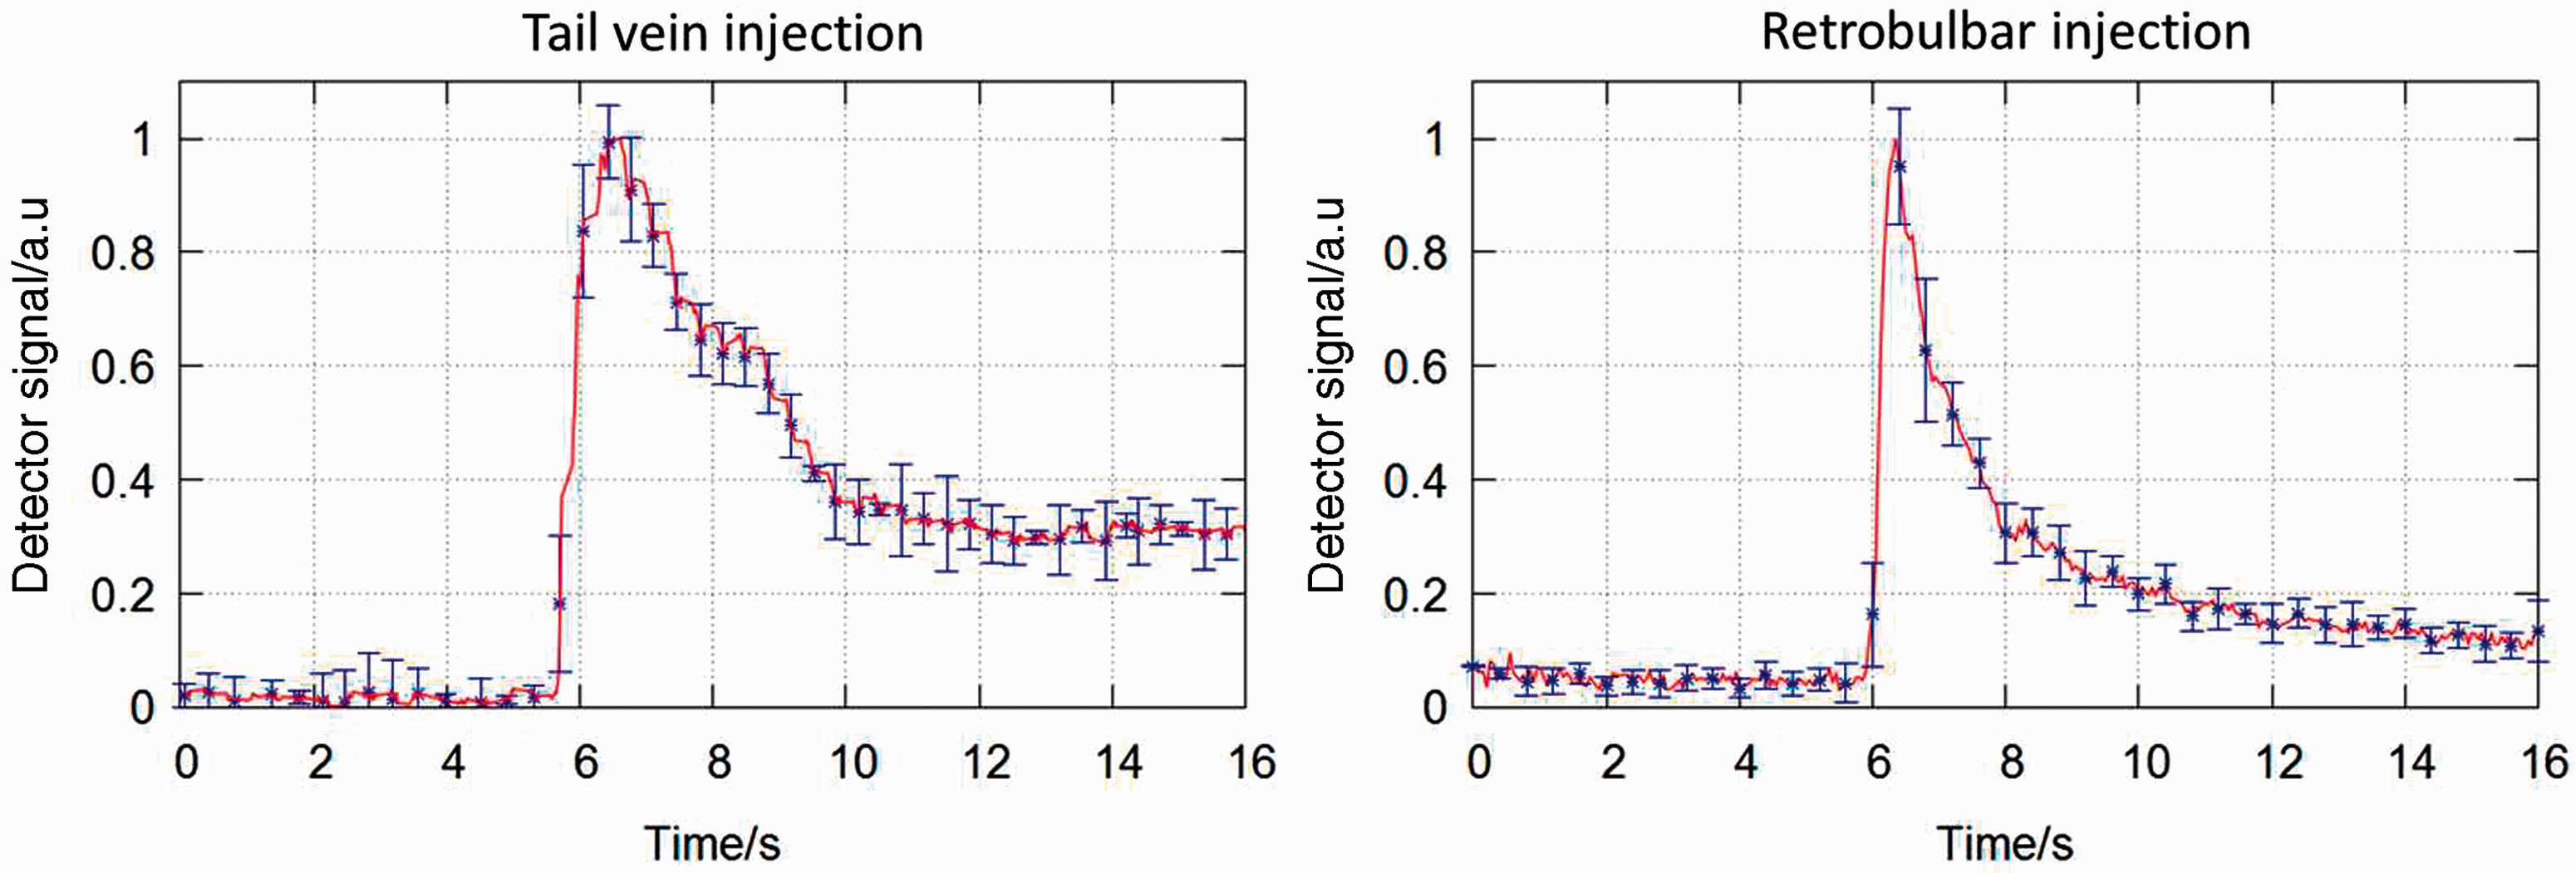
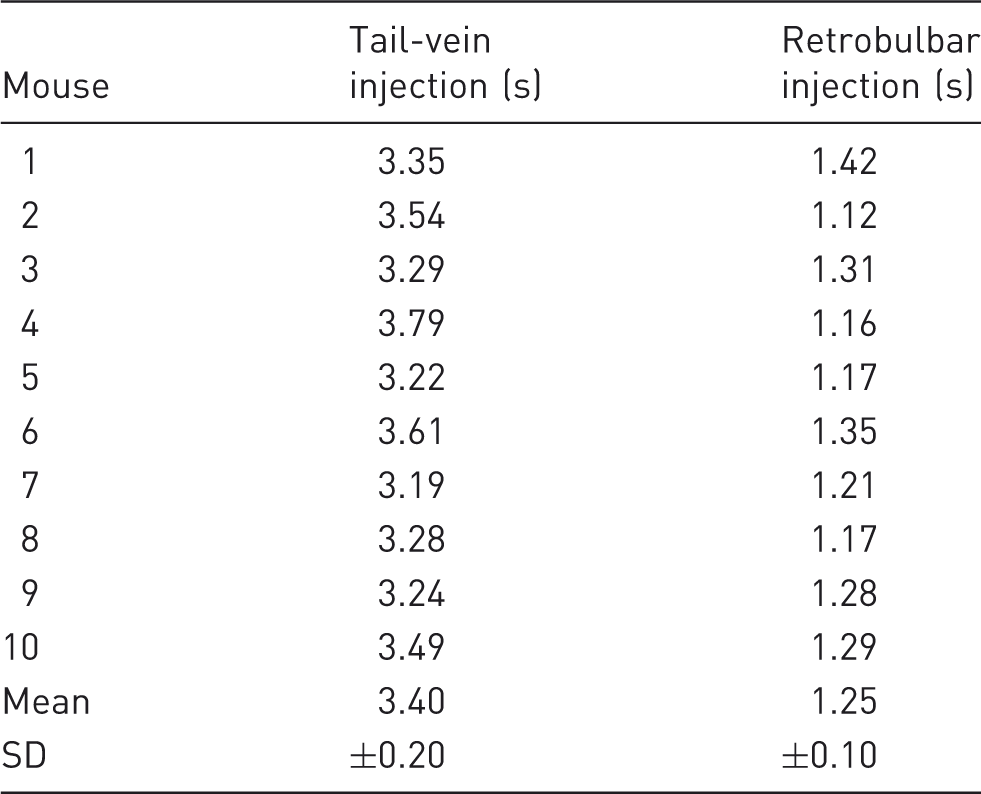
Retention time
Retention times of the contrast agent, i.e. the full width half maximum (FWHM), in a region of interest (see arrows in Figure 3) following an injection into the lateral tail vein and the retrobulbar sinus.
Discussion
The results obtained in this study illustrate that the lateral tail vein as well as the retrobulbar sinus are in general valid access routes for the injection of contrast media and drugs into small rodents if there is no temporal constraint on the transport. Both ports provide similar and very good reproducibility during consecutive injections. However, the imaging studies performed indicate that an injection of highly viscous contrast media into the lateral tail vein results in a dissolution of the injected contrast media bolus prior to reaching the heart. DSAs illustrating the temporal evolution of an injected bolus revealed that this bolus was dissolved below the diaphragm, and contrast media were only slowly transported to the heart. This behavior was further quantified using time-signal curves obtained from repetitive injections. Thus the contrast enhancement of the left or right ventricle obtained with the lateral tail vein injection is not sufficient for cardiac perfusion imaging in small rodents, rendering the lateral tail vein as an unfeasible injection route for those studies. On the contrary, an injection into the retrobulbar sinus is followed by a rapid transport of the injected contrast agent into the heart, as was demonstrated by DSAs. The complete bolus arrives very quickly in the right ventricle and is consequently transported into the pulmonary and body circulation allowing for superior contrast visualization even in demanding imaging protocols and applications similar to cardiac perfusion studies, as is known from clinical practice. Time-signal curves obtained in the external jugular vein showed a nearly exponential decay of contrast media concentration in these vessels indicating that an injected bolus is not significantly broadened on its way to the heart. This renders the retrobulbar sinus as the sole, feasible port for the injection of contrast agents during cardiac perfusion and associated examinations in mice. In conclusion, the injection of highly viscous contrast agents into the retrobulbar sinus is superior to the injection into the lateral tail vein for applications where the temporal evolution of the contrast bolus is relevant. Retrobulbar injections can enable cardiac perfusion studies in small animals and thus help to improve preclinical research in cardiac diseases.
Footnotes
Funding
This work was supported in parts by the Deutsche Forschungsgemeinschaft (DFG), Grant No. FOR 661.
Acknowledgements
The high-speed image reconstruction software RayConStruct-IR was provided by RayConStruct® GmbH, Nürnberg, Germany. The authors thank PD Dr Andreas Hess, Sandra Strobelt and Johannes Käßer, Institute of Experimental and Clinical Pharmacology and Toxicology, Friedrich-Alexander-University (FAU) Erlangen-Nürnberg for their help with the mouse measurements. The blood pool contrast agent ExiTron nano 12000 used to create Figures 1 and ![]() was provided by Miltenyi Biotec GmbH, Bergisch Gladbach, Germany and nanoPET Pharma GmbH, Berlin, Germany. The high-precision pump was assembled by Klaus Schewiola and Steffen Seeber at the DKFZ. The authors further thank Nora Denk for help with the manuscript.
was provided by Miltenyi Biotec GmbH, Bergisch Gladbach, Germany and nanoPET Pharma GmbH, Berlin, Germany. The high-precision pump was assembled by Klaus Schewiola and Steffen Seeber at the DKFZ. The authors further thank Nora Denk for help with the manuscript.