
Abstract
This study was undertaken to characterize the effects of monotonous training at lactate minimum (LM) intensity on aerobic and anaerobic performances; glycogen concentrations in the soleus muscle, the gastrocnemius muscle and the liver; and creatine kinase (CK), free fatty acids and glucose concentrations in rats. The rats were separated into trained (n = 10), baseline (n = 10) and sedentary (n = 10) groups. The trained group was submitted to the following: 60 min/day, 6 day/week and intensity equivalent to LM during the 12-week training period. The training volume was reduced after four weeks according to a sigmoid function. The total CK (U/L) increased in the trained group after 12 weeks (742.0 ± 158.5) in comparison with the baseline (319.6 ± 40.2) and the sedentary (261.6 ± 42.2) groups. Free fatty acids and glycogen stores (liver, soleus muscle and gastrocnemius muscle) increased after 12 weeks of monotonous training but aerobic and anaerobic performances were unchanged in relation to the sedentary group. The monotonous training at LM increased the level of energy substrates, unchanged aerobic performance, reduced anaerobic capacity and increased the serum CK concentration; however, the rats did not achieve the predicted training volume.
Rats have been used extensively as an experimental model to study physiological adaptations to physical stress.1–6 Exercise paradigms applied to rats can provide information concerning the metabolic alterations promoted by disease, diet, surgery, drugs and other interventions in relation to the preservation of homeostasis.7–12 However, the metabolic effects of exercise on these animals are frequently questioned due to lack of information about and criteria for the intensity imposed during exercise training. 13
In an attempt to establish the intensity of exercise using appropriate protocols for rats, our group has developed studies to evaluate the aerobic/anaerobic transition, which is also referred to as the lactate threshold.1–4,10,14–16 Recently, we established the lactate minimum (LM) protocol to determine the intensity of effort equivalent to the aerobic/anaerobic metabolic transition during swimming exercise in rats. 15 The LM is a method usually employed to predict the intensity of effort equivalent to the lactate threshold in a single session, i.e. it corresponds to the maximal lactate steady state, which is considered the gold standard test in the determination of aerobic capacity.14,15 However, the chronic adaptations in experimental physiology at LM intensity have not yet been investigated. Thus, the application of this protocol during a training programme is essential to control the effectiveness of the training model and can also be used in clinical studies that use exercise as an intervention.
It is known that the physiological adaptations to exercise are dependent on programme length, session duration, frequency and intensity. 17 To date, although increasing interest has been devoted to the scientific basis of training prescription in humans, including manipulations of intensity and duration, there are no specific studies on the effects of training load in rats. In humans, it was reported that inappropriate design of the training session can lead the individual to exceed the exercise tolerance, promoting disruption of homeostasis, immune suppression and muscle fatigue.18–20 Foster 21 described that a monotonous training programme without changes in duration and intensity, can predispose humans to disturbances of physiological state. Although monotonous training protocols have been used in experimental physiology,1,3,7,10,11,17 there are no published studies on the real adaptations attributable to this training model. 13 Along these lines, we hypothesized that monotonous training of rats would increase disturbances of physiological state, i.e. homeostasis and as a consequence intolerance to the exercise programme.
Countless biomarkers have been suggested to detect disruption of homeostasis during training programmes in humans.
20
The most common analyses are immune system state, serum hormones, serum glutamine, serum enzymes and metabolites.18 – 21 However, biomarker responses during training in humans are unpredictable due to intrinsic individual differences (i.e. training status, injury, sleep, nutritional condition, psychological factors, genetic and others) and external interventions (i.e. culture, nationality, temperature, humidity, economic factors, sponsorship, social and others). On the other hand, in experimental physiology, due to the use of internal (i.e. species and strain) and external (i.e. diet, time of manipulation, temperature and sleep) controls, the biomarker responses to the exercise are more accurate than those in humans. Thus, biomarker analyses during long-term training in rats would enable a better understanding of the physiological adaptations that occur during training. Therefore, the aim of this study was to describe the effects of monotonous swimming and to characterize the related physiological adaptations in rats. Specifically, we analysed the training volume using a mathematical model, aerobic and anaerobic performances, as well as biomarkers including glycogen stores (soleus muscle, gastrocnemius muscle and liver), the level of creatine kinase (CK) reactive with N-acetyl-
Materials and Methods
Animals
All experiments involving the animals were performed in accordance with specific Brazilian resolutions on Bioethics in Experiments with Animals (no. 93/08) that is in agreement with the guidelines of the European Convention for the Protection of Vertebrate Animals for research involving animals.
Thirty male Wistar rats (Rattus norvegicus albinus), 50 days old, were selected for this study. The rats were kept in an experimental animal room with free access to food and water, which were supplied at the same time every day. The rats were maintained in group cages (5 rats per cage, 350 cm2 per animal, 18 cm of height). The cages were changed four days per week during the entire experimental period. The animals received water and commercial chow (23.5% protein, 6.5% fat, 70% carbohydrate, Purina 5008, St Louis, MO, USA) ad libitum and were housed at 22 ± 2°C, in 45–55% relative humidity with an inverted 12 h:12 h light–dark cycle (18:00–06:00 lights on). The luminosity intensity for the light period was kept between 50–60 lux and 300–400 lux in the vivarium and the laboratory, respectively.
Adaptation to water and tank
The experimental period was preceded by two weeks of adaptation to the water environment (except Saturday and Sunday, totaling 10 days of water exposure) consisting of 5 min of water (31 ± 1°C) exposure daily, in cylindrical tanks (80 cm diameter × 120 cm depth), subdivided into four PVC cylindrical compartments of 30 cm diameter × 120 cm depth for individual swimming. 15 For the first five days, individual rats were placed in water that had a depth of 20 cm; for the remainder of the adaptation and the training periods, the depth of water was approximately 100 cm. The purpose of adaptation was to reduce stress without promoting physiological adaptations to physical training. The use of tanks deeper than 100 cm with a smooth surface and individual compartments makes it impossible for the animals to rest at the tank bottom, forcing them to continuously swim.
Lactate minimum test
For determination of the aerobic and anaerobic performances during the experimental period, the LM test was utilized. In the first phase, this test consisted of hyperlactataemia induction (anaerobic index) followed by incremental variation of the swimming intensity. 15 The hyperlactataemia phase consisted of two swim bouts supporting 13% overload of body weight (bw), both separated by a 30 s passive recovery time. The first bout was 30 s in duration, and the second bout lasted until exhaustion (UE), defined as the animal's inability to stay on the water surface for 15 s. After hyperlactataemia induction, the animals were maintained in shallow water to avoid thermal stress and blood samples were collected from the tail after 7 and 9 min for lactate peak determination. The incremental phase of the test involved swimming with tethered loads (backpack lead) equivalent to 4.0%, 4.5%, 5.0%, 5.5%, 6.0% and 7.0% of the individual bw. The swimming stages in each load lasted 5 min and were separated by 30 s for blood collection and lactataemia determination. The LM intensity was obtained from the zero point derived from the second-order polynomial fit for the lowest lactate value of the ‘U-shaped’ curve of blood lactate concentration versus the load in the incremental phase of the LM test. Curves that disabled the second-order polynomial adjust (‘U-shaped’) and values of R 2 lower than 0.8 were considered insufficient for the assurance of the method. 15
Theoretically, the lowest level in this curve represents the maximal exercise load in which the lactate production rate is the same as the lactate removal rate, i.e. it corresponds to the maximal lactate steady state, which is considered as the gold standard test in the aerobic capacity determination.
Training
The training programme lasted 12 weeks (6 days/week), and the sessions were 60 min/day (if the rats did not complete 60 min, they were timed and inserted in the next daily session). The training load was constant and based individually on LM intensity. The volume of training was quantified in each training session for determination of the week volume:

Experimental groups
The rats were randomly distributed into three groups:
The baseline group (n = 10) was euthanized after 24 h adaptation to water for reference analyses. The sedentary group (n = 10) was evaluated by LM three times: (1) after 24 h adaptation to water and (2) after six weeks and (3) 12 weeks of the experimental period. For biochemical analyses, the sedentary group rats were euthanized at the end of the experimental period (12 weeks). During the experimental period, the sedentary group was adapted to the deep water (5 min, two days/week, without added weight). The trained group (n = 10) carried out 12 weeks of constant training at relative LM intensity. The LM was evaluated three times: (1) after 24 h adaptation to water and (2) after the six weeks and (3) 12 weeks of the training period. The training intensity was based on the first two LM tests, and the rats were weighed (g) weekly to calculate and administer the load required for LM intensity. For biochemical analyses, the trained group was euthanized 24 h after the last training session.
Euthanasia and biochemical analyses
At the end of the adaptation to water period (baseline values) or after 12 weeks, the animals were euthanized with 20% chloral hydrate (0.3 mL/100 g animal weight) for blood sample collection and tissues excision (liver, soleus muscle and gastrocnemius muscle). Blood was collected by a cardiac puncture after thoracotomy into dry tubes. Serum was separated into aliquots for later analyses.
To determine CK–NAC concentration, 50 μL serum (stored at 2–8°C during 1 week) was mixed with the reagent mix from a kit: imidazol (100 mmol/L), CK (30 mmol/L), ADP (2 mmol/L), glucose (20 mmol/L), NADP (2 mmol/L), hexokinase (2.500 U/L), glucose 6P (2.000 U/L), Mg (10 mmol/L) and AMP (5 mmol/L). The CK–NAC absorbance was determined at 340 nm (25°C: U/L = Δ absorbance/min × 3333) 4, 5 and 6 min after the sample and reagent were mixed.
The levels of serum glucose were determined using a glucose–oxidase colorimetric enzymatic method. 22 Free fatty acids were analysed according to Regow et al. 23
After blood was collected, the liver, the soleus muscle and the white gastrocnemius muscle were carefully dissected and then placed on filter paper to remove excess fat and connective tissue. The glycogen concentration of tissues samples was immediately analysed according to Dubois et al. 24 The muscle (200–250 mg) and liver (500 mg) samples were immediately digested in 0.5 mL of KOH 1N (30%) for 20 min; then, 20 μL of Na2SO4 was added for glycogen precipitation using 2.5 mL of absolute ethanol (5 min of centrifugation). The colorimetric method for serum glucose determination was performed using 20 μL of phenol (80%) and 2.0 mL of sulphuric acid. The absorbance was determined at 490 nm after 15 min of boiling.
For the lactate concentration measurement, blood samples (25 μL) were collected from the animals (by amputation of the tail vein) 25 during LM tests and placed in microtubes (1.5 mL) containing 50 μL of 1% sodium fluoride which were stored in a freezer for later lactate concentration analysis in a YSI model 1500 SPORT lactate analyzer.
Data and statistical analyses
Two rats of the sedentary group were removed from statistical analyses since they did not reach the coefficients of determination (R2) ranged between 0.80 and 0.99 in LM.
15
Also, two rats of the baseline group were excluded from data analyses due to methodological failures during thoracotomy. According to the Shapiro–Wilk's W-test, the data fit a normal distribution and homogeneity of variance was confirmed by the Levene's test. Therefore, the analysis of variance (ANOVA two-way) with Newman–Keuls’ post hoc test was used for comparison of means (Statistica 7.0®). Effect sizes (ES) were determined by the formula: [mean1 – mean2]/pooled SD for the differences among variables in each training period (baseline, after 6 and 12 weeks) in trained and sedentary groups. The confidence interval (CI) was calculated with α = 0.05: mean±1.96 (σ/ √n). The statistical significance was set at P < 0.05, and all data are presented as the mean±standard deviation. The values of the training volume were generated using a Boltzmann sigmoidal-fit function using software packages incorporating a logistics function (Origin®, v7.0020; OriginLab Corp, Northampton, MA, USA). The logistical equation for curve fitting was as follows:

where A1 is the maximal Y value; A2 the minimal Y value; x the week at any time; x0 represents the week halfway between A1 and A2 (sigmoid inflexion); and dx is the time constant.
Results
The mean body weight value (g) at baseline and after six and 12 weeks of the experimental period is shown in Table 1. The body weight of the rats was unchanged after six weeks in the sedentary group and the trained group, but increased by 33% (effect size = 2.00) and 46% (effect size = 2.72) after 12 weeks compared with baseline values, respectively (Table 1).
Lactate minimum (LM) intensity (relative and absolute) determined from zero derived polynomial fit curves (R2), Tlim 13% (seconds) and blood lactate concentration verified after the hyperlactataemia phase
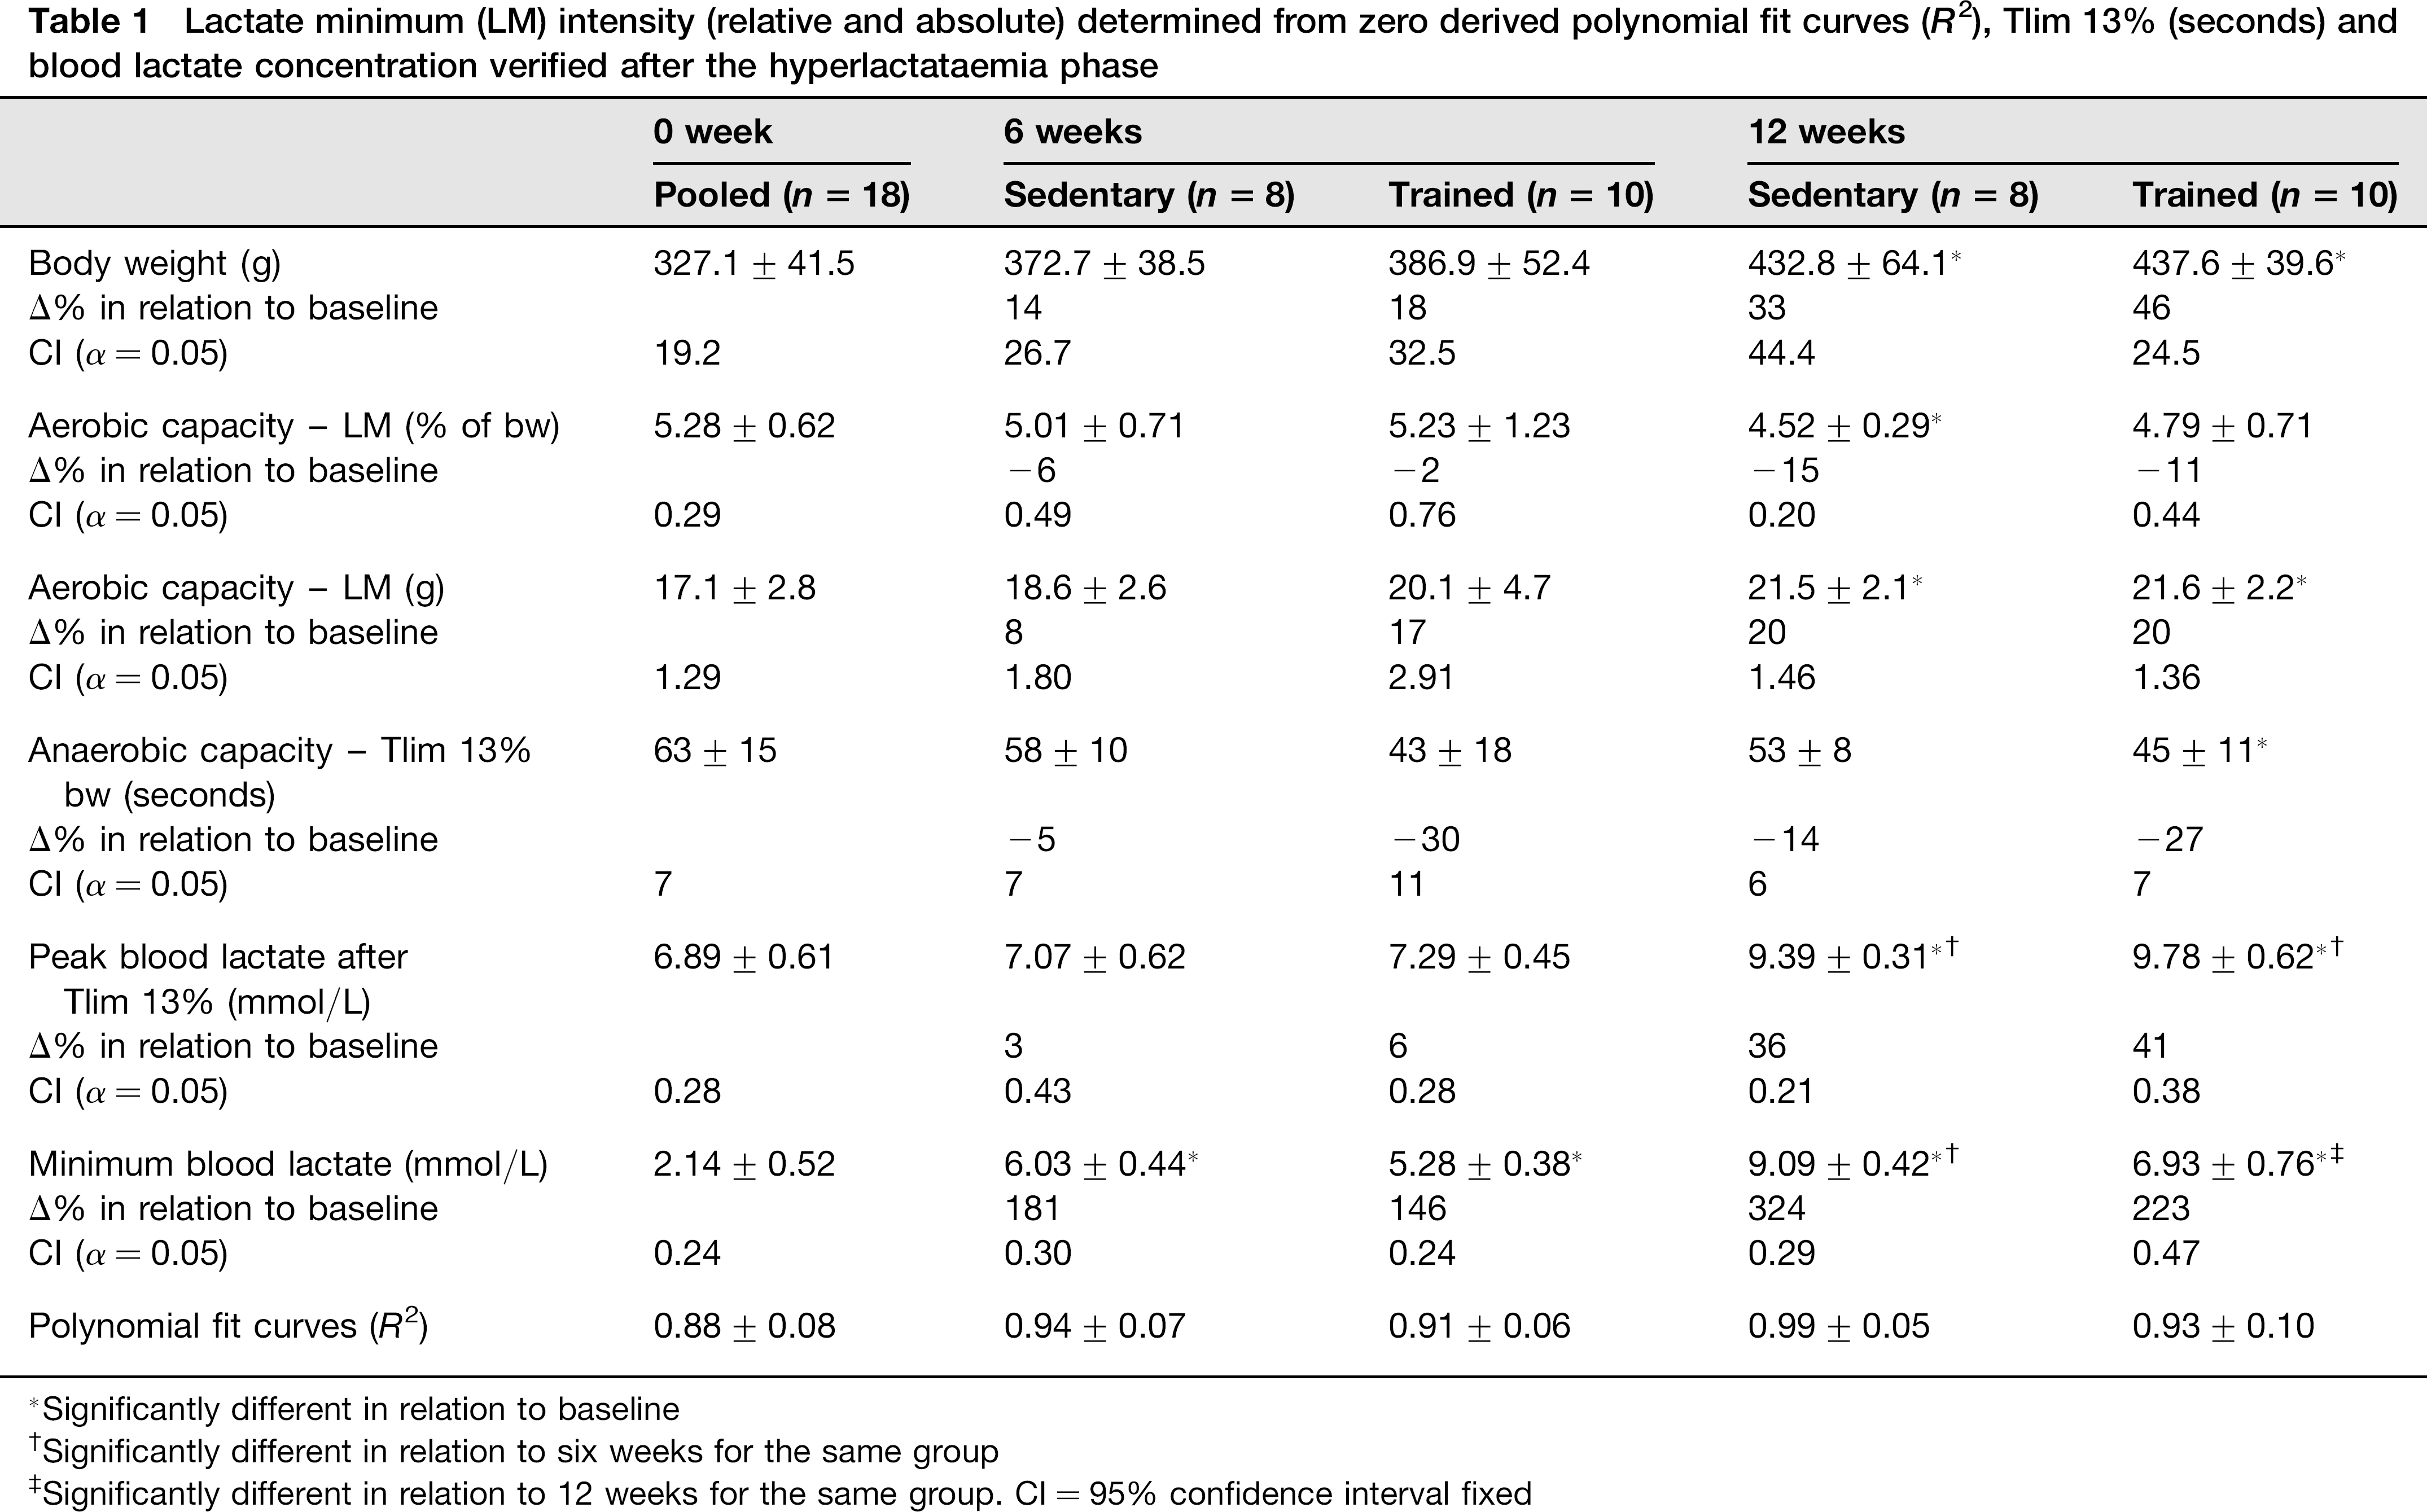
Significantly different in relation to baseline
Significantly different in relation to six weeks for the same group
Significantly different in relation to 12 weeks for the same group. CI = 95% confidence interval fixed
The aerobic capacity measured by relative load (% of bw) decreased 15% in the sedentary group after six weeks compared with baseline (effect size = 1.67), but was unchanged (effect size = 0.74) after 12 weeks in the trained group (Table 1). The aerobic capacity measured by the absolute load (g) increased in the sedentary group (effect size = 1.79) and trained group (effect size = 1.80) at the end of the experimental period in relation to baseline (Table 1). For anaerobic capacity, the time to UE decreased 27% (effect size = 1.38) after training in comparison to baseline (Table 1).
The minimum blood lactate and peak blood lactate levels increased after the experimental period in the sedentary group and the trained group compared with the baseline (effect size = 5.38 and 5.40, respectively) and the six-week measurements (effect size = 4.99 and 4.65), respectively. The polynomial fit resulted in high R2 values (Table 1).
The training volume was reduced after seven weeks in relation to the volume during 1–4 weeks (Figure 1a). Three characteristics of monotonous training were found using the sigmoid fit (Figure 1b): (1) a high training volume was performed until four weeks (A1); (2) a critical slope occurred after four weeks (x0) and (3) a low training volume was performed thereafter until 12 weeks (A2).
(a) Real and estimated volume at lactate minimum (LM) intensity during monotonous training. *Significantly different in relation to one, two, three and four weeks (P < 0.05). #Significantly different in relation to one, two and three weeks (P < 0.05). (b) The Boltzmann function (y = A1 – A2/1 + e(x– x0)/dx + A2) was applied in the real values for a sigmoid curve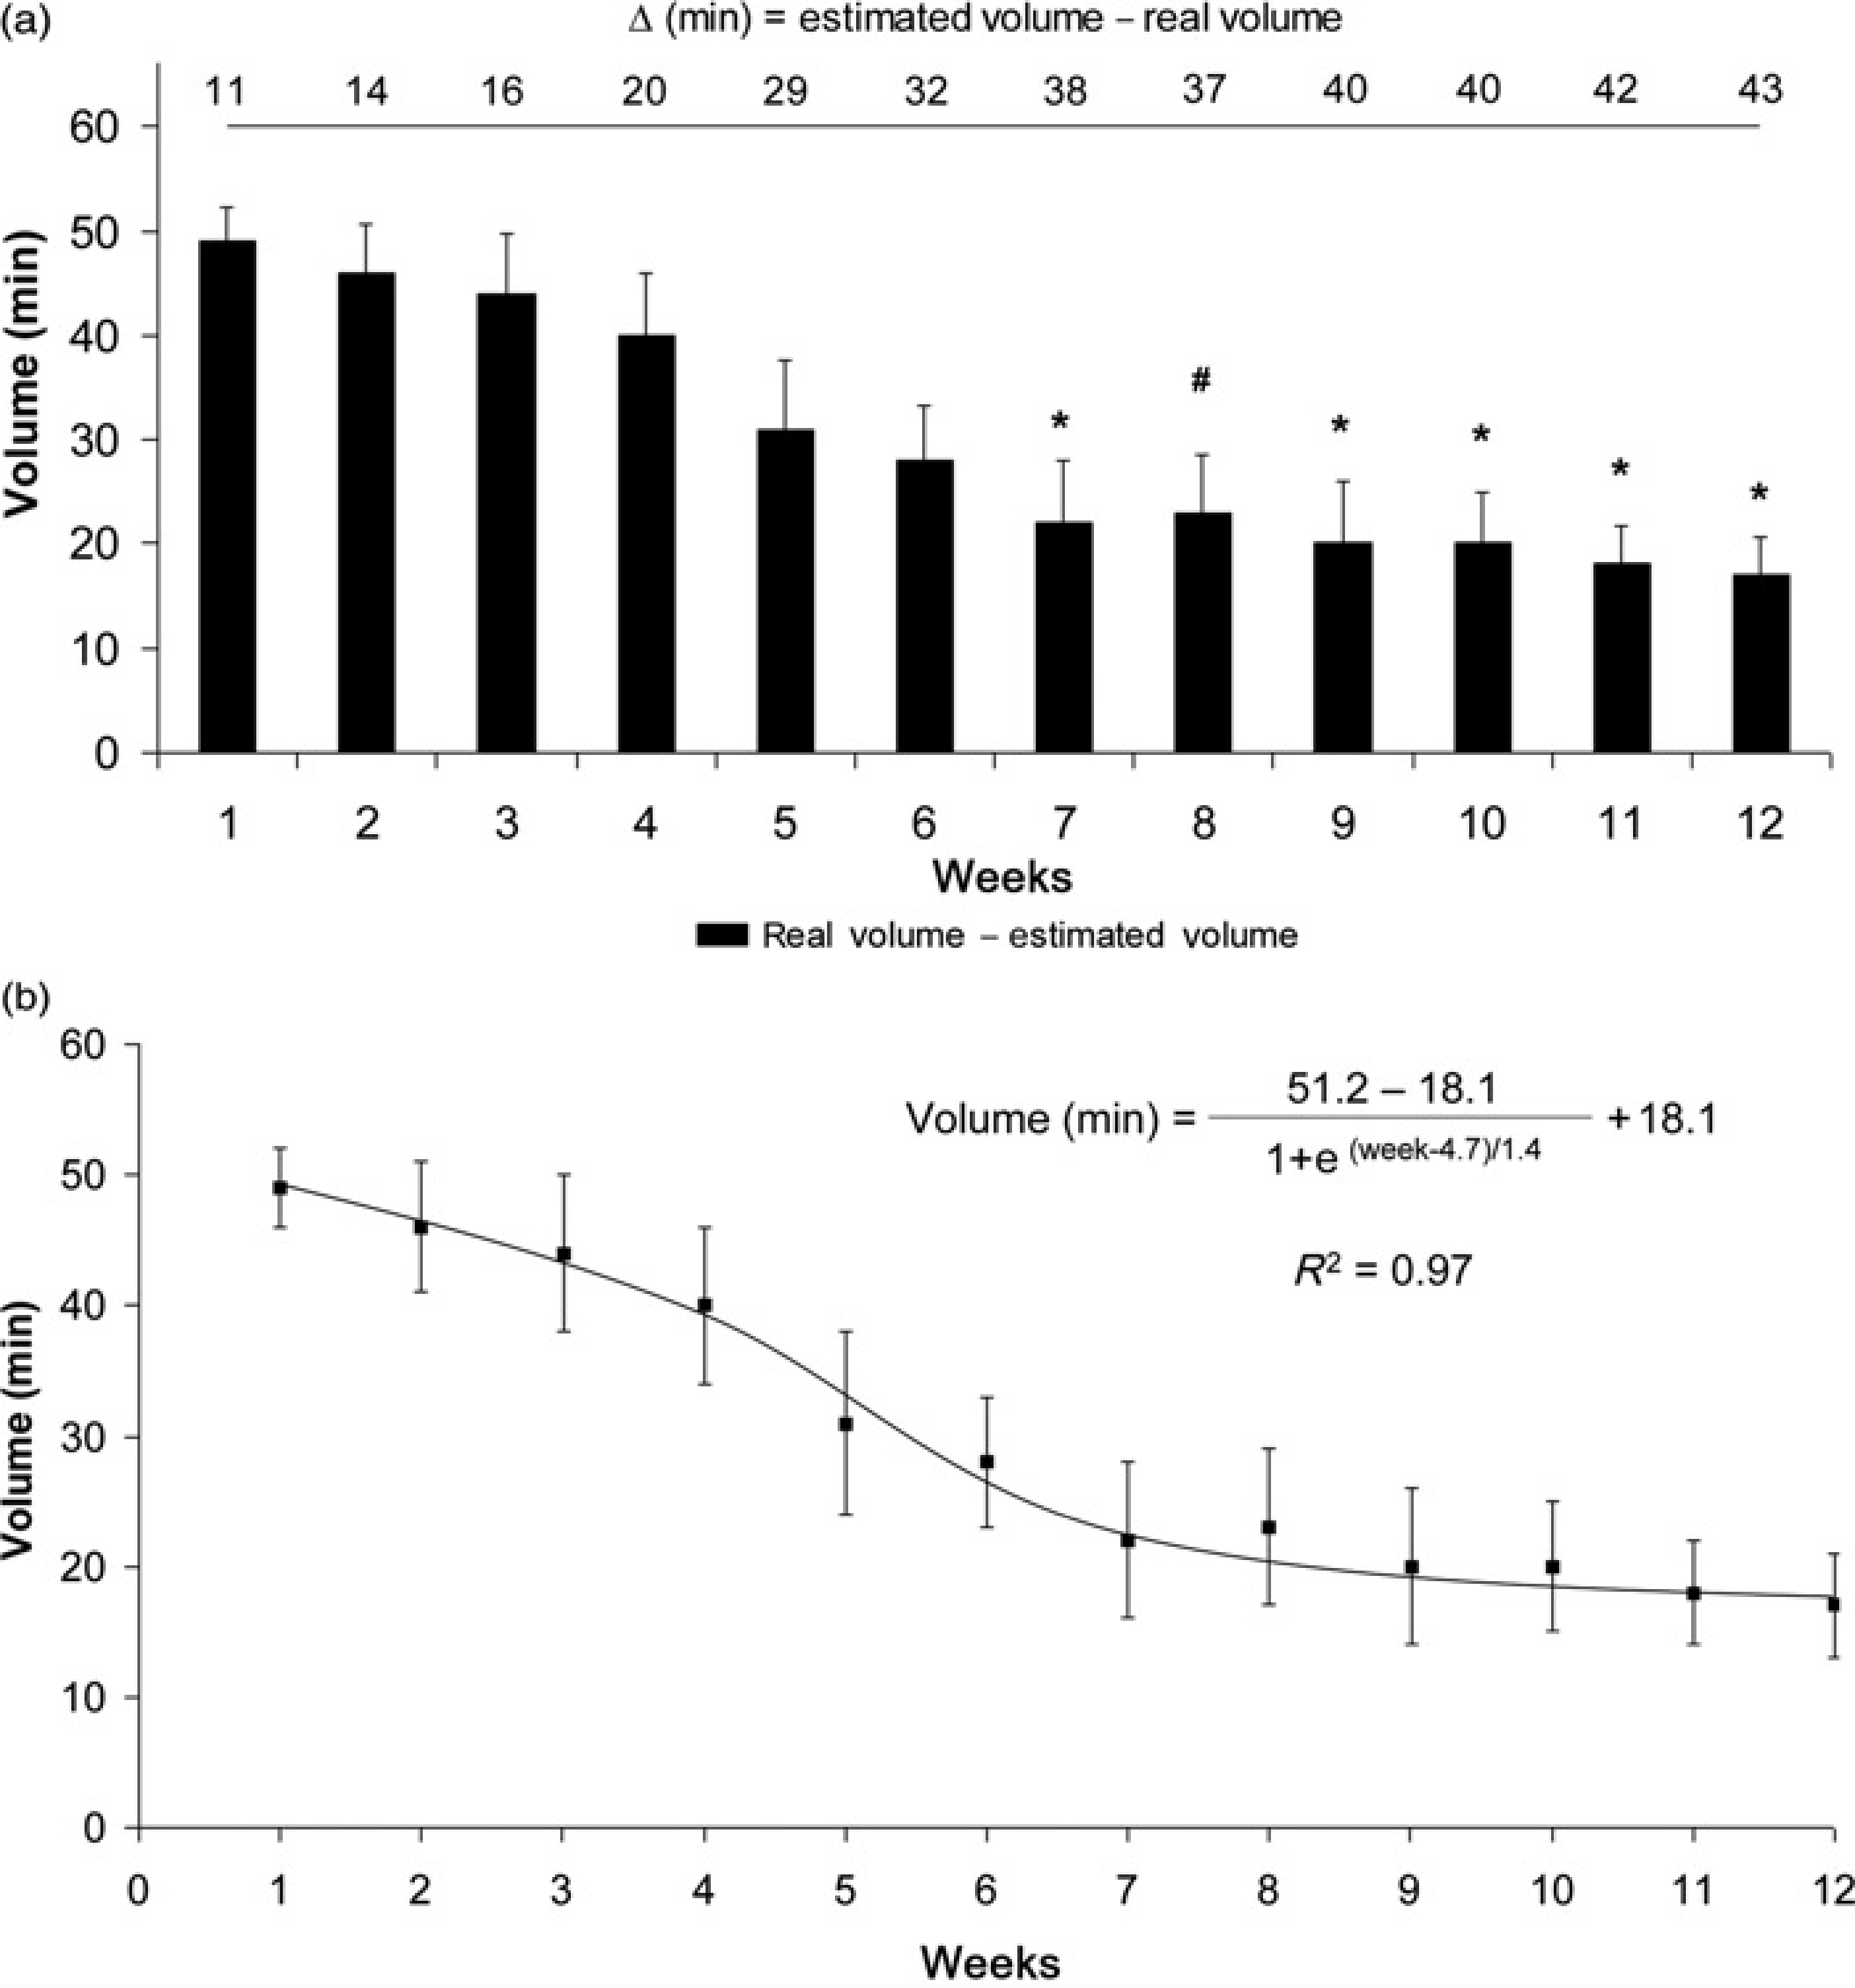
Table 2 shows that glycogen concentration in the liver, gastrocnemius muscle and soleus muscle in the trained group increased compared with the baseline and the sedentary rat groups. Soleus glycogen concentration after 12 weeks of training was 37% higher than the initial period. The serum glucose level was unchanged with monotonous training, but this parameter in the sedentary group was higher than in the baseline group (Table 2). Free fatty acid concentration increased 51% in the trained group compared with baseline (Table 2). The CK concentration was higher after training than in the baseline and sedentary groups (Table 2).
Glycogen concentration (mg/100 mg) of the tissues liver, gastrocnemius, soleus, glucose concentration (mg/dL), free fatty acids (μEq/L) and creatine kinase (CK) concentration (U/L) during the experimental period
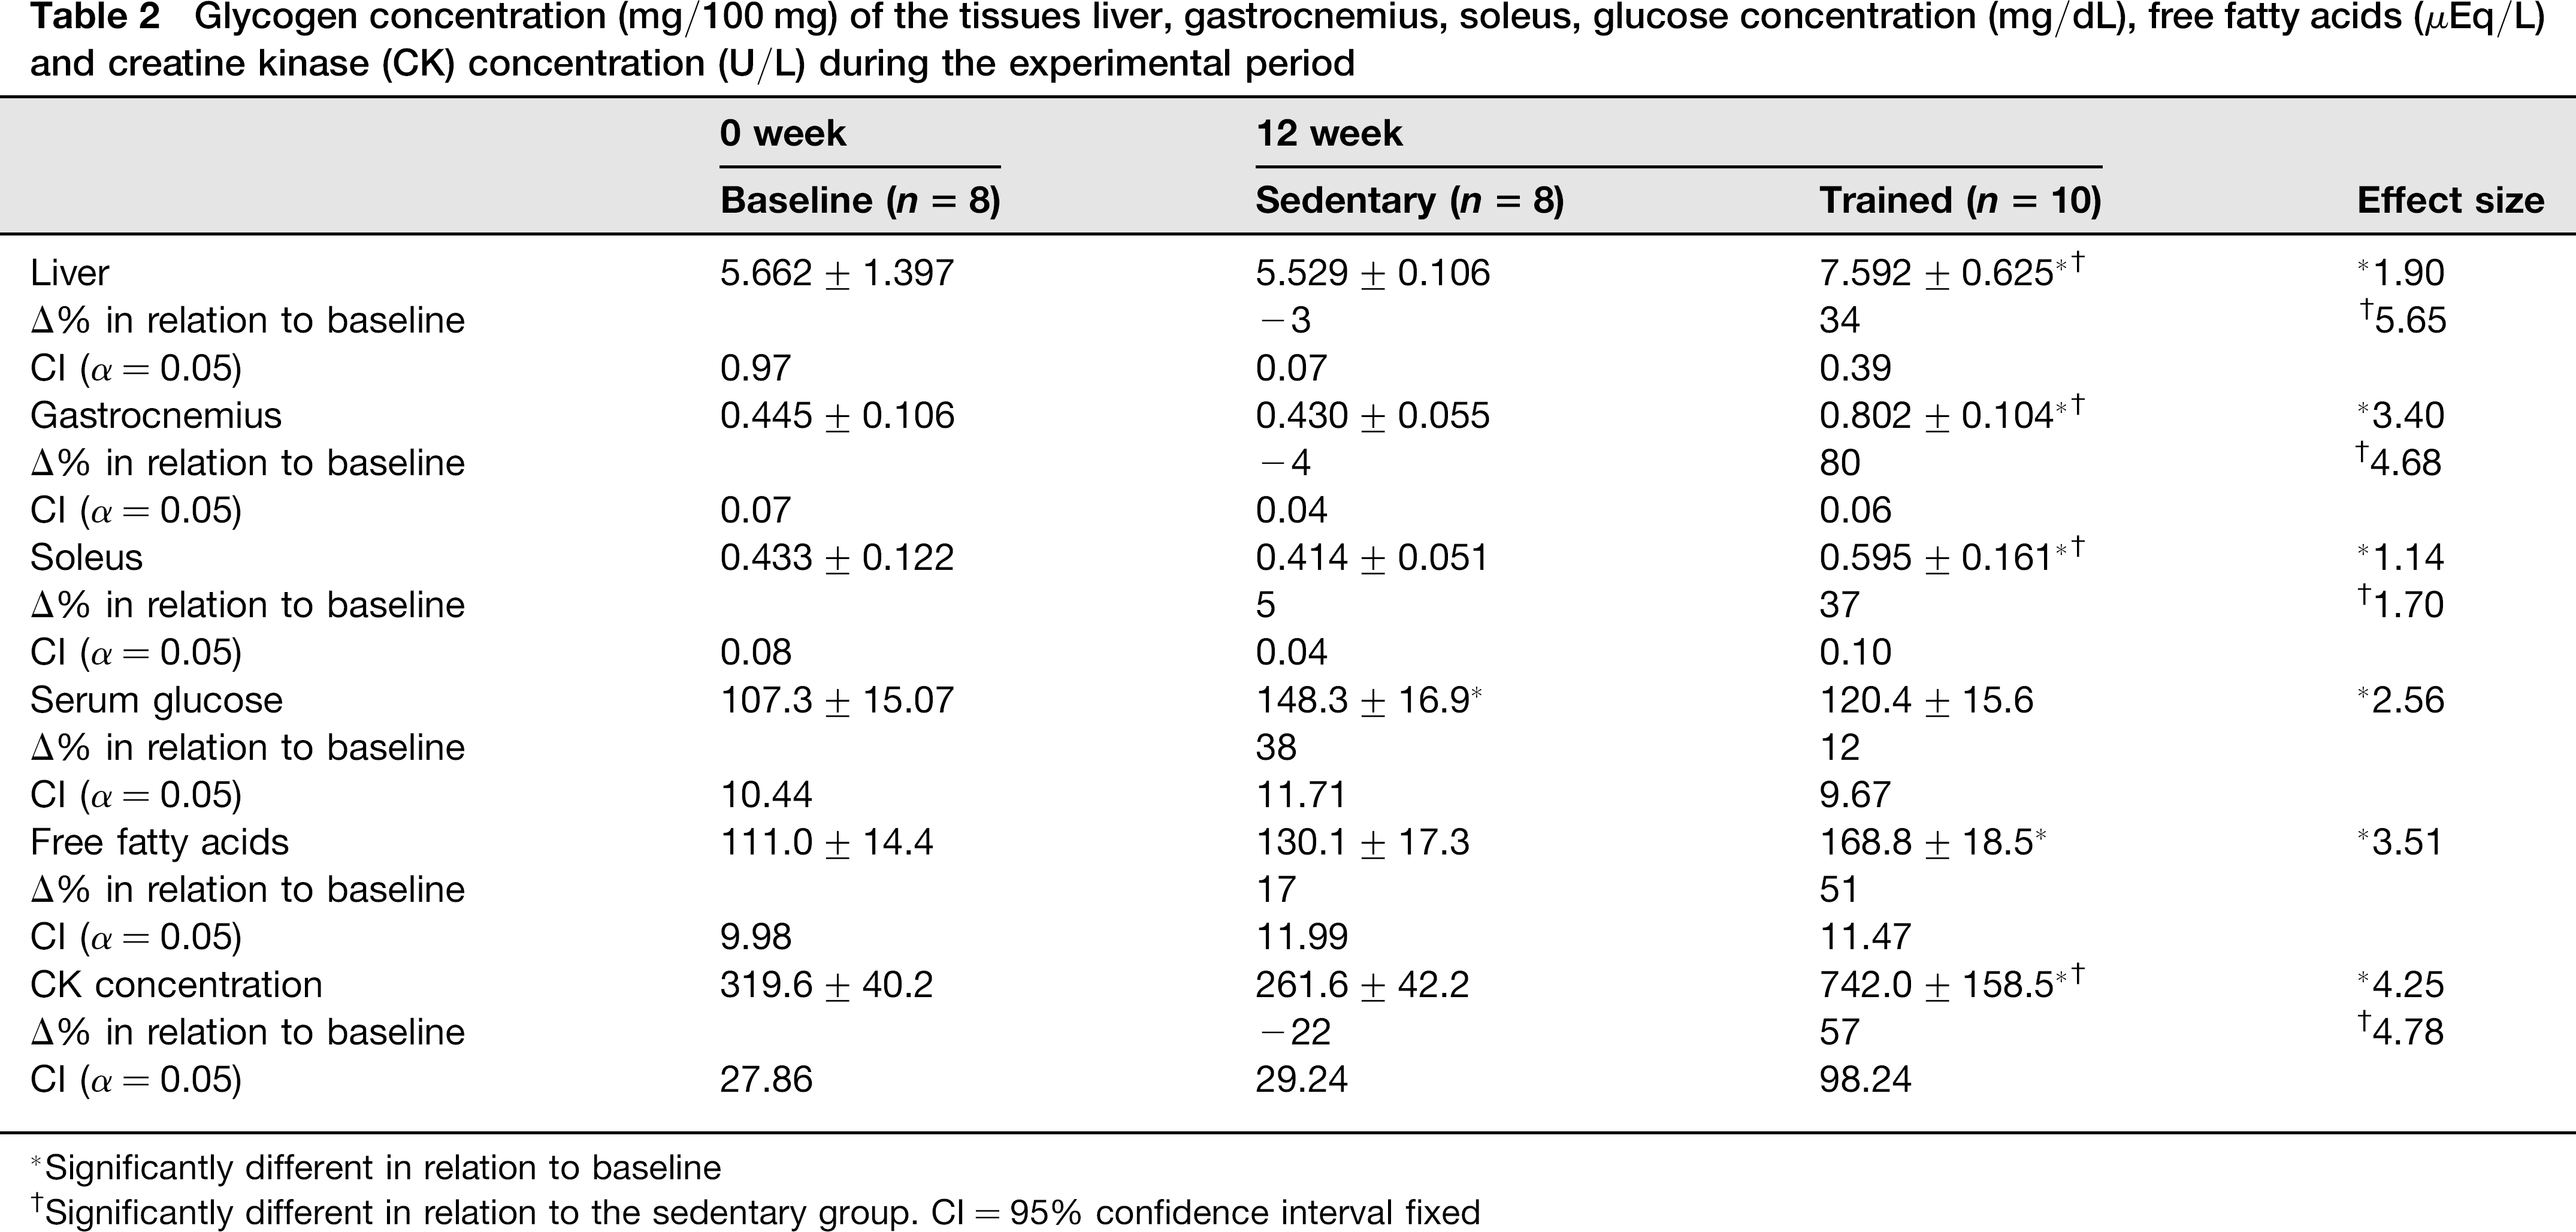
Significantly different in relation to baseline
Significantly different in relation to the sedentary group. CI = 95% confidence interval fixed
Discussion
To the best of our knowledge, this is the first study to investigate the effects of monotonous training on individualized training volume intensity, biomarker responses as well as aerobic and anaerobic performances in rats. Our results showed that monotonous training was insufficient to increase performance, but the ability to confirm this result led to the hypothesis that physiological disturbances are limited due to positive (glycogen stores are overcompensated for and free fatty acid is increased) and negative (serum CK concentration is increased and training volume is reduced in the trained group) adaptations.
Training model
The inappropriate volume and intensity of the training sessions can exceed the individual exercise tolerance in humans. 20 For this reason, monotonous training has not been recommended due to the prolonged load without variations in volume and intensity. 21 Booth et al. 13 reported that a disturbing trend has emerged in which scientific journals are accepting manuscripts in exercise biochemistry/physiology that have employed inappropriate methodologies to study exercise training in rats (i.e. monotonous training). Our intention in the present study was to show that the intensity, volume, programme length and recovery time of training may substantially interfere with biochemical responses, and as a consequence, clinical designs. Thus, it is important to understand and standardize the training model and its responses prior to the use of animals in these types of training experiments.
Our hypothesis, i.e. that monotonous training reduces the training volume, was based on previous studies with normal humans/athletes. However, studies of training models in rats, which provide useful experimental tools, are not found in the literature. Our results showed three characteristics of training volume during monotonous training at LM intensity: (1) a high training volume is performed until four weeks (A1), (2) a critical slope of volume (x0) occurs and (3) a low training volume is performed thereafter for the remainder of the 12 weeks (A2). The mathematical functions used in the present study enable the following: (1) the identification of the period of training volume reduction, (2) estimation of the training volume performed by another experimental group under these conditions and (3) establishment of a mathematical criterion to analyse the duration of exercise during the experimental period.
Biomarkers
As a consequence of continual stress and inappropriate recovery from training, muscle CK is released into circulation, increasing plasma levels.26–28 Our results show an increase in CK concentration after monotonous training when compared with baseline and sedentary groups. This adaptation can be attributed to damages in the muscle due to constant intensity and inadequate cell recovery. 20 On the other hand, de Araujo et al. 29 reported that linear periodized training was effective to prevent the overload, systemic stress (reduced corticosterone concentration in relation to the sedentary group) and CK released by muscle cell due to oscillations between volume and intensity.
Although we did not analyse the systemic stress by the corticosterone concentration, the elevated levels of CK in plasma to the trained group represents a stressful protocol with values significantly higher in comparison to the sedentary group as well as to another study involving physical stress for rats. 29 However, CK data are insufficient to characterize negative adaptation due to training and the failure of muscle recovery. 26
Curiously, the monotonous training promoted energetic overcompensation (liver and muscle glycogen stores) after 12 weeks, but the glycogen stores were not used to improve anaerobic (assayed by the time to UE) and aerobic (assayed by LM) performances in relation to baseline.30–33 Despite the glycogen overcompensation, the trained group did not perform at a high training volume. In this context, Costill et al. 30 corroborated our results and reported that glycogen stores were sufficient to maintain performance but inadequate as available energy substrates during training sessions.
Endurance training requires predominantly red muscle contraction to increase fat oxidation, oxidative enzymes and glycogen synthesis.34,35 It is possible that the prolonged period of high-volume training stimulated glycogen synthesis and availability of free fatty acids but did not stimulate glycogenolysis and hyperlactataemia production.36,37 In the present study, glycogen depletion/synthesis (i.e. acute exercise group, phosphorylase and glycogen synthase) were not analysed; however, the similar degree of hyperlactataemia and anaerobic capacity (as assayed by the time to UE) between the sedentary and trained groups indicated an inefficiency in mobilizing the glycogen stores, stimulating the glycolytic pathway and inducing hyperlactataemia. 36
Aerobic and anaerobic parameters
The reduction of anaerobic capacity after monotonous training was expected because high training volume reduces anaerobic adaptations (i.e. in white-fast muscle fibre contraction and glycolytic enzymes). 34 On the other hand, we also expected an increase in LM intensity after endurance training, but the aerobic capacity was significantly unchanged. Thus, while the monotonous training induced an increase in free fatty acids and glycogen stores, the aerobic performance (% of bw) evaluated using LM was attenuated.
The LM is a method usually employed in humans and animals to predict the aerobic intensity due to a single evaluation session and a high correlation with maximal lactate steady-state workload.37–40 The monotonous training in the present study left LM intensity (%) and lactate clearance/oxidation unchanged after 12 weeks. Carter et al. 39 reported that LM is an insensitive method to evaluate aerobic performance in humans. However, this theory was revised because the LM (as assayed by the % of bw required for LM) increased after eight weeks of swimming training in rats. 40 Thus, we believe that an unaltered LM occurred due to the following reasons: (1) the long period of training (3 months), which in older rats results in decreasing physical fitness;41,42 (2) the natural reduction of aerobic and anaerobic performances due to the long period that the rats were maintained in cages, which could lead to a sedentary lifestyle and reduced spontaneous activity; and (3) the training programme without changes in training volume and intensity, which may cause cellular disturbances and inadequate recovery periods.43,44
At the end of the experimental period, both groups (trained and sedentary) showed an increase in total body weight and consequently the absolute workload in LM (g). However, the absolute work load is not an accurate indicator of performance because sedentary rats showed a similar intensity in relation to the trained group. 15 Under this circumstance, the natural growth of rats limits the interpretations of aerobic training adaptations when using absolute load. On the other hand, the relative intensity was an effective indicator of changes in the aerobic performance, as well as to calculate the individualized training overload. 1
In summary, monotonous training decreases the performed training volume and increases serum CK concentration, suggesting that exercise at constant LM intensity cannot be applied in long-term training to improve the aerobic and anaerobic performances. In addition, the monotonous training overcompensates the muscle glycogen stores; however, these increased glycogen stores were not mobilized to increase the performance and to sustain the estimated volume. Thus, these results must be taken into consideration when using rats for training models to avoid related adaptations caused by inappropriate load and recovery periods.
Footnotes
Acknowledgements
The authors thank FAPESP (04/01205-6; 04/07070-5; 06/58411-2) for financial support. Grammatical corrections are made by the American Journal Experts®.