
Abstract
In the present study, we examine whether characteristics of student teaching sites and cooperating teachers predict teacher candidates’ edTPA scores. Using data from North Carolina, we find that candidates earn higher edTPA scores if they student-taught in a high value-added school and with a cooperating teacher earning higher evaluation ratings. Evidence also suggests that candidates earn higher scores when they are mentored by a cooperating teacher who is more familiar with performance assessments. Finally, we find that the relationships between student teaching environments and edTPA scores vary by characteristics of the candidate. This study reinforces prior work on the importance of learning environments to teacher development and the importance of preparation programs securing placements in high-quality learning environments. Our results may also have implications for the use of performance assessments by states and preparation programs.
Keywords
Introduction
In recent years, many states and educator preparation programs (EPPs) have adopted teacher performance assessments (TPAs) as a way to measure teacher candidates’ knowledge and instructional skills. As of 2021, 16 states require that candidates pass a TPA; four other states allow but do not require a TPA as a measure of candidate readiness (Putnam & Walsh, 2021). Unlike licensure exams, which measure candidates’ content or pedagogical content knowledge through closed-ended questions, TPAs measure candidates’ ability to enact instruction. In particular, TPAs require candidates to demonstrate their teaching ability on a range of instructional tasks—for example, planning lessons, establishing a supportive environment, assessing student learning, providing feedback, and reflecting on practice. EPPs can use evidence from TPAs to inform program improvement efforts (Peck et al., 2014) and to make high-stakes decisions regarding program completion. States can require that candidates pass a TPA before conferring a teaching license.
Teacher candidates typically compile their TPA evidences as part of their student teaching experience. As such, TPAs capture the planning, instruction, and assessment that occur in real P-12 classrooms and with real P-12 students. This immersion in P-12 settings matters given research on teacher development. Over the last decade, a rich body of scholarship has shown that inservice teachers are more effective, as measured by value-added to student achievement and evaluation ratings, when working in a high-quality learning environment—that is, schools in which students make larger achievement gains, teachers collaborate, and teachers stay (Kraft & Papay, 2014; Loeb et al., 2012; Ronfeldt et al., 2015; Sass et al., 2012). Similarly, teachers are more effective when working with colleagues who have higher value-added estimates (Jackson & Bruegmann, 2009; Sun et al., 2017).
This work on teacher development extends into preservice teacher education, where multiple studies highlight the value of student teaching placements to the learning of candidates. Early-career teachers have higher value-added estimates and higher evaluation ratings after student teaching in schools with high-quality learning environments (Bastian et al., 2020; Ronfeldt, 2012, 2015). Early-career teachers are also more effective, as measured by value-added and evaluation ratings, after being mentored by cooperating teachers who are more instructionally effective themselves (Bastian et al., 2020; Goldhaber, Krieg, Naito, et al., 2020; Ronfeldt et al., 2018).
In the present study, we examine TPAs and their use in teacher education in light of this recent evidence on student teaching placements. Given work showing that student teaching environments predict the value-added and evaluation ratings of early-career teachers, we ask whether the characteristics of placement sites and cooperating teachers also predict candidates’ TPA scores. We carry out this work by connecting the TPA scores of approximately 3,000 candidates in North Carolina to characteristics of their student teaching schools and cooperating teachers. In particular, we focus on candidates’ scores from the edTPA, a widely adopted TPA that was created by the Stanford Center for Assessment, Learning, and Equity (SCALE) and is used by many EPPs in North Carolina. Our analyses extend recent work on clinical experiences and teacher candidate development and have implications for student teaching placements and the use of TPAs by states and EPPs.
Background
Research on edTPA
edTPA is a portfolio-based performance assessment that candidates typically complete during their student teaching experience. Specifically, edTPA portfolios consist of lesson plans, video clips of instruction, samples of student work, and candidates’ reflective commentaries on their teaching. edTPA is a subject-specific TPA with 27 unique handbook areas (e.g., secondary mathematics). Most edTPA handbook areas consist of three main teaching tasks—Planning, Instruction, and Assessment. Nested within these tasks are 15 rubrics, five for each task, upon which candidates receive scores. 1 Official scorers, trained and certified by Pearson Education, score each rubric from 1 to 5, where a “1” indicates a struggling candidate who is not ready to teach, a “3” indicates an acceptable level of performance to begin teaching, and a “5” indicates a highly accomplished candidate.
SCALE (2013) conceptualizes edTPA as a portfolio-based assessment that places student learning at the center of a three-step teaching process—planning, instruction, and assessment. Each of these steps is informed by the analysis of data and instructional practice. More broadly, Sato (2014) contends that by providing a common language and common expectations for instruction, edTPA conceptualizes teaching as a professional practice, both for candidates and for the teacher education field. Importantly, this push toward professionalism still allows candidates, in their edTPA portfolios, to enact instruction that is more teacher- or student-centered, instruction that incorporates critical pedagogies, and instruction that demonstrates a commitment to all students (Sato, 2014).
There is a developing body of scholarship examining the implementation of edTPA, the reliability and validity of the instrument, and the implications of edTPA for stakeholders. Regarding implementation, a number of studies have critiqued the roll-out of edTPA in certain EPPs and states (De Voto et al., 2021; Ledwell & Oyler, 2016). Implementation challenges have limited stakeholder buy-in and the impact of the instrument. Beyond implementation, Gitomer and colleagues (2021) raise concerns with the reliability of edTPA scoring and the accuracy of consequential decision-making. Specifically, they argue that SCALE’s annual reports do not rigorously assess the technical properties of edTPA, meaning EPPs and states cannot make informed decisions about its use. Their own analyses suggest that a high number of pass-fail misclassifications are possible and that candidates from historically marginalized groups may be disproportionately affected. This connects to other concerns about edTPA and diversity—that the assessment may limit EPP curriculum (Tuck & Gorlewski, 2016) and that candidates of color are less likely to pass the assessment (Goldhaber, Cowan, et al., 2017).
Multiple studies have examined the content, construct, and predictive validity of edTPA. Content validity analyses indicate that edTPA rubrics are well-aligned with other assessments of teaching—for example, Framework for Teaching and InTASC standards (Sato, 2014). Regarding construct validity, analyses show that edTPA measures three domains of teaching that are well-aligned to the planning, instruction, and assessment tasks (Bastian et al., 2016; SCALE, 2019). Finally, several studies indicate that candidates’ edTPA scores predict their future performance as inservice teachers. For example, initial studies in North Carolina show that higher edTPA scores predict higher value-added estimates and evaluation ratings (Bastian & Lys, 2016; Bastian, 2018). Work in Washington State indicates that those who pass the edTPA have higher value-added estimates in reading (Goldhaber, Cowan, et al., 2017).
Collectively, these studies both challenge and support the use of edTPA. Ultimately, we contend that edTPA scores are an important outcome to assess for several reasons. First, edTPA is a measure of teaching practice that occurs in real P-12 classrooms. Relative to traditional licensure exams, this may mean that edTPA better captures candidates’ readiness to teach. Second, edTPA has been widely adopted, with many states and EPPs using it for consequential decision-making (Putnam & Walsh, 2021). Confirming Sato’s (2014) underlying conception of edTPA, teacher educators report that the instrument supports their curricula (Miller et al., 2015). Third, given reliability concerns (Gitomer et al., 2021), continued research is necessary to inform instrument use. Finally, there is relatively little scholarship on the candidate and programmatic features associated with edTPA scores. Evidence shows that higher grade point averages (GPAs), performance on practice tasks, and attendance at edTPA support sessions predict higher scores (Cash et al., 2019; Williams et al., 2019). To our knowledge, ours is the first study to rigorously assess whether student teaching environments predict candidates’ edTPA scores.
Why Student Teaching Environments May Influence TPA Scores
Student teaching is a valuable opportunity for candidates to observe, learn, and enact teaching practices in authentic P-12 learning environments (Anderson & Stillman, 2013; Ronfeldt & Reininger, 2012). This matters given the robust body of research showing that learning environments that nurture collaborative and high-performing teacher communities benefit the development of inservice teachers (Kraft & Papay, 2014; Louis & Marks, 1998; Reeves et al., 2017; Ronfeldt et al., 2015; Zeichner & Gore, 1990). For example, using data from North Carolina, Kraft and Papay (2014) found that positive professional learning environments accelerate teacher development, as measured by student achievement, and create school cultures with meaningful peer collaboration. Collaboration is related to greater job satisfaction (Reeves et al., 2017), increased student achievement (Ronfeldt et al., 2015), and increased teacher retention (Boyd et al., 2011).
Similarly, an emerging body of research shows that candidates benefit from student teaching in a high-quality learning environment and with a highly effective cooperating teacher (Bastian et al., 2020; Goldhaber, Krieg, et al., 2017; Goldhaber, Krieg, Naito, et al., 2020; Goldhaber et al., 2022; Ronfeldt, 2012, 2015, 2021; Ronfeldt et al., 2018). For instance, in New York City, candidates who student-taught in easier-to-staff schools were 14% to 22% less likely to leave the district in their first 5 years of teaching (Ronfeldt, 2012). In addition, in Washington State, a 1 SD increase in the cooperating teacher value-added is associated with an 18% of a standard deviation increase in the value added of the candidate as an inservice teacher (Goldhaber, Krieg, Naito, et al., 2020). While these findings could be due to candidates sorting into placement sites, initial evidence from random assignment studies shows that candidates assigned to high-quality placements report feeling better prepared to teach (Ronfeldt, Bardelli, Truwit, et al., 2020) and make larger gains in their instructional performance during student teaching (Goldhaber et al., 2022).
As characteristics of student teaching sites and cooperating teachers predict outcomes for early-career teachers, it stands to reason that they may also predict the quality of a candidate’s TPA portfolio. Candidates may learn more by observing high-quality teaching, by receiving high-quality and more frequent feedback, and by interacting with a high-quality and more collaborative teaching community. We hypothesize this learning will translate to the quality of candidates’ edTPA portfolios, such that candidates placed in high-quality learning environments and with more effective cooperating teachers will have higher edTPA scores. Conversely, it is possible that associations between characteristics of the student teaching site and edTPA scores signify challenges in enacting or measuring high-quality instruction in certain environments—for example, schools with many low-income students. Like recent scholarship on inservice teacher evaluation systems, such associations may reflect bias in edTPA scoring (Ronfeldt & Campbell, 2016; Steinberg & Garrett, 2016).
We predict the associations between student teaching environments and edTPA scores will hold across candidates. However, we are particularly interested in two candidate subgroups. First, given recent work showing that candidates with lower GPAs benefit more from high-quality placements (Bastian et al., 2020), we assess whether our results differ by candidate GPA. While GPA is an imperfect proxy of performance, candidates with lower GPAs may benefit more from high-quality placements because they have more knowledge and/or skills to gain. Second, given concerns about the diversity of the teacher workforce and data showing that candidates of color are less likely to pass edTPA (Goldhaber, Cowan, et al., 2017; SCALE, 2019), we assess whether our results differ for White candidates versus candidates who are Black or Hispanic. 2 These subgroup analyses can more granularly inform placement practices and more thoroughly assess whether student teaching environments affect edTPA scores of certain candidates. This may have implications for TPAs and high-stakes decision-making.
Data and Sample
Research Sample
Our analyses focus on 2,842 teacher candidates from 13 universities in North Carolina. These candidates completed an edTPA portfolio in the 2015–2016, 2016–2017, or 2017–2018 academic years as part of a traditional student teaching experience—that is, completed prior to graduation and becoming an inservice teacher. As shown in the top panel of Table 1, 83% of the candidates in our sample are female, 85% are White, and the average GPA of these candidates is 3.58. Eighty-six percent of these candidates were in an undergraduate teacher education program and approximately 75% completed their edTPA in the spring semester.
Descriptive Data for the Analytical Sample.
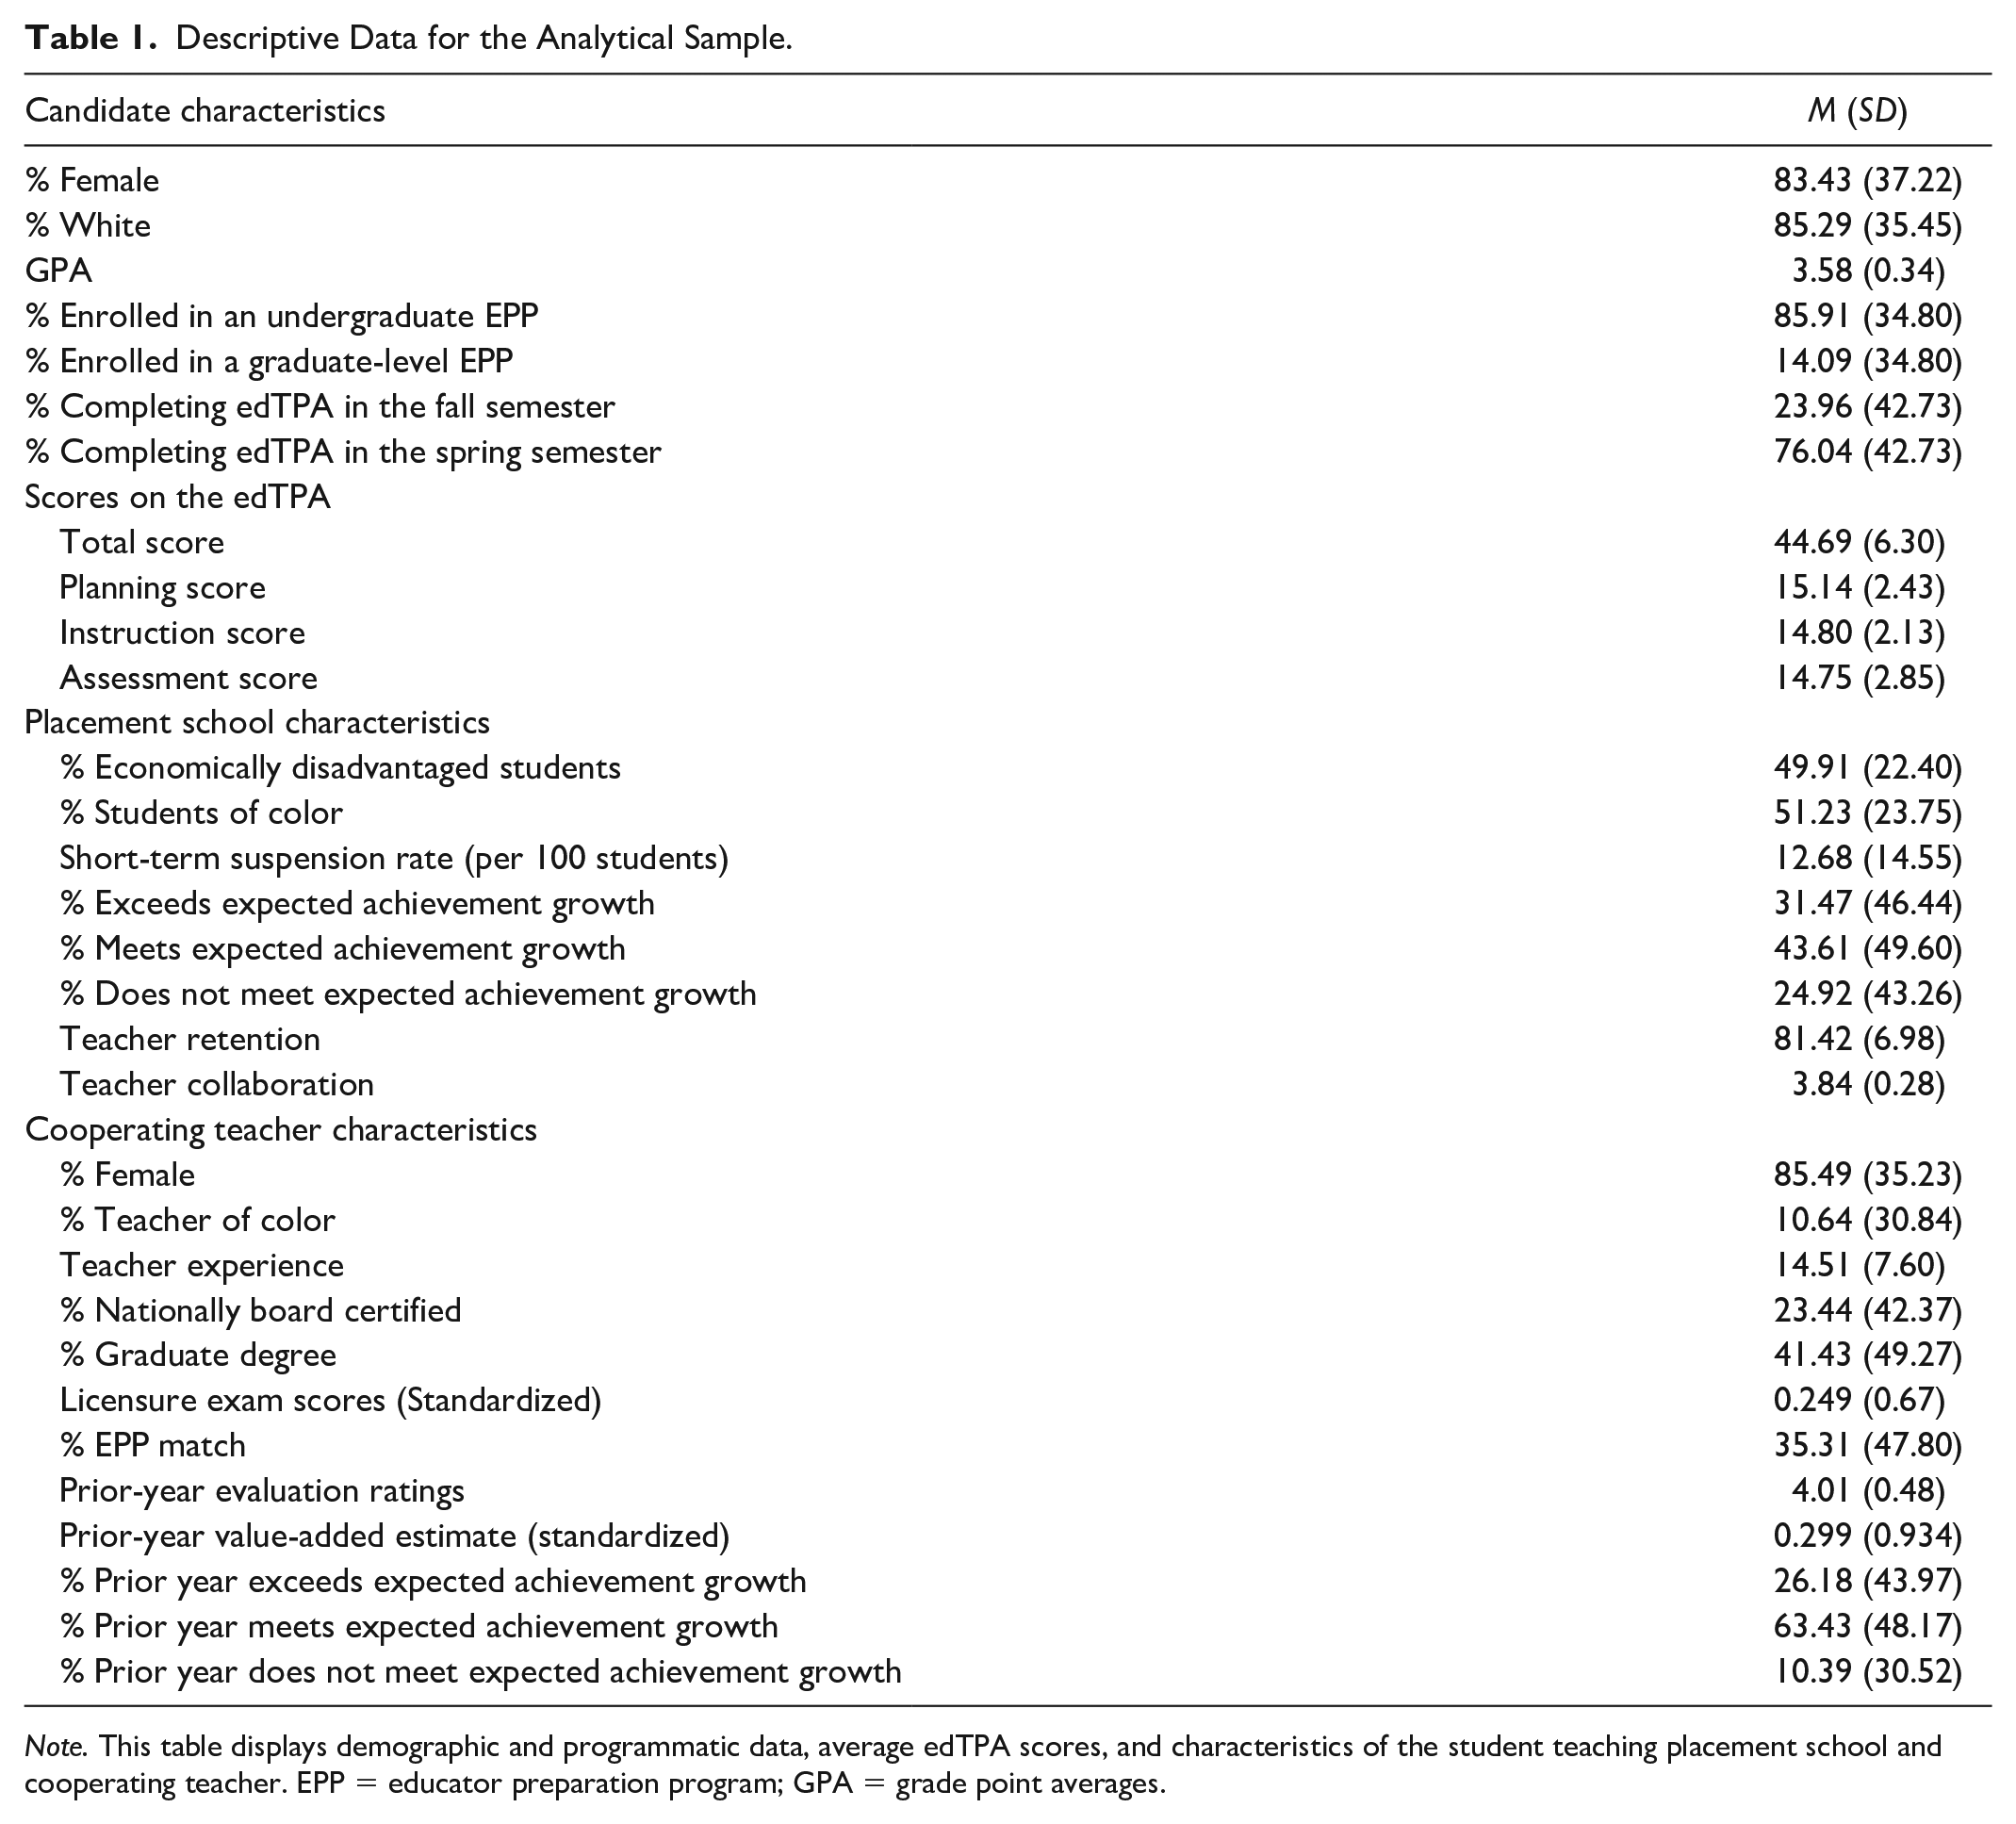
Note. This table displays demographic and programmatic data, average edTPA scores, and characteristics of the student teaching placement school and cooperating teacher. EPP = educator preparation program; GPA = grade point averages.
With administrative data from the North Carolina Department of Public Instruction (NCDPI), we link these candidates to characteristics of their student teaching school and cooperating teacher. Nearly 94% of the candidates in our sample had a student teaching experience in only one placement school and with only one cooperating teacher. Approximately 6% of the candidates in our sample had two cooperating teachers—either at the same placement school or at two separate placement schools. We account for these multiple placements/cooperating teachers by weighting each of these candidate observations at 0.50. Teacher candidates with one placement school/cooperating teacher have a weight of 1.
Outcome Measures
For our analyses, we created four outcome measures: (a) the total score, which is the sum of the 15 main edTPA rubrics; (b) the planning score, which is the sum of the five rubrics in the Planning Task; (c) the instruction score, which is the sum of the five rubrics in the Instruction Task; and (d) the assessment score, which is the sum of the five rubrics in the Assessment Task. 3 With these measures, we assess whether placement school and cooperating teacher characteristics influence the edTPA total score, our most policy-relevant outcome, and whether these placements influence certain teaching skills. The second panel of Table 1 presents edTPA scores for the candidates in our sample. Overall, the average total score is 44.69. The average scores for the Planning, Instruction, and Assessment tasks are 15.14, 14.80, and 14.75, respectively. It is important to note that North Carolina did not make edTPA scores consequential for licensure until 2018–2019. As such, during our study period, candidate performance on the edTPA was only subject to EPP-level consequences (e.g., no consequences, scores part of course grades, scores influencing EPP recommendations for licensure).
Characteristics of the Placement School and Cooperating Teacher
Our analyses focus on a range of placement school and cooperating teacher characteristics that shape the learning environment for candidates. Regarding the placement school, we consider the following characteristics: the percentage of economically disadvantaged students and students of color, suspension rates, school achievement growth, teacher retention rates, and a measure of teacher collaboration.
We examine the percentage of economically disadvantaged students and students of color because these may be proxies for educational resources associated with high-quality learning environments (Goldhaber et al., 2015). More specifically, schools serving many low-income students and students of color face structural inequities—for example, less funding, less access to health services—that may lead to opportunity gaps for P-12 students (Adamson & Darling-Hammond, 2012; Baker & Corcoran, 2012). We consider suspension rates because schools in which there are fewer disciplinary incidents may be schools that better promote learning (Noltemeyer et al., 2015). However, in assessing suspension rates as a measure of the learning environment, it is important to note two inter-related limitations of these data: (a) significant differences in school disciplinary practices exist based on student race—that is, students of color are much more likely to be suspended than their White peers (Milner, 2013)—and (b) given principals’ discretion in suspending students, suspension rates may not accurately convey the extent of student misbehavior at a school.
We examine school achievement growth given prior work showing that early-career teachers have higher value-added estimates after student teaching in a high value-added school (Ronfeldt, 2015). We operationalize this measure with indicators for placement schools that exceed, meet, or fail to meet expected achievement growth. 4 We consider teacher retention at the placement site because schools where teachers stay may indicate high-quality learning environments (Ronfeldt, 2012, 2015). We create this measure by excluding retirement-eligible teachers from the sample and calculating the percentage of teachers who return to the same school in the following year. To account for temporal anomalies, we calculate placement school retention rates as 3-year rolling averages and standardize this measure for analyses. Finally, given the connections between teacher collaboration and teacher effectiveness (Ronfeldt et al., 2015; Zeichner & Gore, 1990), we include a teacher-reported measure of collaboration at the placement school. We create this collaboration measure by aggregating to the school level teachers’ responses to four items from a statewide working conditions survey. 5 We standardize this teacher collaboration measure for analyses.
The cooperating teacher characteristics we analyze fall into one of three categories: demographics, credentials, and measures of cooperating teachers’ prior instructional performance. The demographic measures are indicators for female and being a teacher of color. For cooperating teacher credentials, we examine teacher experience, 6 National Board Certification (NBC), graduate degrees, and licensure exam scores (e.g., Praxis II). We include these credentials as they are associated with teacher value-added, and as such, may identify high-quality learning environments for candidates (Clotfelter et al., 2007; Cowan & Goldhaber, 2016; Papay & Kraft, 2015). We also consider whether the cooperating teacher was prepared by the same university as the candidate. Alumni of the same EPP may create richer learning environments for candidates if they are more familiar with EPP coursework and practices.
Finally, for measures of cooperating teachers’ prior performance, we assess their evaluation ratings and value-added estimates. We focus on the prior performance of the cooperating teacher—rather than current-year performance—because hosting a candidate may influence cooperating teacher effectiveness (Goldhaber, Krieg & Theobald, 2020; Ronfeldt, Bardelli, Brockman, 2020). Our evaluation measure is an average of the two teaching standards—Leadership and Facilitating Student Learning—upon which all North Carolina teachers are evaluated on an annual basis. 7 For cooperating teacher value-added, we examine Education Value-Added Assessment System (EVAAS) estimates, the state’s official value-added measure. 8 These estimates come from statewide tests in K-2 reading, mathematics and reading in Grades 3–8, science in Grades 5 and 8, and end-of-course and final exams in a range of secondary subject-areas (e.g., Algebra I, Earth Science). We standardize these EVAAS estimates within test and year across all North Carolina teachers. When available, we control for an average of cooperating teachers’ evaluation ratings and value-added estimates from the previous two school years. If 2 years of prior data are not available, we control for 1 year of prior evaluation ratings and value-added estimates. 9 In further analyses, we replace the continuous value-added measure with indicators for whether, in the previous year, the cooperating teacher failed to meet, met, or exceeded expected achievement growth.
The bottom panels of Table 1 display the placement school and cooperating teacher characteristics for our analytical sample. On average, candidates student-taught in schools where approximately 50% of the P-12 students were economically disadvantaged or students of color. Almost 33% of the placement schools exceeded expected achievement growth; 25% did not meet expected growth. Teacher retention rates were nearly 82% and the average value for our teacher collaboration construct was 3.84 on a 1–5 scale. Demographic data indicate that the cooperating teachers were overwhelming female and White. These cooperating teachers were also relatively experienced and well-credentialed—the average years of experience were 14.5, many held NBC or a graduate degree, and licensure exam scores were 25% of a standard deviation above the statewide mean. Effectiveness data show that, on average, cooperating teachers had prior-year evaluation ratings of “accomplished” (Level 4) and prior-year value-added estimates 30% of a standard deviation above the statewide mean.
Analyses
We aim to isolate the associations between placement school and cooperating teacher characteristics and the edTPA scores of candidates. To accomplish this, we must account for two threats to the validity of our estimates. First, it is possible that candidates who will score higher on edTPA, regardless of their student teaching placement, sort into high-quality learning environments. For example, candidates who will score higher on edTPA may be more likely to have a highly effective cooperating teacher. To evaluate this concern, Table 2 displays placement school and cooperating teacher characteristics by the cumulative GPA of candidates and for White candidates versus Black and Hispanic candidates. These comparisons are particularly salient given prior work on the benefits of high-quality learning environments for candidates with lower GPAs (Bastian et al., 2020) and given concerns about edTPA pass rates for candidates of color (Bastian, 2018; Goldhaber, Cowan, et al., 2017).
Placement School and Cooperating Teacher Characteristics by Candidate GPA and Candidate Race/Ethnicity.
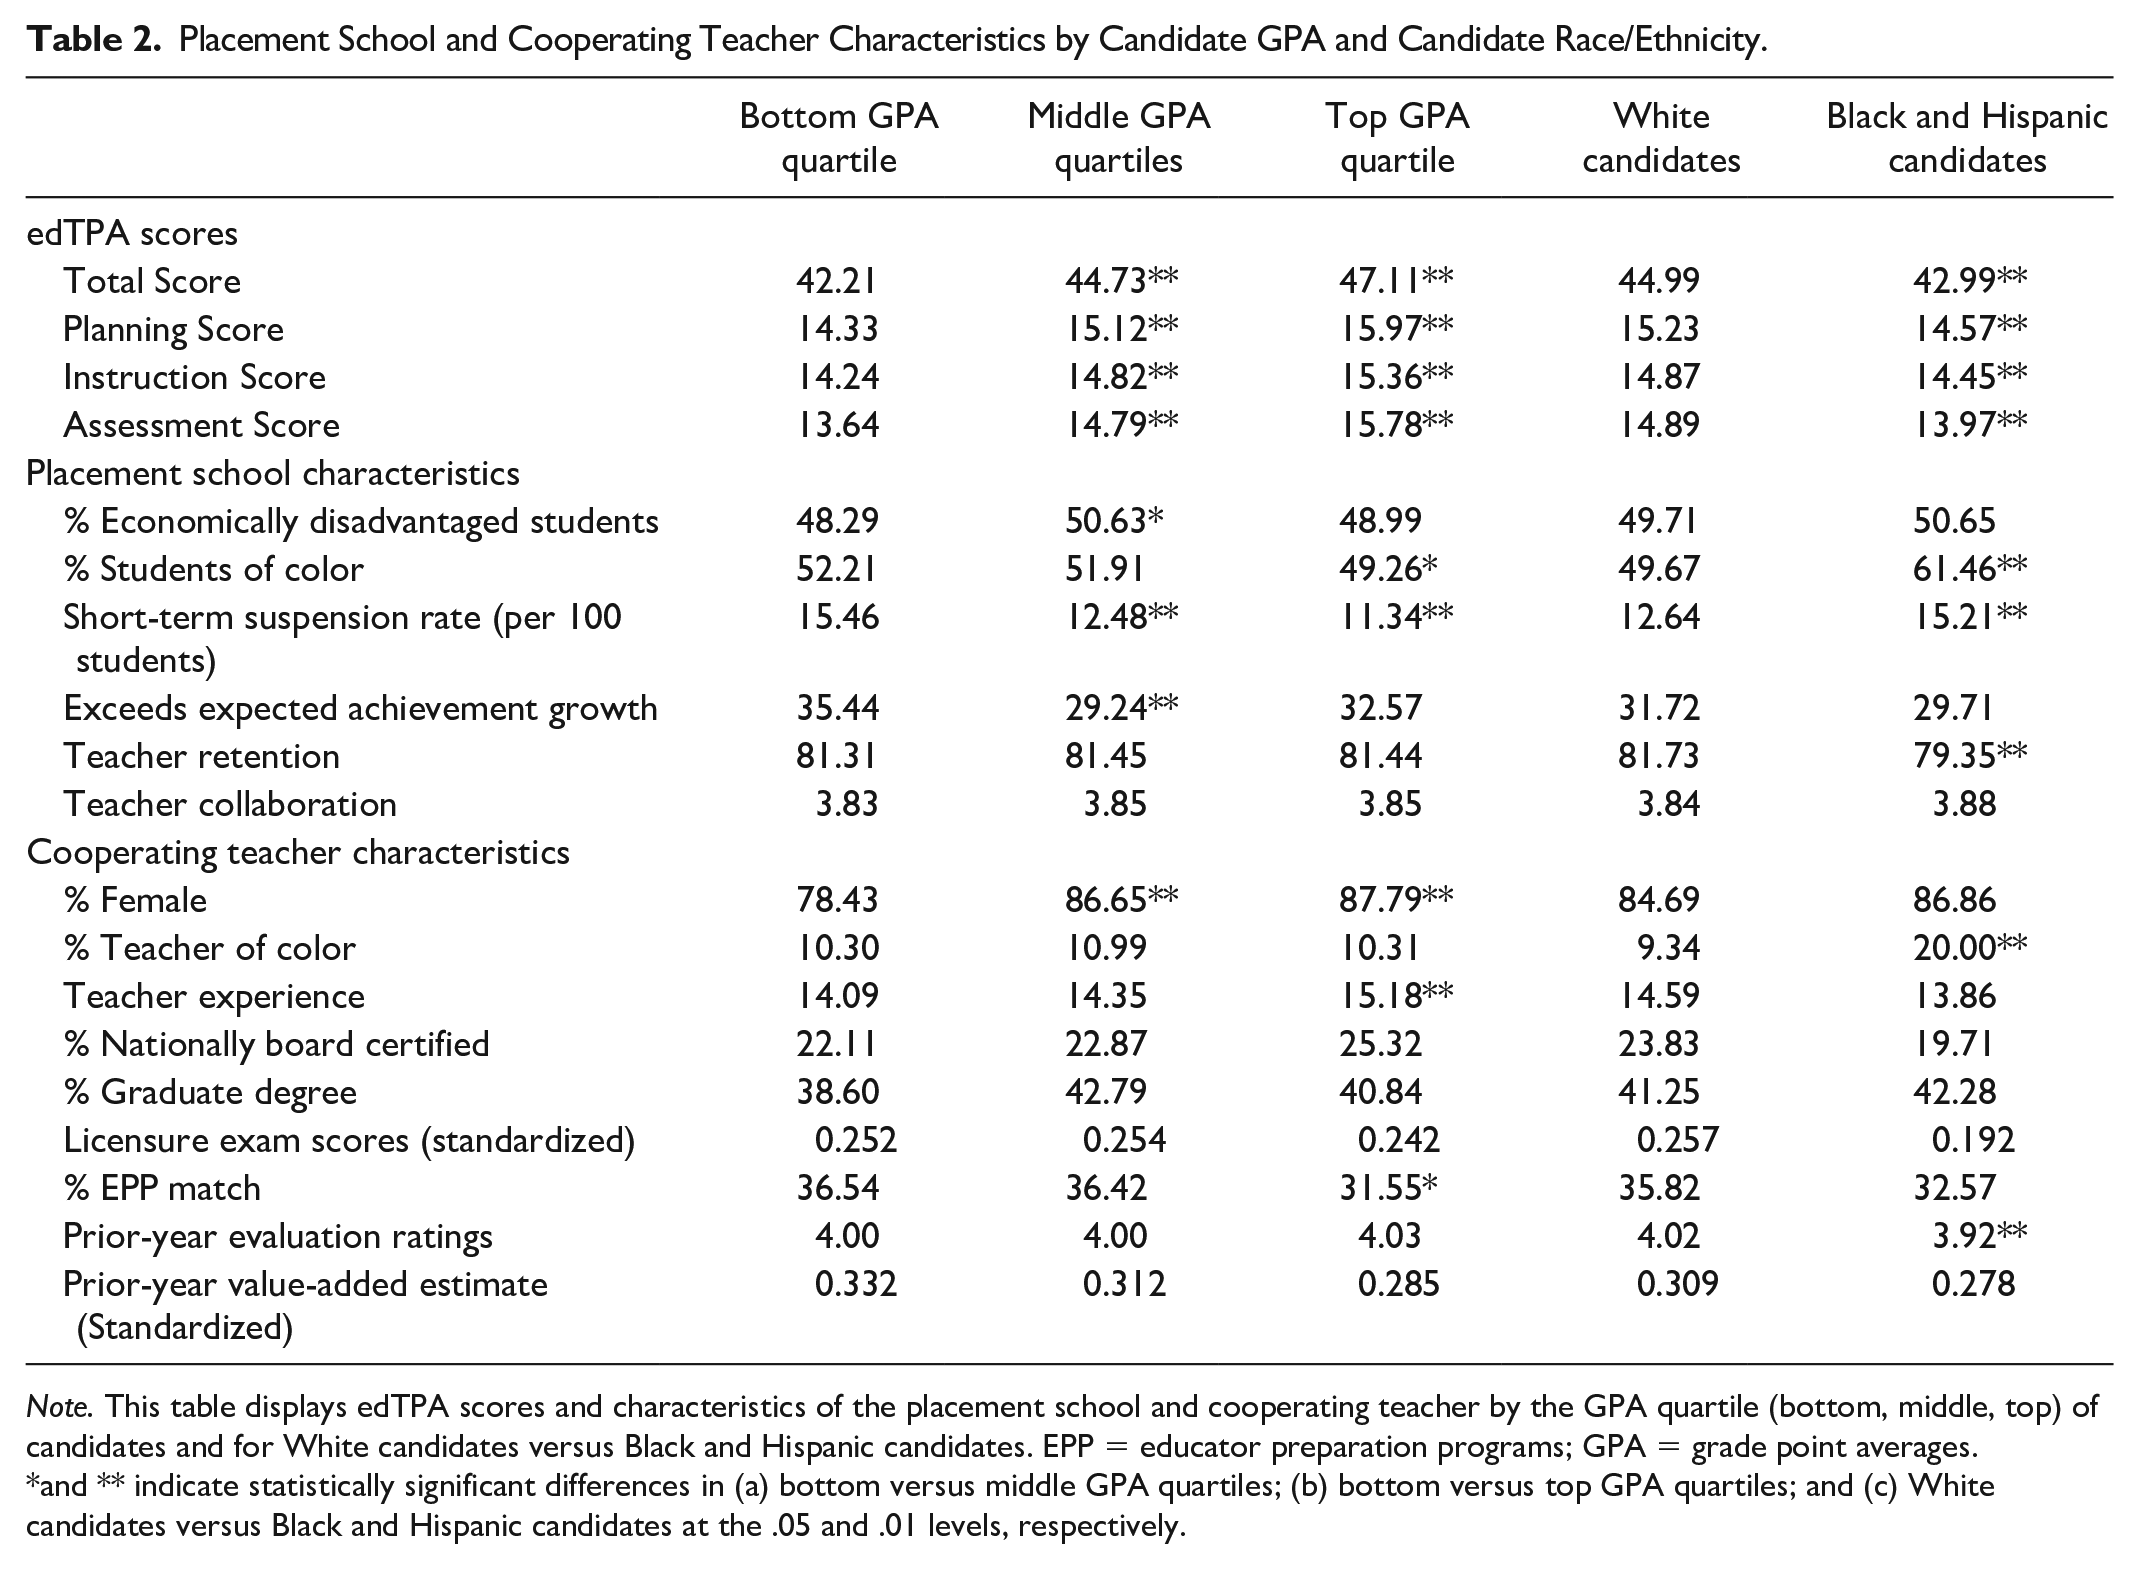
Note. This table displays edTPA scores and characteristics of the placement school and cooperating teacher by the GPA quartile (bottom, middle, top) of candidates and for White candidates versus Black and Hispanic candidates. EPP = educator preparation programs; GPA = grade point averages.
and ** indicate statistically significant differences in (a) bottom versus middle GPA quartiles; (b) bottom versus top GPA quartiles; and (c) White candidates versus Black and Hispanic candidates at the .05 and .01 levels, respectively.
The top panel of Table 2 shows that candidates with higher GPAs 10 earn higher edTPA scores. Similarly, White candidates have higher edTPA scores than Black and Hispanic candidates. The middle and bottom panels of Table 2 indicate that there are some differences in student teaching environments based on candidate GPA or race/ethnicity. For example, Black and Hispanic candidates student-teach in schools with more students of color and are more likely to have a cooperating teacher of color. These panels also indicate that candidates do not sort into dramatically different student teaching environments based on their GPA or race/ethnicity. There are no differences in cooperating teachers’ prior-year evaluation ratings and value-added estimates across candidate GPA. Black and Hispanic candidates have cooperating teachers with comparable value-added estimates and slightly lower evaluation ratings. 11 These similarities in placement site and cooperating teacher characteristics lessen our concern that candidates sort into high-quality learning environments based on observable characteristics.
Second, it is possible characteristics of EPPs will confound our estimates. In particular, it is possible that candidates who student-teach in high-quality learning environments may enjoy other high-quality preparation experiences—for example, recruitment and selection practices, coursework, early field experiences, coaching during student teaching, and support for completing the edTPA portfolio. These experiences, rather than characteristics of the placement school and cooperating teacher, may explain differences in edTPA scores.
Considering these threats to validity, our preferred analytical approach is a linear regression model controlling for candidate characteristics and an EPP fixed effect. We also estimate a model that omits the EPP fixed effect and allows us to compare between and within EPPs. 12 The candidate characteristics include demographics (female and candidate of color), cumulative GPA (standardized within EPP and year), degree level, edTPA handbook area fixed effects, and year fixed effects. Although Table 2 suggests sorting into placement sites is not a serious concern, we control for candidate demographics and cumulative GPA to address potential selection biases. Most importantly, by including an EPP fixed effect, we control for selection into programs and account for other, time-invariant programmatic factors that may bias our results. As such, our preferred models assess the extent to which variation in placement school and cooperating teacher characteristics, within EPPs, predicts variation in edTPA scores of candidates from the same EPP.
For each of our four outcome measures—total, planning, instruction, and assessment scores—we estimate a primary model that includes all placement school and cooperating teacher characteristics except cooperating teacher value-added. Because only a subset of cooperating teachers has prior-year value-added data, we estimate an additional set of models including this measure (along with the other candidate, placement school, and cooperating teacher characteristics). To complement this approach, we conduct bivariate analyses in which the outcome is the edTPA total score and we enter each placement school or cooperating teacher characteristic into a separate model. These bivariate models also control for candidate characteristics and an EPP fixed effect. We prefer models that include all placement school and cooperating teacher characteristics because this approach allows us to identify the conditional associations between student teaching environments and edTPA scores. We contend that these conditional associations better inform policy and practice decisions because they more fully isolate the independent effect of a given student teaching characteristic.
We specify our preferred regression equation below. Here,
Results
Do Characteristics of Placement Sites and Cooperating Teachers Predict Candidates’ edTPA Scores?
Tables 3 and 4 present results from models that include all placement school and cooperating teacher characteristics. Regarding demographics at the placement school, Table 3 shows that an increase in economically disadvantaged students predicts significantly lower edTPA scores. Estimates from our EPP fixed-effect models show that a 10 percentage point increase in the percentage of economically disadvantage students at the placement school is associated with a reduction of approximately 0.16 points in the total score and 0.06 points in the instruction and assessment scores. These results are statistically significant but modest in size. For instance, a reduction of 0.16 points is 2.5% of a standard deviation in the total score. Results for the percentage of students of color are generally insignificant. However, a 10 percentage point increase in the percentage of students of color predicts slightly higher assessment scores.
Placement School Characteristics and edTPA Scores.
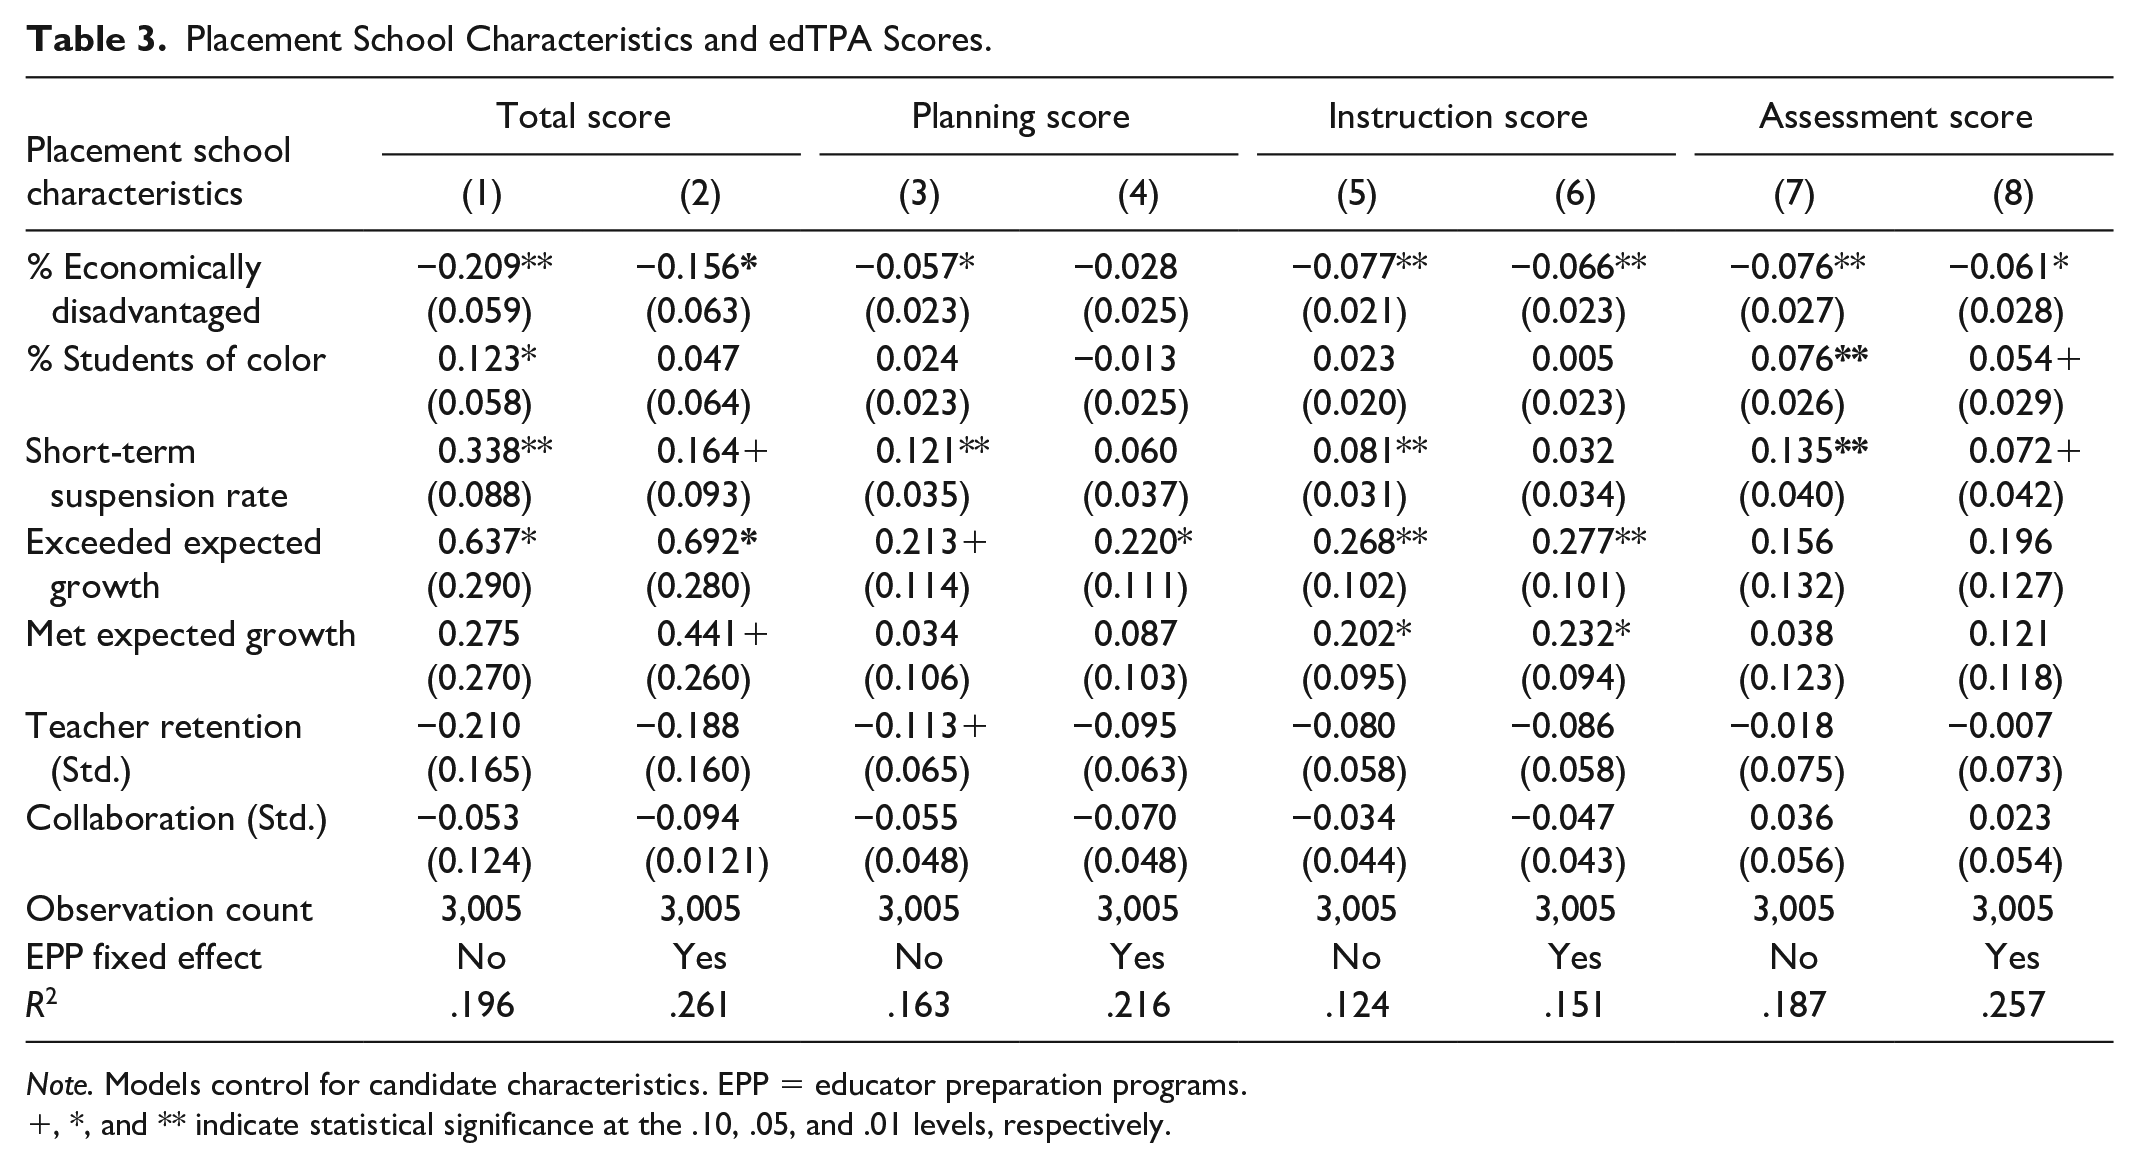
Note. Models control for candidate characteristics. EPP = educator preparation programs.
, *, and ** indicate statistical significance at the .10, .05, and .01 levels, respectively.
Cooperating Teacher Characteristics and edTPA Scores.
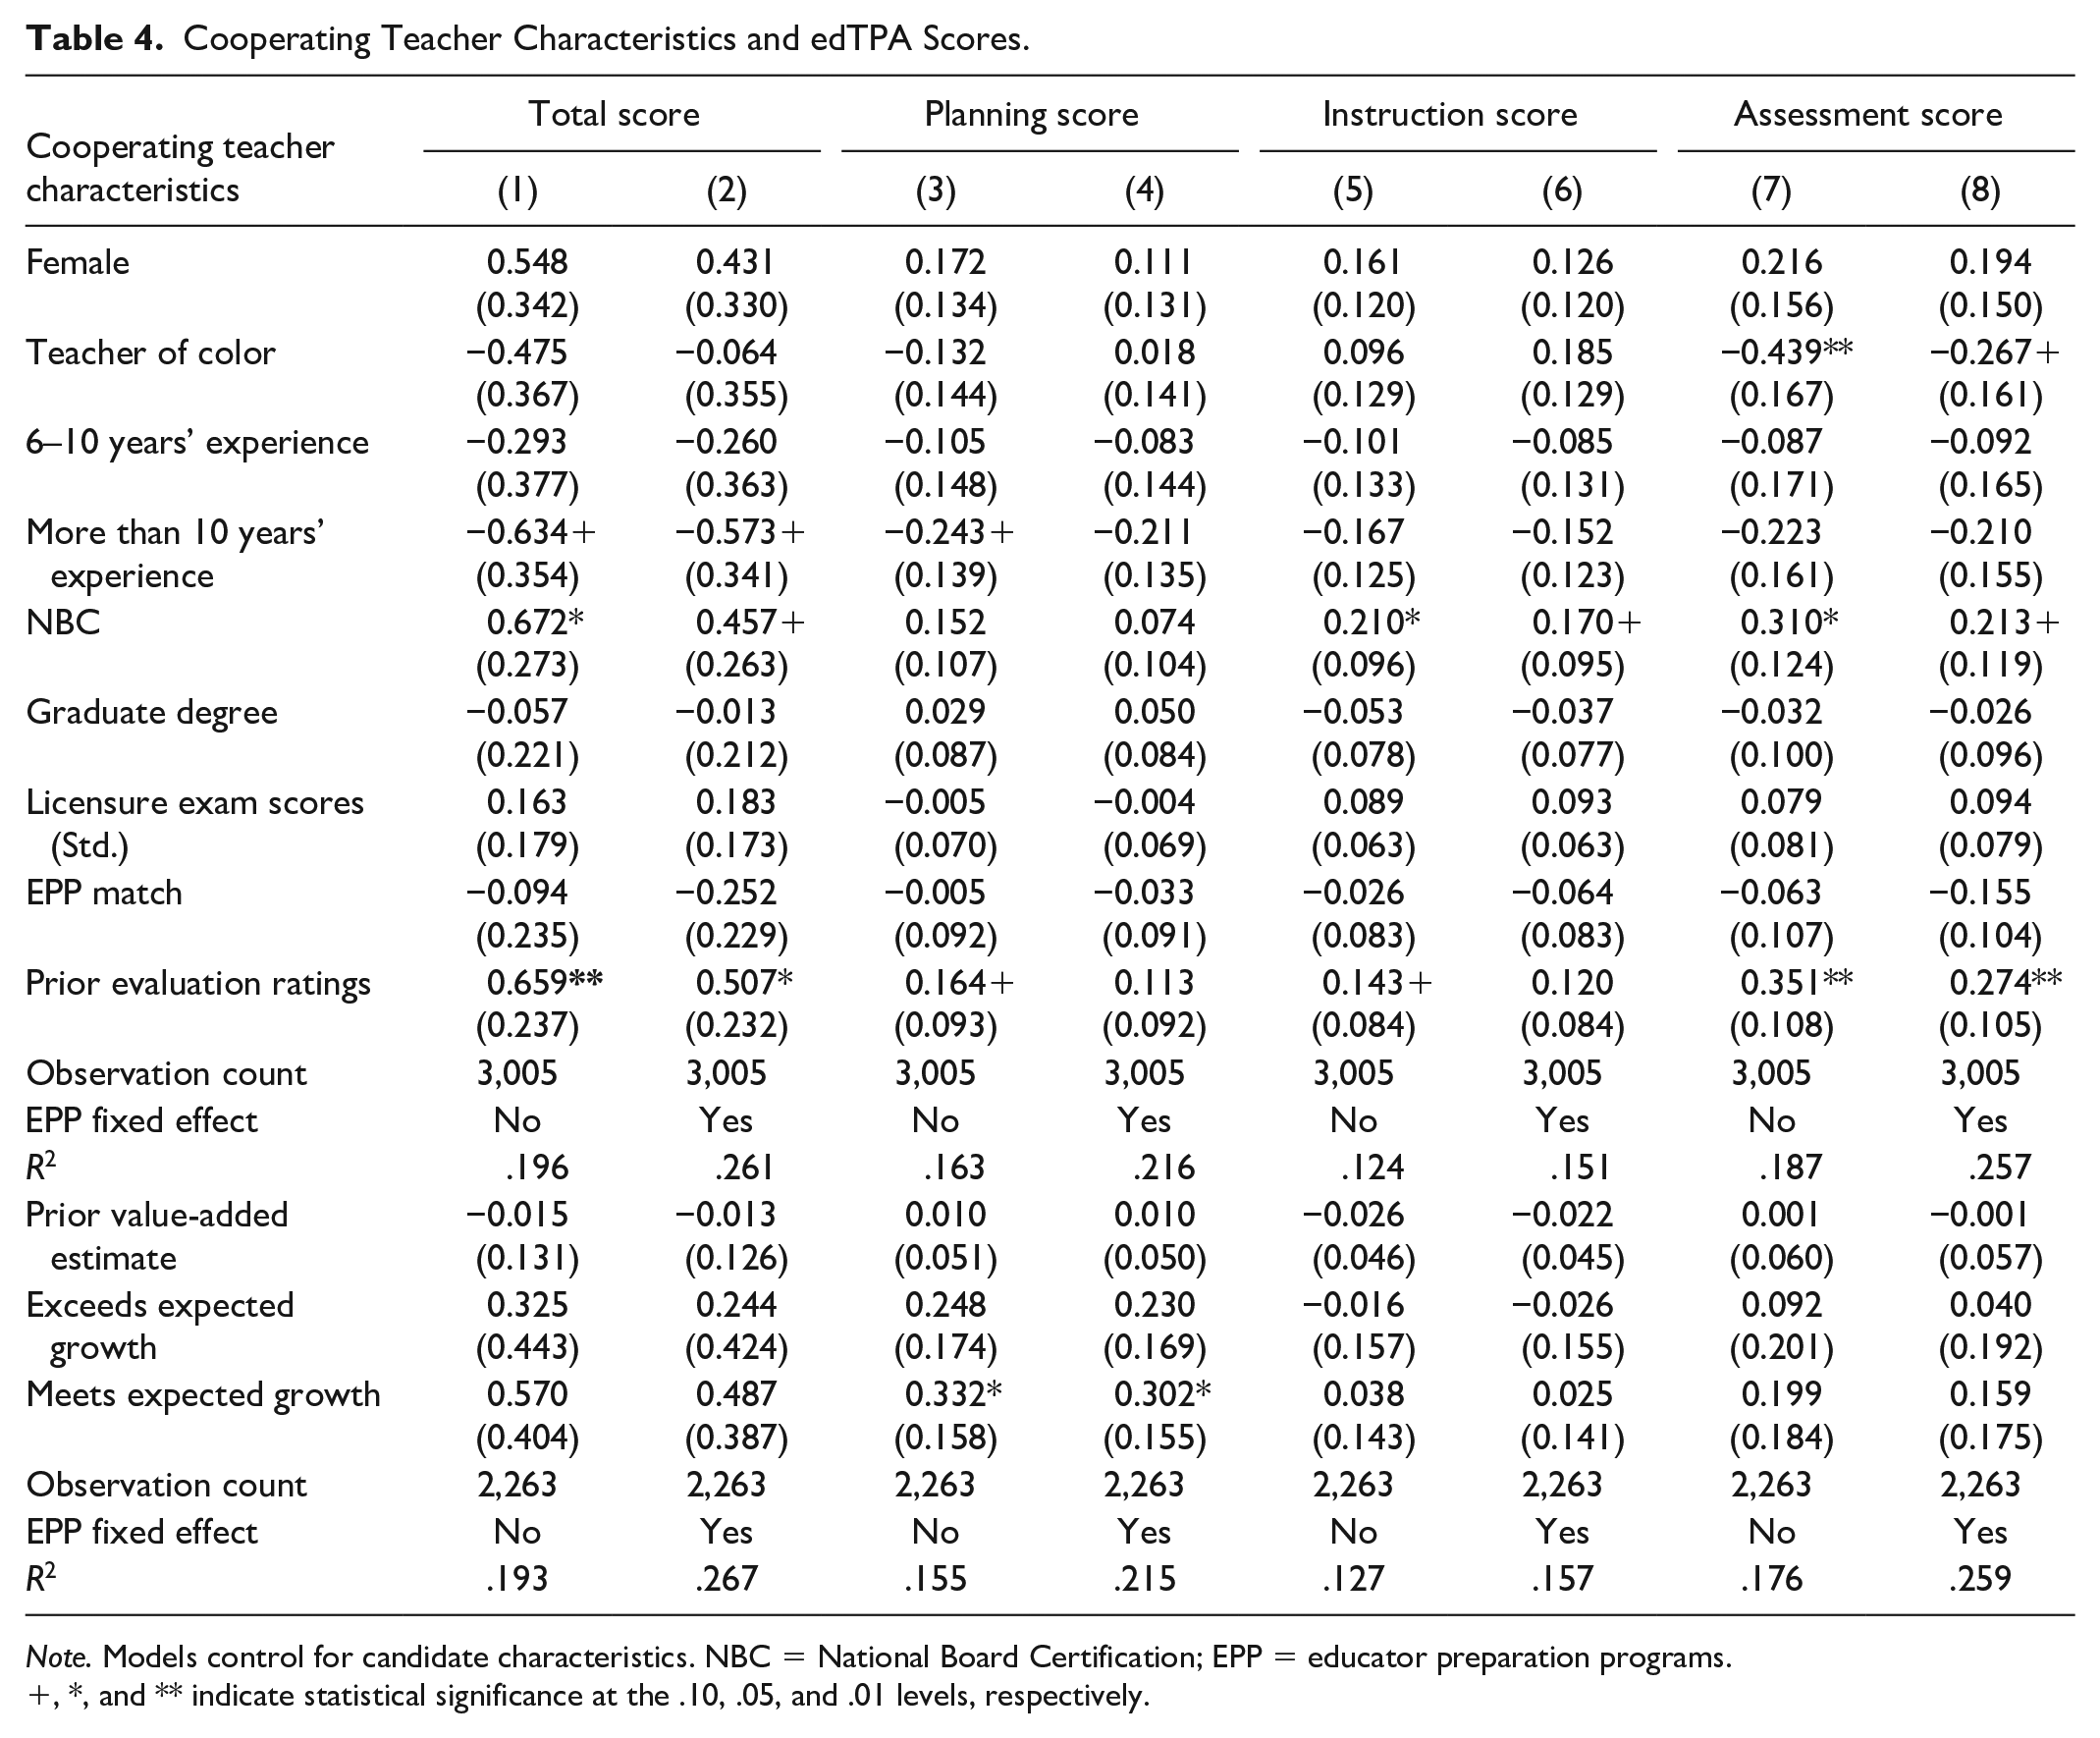
Note. Models control for candidate characteristics. NBC = National Board Certification; EPP = educator preparation programs.
, *, and ** indicate statistical significance at the .10, .05, and .01 levels, respectively.
Regarding disciplinary incidents at the placement school, we find that an increase in suspension rates is associated with higher edTPA scores. These results are robust for the total and assessment scores in our covariate adjustment and EPP fixed-effect models. For example, an increase in suspensions from 12.68 per 100 students—the mean in our sample—to 22.68 per 100 students is associated with a total score 0.16 points higher and an assessment score 0.07 points higher. Despite the modest size, these results are surprising, as we expected lower edTPA scores in placement schools with more documented student conduct issues. Once again, it is important to note the systemic bias in student disciplinary referrals (Milner, 2013) and the concern that certain principals may be more likely to suspend students for offenses that are managed differently at other schools. Suspension rates may not accurately convey what we wish to measure. The suspension estimates are smaller in magnitude and statistically insignificant in our bivariate analyses (available in the Online Appendix). Among observationally similar placements, higher suspension rates predict slightly higher edTPA scores. The differences between our preferred (conditional) and bivariate analyses suggest that EPPs should be cautious in how they consider school suspension rates in their placement decisions.
Our most robust estimates are for the achievement growth status (school value-added) of the placement school. Like prior work showing that early-career teachers are more effective if they student-taught in a high value-added school (Bastian et al., 2020; Ronfeldt, 2015), we find placement school value-added predicts edTPA scores. Comparing within EPPs, we find candidates who student-taught in a placement school that exceeded expected achievement growth have edTPA total scores nearly 0.70 points higher than peers who student-taught in a school that did not meet expected growth. This is 11% of a standard deviation in the total score. These candidates also have planning and instruction scores that are 0.22 and 0.28 points higher than candidates who student-taught in a school that did not meet growth. Estimates from EPP fixed-effect models indicate candidates who student-taught in a placement school that met expected growth also have higher total and instruction scores than peers who student-taught in schools that did not meet growth.
Table 4 presents edTPA estimates for the demographics, credentials, and prior instructional performance of cooperating teachers. Most demographic estimates are statistically insignificant. The exception is that candidates score lower on the assessment task, by 0.27 points, when matched to a cooperating teacher of color. In model extensions, shown in the next section, we separately assess this relationship for White candidates and for Black or Hispanic candidates.
Estimates for cooperating teacher credentials reveal two noteworthy findings. First, estimates suggest having a more experienced cooperating teacher does not benefit the edTPA scores of candidates. In these analyses, cooperating teachers with less than 6 years of experience are the reference group and we insert indicators for cooperating teachers with 6–10 and greater than 10 years of experience. Comparing within EPPs, we find that candidates matched to an experienced cooperating teacher (greater than 10 years) score lower on edTPA, by nearly 0.60 points, than peers matched to a cooperating teacher in their early-career period. These experience estimates are smaller in magnitude and statistically insignificant in our bivariate analyses (available online). It is only when accounting for other characteristics of the placement school and cooperating teacher that cooperating teacher experience predicts lower edTPA scores. Given these differences in results, we contend that EPPs should consider a range of cooperating teacher characteristics—not just experience—when making placement decisions. Second, results indicate that candidates matched to a cooperating teacher who is Nationally Board Certified score higher, overall and on the instruction and assessment tasks, than peers whose cooperating teacher is not Nationally Board Certified. These candidates have total scores 0.46 points higher and instruction and assessment scores 0.17 and 0.21 points higher, respectively. Once again, these estimates are relatively modest in size—approximately 7.5% of a standard deviation in edTPA scores. However, they suggest that candidates learn more about quality instruction and the completion of their edTPA portfolio from inservice teachers who have successfully completed an intensive portfolio assessment.
Considering the prior effectiveness of cooperating teachers, we return findings that support and differ from previous research. Consistent with Ronfeldt and colleagues (2018), who found that early-career teachers are more effective if their cooperating teacher received higher evaluation ratings, we show that candidates have higher edTPA scores if their cooperating teacher earned higher evaluation ratings. Specifically, a 1-point increase in cooperating teachers’ average prior-year evaluation ratings is associated with an increase of 0.50 points in candidates’ total score and an increase of 0.27 points in their assessment score. These estimates are 8% to 9.5% of a standard deviation in the respective edTPA scores. In addition to evaluation ratings, prior work indicates that early-career teachers are more effective if their cooperating teacher had higher value-added estimates (Goldhaber, Krieg, Naito, et al., 2020; Ronfeldt et al., 2018). We find very little evidence that cooperating teacher value-added predicts candidates’ edTPA scores. Estimates for cooperating teachers’ prior value-added estimates are near zero and statistically insignificant. In alternate models that include indicators for cooperating teachers meeting or exceeding expected achievement growth (relative to cooperating teachers who do not meet growth), we find that candidates earn higher planning scores if their cooperating teacher met expected growth in the prior year. None of the remaining value-added indicators are statistically significant.
Do Results Vary by Candidates’ GPA or Candidate Race/Ethnicity?
The results in Tables 3 and 4 are averages across all of the candidates in our analytical sample. These estimates can inform teacher educators and policymakers as they consider student teaching placements and the role of TPAs in teacher education and licensure. However, it is possible estimates differ based on characteristics of the candidate. That is, candidates with different backgrounds or levels of teaching knowledge/skill may be influenced by the student teaching environment differently. To investigate this possibility, we estimated separate models by candidate GPA (bottom, middle, and top quartiles) and for White candidates versus Black or Hispanic candidates. We focus on these characteristics given recent research showing that candidates with lower GPAs especially benefit from high-quality student teaching environments (Bastian et al., 2020) and given the ongoing concerns regarding TPAs and teacher diversity (Goldhaber, Cowan, et al., 2017; Tuck & Gorlewski, 2016). In these analyses, the edTPA total score is the outcome and we include all placement school and cooperating teacher characteristics. The analyses also control for candidate characteristics and an EPP fixed effect.
There are several noteworthy results in Table 5. Conditional on other placement characteristics, estimates suggest that the benefits of student teaching in a high value-added school (exceeds expected growth) accrue to candidates with higher GPAs and to Black and Hispanic candidates. For example, Black and Hispanic candidates who student-taught in a school that exceeds expected growth have edTPA scores 2.3 points higher than other Black and Hispanic candidates from the same EPP who student-taught in a school that did not meet expected growth. Similarly, candidates from the middle and top GPA quartiles who student-taught in a high value-added school have edTPA scores approximately 1 point higher than peers from the same GPA quartile who student-taught in a school that did not meet growth. Estimates for serving in a high value-added school for White candidates and candidates in the bottom GPA quartile are smaller in magnitude and statistically insignificant.
Heterogeneous Effects by Candidate GPA and Candidate Race/Ethnicity (edTPA Total Score).
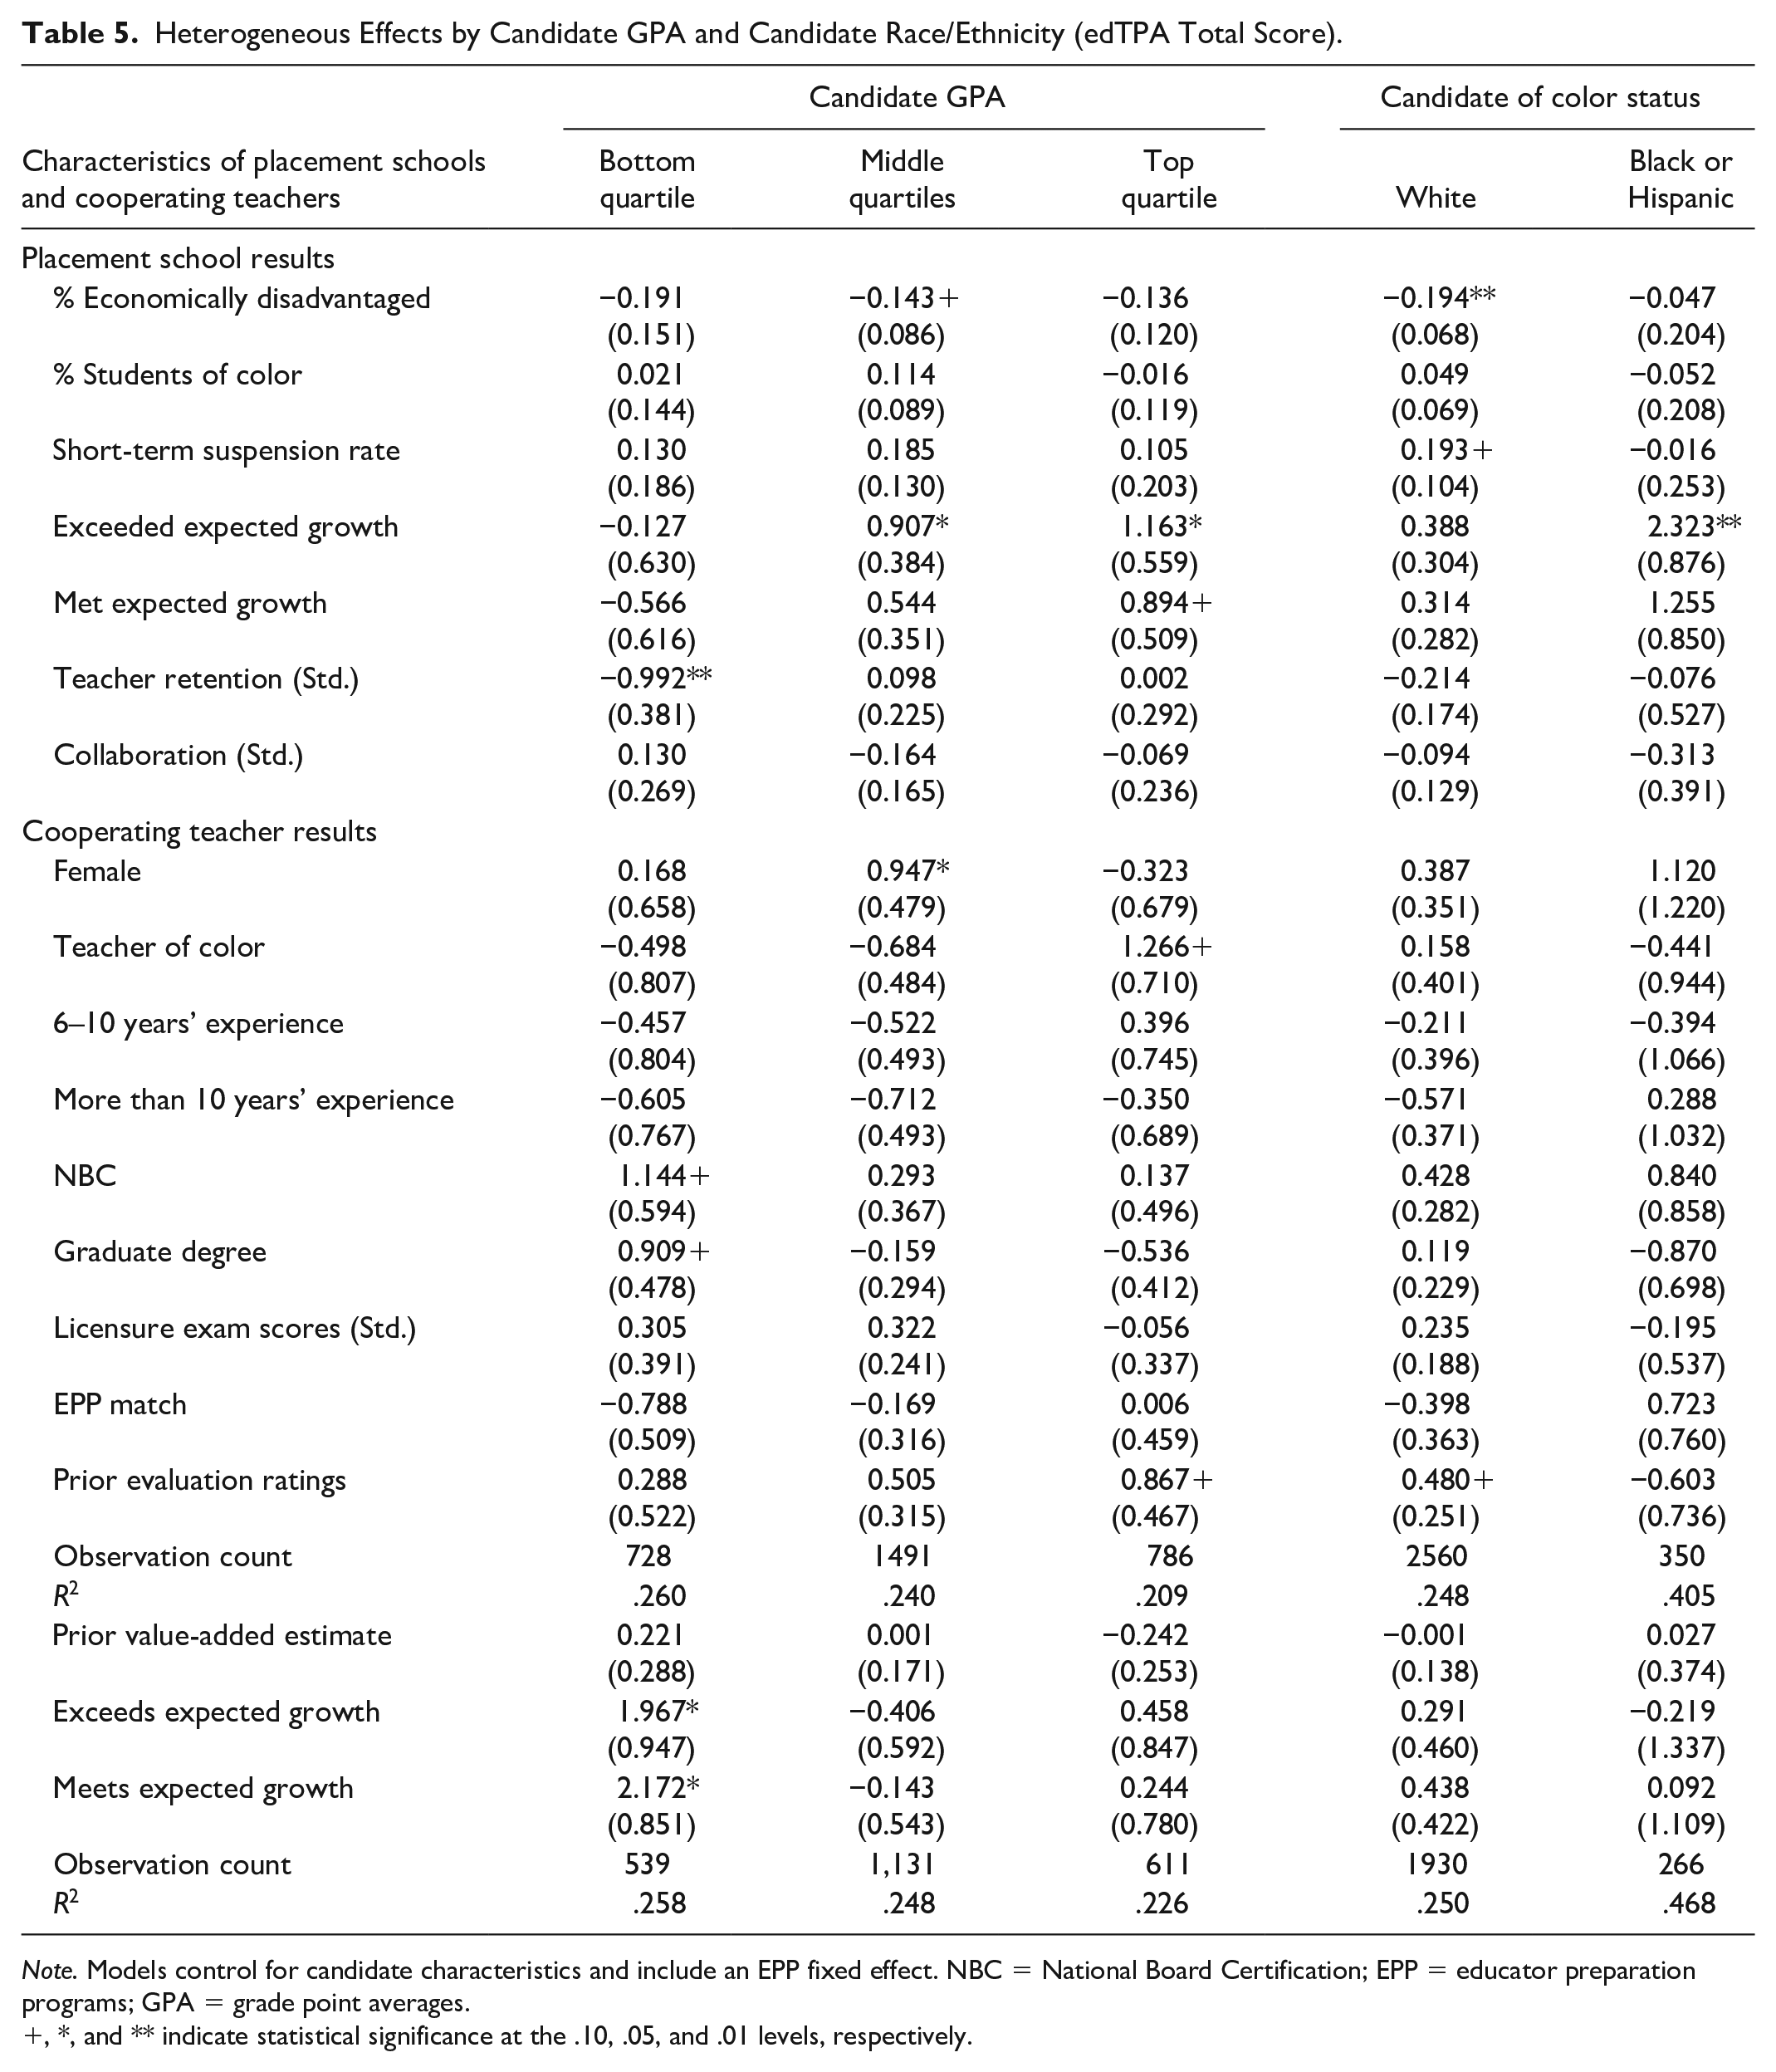
Note. Models control for candidate characteristics and include an EPP fixed effect. NBC = National Board Certification; EPP = educator preparation programs; GPA = grade point averages.
, *, and ** indicate statistical significance at the .10, .05, and .01 levels, respectively.
Regarding cooperating teacher characteristics, estimates indicate that candidates with bottom quartile GPAs particularly benefit from well-credentialed mentors. Relative to others in the bottom GPA quartile, candidates matched to a cooperating teacher with NBC or a graduate degree have edTPA scores 1.1 and 0.90 points higher, respectively. Estimates for the cooperating teacher effectiveness measures indicate candidates in the top GPA quartile especially benefit from a cooperating teacher with higher prior-year evaluation ratings. Candidates in the bottom GPA quartile especially benefit from having a cooperating teacher who met or exceeded expected growth in the previous year. With such a small sample, it is important to be cautious when considering the cooperating teacher estimates for Black and Hispanic candidates. Nonetheless, several of their nonsignificant estimates deserve further investigation, including those for a cooperating teacher of color and for cooperating teacher evaluation ratings.
Discussion
Our analyses are motivated by recent work indicating that inservice teachers who student-taught in high-quality learning environments and with highly effective cooperating teachers are more effective (Goldhaber, Krieg, et al., 2017; Goldhaber, Krieg, Naito, et al., 2020; Ronfeldt, 2012, 2015, 2021; Ronfeldt et al., 2018). This prior work emphasizes the role of learning environments in shaping candidate development. Our analyses are also motivated by an opportunity to further inform placement decisions and to help policymakers and teacher educators consider the role of TPAs in teacher education and licensure. Overall, we identified three key findings.
First, we find that candidates have higher edTPA scores when they student-teach in a high value-added school and when they are matched to a cooperating teacher with higher prior-year evaluation ratings. These results mirror those from prior student teaching research (Goldhaber, Krieg, Naito, et al., 2020; Ronfeldt, 2015; Ronfeldt et al., 2018) and support the notion that high-quality learning environments further the development of candidates. One exception is that we do not find a significant relationship between cooperating teacher value-added and candidates’ edTPA scores. While surprising, this nonsignificant result is consistent with previous work in North Carolina showing that cooperating teacher value-added does not predict inservice teacher performance (Bastian et al., 2020).
Second, we find that candidates have higher edTPA scores when matched to a cooperating teacher who may be more familiar with performance assessments. In particular, candidates matched to a cooperating teacher with NBC earn higher edTPA scores than peers without such a placement. This corresponds to case study results from Kissau and colleagues (2019), who found that cooperating teachers with NBC provide their candidates with more detailed and meaningful feedback on the edTPA. This suggests that candidates may learn more—both about quality instruction and the preparation of a quality TPA—when matched to a cooperating teacher who has successfully completed their own portfolio.
Finally, we return some evidence that the relationships between student teaching environments and edTPA scores may vary by characteristics of the candidate. In particular, candidates with lower GPAs especially benefit from a well-credentialed and effective (as measured by value-added) cooperating teacher. Black and Hispanic candidates especially benefit from student teaching in a high value-added school. Further work must replicate and extend these analyses to confirm their validity and to better understand underlying mechanisms. Nonetheless, these types of subgroup analyses can begin to help EPPs secure more intentional and individualized placements for candidates.
Before considering implications for policy and practice, it is important to review limitations of our work. One potential limitation involves the generalizability of our estimates to other TPAs and implementation contexts. We do not know the extent to which our edTPA results would generalize to other candidate performance assessments (e.g., Praxis Performance Assessment for Teachers [PPAT]). While we hypothesize that placement characteristics would influence scores on other TPAs, further work is necessary to investigate this possibility. Similarly, TPAs did not become consequential for licensure in North Carolina until the 2018–2019 year. As such, during our study period, candidate performance on the edTPA was only subject to a range of local consequences. It is possible that the relationship between placement environments and edTPA scores will change with the presence of higher stakes. 13
A second potential limitation involves clarifying the mechanism(s) explaining our results. Estimates showing that candidates earn lower edTPA scores in placements with more economically disadvantaged students suggest that biases may be present—that is, in such environments, it may be more challenging for candidates to enact the instruction that edTPA expects. This speaks to larger potential concerns about the reliability of edTPA scoring (Gitomer et al., 2021). However, given prior work on the associations between student teaching placements and candidate/teacher performance—including recent random assignment studies—and analyses showing that candidates do not sort into high-quality learning environments (Table 2), we argue that our results are suggestive of candidate learning. Specifically, our results suggest that through exposure to high-quality learning environments—that is, high value-added schools, highly rated teachers, NBC teachers—candidates learn and score higher on their edTPA than they would have without such an experience.
We are reluctant to draw strong conclusions, as our results are exploratory and the mechanisms are suggestive but not fully clear. Nonetheless, there are several implications worth highlighting. To begin, our results further illustrate the value of student teaching placements in high-quality learning environments and with highly effective cooperating teachers. Research now demonstrates that such placements predict outcomes for teacher candidates and inservice teachers. Collectively, these findings emphasize the importance of EPP intentionality in forming closer partnerships with P-12 districts and cooperating teachers and in placing candidates in rich learning environments. This action should benefit candidate learning and future effectiveness. 14
Given our findings, there are also potential implications for how states and EPPs use TPA data. Our key estimates, for high value-added schools, for cooperating teachers with NBC, and for cooperating teacher evaluation ratings, are relatively modest in magnitude. These estimates will not change high-stakes decisions for most candidates. However, for candidates near a cut-score threshold, it is possible that their student teaching placement may influence whether they pass or fail the edTPA. To further understand this concern, we examined the distribution of edTPA scores in North Carolina. Among the 2,842 candidates in our analytical sample, 341 (approximately 12%) were within 2 points of North Carolina’s current cut score of 38. Further analyses show that those within 2 points of the cut score were more likely to be in the bottom GPA quartile and to be a candidate of color. For instance, while Black and Hispanic candidates make up less than 12% of the sample, they comprised nearly 19% of those within 2 points of the cut score. This result is consistent with prior work on certification exams and teacher race/ethnicity (Cowan et al., 2020; Goldhaber & Hansen, 2010) and suggests that high-stakes licensure decisions may be disproportionately impacted for certain candidates.
Moving forward, if research continues to find associations between student teaching environments and TPA performance, states and EPPs could consider statistical adjustments to TPA scores. For example, to the extent that cooperating teacher quality differs across candidates, states could credit/increase the TPA score of candidates with a less effective cooperating teacher. This would fit with a mechanism of candidate learning—that is, certain candidates had an opportunity to learn more about effective instruction given their placement—and would be consistent with proposals to adjust the evaluation ratings of inservice teachers based on characteristics of their work environment (Campbell & Ronfeldt, 2018; Steinberg & Sartain, 2021). As a next step, we invite additional research in different contexts and with qualitative and quantitative analyses. Better understanding mechanisms and generalizability will further inform the placement decisions of EPPs and the use of TPAs by states and EPPs.
Supplemental Material
sj-docx-1-jte-10.1177_00224871221105814 – Supplemental material for Does Placement Predict Performance? Associations Between Student Teaching Environments and Candidates’ Performance Assessment Scores
Supplemental material, sj-docx-1-jte-10.1177_00224871221105814 for Does Placement Predict Performance? Associations Between Student Teaching Environments and Candidates’ Performance Assessment Scores by Kevin C. Bastian, Diana B. Lys and Waverly R. L. Whisenant in Journal of Teacher Education
Footnotes
Acknowledgements
We would like to thank the University of North Carolina System and the North Carolina Department of Public Instruction for providing the administrative data for these analyses.
Declaration of Conflicting Interests
The author(s) declared no potential conflicts of interest with respect to the research, authorship, and/or publication of this article.
Funding
The author(s) received no financial support for the research, authorship, and/or publication of this article.
Supplemental Material
Supplemental material for this article is available online.
Notes
Author Biographies
References
Supplementary Material
Please find the following supplemental material available below.
For Open Access articles published under a Creative Commons License, all supplemental material carries the same license as the article it is associated with.
For non-Open Access articles published, all supplemental material carries a non-exclusive license, and permission requests for re-use of supplemental material or any part of supplemental material shall be sent directly to the copyright owner as specified in the copyright notice associated with the article.