
Abstract
We link student teaching placement and K-12 administrative data from North Carolina to better understand the contexts in which educator preparation programs (EPPs) and K-12 districts make placements and the factors that predict whether EPPs and districts make placements with a highly effective teacher. Our work builds on two key findings from prior literature—cooperating teachers (CTs) are critically important to the development of preservice teachers (PSTs) and information asymmetries between EPPs and districts complicate the placement process. We find that there is significant variation across EPPs in their access to highly effective teachers and that there are opportunities to place many more PSTs with a highly effective teacher. Multiple measures of prior relationships, such as the EPP having recently placed with the CT and the CT being an alumnus of the EPP, predict the likelihood of EPPs and districts placing with a highly effective teacher.
Introduction
Each year, educator preparation programs (EPPs) and school districts across the United States must make student teaching placements for approximately 125,000 preservice teachers (PSTs; Title II Data Tools, 2023). This is time-consuming and logistically challenging work—undertaken by university field placement coordinators, K-12 district office personnel, and school principals—that is critical to the development of PSTs. In particular, high-quality placements matter for several reasons. First, student teaching is widely regarded as the most important component of preservice teacher preparation (Anderson & Stillman, 2013; Ronfeldt & Reininger, 2012). Through student teaching, PSTs get authentic, practice-based opportunities to refine their instruction and become better prepared for the rigors of inservice teaching. Second, findings from the last decade show that early-career teachers are more effective if they student taught with a highly effective cooperating teacher (CT; Bastian et al., 2022; Goldhaber, Krieg, & Theobald, 2020; Ronfeldt, Brockman, & Campbell, 2018). PSTs learn more from highly effective CTs and this knowledge impacts their future performance.
While the evidence is clear regarding the importance of placements with highly effective teachers, there is not a sufficient understanding of the context in which EPPs and school districts make placement decisions or the factors that predict whether EPPs and school districts make placements with highly effective teachers. As such, there is a need to further assess the student teaching placement process. This includes a need to examine EPPs’ access to highly effective teachers, to determine the frequency with which EPPs and school districts make placements with highly effective teachers, and to identify the underlying conditions that make placements with highly effective teachers more likely to occur. Such information can advance the placement practices of EPPs and school districts, accelerate the development of PSTs, and have longer-term benefits for K-12 students.
In the present study, we focus on student teaching placements with highly effective teachers. PSTs spend a significant amount of time observing, planning, co-teaching, and reflecting with their CT. Robust evidence—including causal studies—supports the importance of CTs to PST outcomes (Goldhaber et al., 2022; Ronfeldt, Goldhaber, et al., 2018; Ronfeldt & Reininger, 2012). With a focus on highly effective teachers, we address gaps in the student teaching literature by answering the following questions: (1) Are there differences across EPPs in access to highly effective teachers for student teaching placements? (2) Are there differences across EPPs in the selection of highly effective teachers for student teaching placements? (3) What predicts student teaching with a highly effective teacher?
For this work we define access as the ratio of highly effective teachers to student teachers in geographic proximity to an EPP and selection as whether an EPP and school district places a PST with a highly effective teacher. We are interested in whether access predicts the selection of a highly effective teacher—noting challenges in placement processes and the autonomy that K-12 schools and teachers have in deciding to host a PST. Given information asymmetries between EPPs and school districts that complicate the placement process (St. John et al., 2021), we are also interested in whether measures of EPP-district relationships predict the selection of highly effective teachers. Our underlying hypothesis is that relationships between EPPs and districts will facilitate knowledge sharing that reduces information asymmetries and helps EPPs and districts select highly effective teachers.
To answer our research questions, we link student teaching placement and K-12 administrative data from North Carolina. Overall, our analyses reveal three key takeaways. First, there is significant variation across EPPs in their access to highly effective teachers. Relative to the number of student teaching placements needed, some EPPs have a deep bench of highly effective teachers in close proximity. For others, there are relatively few highly effective teachers near the EPP. Second, there is room for improvement regarding the percentage of PSTs placed with a highly effective teacher. Some EPPs and districts place many more PSTs with a highly effective teacher than expected, given the number of highly effective teachers in geographic proximity. Other EPPs and districts place at a rate commensurate with the percentage of highly effective teachers in the surrounding area. Finally, we find little evidence that access predicts the selection of highly effective teachers. However, several measures of EPP-district relationships are related to placements with a highly effective teacher. In particular, EPPs and school districts are more likely to place with a highly effective teacher if the respective teacher has served as a CT in recent years and if the respective teacher is an alumnus of the EPP. We acknowledge that there are meaningful challenges in measuring EPP-district relationships and the role of knowledge sharing in student teaching placements. Nonetheless, our findings suggest the value of EPP-district partnerships in improving placement processes.
Background
Highly Effective Cooperating Teachers
Effective CTs take on multiple roles for a PST placed in their classroom (Matsko et al., 2020). First, CTs must be effective models of instruction. They have a primary role in showing PSTs what high-quality planning, instruction, and assessment practices look like in authentic K-12 settings. Second, CTs must be effective coaches and facilitators of adult learning. It is not enough to simply demonstrate effective teaching practices. Rather, it is important for CTs—through expert coaching and feedback—to “open up” their instruction so that PSTs understand teaching decisions and are better prepared to enact high-quality teaching themselves. PSTs value both of these competencies in the relationship with their CT (Matsko et al., 2023), and they report feeling better prepared to teach when their CT is effective in both roles (Matsko et al., 2020).
Existing scholarship connecting CT characteristics to PST outcomes has largely focused on the instructional effectiveness of CTs. In particular, prior studies have defined CTs’ instructional effectiveness with two measures: (1) ratings of their instructional practice as part of a state/district-level evaluation system and (2) estimates of their value-added to student achievement. Each of these measures predicts outcomes for PSTs. PSTs matched with an instructionally effective CT make larger gains in the quality of their instruction during student teaching than peers placed with a less effective CT (Goldhaber et al., 2022). These PSTs also report feeling significantly better prepared to teach (Ronfeldt et al., 2020). In addition, PSTs earn higher edTPA scores (a portfolio assessment typically completed during student teaching) if they student taught with a highly rated CT (Bastian et al., 2023). Once in the teacher workforce, early-career teachers receive higher evaluation ratings if they student taught with a highly rated CT (Bastian et al., 2022; Ronfeldt, Brockman, & Campbell, 2018). Likewise, early-career teachers have higher value-added estimates if their CT also had higher value-added scores (Goldhaber, Krieg, & Theobald, 2020). There are limitations to this work—particularly a lack of data on CTs’ mentoring ability and the extent to which it predicts PSTs’ outcomes. Nonetheless, these studies affirm that the instructional effectiveness of CTs matters to PST outcomes. This is a clear rationale for EPPs and districts to prioritize placements with highly effective teachers.
Making Student Teaching Placements
Despite the importance of highly effective teachers, only a few studies have examined the student teaching placement process. Quantitative work from Washington shows that a majority of PSTs have a student teaching placement in close proximity—within 25 miles—to their EPP. This is especially true for PSTs attending EPPs in urban regions of the state, where there are more K-12 schools (potential placement sites) in close proximity to the EPP (Krieg et al., 2016). EPPs may prefer to place in close proximity because it eases the commutes of PSTs and university field supervisors. Districts have an incentive to host PSTs because the student teaching location is a strong predictor of where PSTs secure their first teaching position (Goldhaber et al., 2021; Krieg et al., 2016). Other work shows that EPPs and districts are more likely to place PSTs with principals and teachers who are alumni of the EPP and that better credentialed and more effective teachers are more likely to serve as a CT (Krieg et al., 2020). While these findings suggest that EPPs and districts make strategic choices when selecting CTs, other studies show that there are opportunities to improve the placement process. In particular, descriptive analyses from Washington find that (1) many PSTs do not have a highly effective CT and (2) there are enough highly effective teachers in close proximity to EPPs for each PST to be placed with one (Goldhaber, Krieg, & Theobald, 2020). Importantly, this study by Goldhaber and colleagues (2020) did not assess the extent to which access to and selection of highly effective teachers vary across EPPs. That is an important contribution of the present study.
In a qualitative study in Washington, St. John and colleagues (2021) interviewed EPP and school district personnel to better understand student teaching placement practices. These conversations revealed that the placement process typically involves the following steps: (1) EPPs identify the number of PSTs needing placements and gather information about those PSTs; (2) EPPs contact district office personnel and school principals to determine their capacity for hosting PSTs; (3) districts and schools assess their capacity for hosting PSTs, which includes principals assessing whether certain teachers are willing/able to serve as a CT that year; and (4) EPPs arrange a meeting between a PST, a school principal, and a prospective CT to collectively determine whether there is a good fit and if the match should be finalized (St. John et al., 2021).
While these steps can result in suitable placements, there are several challenges that may adversely impact placement quality. Placements are dependent on the willingness of K-12 schools and teachers to serve as hosts—that is, EPPs do not control the placement process and must rely on highly effective teachers accepting a CT role. In addition, inservice teachers often lack the training and incentives to mentor PSTs (Goldhaber, Grout, Harmon, & Theobald, 2018). This matters given the importance of the CT mentoring role (Matsko et al., 2020). Finally, information asymmetries exist between EPPs and school districts. EPPs and K-12 schools often have pertinent information needed to make a quality placement, but rarely do both parties share this information. EPPs do not know why certain teachers are selected as CTs and K-12 schools lack information on PSTs to make thoughtful matches (St. John et al., 2021). Incomplete information complicates efforts to make high-quality placements.
To overcome these information asymmetries, EPPs and school districts rely on relationships as an informal way to share knowledge. Examples of this include placing PSTs with alumni of the EPP (Krieg et al., 2020), EPPs placing with schools and teachers with whom they have placed in the past (St. John et al., 2021), and EPPs gathering data from PSTs about the quality of their CTs. Other work shows that school districts select more effective teachers to serve as CTs if they receive lists of teachers who are recommended—based on prior performance data—for the role (Ronfeldt et al., 2020). This finding highlights how knowledge sharing can significantly improve the student teaching placement process.
Overall, prior work suggests that relationships and knowledge sharing between EPPs and districts play an important role in the student teaching placement process (Krieg et al., 2020; St. John et al., 2021). Our work extends these prior studies by examining EPPs’ access to highly effective teachers, assessing whether EPPs and districts select highly effective teachers for placements, and testing whether measures of access and EPP-district relationships predict placements with highly effective teachers. Such analyses may offer EPPs and districts with actionable insights for improving student teaching placements.
Data
Data Sources and Sample
To assess student teaching placements, we leverage data from two sources: (1) student teaching placement data from the 15 public universities in North Carolina and (2) K-12 administrative data from the North Carolina Department of Public Instruction (NCDPI). The student teaching data cover the 2015-16 through 2019-20 school years and include fields for PST demographics, final undergraduate GPA, EPP attended, the semester and year of student teaching, the name of the district and school in which student teaching occurred, and the name of the CT. We connect these student teaching data to administrative data from NCDPI to know the characteristics of placement schools and CTs.
There are 47 universities in North Carolina—15 public and 32 private—with an EPP. During our study period, these institutions prepared 3,100 to 3,600 initially licensed teachers each year. Of this total, approximately 80% completed a teacher licensure program at a public university and 20% finished a program at a private university (NCDPI EPP Dashboards, n.d.). As such, we possess student teaching data for a large majority of PSTs in the state. Furthermore, the public universities in North Carolina differ in many ways: geographically spread across the state (mountains to coast); located in both rural and urban locations; varying classifications, including Research 1 and historically Black colleges and universities; and preparing relatively few (less than 30) to many (several hundred) PSTs each year. The diversity of public EPPs in North Carolina means our findings are more likely to generalize to other states and EPPs.
The K-12 administrative data are from the 2015-16 through 2019-20 school years and include information on all K-12 students, school personnel, and public schools in North Carolina. These data also include enrollment and completion records for public and private EPPs in North Carolina. For K-12 school personnel, these files include employment, credential, and job performance measures. Employment files identify the districts and schools in which individuals work and the positions they hold (e.g., teacher and principal). Credential files include experience levels, licensure areas, degree level, and National Board Certification (NBC) status. Finally, teacher performance files include evaluation ratings from the North Carolina Educator Evaluation System (NCEES) and value-added estimates from the Education Value-Added Assessment System (EVAAS). 1 With NCEES, all teachers are rated annually by their school principal on two professional teaching standards—Leadership and Facilitating Student Learning. 2 For each standard, teachers receive evaluation ratings on a 1 to 5 scale: not demonstrated, developing, proficient, accomplished, and distinguished. Teachers receive EVAAS value-added estimates if they are the teacher-of-record for a course in a tested subject area. During our study period, this included reading in grades K-8, 3 math in grades 4 to 8, science in grades 5 and 8, and courses in secondary grades English, math, science, and history/social studies.
While we have 5 years of student teaching placement data, we focus our analyses on student teachers in the 2018-19 and 2019-20 school years. This decision allows us multiple years of prior placement and K-12 administrative data—2015-16 through 2017-18—to construct the outcome and focal variables for our analyses. We further restrict our sample to student teachers in one of the following licensure areas: elementary (K-6); exceptional children; health and physical education; middle grades (6–8) language arts, math, science, and social studies; and secondary grades (9–12) language arts, math, science, and social studies. This excludes PSTs from smaller licensure areas (e.g., agriculture education and foreign languages) and PSTs pursuing a birth-to-kindergarten license (many of whom do not student teach in a K-12 school).
In total, our analytic sample includes 3,368 PSTs who student taught in North Carolina public schools (NCPS) in 2018-19 or 2019-20 and for whom we have data on their CT. 4 Approximately 97% of these PSTs had a student teaching placement with one CT. The remaining PSTs had placements with multiple CTs. In analyses for research questions 2 and 3, we weight observations such that each unique PST contributes equally to estimates. Table 1 displays descriptive data for our analytic sample. Overall, more than 80% of the PSTs are women and White, respectively, and the average end-of-program GPA is 3.60. Nearly 55% of these PSTs are in an elementary grades licensure program and 11% are in an exceptional child program. In our sample, relatively few PSTs are seeking licensure in a middle grades content area or in secondary grades math and science.
Descriptive Statistics for the Analytic Sample.
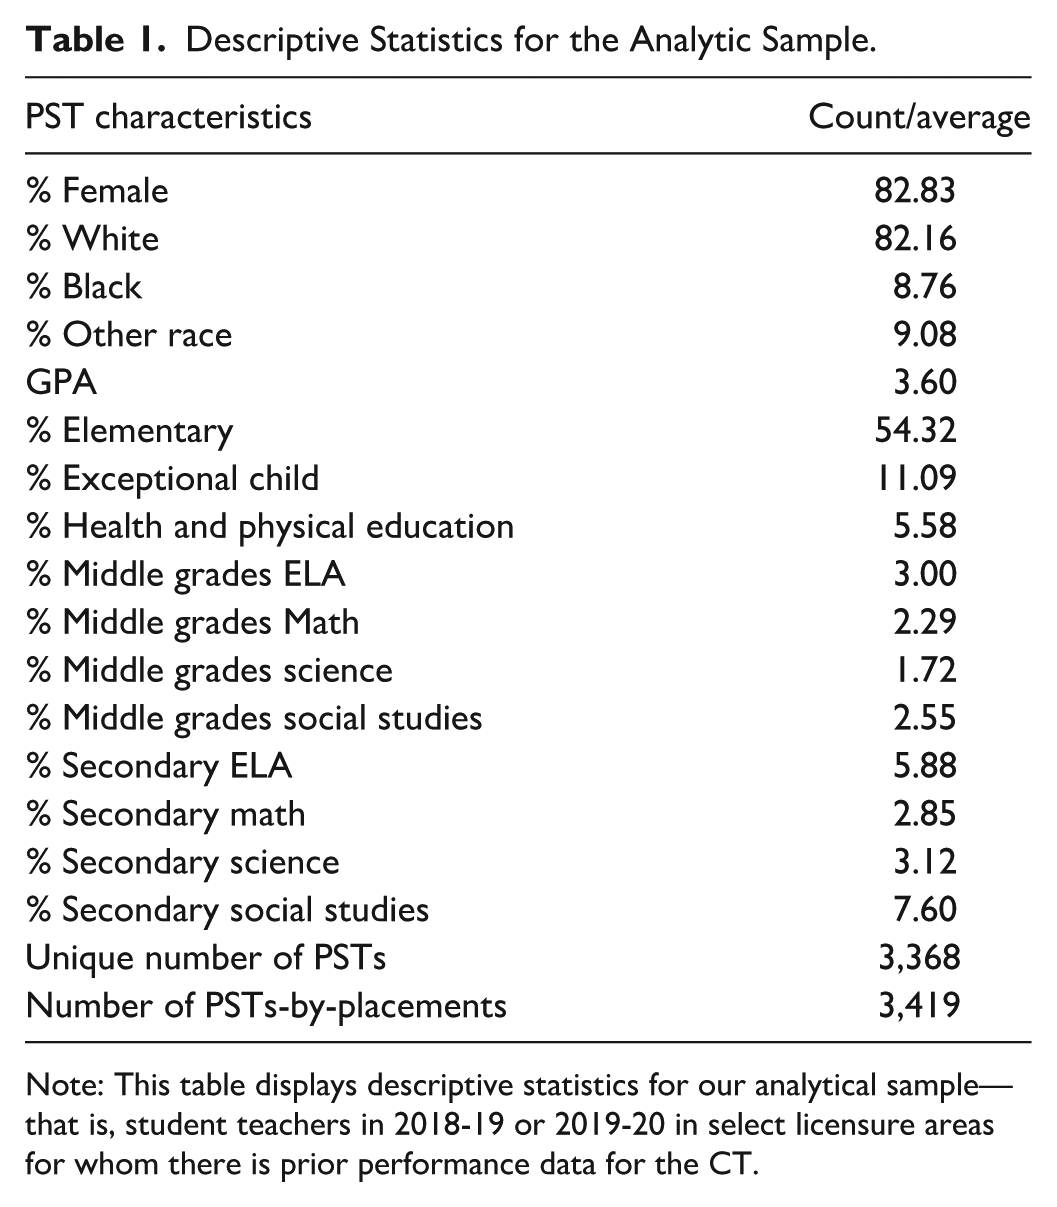
Note: This table displays descriptive statistics for our analytical sample—that is, student teachers in 2018-19 or 2019-20 in select licensure areas for whom there is prior performance data for the CT.
Identifying Highly Effective Teachers
Prior studies show that early-career teachers are more effective if they student taught with a CT who had higher evaluation ratings and higher value-added estimates (Bastian et al., 2022; Goldhaber, Krieg, & Theobald, 2020; Ronfeldt, Brockman, & Campbell, 2018). Building on this prior work, we use teacher evaluation ratings (NCEES) and value-added estimates (EVAAS) to identify highly effective teachers in NCPS. We define a highly effective teacher as one with (1) average evaluation ratings above accomplished on the NCEES (i.e., greater than 4 on a 1–5 scale)
5
To assess whether a PST is placed with a highly effective teacher, we use data on teacher performance prior to student teaching. In our preferred approach, we use data from the year prior to the student teaching placement to identify highly effective teachers. For example, if a PST student taught in 2018-19, we use evaluation ratings and value-added estimates from 2017-18 to determine whether their CT was highly effective. An advantage of this approach is that it captures data on teacher performance from the period in which EPPs and schools are making placement decisions. As a secondary approach, we use up to 3 years of prior performance data (as available) to identify highly effective teachers. For instance, if a PST student taught in 2019-20, we average evaluation ratings and value-added estimates across the 2016-17 through 2018-19 school years to determine whether their CT was highly effective. 6 An advantage of this approach, given the possibility for noise in teacher performance measures (Goldhaber & Hansen, 2013; McCaffrey et al., 2009), is a longer-term perspective on teacher effectiveness.
Focal Measures
We assess whether measures of access or EPP-district relationships predict placements with highly effective teachers. Our access measure—further described in the Methods section—captures the ratio of highly effective teachers to student teachers in an EPP’s proximate placement zone—that is, all the K-12 schools in the same district in which the EPP is located and all the K-12 schools in a district contiguous to the EPP’s home district. 7 For EPP-district relationships, we create the following focal measures: (1) an indicator for whether the placement for a respective PST was in the EPP’s proximate placement zone; (2) separate indicators for whether the EPP has placed with the CT and at a school led by the principal in the previous 3 years; and (3) separate indicators for whether the CT and the principal are alumni of the EPP.
We hypothesize that each of these relationship measures may be a proxy for knowledge sharing between EPPs and districts. EPPs may have stronger relationships with nearby districts and schools—that is, due to the frequency of interactions between EPP and school personnel. As such, an EPP placing a PST in its proximate placement zone may signify that the EPP has greater knowledge of that school and is better positioned to make a placement with a highly effective teacher. Prior work indicates that EPPs assess the quality of placement schools and CTs—for example, by surveying PSTs and talking with field supervisors (St. John et al., 2021). Through this data gathering, EPPs learn about placements and this knowledge may increase the likelihood of a placement with a highly effective teacher. Finally, EPPs are connected to their alumni through previous preparation experiences, induction programs, and ongoing professional networks. These connections are an opportunity for EPPs to learn about teacher effectiveness and to use this knowledge when making placement decisions.
Table 2 presents descriptive data for our focal EPP-district relationship measures. We find that EPPs place 77% of PSTs in their proximate placement zone. This affirms that EPPs typically place PSTs at K-12 sites close to the university (Krieg et al., 2016). However, Appendix Figure 1 shows that the percentage of placements in the proximate placement zone varies across EPPs, from a low of 53% for EPP 1 to a high of 100% for EPP 8 and EPP 15. Approximately 33% of placements are with a CT with whom the EPP recently placed and 45% are with a CT who is an alumnus of the EPP. These values are 70 and 50%, respectively, for school principals. Taken together, these data suggest that EPPs often make repeat placements and rely on alumni networks.
Descriptive Statistics for Focal EPP-District Relationship Measures.
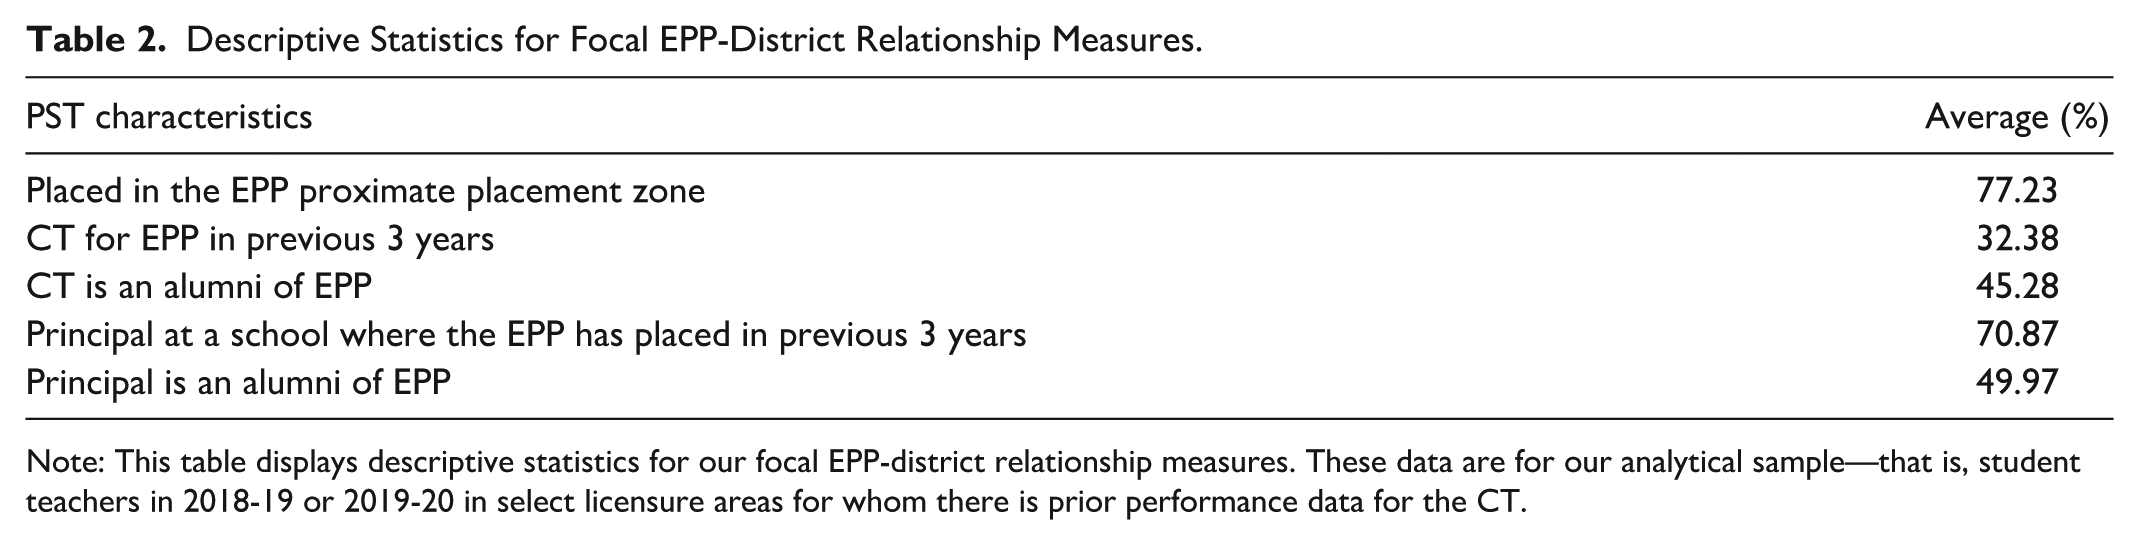
Note: This table displays descriptive statistics for our focal EPP-district relationship measures. These data are for our analytical sample—that is, student teachers in 2018-19 or 2019-20 in select licensure areas for whom there is prior performance data for the CT.
Method
Are There Differences Across EPPs in Access to Highly Effective Teachers for Student Teaching Placements?
When examining EPPs’ access to highly effective teachers, we are cognizant of two important factors: (1) EPPs must place PSTs with a CT in the same licensure area (e.g., an elementary grades PST with an elementary grades CT) and (2) EPPs in close proximity to each other may compete for placements with highly effective teachers. We account for both of these factors in our analyses.
To assess EPPs’ access to highly effective teachers, we calculate a ratio of the number of highly effective teachers in the EPP’s proximate placement zone (with a respective licensure area) to the number of PSTs (from the same licensure area) that need a placement in that zone. These PSTs come from both the focal EPP and other nearby EPPs. We determine the first component of this ratio—the number of highly effective teachers in the proximate placement zone—by using employment records from NCDPI to identify all the teachers in a respective district, the licensure areas they hold, and their prior performance data. To determine the second component of this ratio—the number of placements needed for each EPP and licensure area—we sum the number of PSTs needing a placement from the focal EPP with the number of PSTs needing a placement from other, nearby EPPs that have overlapping proximate placement zones. Some EPPs—that is, those located in the same district—have proximate placement zones that entirely overlap. For other EPPs, their proximate placement zones only overlap for some districts. We account for this as we calculate access ratios. While we do not possess student teaching data for the 32 private universities in North Carolina, we do know how many undergraduate-prepared teachers, by licensure area, finish these programs each year. By inferring that these undergraduate finishers also student taught in that year, we can identify the number of placements needed across public and private institutions.
Based on these values, we calculate the ratio of highly effective teachers to the number of placements needed by EPP, licensure area, and year. For example, an EPP may have 1,000 highly effective elementary grades teachers in its proximate placement zone and 100 elementary grades PSTs—from the EPP and competing EPPs—that need a placement. In this case, the EPP would have a ratio of 10 highly effective teachers per elementary grades PST. Ratios vary within EPPs based on licensure area. To arrive at a single ratio for each EPP, we calculate a weighted average of access ratios across licensure areas. We calculate these ratios using 1 year of prior performance data (preferred approach) and 3 years of prior performance data. In the appendix, we also report access ratios at the licensure area level by taking a weighted average across EPPs.
Are There Differences Across EPPs in the Selection of Highly Effective Teachers for Student Teaching Placements?
To assess selection, we report the percentage of PSTs, by EPP, who are placed with a highly effective teacher. We report these percentages using 1 (preferred) and 3 years of teachers’ prior performance data. These descriptive analyses highlight how frequently EPPs and school districts place with a highly effective teacher and the degree of variation across EPPs in such placements. To contextualize these results, we also report data that approximate what selection would look like if the placement process happened at random. We start these additional analyses by calculating the percentage of highly effective teachers, per licensure area, in each EPP’s proximate placement zone. For example, in the proximate placement zone of a respective EPP, 24% of the middle grades math teachers and 21% of the secondary science teachers may be highly effective. To arrive at a single value for each EPP, we identify these percentages across all of our focal licensure areas and calculate a weighted average of these percentages at the EPP level—weighted by the number of PSTs in each licensure area. 8 Unlike our access ratio, which explicitly accounts for competition from nearby EPPs, this benchmark value simply reflects the underlying percentage of highly effective teachers in a respective EPP’s proximate placement zone (weighted by the distribution of PST licensure areas). Ultimately, this value allows us to assess the extent to which EPPs select highly effective teachers at a rate different than chance alone.
What Predicts Student Teaching With a Highly Effective Teacher?
For our third research question, we estimate linear probability models to identify whether measures of access or EPP-district relationships predict selection of a highly effective teacher. It is important to highlight how our analyses build across questions—that is, we examine access to highly effective teachers, we assess whether EPPs and districts place with highly effective teachers, and finally, we test whether access or relationship proxies predict selection of a highly effective teacher. We acknowledge challenges with these regression analyses, including (1) concerns regarding the extent to which our focal measures are strong proxies for EPP-district relationships and (2) the complexity of the student teaching placement process (e.g., the autonomy of K-12 schools and teachers to decide whether they host a PST). Our analyses are not causal in nature; however, they are an opportunity to better understand factors that may influence whether an EPP and school district place a PST with a highly effective teacher:

Equation 1 displays our preferred model specification. Here,
Results
Are There Differences Across EPPs in Access to Highly Effective Teachers for Student Teaching Placements?
Figure 1 displays data on the number of highly effective teachers per PST in each EPP’s proximate placement zone (weighted by licensure areas, as described above). Overall, Figure 1 shows that there is significant variation across EPPs. For some EPPs, there is little surplus in the number of highly effective teachers. For example, in the proximate placement zone of EPP 1, there are only 2.26 highly effective teachers per student teacher. Conversely, other EPPs have access to many more highly effective teachers than are needed for student teaching placements. For instance, in the proximate placement zone of EPP 8, there are 36.52 highly effective teachers per student teacher. Prior work from Washington showed that, on average, there was a large surplus of highly effective teachers in close proximity to EPPs (Goldhaber, Krieg, Naito, & Theobald, 2020). Our findings confirm this result and extend it by highlighting the significant variation across EPPs. Not all EPPs and districts have the same access to highly effective teachers when making student teaching placements. 10
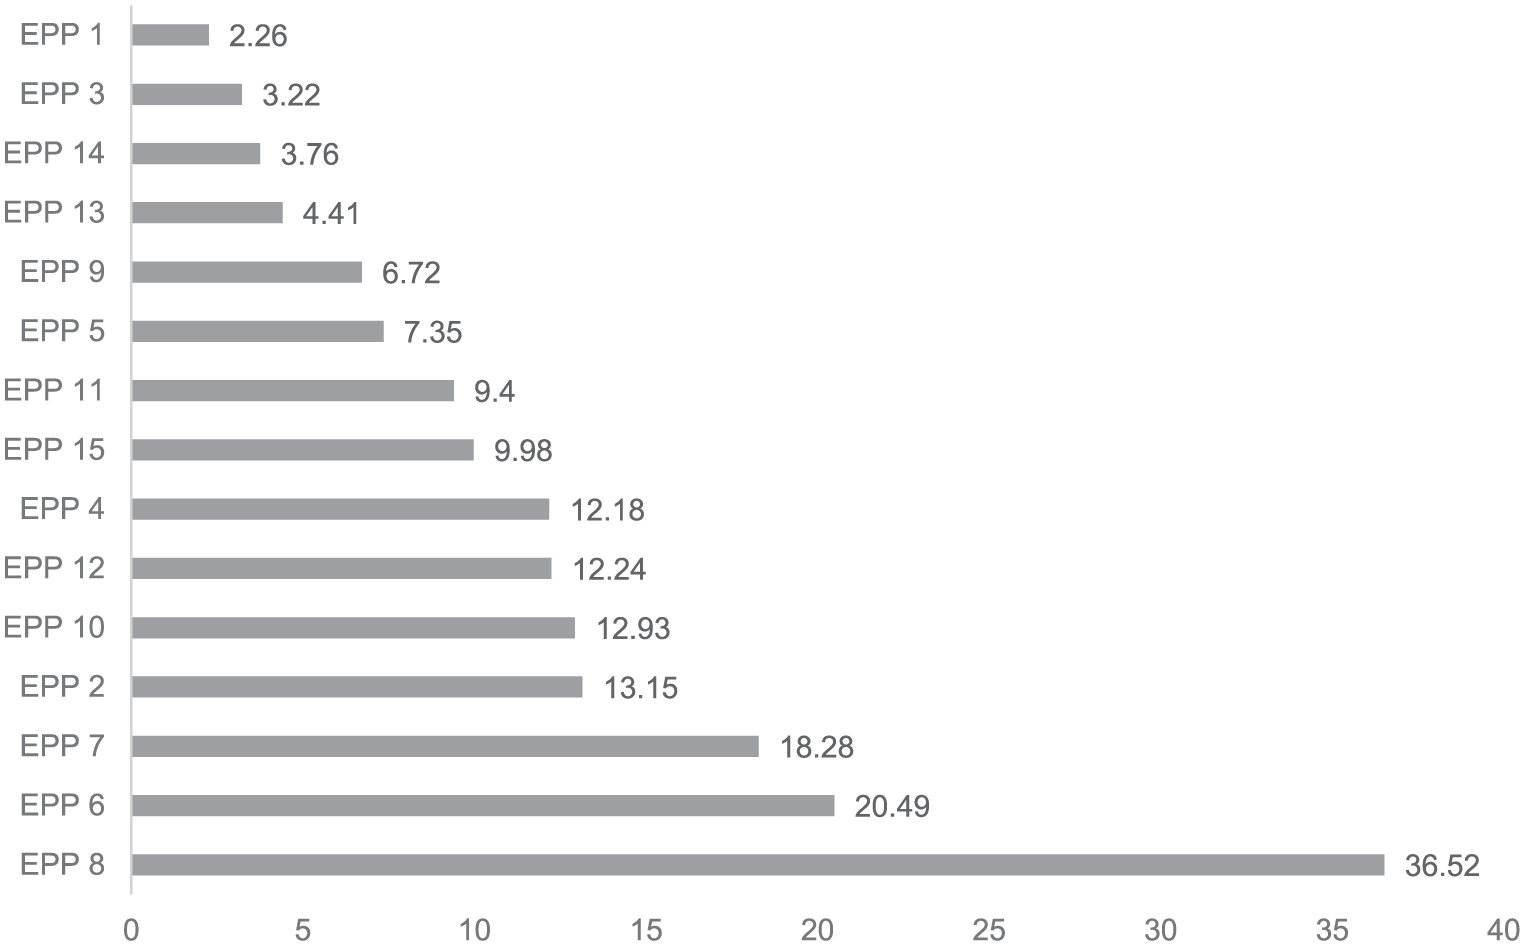
Ratios of Highly Effective Teachers to Student Teachers by EPP.
To better understand this variation across programs, we estimated a regression model to assess how EPP access is related to the rurality of the county in which an EPP is located and the number of PSTs needing a placement. Relative to EPPs in urban locations, we find that EPPs in rural counties have access to seven fewer highly effective teachers per PST. Likewise, we find that, on average, an EPP’s access ratio decreases by five highly effective teachers for every 100 additional PSTs needing a student teaching placement. EPPs in rural areas and EPPs in areas with many PSTs may have less access to highly effective teachers.
As an extension of these analyses, Appendix Figure 3 displays access ratios by teacher licensure area. We find that there are 7.41 highly effective elementary grades teachers per each elementary grades PST and 8.8 highly effective exceptional children teachers per each exceptional children PST. The access ratio is lowest for health and physical education (2.51) and highest in middle grades licensure areas (approximately 25 highly effective teachers per middle grades PST). This high value for middle grades is due, in part, to the relatively small number of PSTs pursuing licensure in these areas. 11 This is consistent with Krieg and colleagues (2022), whose study in Washington found low placement rates for PSTs in middle schools. Finally, we find that access for secondary grades licensure areas ranges from 8 to 12 highly effective teachers per PST.
Are There Differences Across EPPs in the Selection of Highly Effective Teachers for Student Teaching Placements?
Figure 2 presents data on the percentage of student teaching placements with a highly effective teacher and the percentage of placements that might be expected with a highly effective teacher if an EPP were placing at random. 12 Overall, 39% of the PSTs in our analytic sample were placed with a highly effective teacher. Despite the surplus of highly effective teachers—see Figure 1—a majority of PSTs do not have such a placement. While it is important to acknowledge the challenges in the placement process—that is, information asymmetries, K-12 teachers deciding whether to host a PST (St. John et al., 2021)—these data suggest that there is room for improvement in the placement practices of EPPs and school districts.
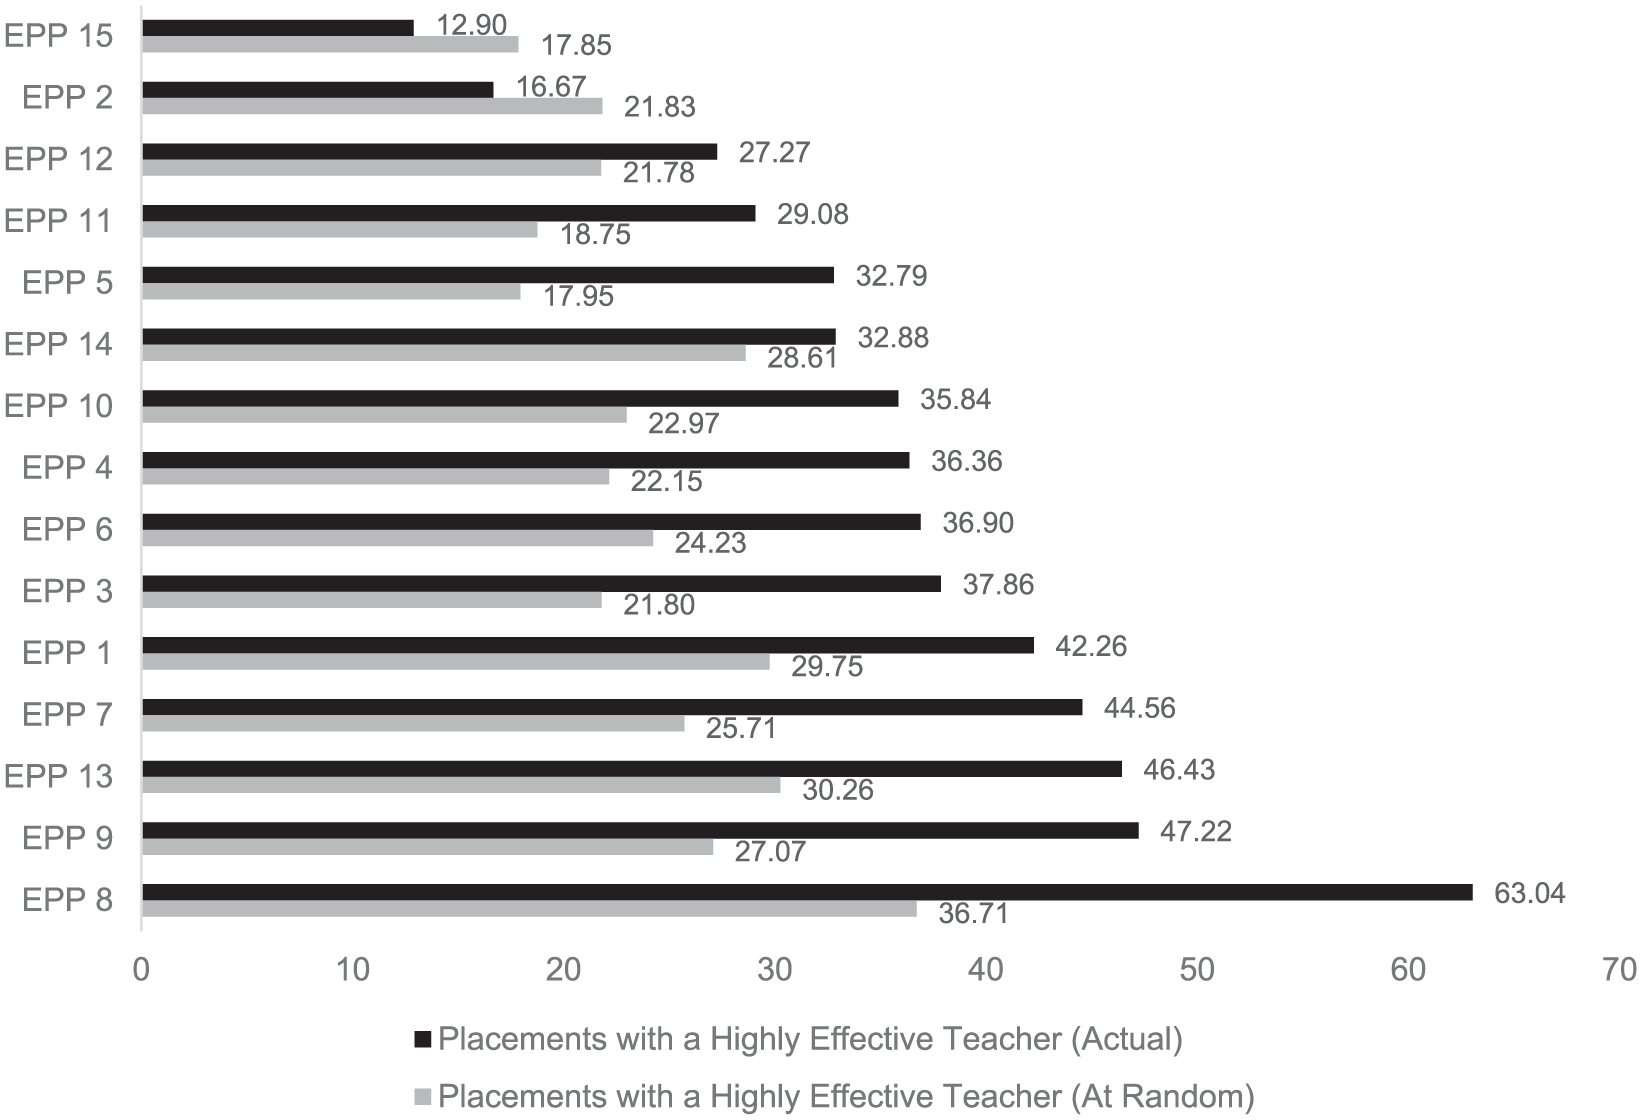
Percentage of Student Teaching Placements With a Highly Effective Teacher.
Similar to the access results, Figure 2 shows that there is considerable variation across EPPs in the percentage of placements with a highly effective teacher. Five EPPs have more than 40% of their PSTs placed with a highly effective teacher. Conversely, two EPPs have less than 20% of their PSTs with such a placement. Figure 2 also shows that some EPPs and districts are beating the odds and placing a much higher percentage of PSTs with a highly effective teacher than might otherwise be expected. When comparing the percentage of actual versus random placements with a highly effective teacher, there are five EPPs for whom their actual placement percentage is at least 15 percentage points higher than the random percentage. For instance, after weighting by licensure area, we find that approximately 30% of the teachers in the proximate placement zone of EPP 13 are highly effective and yet more than 46% of EPP 13’s PSTs are placed with a highly effective teacher. Alternatively, two EPPs place a lower percentage of PSTs with highly effective teachers than would be expected if placement were random.
Finally, Appendix Figure 5 presents these selection data by licensure area. There are six licensure areas—elementary, middle grades ELA, middle grades social studies, secondary grades ELA, secondary grades math, and secondary grades science—in which at least 40% of PSTs are placed with a highly effective teacher. Conversely, relatively few PSTs in programs for exceptional children or health and physical education have such a placement.
What Predicts Student Teaching With a Highly Effective Teacher?
Table 3 presents results from models predicting whether EPPs and school districts place a PST with a highly effective teacher. Across model specifications, we generally find that access to highly effective teachers does not predict whether an EPP and district place with a highly effective teacher. 13 This empirical result is consistent with findings from Figures 1 and 2. For example, in Figure 1, we found that EPP 1 had the lowest access ratio; however, Figure 2 showed that EPP 1 had one of the highest placement rates with highly effective teachers. Conversely, EPP 2 had a relatively high access ratio but a low percentage of placements with highly effective teachers. 14
Predicting a Student Teaching Placement With a Highly Effective Teacher.
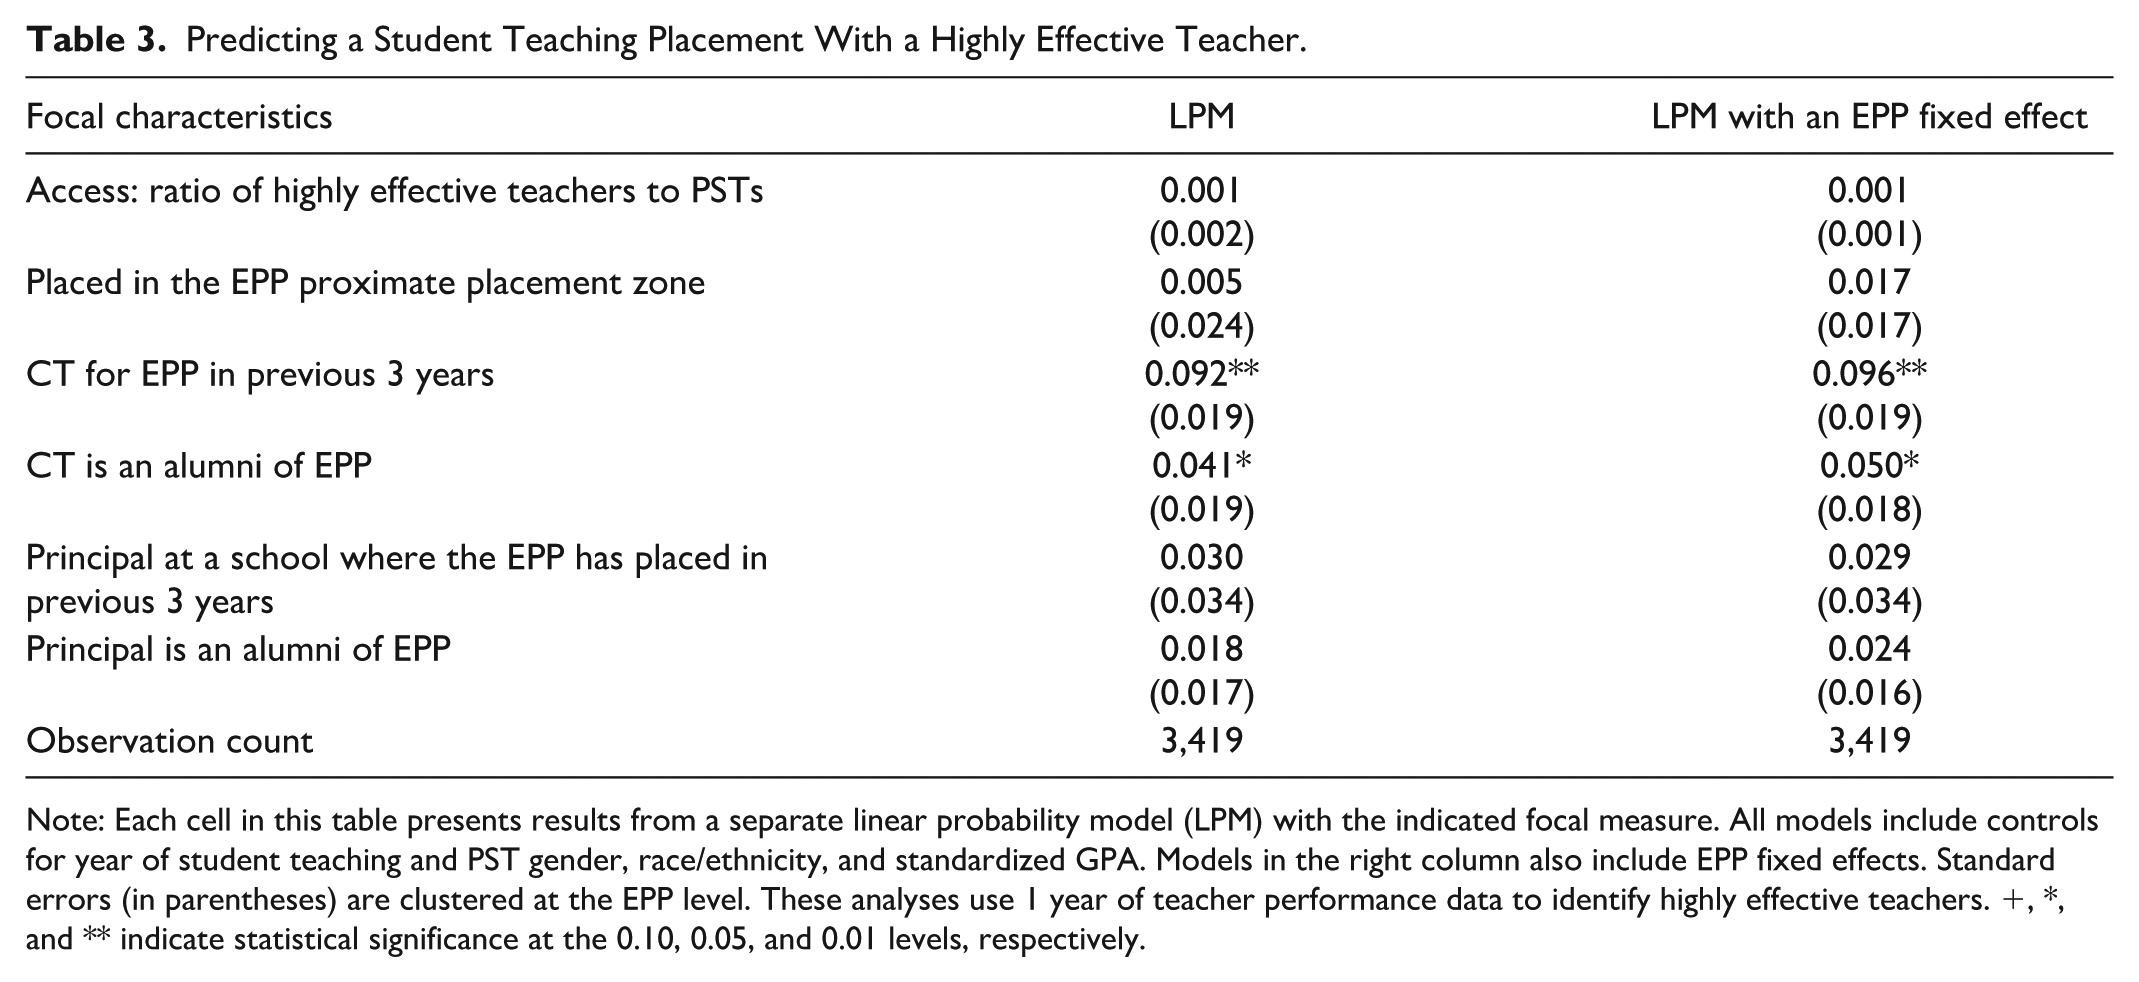
Note: Each cell in this table presents results from a separate linear probability model (LPM) with the indicated focal measure. All models include controls for year of student teaching and PST gender, race/ethnicity, and standardized GPA. Models in the right column also include EPP fixed effects. Standard errors (in parentheses) are clustered at the EPP level. These analyses use 1 year of teacher performance data to identify highly effective teachers. +, *, and ** indicate statistical significance at the 0.10, 0.05, and 0.01 levels, respectively.
EPPs can place PSTs in districts within or outside their proximate placement zone. We find that EPPs and school districts are no more likely to place with a highly effective teacher if the placement is within the proximate placement zone. While there are limitations to this measure, this result suggests that geographic proximity does not increase the likelihood of a placement with a highly effective teacher.
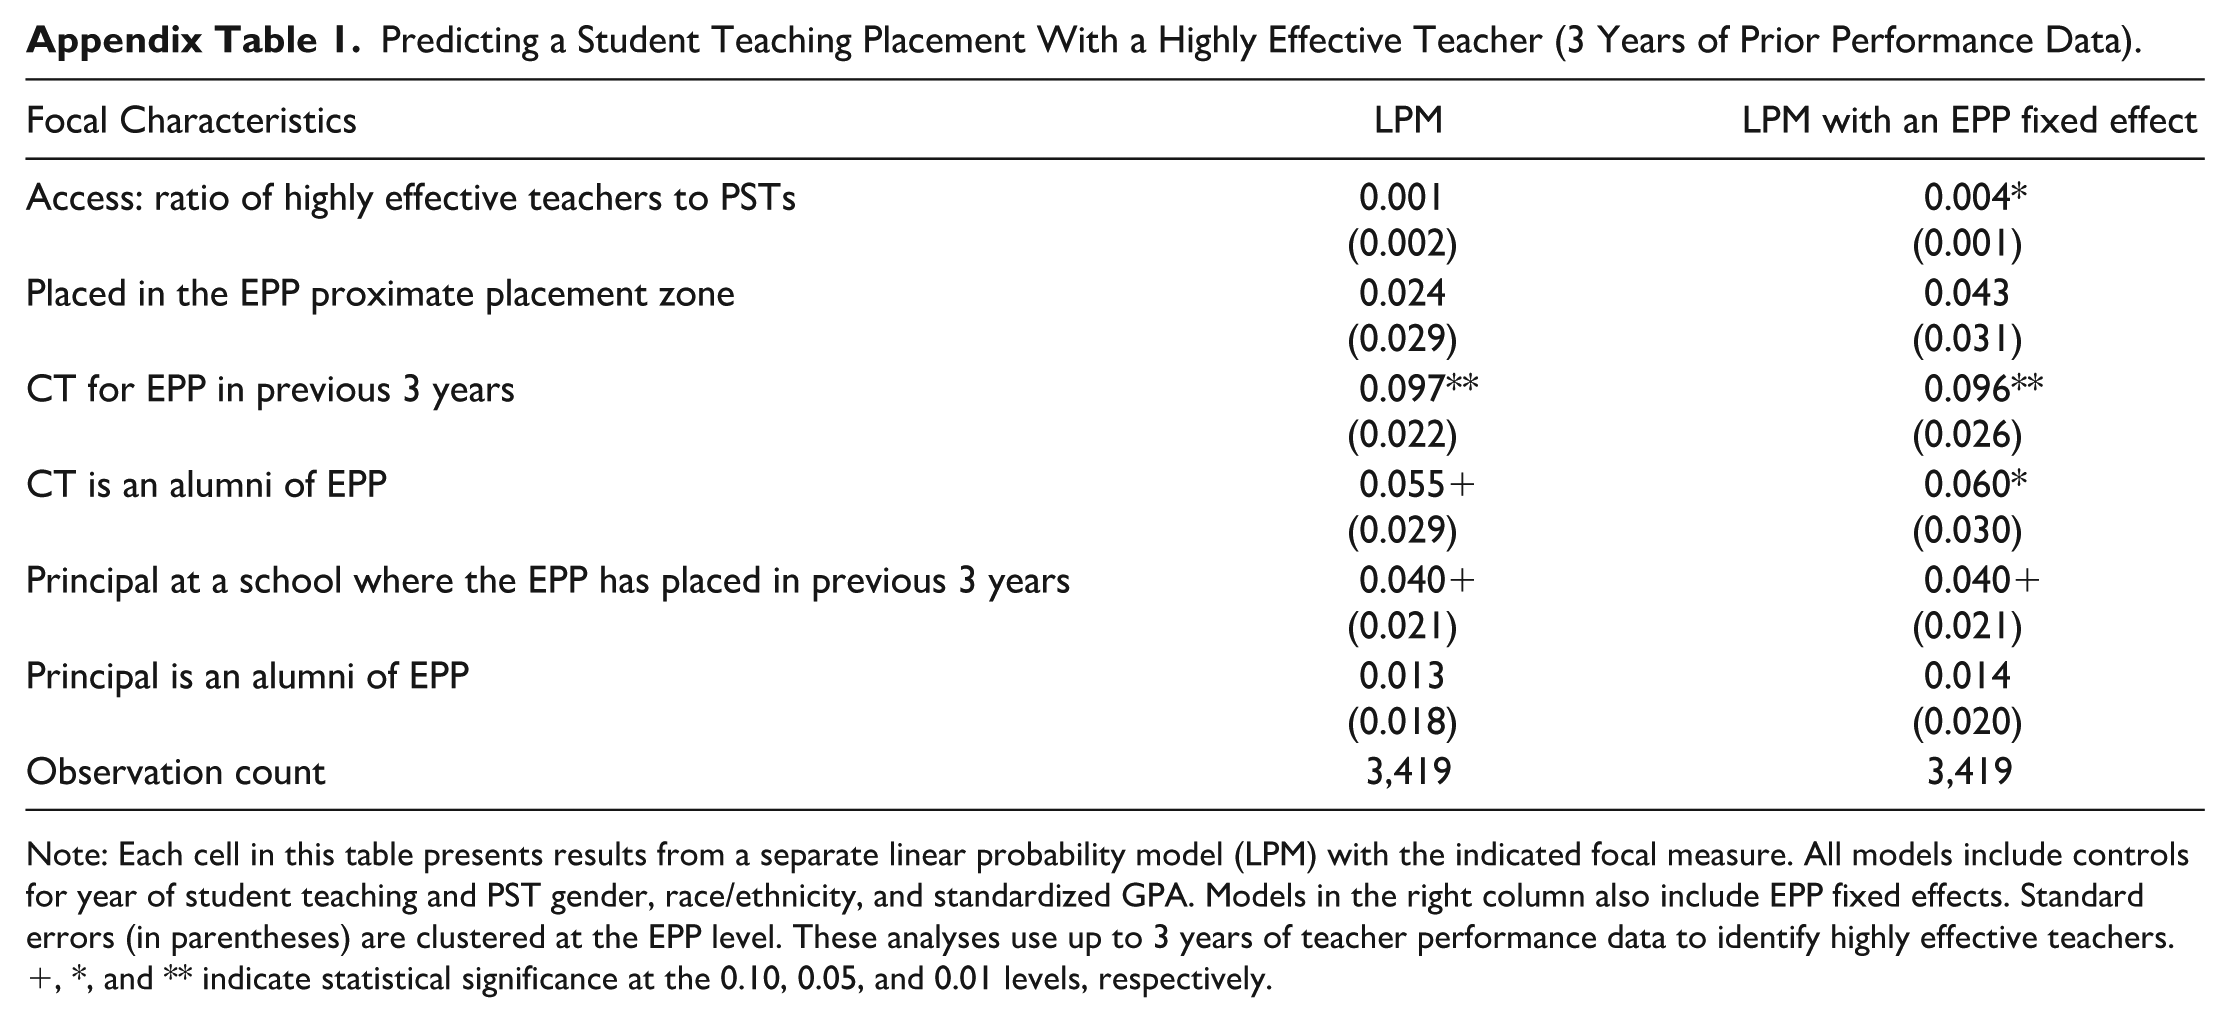
Our strongest results are proxies for relationships between EPPs and CTs. In particular, EPPs and districts are nearly 10 percentage points more likely to place with a highly effective teacher if that teacher had served as a CT for the EPP in the previous 3 years. Adjusted for covariates, we find that EPPs and districts place with a highly effective teacher nearly 46% of the time if that teacher had served as a CT for the EPP in the previous 3 years. The value is 36% if the EPP and district had not placed with the teacher in the recent past. This result is large in magnitude, consistent across model specifications, and suggests that prior experiences play a role in placement decisions. That is, EPPs may learn about the quality of CTs and develop relationships with CTs through placements. This can influence future placement decisions. In addition, we find that EPPs and school districts are 4 to 5 percentage points more likely to place with a highly effective teacher if that teacher is an alumnus of the EPP. This result suggests that alumni networks are an opportunity for EPPs to learn about teacher effectiveness. It is also possible that inservice teachers are more likely to engage in professional development or induction activities with their former EPP and, therefore, are also more likely to agree to host a PST from that institution. This may make it easier for EPPs and districts to place with highly effective teachers. Each of these results—that is, CT for the EPP in the previous 3 years, CT is an alumnus of the EPP—remain statistically significant in models using 3 years of prior performance data (Appendix Table 1).
Finally, the bottom of Table 3 presents estimates focused on the EPP-principal relationship. EPPs can place with principals with whom they have a history of prior placements and with principals who are alumni of the program. In our primary specifications, we find that prior placements with a principal and alumni status do not predict whether an EPP and district place with a highly effective teacher. However, when using a longer panel (3 years) of data to identify highly effective teachers, Appendix Table 1 shows that EPPs and districts are four percentage points more likely to place a PST with a highly effective teacher if the EPP had recently placed at a school led by the principal.
Discussion
This study built upon two key findings from the student teaching literature: CTs are critically important to PST development and information asymmetries lessen the likelihood of placement with a highly effective teacher (Bastian et al., 2022; Goldhaber, Krieg, & Theobald, 2020; Ronfeldt, Brockman, & Campbell, 2018; St. John et al., 2021). From these findings, we sought to better understand the context in which EPPs and K-12 districts make placements and the factors that predict whether EPPs and districts make placements with highly effective teachers. In particular, we explicitly tested whether access to highly effective teachers or measures of EPP-district relationships facilitated placements with highly effective teachers. Underlying these analyses is the hypothesis that relationships beget knowledge sharing, which can lead to more placements with highly effective teachers.
Before reviewing our findings and implications, it is important to acknowledge three limitations of this work. First, the extent to which our focal relationship measures are proxies for knowledge sharing between EPPs and districts is unclear. Prior work informed the creation of our measures (Krieg et al., 2020; St. John et al., 2021); however, they may not capture ways in which knowledge is shared or essential features of EPP–district relationships. Said differently, statistically insignificant results do not definitively mean that relationships and knowledge sharing are unimportant. Instead, other measures may more accurately capture knowledge sharing between EPPs and districts. Further work should continue to identify measures of EPP–district relationships and assess how they are related to placement outcomes. Second, our definition of CT effectiveness is based on measures of instructional performance—that is, evaluation ratings and value-added—and does not take into account coaching/mentoring ability. Coaching is an essential skill for effective CTs (Matsko et al., 2020), and we cannot assess this skill with administrative data. As such, it is possible that CTs who were not highly effective, per our instructional measure, were nonetheless highly effective in other important ways. Finally, we recognize that the student teaching placement process is complex and outside the independent control of EPPs. K-12 principals and teachers decide whether they host a PST, and this may limit EPPs’ ability to place with highly effective teachers.
Despite these limitations, our work makes several important contributions to the student teaching literature. We found significant variation across EPPs in their access to highly effective teachers. For some EPPs, there are many more highly effective teachers in close proximity to the EPP than are needed for placements. These institutions—and their district partners—have a deeper bench of highly effective teachers with whom they can engage and potentially place. Relative to the number of placements needed, other EPPs had few highly effective teachers in close proximity. While this access measure did not consistently predict placements with highly effective teachers, a lack of access is nonetheless concerning for EPPs. Without sufficient access, EPPs may need to compromise on placement quality or make placements across a wider geographic area. Making such placements may require more resources dedicated to relationships and information gathering.
Placements with highly effective teachers matter, and yet, only 39% of PSTs had such a placement. When examining these data by EPP, we found that programs with relative success were still placing less than half of their PSTs with a highly effective teacher. Some EPPs and districts place many more PSTs with a highly effective teacher than would be expected to occur at random, given the number of highly effective teachers in geographic proximity. However, a few EPPs and districts are placing at a rate similar to or less than the underlying percentage of highly effective teachers nearby. Taken together, these data suggest that there is room for significant improvement in the student teaching placement process.
Finally, we found little evidence that access predicts the selection of highly effective teachers. However, EPPs and school districts are more likely to place with a highly effective teacher if the respective teacher has served as a CT in recent years and if the respective teacher is an alumnus of the EPP. The result for prior placements with the CT was especially large in magnitude and highlights the possibility for EPPs to learn about the quality of CTs and develop relationships with CTs through placements. Both of these CT results suggest that relationships can facilitate knowledge sharing and improve student teaching placements.
Moving forward, there is a need to ensure that more PSTs are placed with a highly effective teacher. Toward this end, our work suggests that knowledge sharing between EPPs and K-12 districts is a promising approach. In particular, knowledge sharing can proceed in two primary ways. First, EPPs and districts can focus on developing deeper partnerships around the placement process. This might include (1) EPPs sharing more information with districts about the strengths, weaknesses, and preferences of PSTs; (2) districts sharing more information with EPPs about the background and expertise of potential CTs; and (3) EPPs and districts investing more time and resources—dedicated personnel, financial incentives for CTs, meetings between prospective PSTs and CTs to assess match quality—to support better placements. Given that many PSTs go on to work in the student teaching district, such investments stand to benefit districts by reducing vacancies and improving outcomes for district students.
There is also a clear role for states to support the creation of data systems that inform the placement process. Many states already require that CTs meet certain requirements based on years of experience and/or instructional performance. However, there are no data systems and data sharing agreements in place to support these requirements. To help EPPs and districts place more PSTs with highly effective teachers, states need to provide EPPs and districts with access to teacher performance data and opportunities to use it together. If states generated and distributed lists of highly effective teachers, EPPs and districts could use such data to inform placements. This strategy has evidence of success, as districts in Tennessee that received recommendation lists selected more highly effective teachers to serve as CTs (Ronfeldt et al., 2020). We acknowledge that there are meaningful challenges with this type of data sharing, including making the data available in a timely fashion to support decision making, ensuring the security of the data, and training EPP and district personnel to use the data well. Nonetheless, making data available is a promising approach to share knowledge and systematically improve the student teaching placement process.
Footnotes
Appendix
Predicting a Student Teaching Placement With a Highly Effective Teacher (3 Years of Prior Performance Data).
| Focal Characteristics | LPM | LPM with an EPP fixed effect |
|---|---|---|
| Access: ratio of highly effective teachers to PSTs | 0.001 (0.002) |
0.004*
(0.001) |
| Placed in the EPP proximate placement zone | 0.024 (0.029) |
0.043 (0.031) |
| CT for EPP in previous 3 years | 0.097**
(0.022) |
0.096**
(0.026) |
| CT is an alumni of EPP | 0.055+ (0.029) |
0.060*
(0.030) |
| Principal at a school where the EPP has placed in previous 3 years | 0.040+ (0.021) |
0.040+ (0.021) |
| Principal is an alumni of EPP | 0.013 (0.018) |
0.014 (0.020) |
| Observation count | 3,419 | 3,419 |
Note: Each cell in this table presents results from a separate linear probability model (LPM) with the indicated focal measure. All models include controls for year of student teaching and PST gender, race/ethnicity, and standardized GPA. Models in the right column also include EPP fixed effects. Standard errors (in parentheses) are clustered at the EPP level. These analyses use up to 3 years of teacher performance data to identify highly effective teachers. +, *, and ** indicate statistical significance at the 0.10, 0.05, and 0.01 levels, respectively.
Acknowledgements
We would like to thank the North Carolina Department of Public Instruction and the UNC System Office for providing the administrative data for this research.
Declaration of Conflicting Interests
The authors declared no potential conflicts of interest with respect to the research, authorship, and/or publication of this article.
Funding
The authors received no financial support for the research, authorship, and/or publication of this article.