
Abstract
Firms increasingly follow an “always on” philosophy, publishing multiple pieces of firm-generated content (FGC) every day. Current methodologies used in marketing are unfit to unbiasedly capture the impact of FGC disseminated intermittently throughout the day on stock markets characterized by ultra-high-frequency trading. They also neither distinguish between the permanent (i.e., long-term) and temporary (i.e., short-term) price impacts nor identify FGC attributes capable of generating these price impacts. In this study, the authors define price impact as the impact on the variance of stock price. Employing a market microstructure approach to exploit the variance of high-frequency changes in stock price, the authors estimate the permanent and temporary price impacts of the firm-generated Twitter content of S&P 500 information technology firms. The authors find that firm-generated tweets induce both permanent and temporary price impacts, which are linked to tweet attributes of valence and subject matter. Tweets reflecting only valence or subject matter concerning consumer or competitor orientation result in temporary price impacts, whereas those embodying both attributes generate permanent price impacts. Negative-valence tweets about competitors generate the largest permanent price impacts. Building on these findings, the authors offer suggestions to marketing managers regarding the design of intraday FGC.
With U.S. firms investing in excess of $37 billion in 2020 (Statista 2020), social media is one of the most pervasive communication channels used by marketers (Berger et al. 2020; Hewett et al. 2016). The result of this investment is the creation of corporate social media accounts that support firm-generated content (FGC), defined as a firm's communications disseminated through its own online communication tools (Kumar et al. 2016). Many firms have adopted an “always on” approach in their social media marketing, disseminating multiple pieces of FGC throughout the day. Figure 1 illustrates the high-frequency approach to FGC dissemination using the example of information technology (IT) firms’ activity on Twitter. Each piece of FGC is characterized by its attributes (e.g., Figure 1 shows FGC's valence and subject matter as key attributes), 1 and the timestamps show the dissemination time for each piece of FGC. Each piece of FGC and its timestamp can be accurately recorded to the second and mapped against the corresponding timestamp of trading activity that takes place at ultra-high frequency, that is, at subsecond intervals (Hasbrouck and Saar 2013). As a result of these high-frequency activities, large volumes of intraday data emerge. For example, an S&P 500 IT firm can issue in excess of 6,000 tweets in a given month, and trading in a single firm's stock often yields well over 10 million trading-related messages (e.g., quotes, cancellations, transactions) during the same interval (see Web Appendix A).
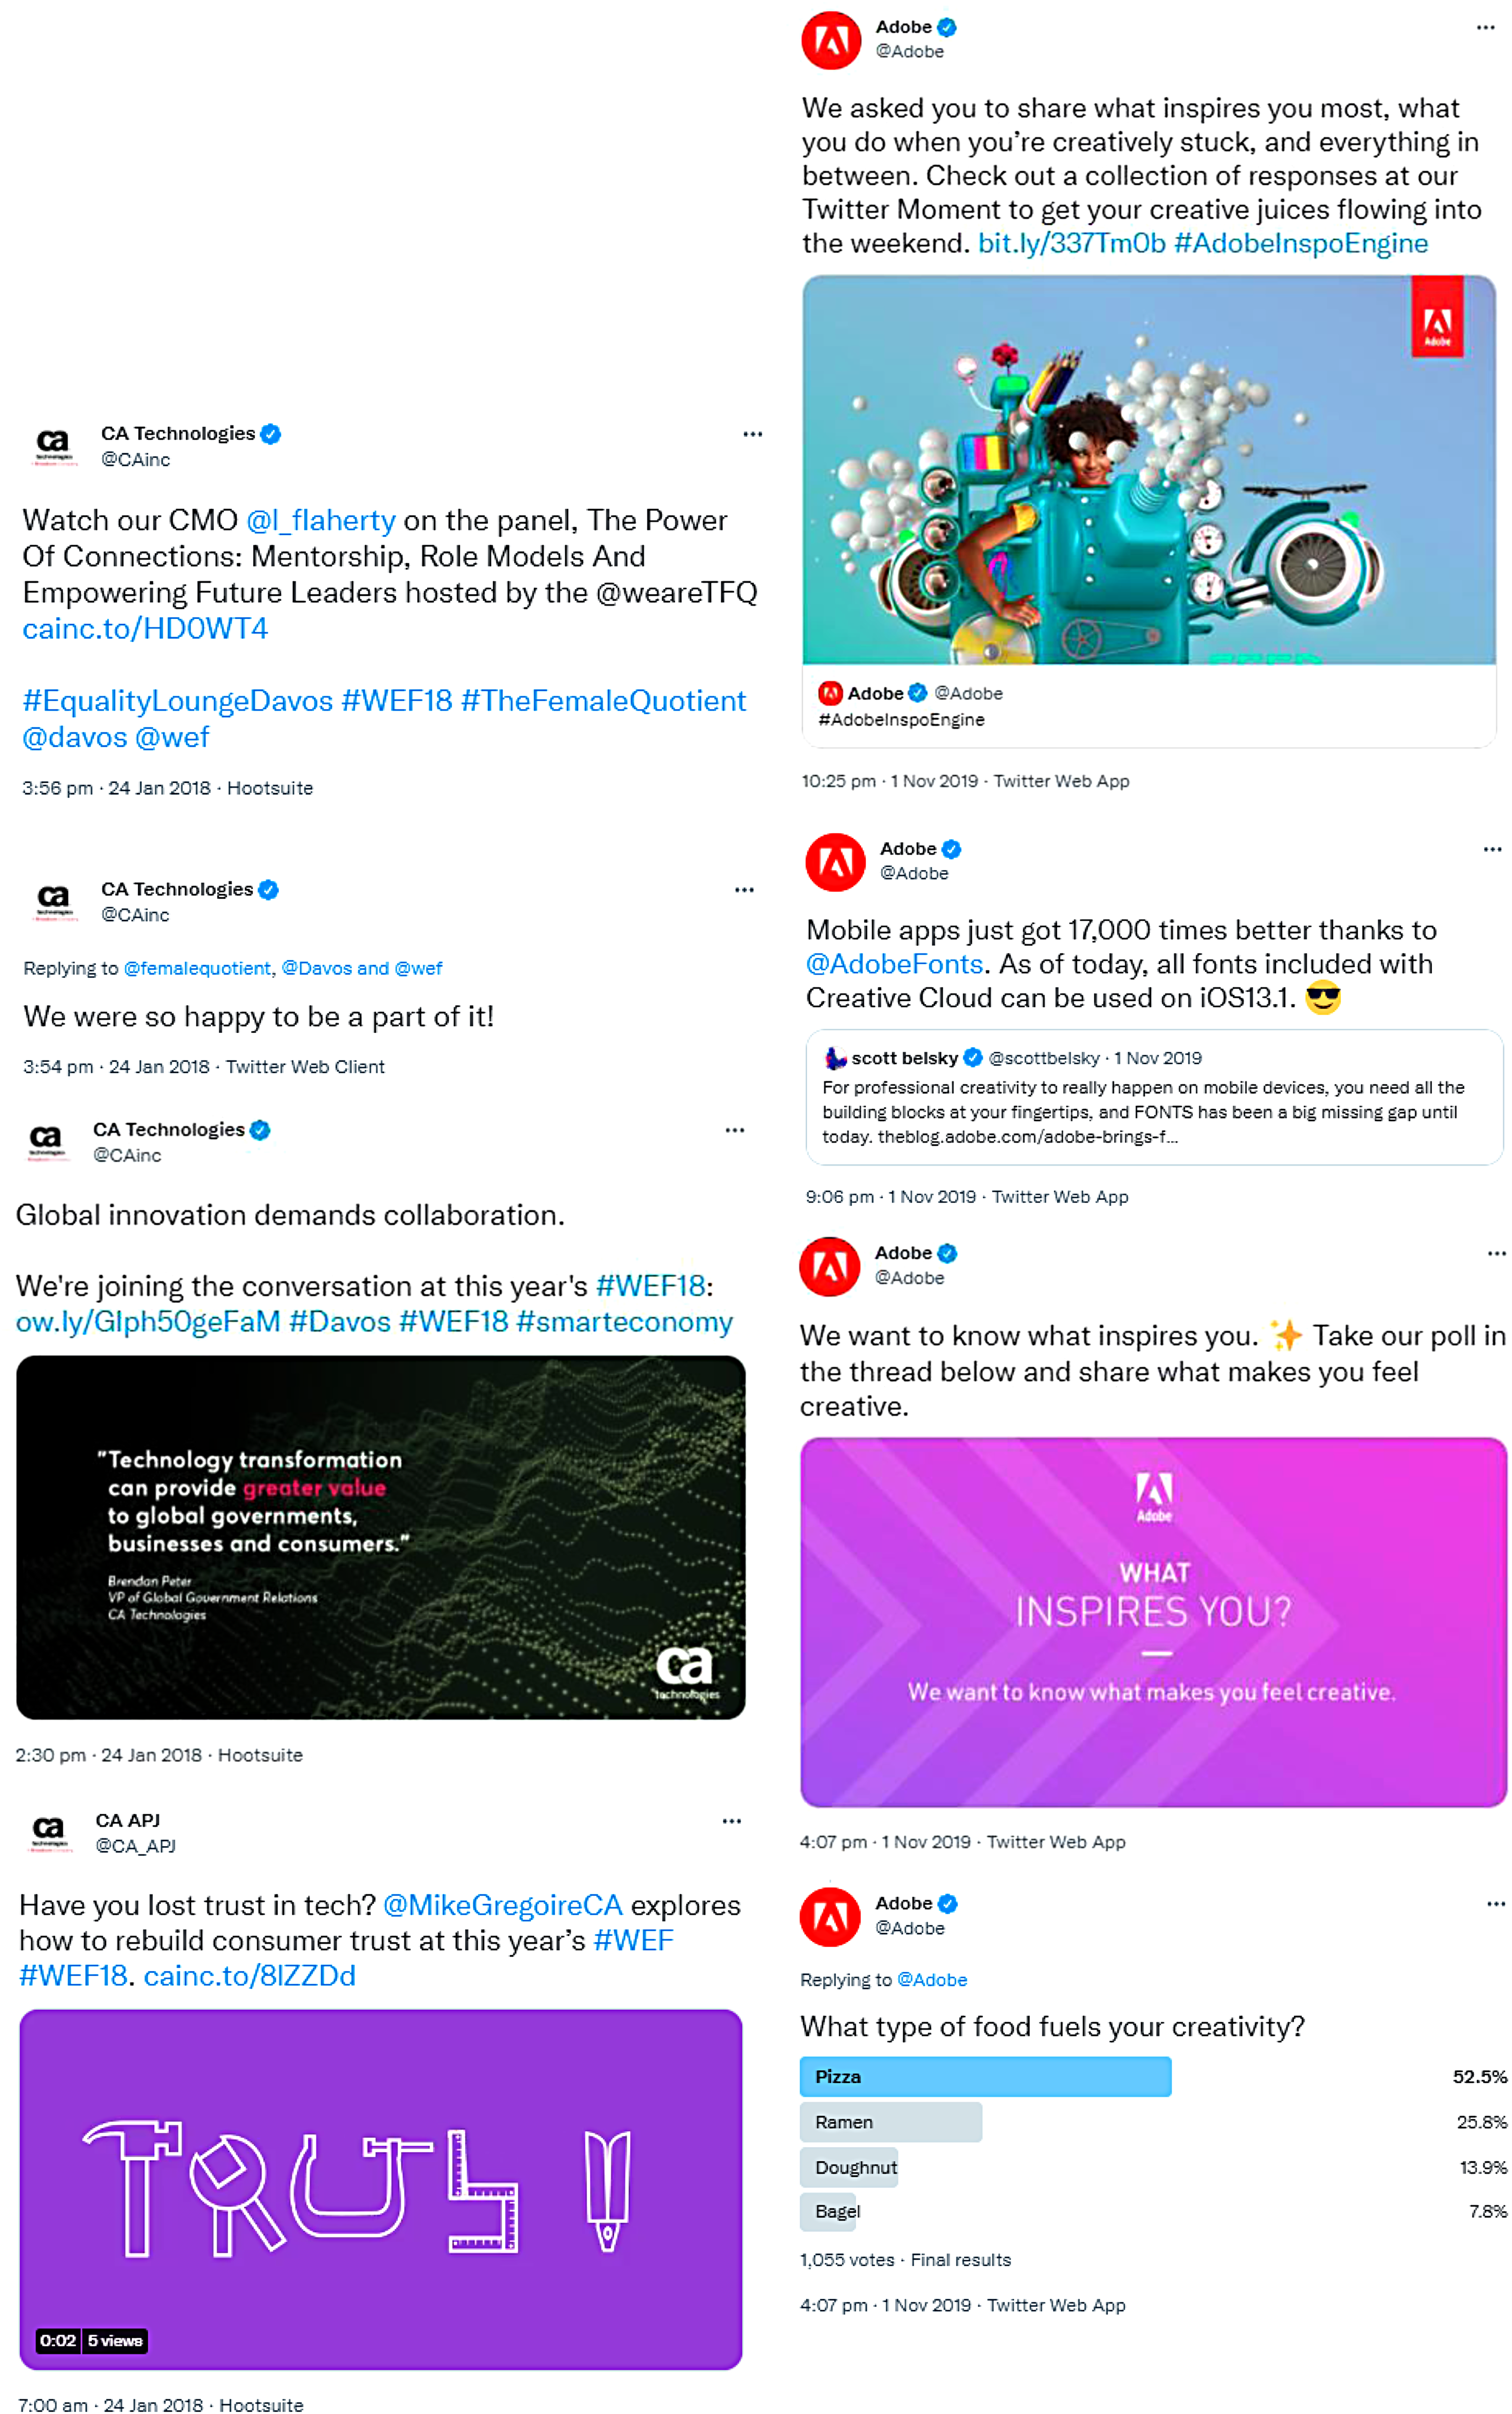
A high-frequency approach to FGC dissemination on the example of IT firms’ activity on Twitter.
Current marketing methodologies are challenged when analyzing high-frequency data because the trading data, which is used in capturing the impact of FGC on firm value, is characterized by unequal time intervals. Low-frequency event studies using end-of-day price measures and time series analysis, such as standard vector autoregressive (VAR) models, are unable to effectively address these problems (see Web Appendix B). These methods rely on discrete and uniform time intervals that do not align with the time intervals associated with high-frequency trading data, which encapsulate the intraday evolution of firm stock price. Often, these methods aggregate trading data to regular intervals, which can lead to the elimination of upwards of 99% of intraday trading observations in studies employing end-of-day price data (see Web Appendix C). The frequency of FGC as an intraday variable and the effects of other non-FGC events potentially further bias low-frequency analyses that employ standard low-frequency analytical methods. Furthermore, the richness of such an assessment and marketing researchers’ understanding of “always on” strategies are compromised unless the research identifies both the short- and long-term impacts of this form of marketing (Gordon et al. 2021). Consequently, the findings derived from current examinations lack detailed ex post insights on the impact of FGC generated at intraday frequencies, which leaves marketing managers unable to effectively design future intraday marketing resource allocation strategies (Kanuri, Chen, and Sridhar 2018).
Employing the market microstructure approach, which relies on ultra-high-frequency trading data analysis, we investigate the stock price impact of FGC where price impact is defined as the impact on the variance of stock price. This approach of estimating price impact of FGC as impact on the variance of stock price rather than on changes in the level of stock price is driven by both methodological and theoretical necessity. Although estimating level changes in stock price as a result of an event such as FGC dissemination could be approached from the perspective of computing simple price impact measures, when working with high-frequency data, this approach is inadequate for at least two reasons. First, simple price impacts are misleading when trades in stock markets are serially correlated. Second, in the presence of transient impacts, as is the case in this study (e.g., we capture price impact at second-by-second intervals), simple price impacts rely on getting the timing just right, which is methodologically unfeasible when investigating large data sets, as is the case here. Our methodological approach is in line with market microstructure theory, addresses the previously outlined issues, and is consistent with the microstructure literature (Brogaard, Hendershott, and Riordan 2014; Rzayev and Ibikunle 2019). Using this approach and assessing S&P 500 IT firms’ Twitter activity, we contribute to the marketing literature at three levels.
First, by using high-frequency data, this is the first study to document the subminute impact of individual pieces of FGC disseminated during the day; therefore, the insights presented are unlikely to be affected by the confounding effects that the use of end-of-day data is susceptible to. We estimate the price impact of FGC at the second and minute levels by computing the variance of fast-paced (e.g., subsecond-by-subsecond) intraday changes in stock price as they occur in financial markets (Brogaard, Hendershott, and Riordan 2014; Budish, Cramton, and Shim 2015; Kirilenko et al. 2017), thereby demonstrating the instantaneous impact of FGC. We obtain the variance of intraday changes in price through state-space modeling with Kalman filtering. By doing so, we contribute to the emerging stream of marketing research studying (1) the impact of FGC on firm financial outcomes (Borah et al. 2020; Colicev et al. 2018) and (2) real-time marketing (Rust et al. 2021), and we respond to research priorities established by the Marketing Science Institute (2018), emphasizing the need to help marketers “get marketing right” by providing insights into the instantaneous impact of FGC.
Second, using the microstructure perspective, we reveal both the permanent and temporary price impact of FGC as new forms of FGC impact on firm-level performance. In the process, we address Gordon et al.’s (2021) call for research capable of identifying both the short- and long-term financial impact of a marketing activity, which has thus far remained difficult to quantify. By being able to distinguish between temporary and permanent price impacts at the fine-grained level of analysis, marketing managers can demonstrate both the short- and long-term impacts of FGC on firm financial performance (Magill, Moorman, and Avdiushko 2019). This, in turn, will allow them to overcome short-termism in marketing and improve long-term growth initiatives (Du et al. 2021; Moorman and Kirby 2019).
Finally, to support intraday actionable FGC design, we examine the extent to which key attributes of FGC, including content valence and subject matter, influence the occurrence of permanent and temporary impacts of FGC on price. Although FGC valence and subject matter have been examined by previous research (e.g., Elliott, Grant, and Hodge 2018; Groß-Klußmann, König, and Ebner 2019; Hewett et al. 2016) and are recognized as key components of marketing excellence (Homburg, Theel, and Hohenberg 2020), what constitutes the “right content” is largely unknown according to research priorities recently published by the Marketing Science Institute (2020). We show that FGC reflecting only one of the attributes of valence (positive or negative) or subject matter (consumer or competitor orientation) generates temporary price impact, whereas FGC that incorporates both valence and subject matter is associated with permanent price impacts on stock price and thus correlates with long-term firm performance.
Using a two-stage least squares (2SLS) estimation framework to examine S&P 500 IT firms’ Twitter activity, we find that negative- or positive-valence tweets are consistently linked with a reduction in permanent price impact and an increase in temporary price impact. Similar findings are obtained when examining tweets that only reflect a consumer or competitor subject matter, although the reduction in permanent price impact and increase in temporary price impact they elicit are of smaller magnitudes. These findings indicate that tweets reflecting only valence (positive or negative) or subject matter (consumer or competitor orientation) result in temporary price impacts, which is commonly associated with the incorporation of noise into the price discovery process (O’Hara 2003). This type of effect has not been studied previously in the marketing literature; however, given that it is a source of uncertainty in the value of firms that can increase a firm's cost of capital (Diamond and Verrecchia 1991), it demands attention. Employing the market microstructure approach to exploit the variance of high-frequency changes in stock price, this is the first study that reveals tweets’ temporary price impacts and identifies tweet attributes that elicit such short-term impacts on price.
We further find that tweets that embody both attributes—valence and subject matter—generate permanent price impacts; however, this impact varies according to the type of valence and subject matter. The results evidence the importance of interaction effects between tweet valence and subject matter in generating a higher permanent price impact. The average negative- and positive-valence tweet, when viewed through the lens of a consumer or competitor orientation, generates a permanent price impact, and a competitor-oriented tweet with a negative valence is likely to have the highest permanent price impact. This is a crucial finding from the perspectives of marketing practice and intraday social media marketing strategy design because valence, as a singular attribute, is associated with decreasing permanent price impact. Our research shows that information-rich tweets that include both variance and subject matter can result in permanent price impacts, and it demonstrates investors’ ability to act on information contained in FGC at subsecond levels (Hendershott et al. 2011; Rzayev and Ibikunle 2019).
To illustrate the relevance and magnitude of these findings, in Figure 2, tweets A and B are characterized by negative and positive valence, respectively, and tweets C and D reflect only consumer and competitor orientation, respectively. In line with our research findings, the permanent price impacts associated with these tweets are more than three standard deviations lower than the average permanent price impact estimates for all the 153,041 tweets in our sample and are therefore below the 10th percentile of the estimates. In contrast, tweets E to H reflect varying combinations of both valence and subject matter (consumer or competitor orientation). Consistent with our findings, we show that these tweets generate permanent price impact estimates ranked above the 90th percentile in our sample of tweet trades’ permanent price impact estimates. The temporary and permanent impact estimates for the average tweet are as large as 279 and 187 times, respectively, what we document for the average regular intraday transaction in our sample.

Examples of tweets characterized by valence and subject matter (consumer and competitor orientation).
Theoretical Background
FGC and High-Frequency Trading Data
Firms increasingly use social media because it provides greater reach and can be less costly than traditional channels for FGC dissemination (Kumar et al. 2016). FGC is often posted several times a day (Kanuri, Chen, and Sridhar 2018) and serves as a valuable source of high-frequency marketing data that can offer insights into the growth potential of a firm (Du et al. 2021). With the advancement of data collection tools (Wedel and Kannan 2016), marketing researchers can now record each piece of FGC and create large data sets depicting FGC attributes and their dissemination time. Recorded with accuracy to the second, FGC can then be mapped against the corresponding trading activity that takes place at subsecond intervals and used to study its financial impact. However, measuring the impact of FGC sampled at intraday levels requires marketing researchers to be able to utilize high-frequency trading data with observations occurring at unequal time intervals.
The market microstructure approach to estimating price impact offers marketing researchers tools to, piece-by-piece, algorithmically link FGC to time-specific trading activity at a fine-grained level of analysis (e.g., subseconds, seconds, minutes). Unlike symmetrical asset pricing models, market microstructure recognizes that a firm's stock price is only informationally efficient to the extent that it reflects all available and relevant information (Fama 1970). A firm's stock price, while reflecting information, is also distorted by noise generated by (temporary) non-information-based factors. Such factors can include trading frictions due to low levels of liquidity, defined as the ability to trade large quantities of a firm's stock quickly with little or no price impact (Amihud 2002; Grossman and Miller 1988), or the activity of traders who lack adequate information regarding the value of a stock, known as “uninformed traders” in the market microstructure literature (Glosten and Milgrom 1985; Kyle 1985). Estimating the proportion of stock price driven by information (relevant to the value of a firm) and the proportion driven by noise is a critical aspect of the analyses many studies conduct in the market microstructure literature (see Web Appendix D). However, this holistic view of both temporary and permanent price impacts is often missing from marketing research. The market microstructure approach allows marketing researchers to estimate the price impact of FGC at high frequencies and to identify both types of price impacts. A crucial element in such analysis is knowing the “event time” (i.e., timestamp), which refers to the time at which an event occurs, such as the FGC dissemination time. By deploying time series models to estimate changes in the components of price at high-frequency intervals (e.g., seconds) and then linking the FGC timestamp to the components, the instantaneous impact of FGC on firm stock price can be estimated.
FGC's Impact on Firm Outcomes
Extant research has primarily focused on linking FGC with consumer behavior (Colicev et al. 2018; Colicev, Kumar, and O’Connor 2019; Hewett et al. 2016; Kumar et al. 2016; Meire et al. 2019; Tellis et al. 2019) and firm performance (Borah et al. 2020; Colicev et al. 2018; Rust et al. 2021) (see Web Appendix E). With the focus on firm performance, Colicev et al. (2018), Borah et al. (2020), and, most recently, Rust et al. (2021) show that FGC affects firm value. Colicev et al. (2018) document an indirect effect of FGC volume on shareholder value measured using abnormal returns and idiosyncratic risks. Borah et al. (2020) were the first to demonstrate the direct impact of humorous FGC on firm value as measured by abnormal stock market returns. To demonstrate these impacts, they employed an event study that estimated abnormal returns and VAR modeling. However, these methods, as deployed, focus on daily activity, which can result in aggregation bias and misevaluation of FGC's impact on firm value (Rust et al. 2021). Moreover, the richness of such an assessment is compromised because short- and long-term impacts of FGC are not estimated (Gordon et al. 2021; Moorman and Kirby 2019). Finally, current marketing methods do not examine FGC attributes at a fine level of granularity (i.e., intraday frequencies), preventing marketing managers from moving beyond a “throw it on the wall and see what sticks” strategy (Hoffman and Fodor 2010, p. 47) in the design and dissemination of intraday FGC (Hewett et al. 2016).
High-Frequency Approach to FGC Analysis
The market microstructure approach responds to calls for more powerful methodological approaches that allow marketing researchers to harness the potential of rich data sources and develop insights capable of advancing theory and informing contemporary marketing practice (e.g., Du et al. 2021; Hewett et al. 2016; Lamberton and Stephen 2016; Wedel and Kannan 2016). The fine-grained level of analysis available using a market microstructure approach overcomes the limitations of low-frequency methodologies, such as VAR and daily event studies, to study FGC and its impact on firm value (i.e., it estimates the variance in firm stock price following FGC dissemination). Utilizing high-frequency intraday data, it adds richness to the assessment of FGC's financial impacts by distinguishing between permanent and temporary price impacts.
Temporary and permanent price impacts
Temporary price impacts are short-term impacts that result in momentary changes in the price of a stock before it returns to its pre-event (e.g., pre-FGC) value, and they are often the result of uninformed trader activity (see Web Appendix D). Uninformed trader activity could be driven by several factors; for example, it could be linked to investor uncertainty about the relevance of information (Hedge and McDermott 2003; Holthausen, Leftwich, and Mayers 1990) or trading friction due to liquidity constraints (Amihud 2002; Chordia, Roll, and Subrahmanyam 2008). Ignoring temporary price impacts can lead to misunderstanding the total impact of FGC, with prior research suggesting that temporary price impacts result in larger transaction costs (Chan and Lakonishok 1993) and firm cost of capital (Diamond and Verrecchia 1991). In contrast, an event (e.g., FGC) can generate a permanent price impact and result in the price attaining an enduring new value after the event. This occurs when the event provides information that updates informed investor/trader expectations related to a firm's long-term performance (Madhavan, Richardson, and Roomans 1997). Importantly, the microstructure approach also supports intraday actionability by assessing how the attributes of information signaled by these events influence temporary and permanent price impacts.
A state-space decomposition of firm stock price
Consistent with the market microstructure literature, this study estimates the permanent and temporary price impact of FGC by first conducting a state-space decomposition of firm stock price into its efficient (permanent) and inefficient/noise (temporary) components and then linking the changes in these components to individual pieces of FGC. State-space modeling is a tool for modeling an observed variable as the sum of unobserved variables (Hendershott and Menkveld 2014), and it is commonly used for the decomposition of price (Brogaard, Hendershott, and Riordan 2014; Hendershott and Menkveld 2014; Menkveld, Koopman, and Lucas 2007; Rzayev and Ibikunle 2019). Due to its efficiency when applied to ultra-high-frequency data like stock price movements, the state-space modeling approach for decomposing price has significant economic and methodological advantages over other commonly used methods (Hasbrouck 1991) such as VAR models.
An assumption underlying a standard VAR model is that data are sampled at regular frequencies, as variables at time t are regressed on variables dated at t − 1, t − 2, and so on. However, FGC and intraday trading data are often sampled at unequal time intervals, which suggests there would be many instances of missing variables in a model calibrated on regular time intervals (Rao 1986). The modeling of such data using VAR requires the alignment of variables misaligned in time either downward, by aggregating the data to a lower frequency, or upward, by interpolating the high-frequency data with heuristic rules such as polynomial fillings. Downward alignment eliminates potentially valuable information in the high-frequency data. Data aggregation is problematic (Silvestrini and Veredas 2008), as it can alter the lag order of autoregressive moving average models (Amemiya and Wu 1972), reduce the efficiency of the parameter estimation and forecast (Tiao and Wei 1976), affect Granger causality and cointegration among component variables (Marcellino 1999), and induce spurious instantaneous causality (Breitung and Swanson 2002). Upward alignment has also been deemed inefficient and dubious (Pavia-Miralles 2010) because a VAR approach assumes that the model specifies the high-frequency data-generating process. However, interpolation is not based on the multivariate model that generates the data but instead on heuristic rules, which, at a minimum, inevitably incorporate noise into the data and distort it.
State-space modeling offers a solution to the irregular frequency challenge inherent in intraday transaction data (Qian 2013). Specifically, the use of state-space modeling with a Kalman filter in maximum likelihood estimation of parameter estimates ensures maximum efficiency in dealing with unequal time intervals or irregular frequency in data. The use of a Kalman filter accounts for changes across periods of analysis with missing observations. This is a critical consideration in the use of state-space modeling for decomposing high-frequency time series because standard approaches do not deal with the “missing observations” caused by unequal data intervals. For example, estimating a standard autoregressive framework implies truncation of the lag structure and could potentially discount valuable information in high-frequency data. Using the Kalman filter facilitates the decomposition of any realized change in the time series (e.g., variance in the stock prices), such that the permanent or temporary component at any interval is estimated using all past, present, and future observations in the series. Thus, the purpose of filtering is to ensure that estimates are updated with the introduction of every additional observation (Durbin and Koopman 2012).
Heterogeneously informed traders and FGC attributes
With the estimation of FGC's temporary and permanent price impacts, marketing researchers can explore how FGC attributes influence the occurrence of these two types of price impact, which are driven by the existence of heterogeneously informed trading agents in financial markets (Grossman and Stiglitz 1980; O’Hara 2003). Thus, how information events, such as FGC, are observed and deciphered vary significantly between the two main groups of agents in financial markets: the informed and uninformed traders/investors (for a discussion on how the activities of informed and uninformed traders drive the asymmetric effects of information events in financial markets, see Web Appendix D). The valence and subject matter of FGC are attributes that should provide information signals to (informed) investors and thus generate a permanent price impact. This is because FGC subject matter (consumer and competitor orientation) relate to a firm's competitive advantage (Kumar et al. 2011; Lam, Kraus, and Ahearne 2010), which is not often public and can be difficult to observe because it is embedded in a firm's culture (Gebhardt, Carpenter, and Sherry 2006). The role of valence has also been documented in the literature (Sul, Dennis, and Yuan 2017; Van Heerde, Gijsbrechts, and Pauwels 2015), with the impact of negative valence appearing to be stronger than that of positive valence and thus more commonly associated with permanent price impacts (Tirunillai and Tellis 2012). There is also reason to expect that FGC valence may interact with FGC subject matter and induce a permanent price impact. The basis for this expectation comes from a branch of signaling theory recognizing that signal recipients combine information signals to make more informed decisions (Bhagwat et al. 2020; Tellis and Wernerfelt 1987).
Although ample evidence suggests that FGC valence and subject matter may generate a permanent price impact, note that the price impact of FGC cannot occur without trading in financial markets. Trading activity incorporates the information and/or noise content of an event (e.g., FGC) into price. Therefore, because trading agents in financial markets are heterogeneously informed due to how they observe and decipher the information content of events, their trading activities also generate varied price impacts. Specifically, a permanent price impact will arise as a result of trading activity by traders/investors who have been able to correctly decipher the information content of FGC—these are the informed traders. Conversely, the trading activity of those unable to decipher the information content of FGC (i.e., uninformed traders) will only induce temporary price impacts (Glosten and Milgrom 1985) because their trading activity is uncorrelated with firm value (Barclay and Warner 1993; Grossman and Stiglitz 1980). Accordingly, FGC that incorporates valence and subject matter can be associated with both permanent and temporary price impacts simply because of heterogeneously informed trading agents. The trading activity of informed traders thus contributes to the efficient component of price (i.e., permanent price impact), which is driven by information, whereas the activity of uninformed traders incorporates noise (i.e., temporary price impact), which is uncorrelated with firm-relevant information.
S&P 500 IT Firms’ Use of Twitter
We examine the instantaneous stock market impact of FGC by studying S&P 500 IT firms’ activity on Twitter. Twitter is a social media communication channel characterized by “fast-paced and short-lived information flows” (Lambrecht, Tucker, and Wiertz 2018, p. 177), from which deep insights can be derived if appropriate methods are developed (Wedel and Kannan 2016). In addition, with 92% of firms tweeting multiple times a day (Smith 2020), Twitter FGC is an example of high-frequency intraday marketing data. Finally, the Securities and Exchange Commission's Regulation Fair Disclosure recognizes Twitter FGC as potentially carrying “useful” information for investors. For these reasons, Twitter provides a suitable context to study. We study the IT sector because IT firms are often considered early adopters of trends (Blankespoor, Miller, and White 2014). The IT sector provides a comprehensive sample of firms disseminating multiple pieces of FGC throughout the day (see Web Appendix F). It is a major driver of economic activity, with the leading five IT firms in the United States accounting for more than 22% of the S&P 500 (Hill 2020). Globally, the IT sector is valued at $11.5 trillion, representing over 15.5% of the global gross domestic product (Henry-Nickie, Frimpong, and Sun 2019). Finally, the diverse consumer base of IT firms is useful for characterizing the relevance of FGC subject matter (consumer and competitor orientation) and its interaction effects with valence. A review of 10-K filings for each firm shows that 7% of the sample consists of firms marketing solely in B2C markets, 72% solely in B2B markets, and 21% selling in both B2C and B2B markets.
Data Set Construction
We obtained a sample of tweets using an application programming interface (API) to access Twitter data. In line with previous research (Lambrecht, Tucker, and Wiertz 2018; Vermeer et al. 2019) and following Chan et al. (2016), we employed the API to access tweets from corporate accounts for S&P 500 IT firms. In total, we obtained 153,041 firm-generated tweets from 64 firms, which we then used in our analysis. On average, this is 2,391.2 tweets per firm over our sample period spanning January 2013 to August 2018. It should be noted that these are tweets that fall within the limits of Twitter’s API in terms of the maximum number of tweets that can be accessed over a given time period. Among the IT firms we initially selected, we eliminated seven because either they did not have established corporate Twitter accounts or Twitter’s API limited access to their data. Firms included in the sample engaged in high-frequency intraday marketing activity. On average, they generated a minimum of 1.07 to a maximum of 37.03 tweets a day, with the total average equaling 4.42 tweets per firm per day (see Web Appendix F), which confirms the appropriateness of the selected sample. Table 1 shows the sample of ten S&P 500 IT firms generating the highest number of tweets per day.
Twitter Data Sample.

Excluded due to excessive return volatility.
Notes: Table 1 reports the frequency statistics for a sample of tweets generated between January 8, 2013, and August 17, 2018, for S&P 500 IT firms with stocks included in the S&P 500 Index. The table shows the ten firms with the highest average number of tweets per day. Web Appendix F provides the full sample of 64 S&P 500 IT firms.
We recorded each tweet with a timestamp to the nearest millisecond. 2 We then used these timestamps to obtain corresponding ultra-high-frequency stock trading activity data from the Thomson Reuters Tick History v2 database in Datascope for each tweet in the sample (see Table 2). This stock trading data supplemented the Twitter data set. Our data set included data for the trading days between January 2013 and August 2018. After performing data cleaning using the criteria consistent with that of Chordia, Roll, and Subrahmanyam (2001) and Ibikunle (2015), the stock trading data included 8,177,183,865 instances of trading activity or messages (i.e., quotes, cancellations, and transactions), which includes 520,356,393 transactions and 7,656,827,472 orders. 3
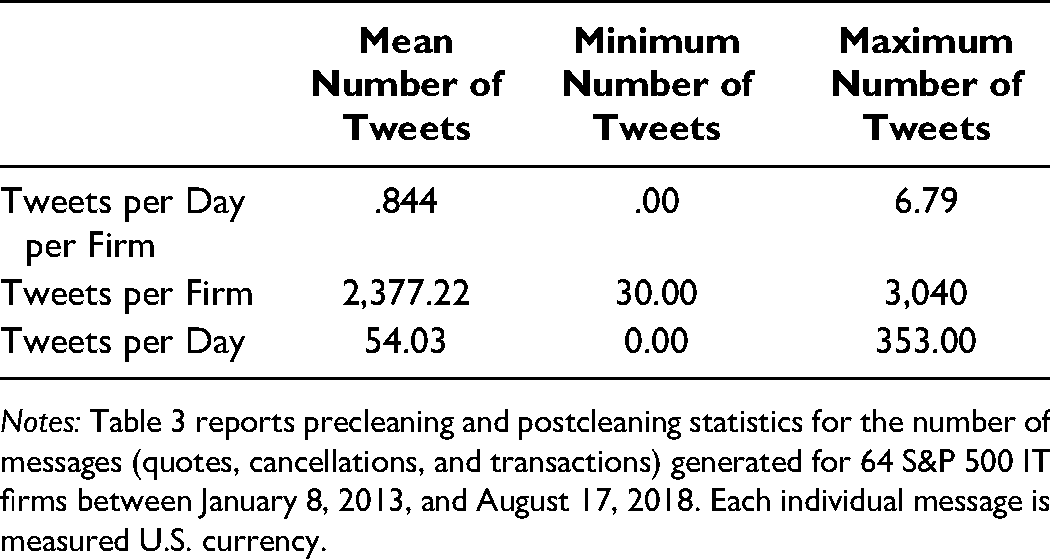
Trading Data Descriptive Statistics

Notes: Table 2 reports precleaning and postcleaning statistics for the number of messages (quotes, cancellations, and transactions) generated for 64 S&P 500 IT firms between January 8, 2013, and August 17, 2018. Data cleaning is completed by following Chordia, Roll and Subrahmanyam (2001) and Ibikunle (2015), and each individual message is measured U.S. currency.
After excluding days (and tweets generated on these days) with comparatively high levels of price volatility, the descriptive statistics show that the average time between trades is 7.159 seconds and the mean number of tweets per firm during the sample period is 2,377.22. The mean number of tweets per day is 54.03, and the mean number of tweets per day per firm is .844 (see Table 3 for details).
Descriptive Statistics of Tweet Activity.
Notes: Table 3 reports precleaning and postcleaning statistics for the number of messages (quotes, cancellations, and transactions) generated for 64 S&P 500 IT firms between January 8, 2013, and August 17, 2018. Each individual message is measured U.S. currency.
Investigating the Permanent and Temporary Price Impact of Tweets
To investigate tweets’ permanent and temporary price impacts respectively, we first used state-space modeling to estimate the permanent and temporary components of price at a given time interval using trading observations within that time interval. 4 The primary interval of interest was one second; however, we estimated for one minute as well for robustness. Next, we linked these estimates to firms’ tweet activity using tweets’ timestamps, which were labeled to the second. Thereafter, we estimated the impact of each tweet on the temporary and permanent components of price by estimating the corresponding absolute change in the components following each tweet as the respective temporary and permanent price impacts. The methodological steps are outlined next.
Step 1 (model characterization)
The first step involved modeling price as the sum of a nonstationary permanent (information-driven) component and a stationary temporary (noise) component.
5
In this step, the only relevant observations were the prices of the 520,356,393 transactions obtained from the Thomson Reuters Tick History v2 database. These prices were defined as the prices of stocks at intraday periods and intervals. In its simplest form, the structure of the state-space model for price, a multiple of S stock prices, T intraday periods, and N intervals, is expressed as follows:


The model captured in Equations 1–3 is a special case of the general state-space representation. The standard state-space model is formulated for a vector of time series 
Step 2 (model outputs)
The structure of the model shows that only changes in
Permanent and Temporary Components of Price: Descriptive Statistics.
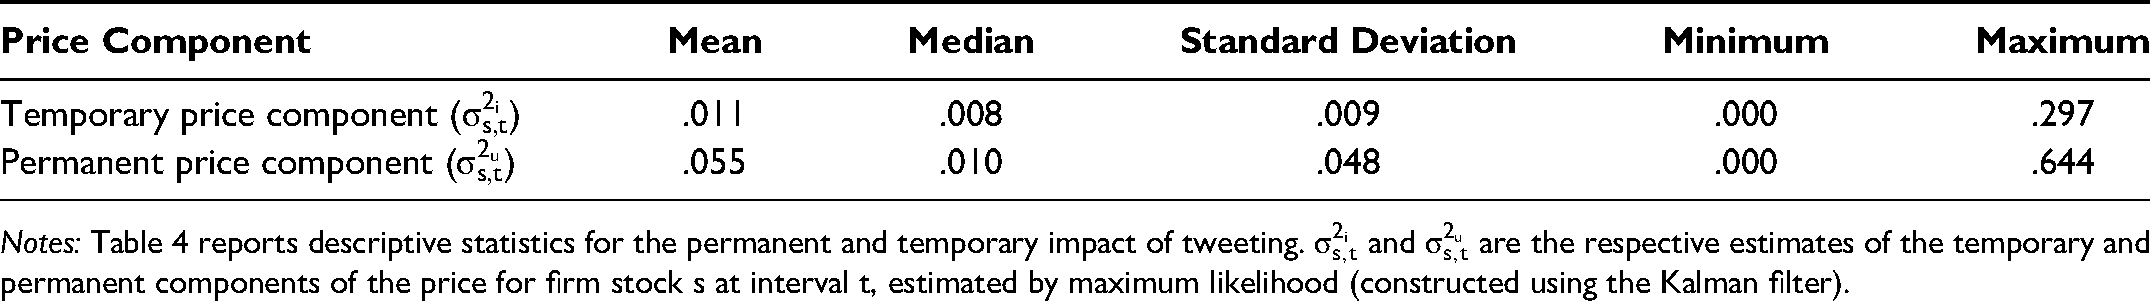
Notes: Table 4 reports descriptive statistics for the permanent and temporary impact of tweeting.
Step 3 (estimation with the Kalman filter)
We used the Kalman filter to evaluate the conditional mean and variances of the state vector
Step 4 (linking
and
to tweets)
Our empirical framework required linking an individual intraday tweet to a corresponding trade/transaction with price pt in our sample. We call each tweet-linked trade a “tweet-trade,” and t, in this case, corresponds to both trade and time. Accordingly, we designated a trade in the stock of a firm as a “tweet-trade” if it was the first trade to occur immediately after a tweet in our sample and if it occurred within 60 seconds of the tweet. For robustness, we varied this threshold but find our inferences to be consistent if the threshold is reduced to 30 and 45 seconds, suggesting that the link between tweets and trading of firms’ stock is not merely coincidental. The tweet-trade's time of occurrence allowed us to link a tweet to a corresponding pair of
Step 5 (estimating changes in
and
following a tweet)
The next step in our analysis was determining how a tweet/tweet-trade changes the composition of price with regard to 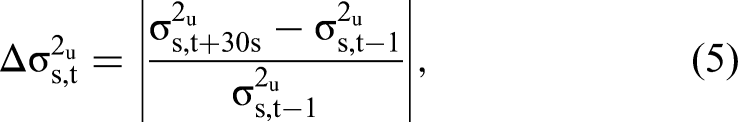
Ratios of the Price Impact of Tweet-Trades to the Price Impact of Other Trades.

***Statistical significance at the .01 level.
Notes: The t-statistics testing the null that the ratios equal 1 are presented in parentheses.
The estimates in Table 5 show that, on average, tweet-trades generate larger permanent and temporary intraday price impacts than non-tweet-trades. All the estimates are statistically significant at the .01 level, thus refuting the null hypothesis that there is no difference between the impact generated by tweet-trades and other trades. The price impact of a tweet-trade is 150–300 times larger than that of the average trade. Using the 60-second threshold,
Estimating the effects of tweet-trades within subminute to minute windows addresses methodological issues associated with the occurrence of confounding events. Therefore, to a very high level of accuracy, we can attribute estimated temporary and permanent price impacts to the observed FGC. Given the fine-grained level of analysis, it is highly unlikely that any other relevant event could be driving the effects we capture. The sampling at high-frequency intervals also raises the question of whether investors and other trading agents could digest and act on the contents of tweets within the price impact windows we examine. Addressing this question requires an understanding of the nature of trading in financial markets today, especially in the case of highly traded stocks such as the S&P 500 stocks in our sample. Today's markets are dominated by algorithmic traders (commonly known as “algos”) capable of digesting and acting on information in FGC (e.g., tweets) within the windows we examine in our analysis. The effects of this speed of activity are evidenced by the findings of Rzayev and Ibikunle (2019), who, using S&P 500 stock data, show that information arriving in U.S. markets is exploited within seconds and that this activity is driven by algorithmic trading.
Although all the ratios are statistically significant and suggest that FGC influences the permanent and temporary components of price, the obvious question is how economically meaningful tweet-trades are compared with other events that impact stock price. To answer this question, we conducted further analysis to examine the corresponding ratios of other large-impact non-tweet-trades in the same period by computing ratios similar to the ones presented in Table 5. This involved substituting a permanent price impact measure for each tweet-trade with that of other trades generating price impacts corresponding to one standard deviation or more above the daily mean in each stock. The obtained average ratios for the three thresholds are 7.9, 5.2, and 1.3 for the 30-, 45-, and 60-second windows, respectively. The inference drawn from this analysis is that the information content of tweet-trades is several times higher than that of the average non-tweet, high-impact trade. In comparing the temporary price impacts associated with the same trades with those of the tweet-trades, we find that tweet-trade ratios are again several times higher. This suggests that tweet-trades tend to be noisier than other trades associated with a more permanent price impact, and this provides a basis for demonstrating to marketers the significance of the relatively high levels of both permanent and temporary price impacts that can be generated in financial markets with the use of tweets. A robustness comparative analysis based on Frino, Jarnecic, and Lepone (2007) is consistent with the presented findings (see Web Appendix G).
Investigating the Temporary and Permanent Price Impacts of Tweet Valence and Subject Matter
To add intraday actionability, we used 
To avoid omitted variable bias and to ensure completeness, the model also includes
We estimated Equation 7 using both panel least squares and 2SLS instrumental variable (IV) estimation approaches. Panel-corrected standard errors were computed to obtain heteroskedasticity and autocorrelation robust standard errors. We performed the IV estimation to account for the likelihood of endogeneity due to selection bias caused by a firm’s decision regarding whether to use Twitter (Gong et al. 2017). The IV approach we employed was based on approaches adopted by an increasing number of studies in the marketing literature (Whitler, Krause, and Lehmann 2018). For a given firm in our sample of S&P 500 IT firms, our approach involved first identifying the firms in the same two-digit Standard Industrial Classification that had sent a corresponding tweet on the previous or same day as the firm and then estimating the mean value of the potentially endogenous variables (consumer and competitor orientation) for these firms. The mean estimates were employed as an instrument for the firm in question. This variable met the requirements for an instrument because price impacts observed in the other firms’ stocks were unlikely to be driven by the focal firm’s tweets and, at the same time, tweeting activity has been shown to be correlated for firms in similar industries. In each of the first-stage regressions, we regressed each of the consumer and competitor variables separately on the corresponding IVs and the control variables defined previously for each firm/stock and obtained the F-statistics as tests of the null of weak instruments. The fitted values for each of the measures from the first-stage regressions were then employed as the variables in place of the consumer and competitor orientation variables in the second-stage regressions.
The first-stage F-statistics, testing the null of weak instruments, show that our IV model does not suffer weak instrument issues. The test statistic is higher than the threshold of 10 needed for 2SLS inferences to be reliable when instrumenting for endogenous variables (Stock, Wright, and Yogo 2002). We also conducted further tests to examine the instruments’ relevance and the validity of the overidentifying restrictions in the IV regressions. The Cragg–Donald and Kleibergen–Paap Lagrange multiplier statistics we obtained reject the nulls of weak instruments and underidentification according to the Hausman, Stock, and Yogo (2005) critical values, respectively. Essentially, these test the null hypothesis that the instruments we used have insufficient explanatory power to predict the endogenous variables in the model for identification of the parameters. All the p-values we obtained in the Sargan χ2 test also indicate that we cannot reject the null that the overidentifying restrictions are valid. All the 2SLS estimates for Equation 7 are presented in Table 6, and the results of the panel least squares estimations are presented in Web Appendix H.
The Relationship Between Permanent and Temporary Price Impact and Tweet Valence and Orientation.

**p < .05.
***p < .01.
Notes: Table 6 reports 2SLS estimated coefficients for Equation 7. Standard errors are robust to heteroscedasticity and autocorrelation, coefficients are multiplied by 107, and t-statistics are reported in parentheses. LM = Lagrange multiplier.
The results presented in Table 6 show the importance of tweet valence and subject matter in determining the permanent and temporary impacts of tweets on firm value. The existence of permanent and temporary price impacts associated with tweet attributes supports the signal theory perspective (Kirmani and Rao 2000) and shows that investors pay attention to the tweet attributes of valence and subject matter. The estimates of permanent price impact for
With respect to tweet subject matter, only tweets conveying information about competitors generate statistically significant permanent price impacts (−.034, p < .05). Therefore, on average, tweets about a firm's competitors generate lower permanent price impact relative to other tweets. Conversely, the positive and statistically significant estimates for
Inferring from information-based market microstructure models (Glosten and Milgrom 1985; Kyle 1985), the more information about a firm investors observe, the more they become informed about the valuation of the firm. In line with this expectation, the interaction variables we include in Equation 7 should yield positive estimates for the
Furthermore, the findings suggest that tweets about competitors with a negative valence are likely to have the highest permanent price impacts (.606, p < .001). This finding is crucial from the perspective of marketing practice and intraday social media marketing strategy design because valence and competitor subject matter as singular attributes of FGC are independently associated with decreasing permanent price impact. The findings underscore the view that investors seek additional information (i.e., information beyond what they already have) when making trading decisions (Bhagwat et al. 2020; Tellis and Wernerfelt 1987) and that they operate according to classical market microstructure models. For example, Kyle (1985) and Glosten and Milgrom (1985) emphasize the crucial importance of information for price discovery in financial markets. This also confirms Li, Van Dalen, and Van Rees’s (2018) findings that information from microblogging platforms, such as Twitter, impact investors’ decisions.
To illustrate the relevance of these findings, Figure 3 presents tweets A and B as examples of FGC characterized by negative and positive valence, respectively, but not containing any subject matter related to competitor or consumer orientation. Consistent with our findings, the permanent price impact estimates for the tweet trades corresponding to both tweets are more than three standard deviations lower than the average permanent price impact estimate and are thus below the tenth percentile of the estimates. The estimates for the negative and positive tweets’ tweet-trades are .0017% and .0035%, respectively. In contrast with A and B, tweets C, D, and E reflect varying combinations of both valence and subject matter. Our findings suggest that these tweets should generate significant permanent price impact, and indeed, the permanent price impact estimates for the tweet-trades corresponding to tweets C, D, and E are above the 90th percentile in our sample of tweet-trades’ permanent price impact estimates. The estimates are 3.74%, 2.84%, and 1.32% for tweets C, D, and E, respectively.
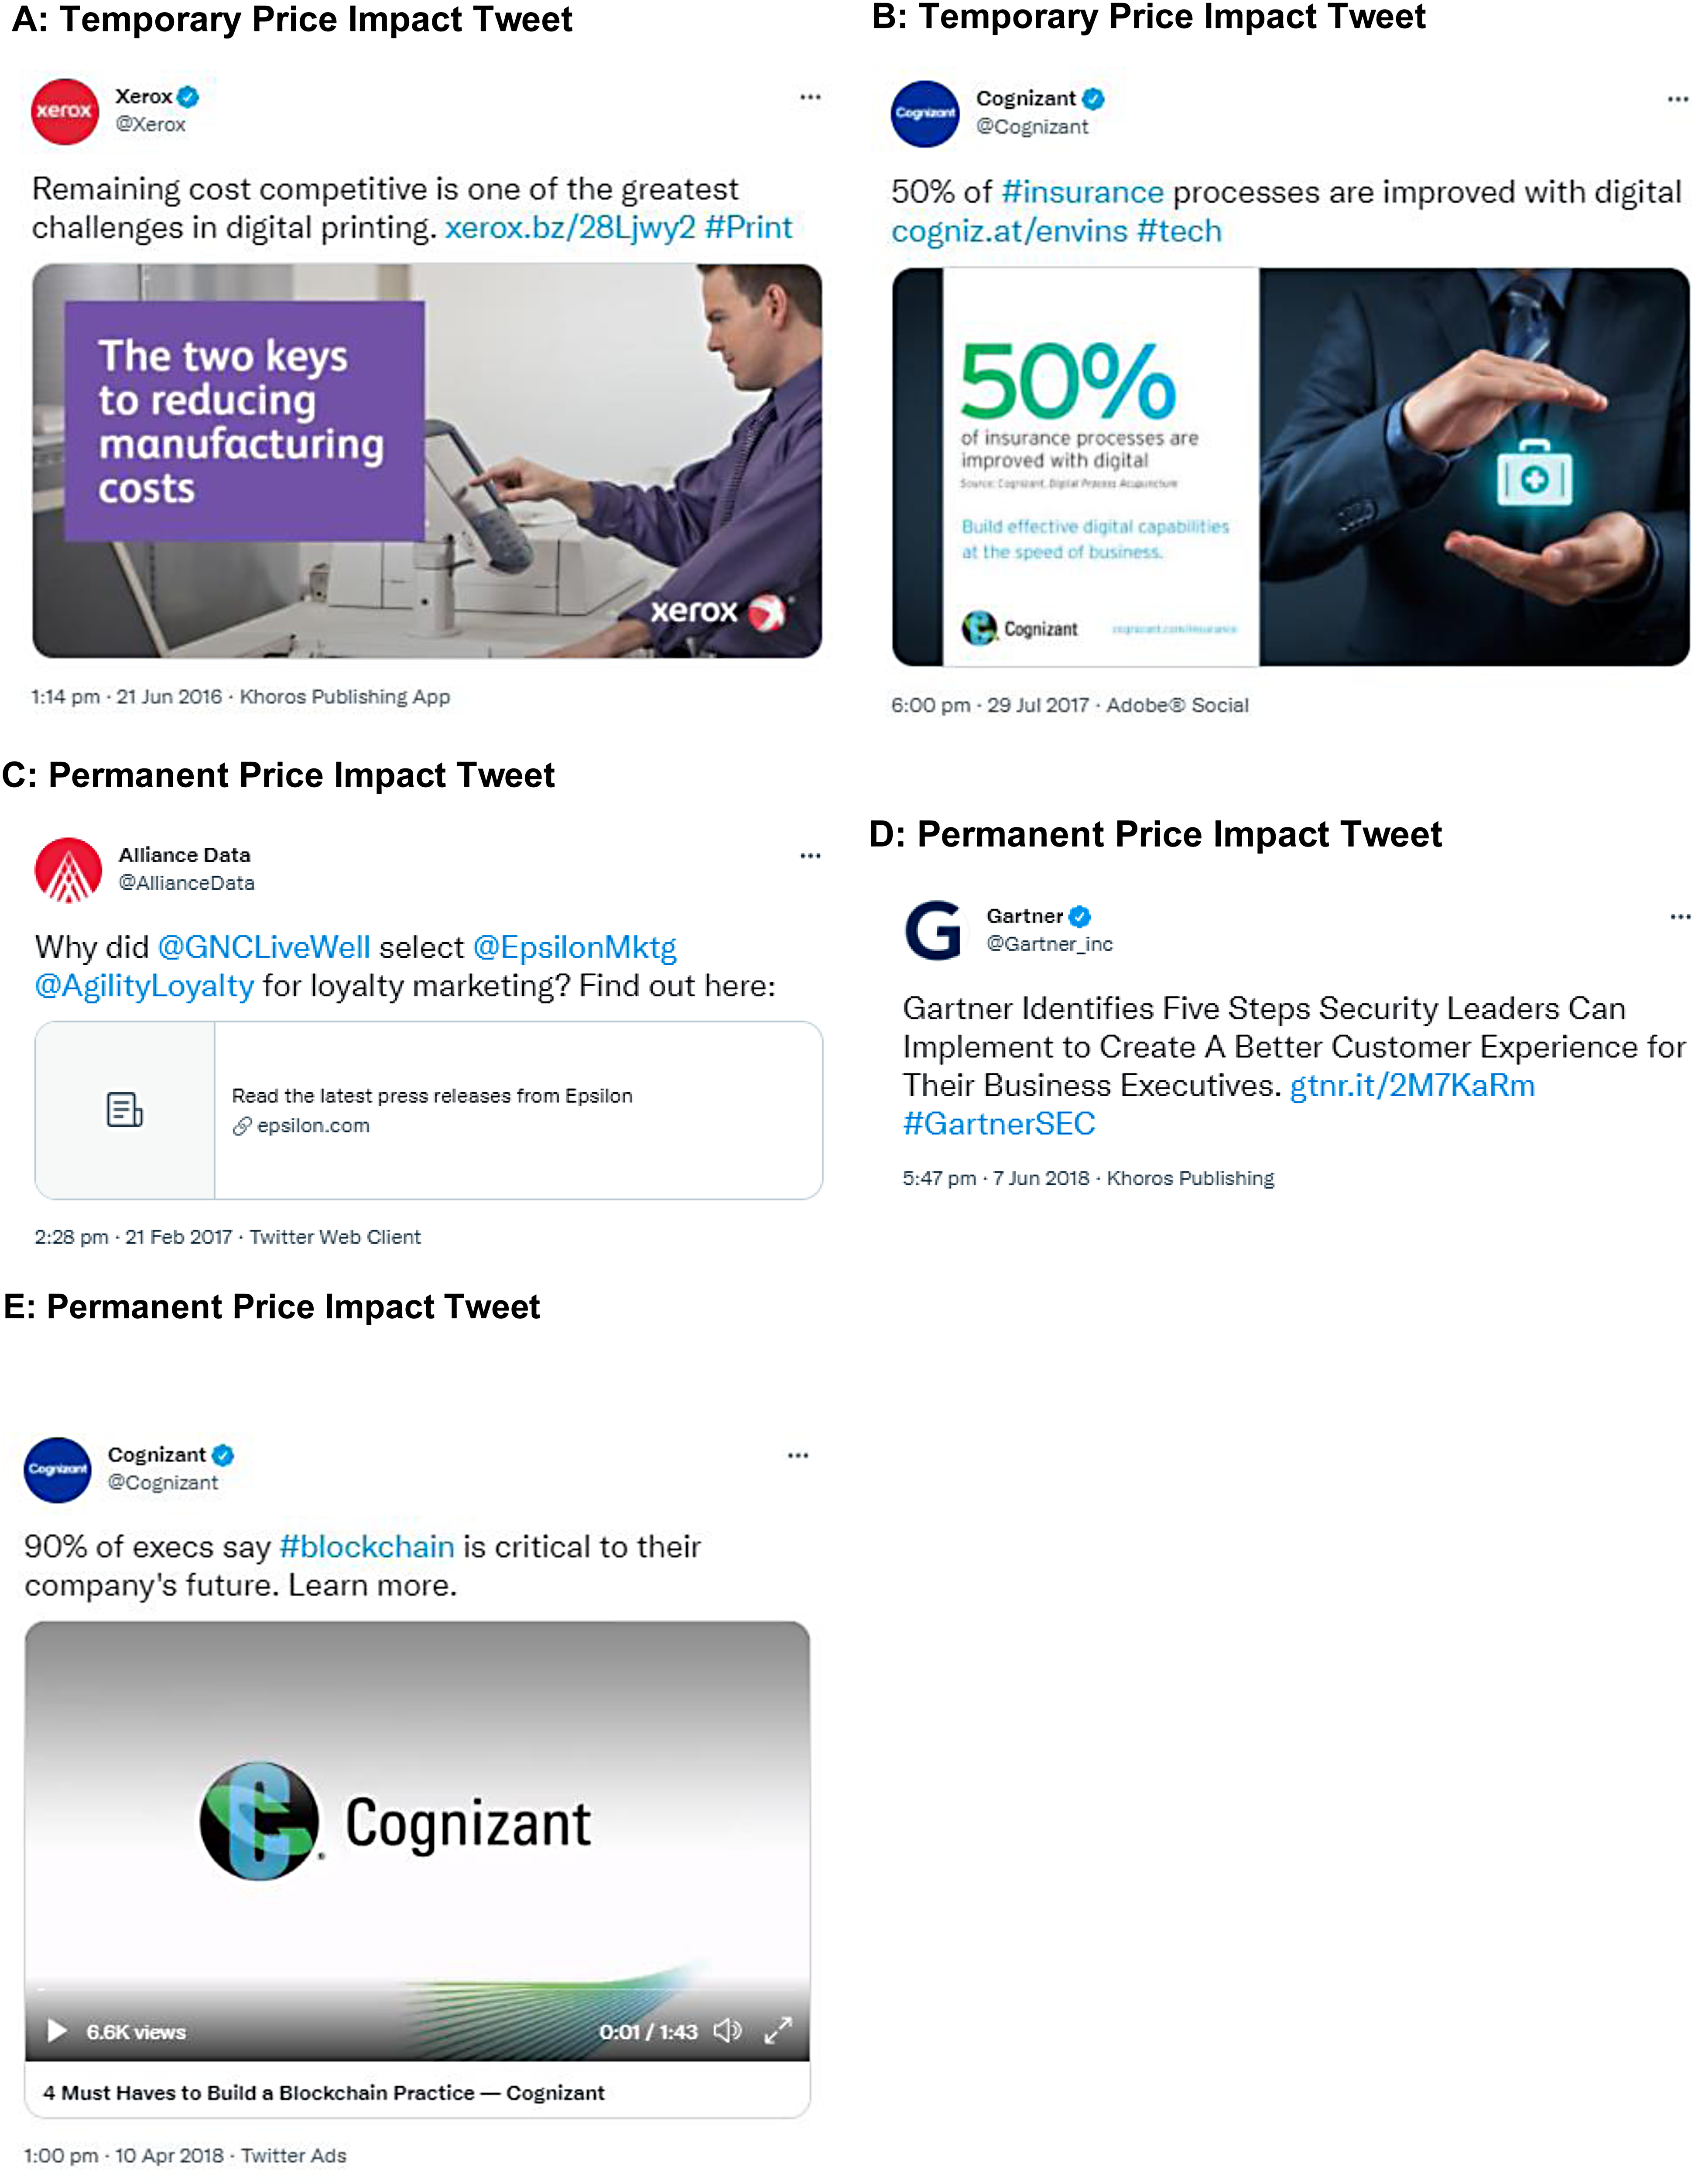
Examples of tweets generating temporary and permanent price impacts.
The effects of the tweet attributes we studied on temporary price impact,
In conclusion, the estimates presented in Table 6 highlight the relevance of tweet attributes for the price discovery process in financial markets and reinforce the importance of studying the multifaceted nature of FGC (Kumar et al. 2016). We find that tweets, as with many events observed in relation to trading in financial markets, generate both permanent and temporary price impacts. However, whereas tweets containing singular attributes—either positive or negative valence or either consumer or competitor orientation—readily inject noise into the price discovery process and thus generate temporary price impact, those that include more than one attribute generate permanent price impact and thus generally enhance the efficiency of the price discovery process.
Discussion
In this research, we examine the real-time impact of FGC on the variance of firms’ stock price. In the current fast-paced online communication landscape, marketers must understand the financial impact of firms’ “always on” marketing (Rust et al. 2021). The assessment of FGC's financial impacts, however, is in an early stage (Borah et al. 2020; Colicev et al. 2018; Rust et al. 2021). This research contributes to this emerging stream of marketing research and addresses multiple calls for new methods that are able to develop real-time insights from online data (Berger et al. 2020; Lamberton and Stephen 2016; Moorman et al. 2019; Wedel and Kannan 2016). By employing the market microstructure approach to study S&P 500 IT firms’ Twitter activity, this study contributes to marketing literature and practice.
Research Contributions
This study offers several implications for marketing research. First, aligning with the work by Colicev et al. (2018), Borah et al. (2020), and Rust et al. (2021), it advances understanding of FGC's financial impact by providing an assessment of FGC's impact on the variance of stock price in real time (i.e., seconds). By employing a market microstructure approach, we show how to algorithmically link individual pieces of FGC to time-specific trading activity at a fine-grained level of analysis. In the process, we demonstrate the limitations of low-frequency methodologies such as daily event studies, which are subject to aggregation bias and may yield biased estimates of the impact of FGC on firms’ financial outcomes, while offering an alternative and more robust method of analysis for studying intraday marketing activity. In our examination of the impact of FGC on variance, we fully utilized high-frequency transaction data characterized by unequal time intervals and demonstrate how to retain data that otherwise would have been eliminated in studies that use end-of-day stock price. By doing so, we provide marketing researchers with a new approach that allows them to harness the potential of online data.
Second, we distinguish between FGC's temporary and permanent price impacts. Specifically, we show that FGC impacts investor expectations related to a firm's future performance, thus generating permanent price impact, and it also injects uncertainty about a firm's value into the firm’s stock price, thus inducing temporary price impact. Our research, therefore, adds a new perspective to the marketing literature stream on the financial impact of FGC. This assessment of FGC's temporary and permanent price impacts adds richness to the examination of marketing's financial impact and enables the quantifying of long- and short-term financial impacts of marketing activity.
Finally, this research has implications for the design of intraday marketing strategies. By examining FGC valence and subject matter (consumer and competitor orientation), we advance a growing body of research documenting the complex nature through which marketing signals impact financial markets and firm financial outcomes. We show that, by themselves, FGC valence and subject matter are more prone to injecting uncertainty about a firm's stock price into the market, and thus, they generate temporary price impacts rather than permanently changing investors’ and traders’ beliefs about firm value. Used together, FGC valence and subject matter both hold statistically significant and economically meaningful relevance for price discovery in financial markets. In other words, they can influence investors’ expectations related to firms’ future performance and thus result in permanent price impacts. Recent research by Bhagwat et al. (2020) provides evidence of interactions between marketing signals, and our research shows that the interaction between FGC valence and subject matter can also impact firm stock price.
Managerial Implications
Thus far, firms have struggled to demonstrate financial accountability regarding FGC’s impact on firm value (Colicev et al. 2018; Kumar et al. 2016) or provide evidence of its immediate contribution to their financial outcomes (Magill, Moorman, and Avdiushko 2019; Moorman and Kirby 2019). We provide marketing managers with evidence of FGC's impact on variance in firms’ stock price. Specifically, we show that tweets can generate both permanent and temporary price impacts. By manipulating tweet attributes, such as valence and subject matter, marketing managers can design Twitter content to generate varying degrees of permanent or temporary impact. From a market quality perspective, firm managers should prefer tweets that generate a permanent price impact, and our research provides some useful indications about how to achieve this outcome. We show that tweets expressing degrees of positive or negative valence regarding either consumers or competitors generate a permanent price impact. We therefore encourage marketing managers to design information-rich tweets that both (1) focus on consumers or competitors and (2) communicate valence. Our results suggest that firms should utilize valence and subject matter in their tweets if they would like their stock to be more informative with respect to their value. Our analysis suggests that tweets about competitors with a negative valence are likely to have the highest permanent price impacts. Thus, by using permanent price impact as a metric to evaluate the longer-term impact of tweets, social media managers can design campaigns that have a sustainable impact on firm financial outcomes. The design recommendations from this study complement Kanuri, Chen, and Sridhar’s (2018) work on social media content scheduling, as well as Rust et al. (2021), which addresses real-time social media marketing and provides firms with information regarding which tweets to disseminate during the day for long-term effectiveness. We recognize that not all intraday tweets will, nor should they, have permanent impacts on firms’ stock price. Some tweets are aimed at the creation of social media buzz, which is related to the temporary price impacts we examined in this study. Firms can indeed achieve social media buzz by tweeting, as our findings reveal that tweets, in aggregate, mostly generate temporary price impacts. We urge caution, however, because temporary price impacts are linked with larger transaction costs (Chan and Lakonishok 1993) and increases in firm cost of capital (Diamond and Verrecchia 1991). This suggests that the benefits of designing tweets to generate buzz and incorporate information into stock price must be carefully managed. To support marketing managers in their intraday social media strategy design, Table 7 is designed as a set of insights based on our findings.
Suggested Insights for Marketing Managers.

 = no price impact;
  = negative impact on stock price component;
  = positive impact on stock price component;
  = increased positive impact on stock price component.
Limitations
We conclude by encouraging future research to address the limitations of our empirical study. One potential limitation of our analysis is its focus on firms in the IT sector. We recognize that these findings may not apply to other sectors. Future research could extend our analysis to other sectors to confirm whether similar price impacts hold. Second, the impact of tweets could depend on whether Twitter was the first source through which a firm released an important piece of news. For example, tweets could have been published in response to a competitor's tweet. In some cases, a firm's tweet could lead to a number of successive tweets, in which case the subsequent tweets might not be as impactful as the first. We do not discount the possibility that there could be some carryover or dampening effect in such situations. We note that, if this is the case, it would be highly unlikely for the magnitude of the effects we observe to occur, especially given the granular level of analysis that our market microstructure approach entails. Third, future work could explore high-frequency data generated by firms’ use of FGC other than tweets, such as Facebook posts, where it has been reported firms post up to 80 times a day (Hutchinson 2018). It would be interesting to see whether the effect of FGC across social media platforms is consistent or if it varies. In addition to social media, it would be useful to examine firms’ use of other online communication tools, such as webpages and blogging platforms. Researchers could also explore various types of FGC, including video content, as well as its characteristics, including emotions (Tellis et al. 2019). As Hewett et al. (2016) show, there is an array of online marketing communication practices, and future research could therefore study the “echoverse” at a fine-grained level of analysis. Finally, we note that researchers can apply market microstructure to study user-generated content (UGC) in future research. We welcome future research that addresses the following questions: What is the real-time impact of UGC on firm value? What are the UGC attributes capable of generating permanent and temporary price impacts? Are these attributes the same as for FGC, or do they differ? Our research highlights the importance of interaction effects when examining the impact of FGC attributes on firm value; therefore, investigating the optimal mix of UGC attributes capable of generating temporary and permanent price impacts should be an interesting endeavor.
Supplemental Material
sj-pdf-1-jmx-10.1177_00222429211042848 - Supplemental material for Measuring the Real-Time Stock Market Impact of Firm-Generated Content
Supplemental material, sj-pdf-1-jmx-10.1177_00222429211042848 for Measuring the Real-Time Stock Market Impact of Firm-Generated Content by Ewelina Lacka, D. Eric Boyd, Gbenga Ibikunle and P.K. Kannan in Journal of Marketing
Footnotes
Associate Editor
Hari Sridhar
Declaration of Conflicting Interests
The author(s) declared no potential conflicts of interest with respect to the research, authorship, and/or publication of this article.
Funding
The author(s) received no financial support for the research, authorship and/or publication of this article.
Notes
References
Supplementary Material
Please find the following supplemental material available below.
For Open Access articles published under a Creative Commons License, all supplemental material carries the same license as the article it is associated with.
For non-Open Access articles published, all supplemental material carries a non-exclusive license, and permission requests for re-use of supplemental material or any part of supplemental material shall be sent directly to the copyright owner as specified in the copyright notice associated with the article.