
Abstract
In many pathology laboratories, both microwave ovens and pressure cookers are used for pretreatment of cytologic smears and paraffin sections to allow MIB-1 staining. For both methods there are two problems. First, the results cannot be used for quantitation because standardization is impossible. Second, the staining results are often suboptimal, resulting in negative staining of cells in the G1- and S-phases. When pretreatment is performed in a microwave processor, allowing microwave heating under pressure, precise temperature monitoring becomes possible. In addition, the importance of the pH of the buffer was studied using a test battery series. Optimal staining is achieved at a temperature of 115C, 10 min, pH 6. This method proved to be highly reproducible. Because the immunostaining results are optimal, the various phases of the cell cycle can be defined in the sections and smears. In addition, the perinucleolar staining of the late G1-phase is optimally visualized and nuclei of the stable pKi-67 pathway can be identified. Under suboptimal conditions, in particular, the number of cells in the late G1-phase are underestimated in the MIB-1 counts. (J Histochem Cytochem 47:1015–1020, 1999)
T
Materials and Methods
Tissues and Cells
Tissue samples of an adenocarcinoma of the breast were fixed in neutral buffered formalin for 24 hr and 1 week, and embedded in paraffin. Three-μm sections were mounted on 3-aminopropyltriethoxysilane (APES)-coated slides and dried at 60C for 1 hr to prevent detachment during MW heating. Tissue sections were deparaffinized in two changes of xylene for 10 min each and dehydrated before immunostaining.
Cytological specimens were obtained from seven fine-needle aspiration biopsies routinely sent to the cytology laboratory for diagnosis. The cases were three melanomas, two adenocarcinomas, one malignant lymphoma, and one malignant fibrous histiocytoma. These aspirations were routinely collected in 50% ethanol with 7% polyethylene glycol 300. Cytospin preparations were made using APES-coated slides. The very cellular samples were diluted to obtain a mono-layer specimen. To prevent detachment of the cells in these sediments, drying at 60C is needed for at least 1 hr.
Antigen Retrieval Solutions
Tris-HCl buffer solutions (pH 2 and pH 9) were prepared from a 1 M stock solution of Tris (hydroxymethyl-aminomethane) and 1 M HCl, diluted with distilled water to 0.1 M. Citrate buffer, pH 6, was prepared by mixing 0.1 M citric acid and 0.1 M sodium citrate (ratio 0.9:4.1) and diluting with distilled water to 0.01 M. The pH was checked before MW heating under pressure. To obtain a buffer solution with the proper pH, 1 M HCl or 1 M NaOH was added drop by drop. All chemicals were purchased from Merck (Darmstadt, Germany).
Microwave Heating Under Pressure
Microwave heating under high pressure was performed with the MicroMED URM. This MW processor has a maximal power output of 1000 W. Time, temperature, and pressure can be adjusted using a touch screen personal computer (PC). Microwave power and pressure are controlled through sophisticated software. The pressure is regulated as a function of the temperature, which allows heating of retrieval buffer solution at constant temperatures higher than 100C without bubbling. A glass dome specially designed to withstand pressure conditions rotates within the microwave cavity. The dome is provided with an automatic raising and lowering mechanism controlled by the PC. A fiberoptic sensor monitors the temperature of the buffer solution within the dome. The apparatus was originally designed for rapid histoprocessing (Visinoni et al. 1998) but also appears to be very well suited for other MW methods, including accelerated staining of tissue sections and AR by heating tissue sections in a buffer solution under pressure. For AR, we used a plastic jar with 250 ml retrieval solution, which was centrally placed in the dome within the microwave cavity. The test battery included four different temperatures (90, 95, 100, and 115C), four different heating periods (2.5, 5, 10, and 20 min) and three pH values (Tris buffer pH 2, citrate buffer pH 6, and Tris buffer pH 9). In all experiments the pressure in the glass dome was between 1900 and 2000 mbar.
Immunohistochemistry
After MW heating under pressure, the slides were allowed to cool in the buffer solution for 20 min, washed in distilled water and PBS. Endogenous peroxidase was blocked with 3% hydrogen peroxide in distilled water for 30 min. For immunostaining, we used the MIB-1 antibody from Immunotech (Marseille, France) at a dilution of 1:300 and a two-step indirect peroxidase detection system, as previously described by Koopal et al. (1998). Hematoxylin was used as a nuclear counterstain.
Of the test battery series, the intensity of the staining was recorded as negative (−), weak and, in mitotic figures only (+), moderate (++), strong (+++), and very strong (++++).
MIB-1 Scoring
Two successive tissue sections of the adenocarcinoma of the breast were used for assessment of reproducibility of AR in the MicroMED URM. After AR and immunostaining, MIB-1 counts were determined as follows. In both tissue sections, three identical areas were selected showing high, intermediate, and low MIB-1 counts at low power (x10 objective). In each of these three areas, the MIB-1 index was determined by counting 500 tumor cell nuclei. In the MIB-1 counts we included both nuclei with perinucleolar MIB-1 staining and nuclei with nucleoplasmic MIB-1 staining. This was done by one of us (AJHS) who has broad experience in scoring of MIB-1 and comparable immunostaining results. Intraobserver and interobserver reproducibility tests were not performed.
MIB-1 Staining in the Various Phases of the Mitotic Cycle
Du Manoir et al. (1991) identified the following MIB-1 staining patterns: G0 pattern, no staining; early G1 pattern, no staining; late G1 pattern, first selective nucleolar staining followed by an additional light and diffuse nuclear staining; early S pattern, increasing nucleolar staining and increasing diffuse nuclear staining; late S pattern, an additional fine granular nuclear staining; G2 pattern, strong diffuse and granular staining, resulting in little contrast with the stained nucleolus; prophase, nucleolus no longer visible, large clumps in the nucleus; metaphase, chromosomes are visualized and the mitotic spindle can be seen. In addition, these authors recognized small nuclei with a speckled nuclear staining pattern, classified by them as cells in the G1-phase of the so-called stable pKi-67 pathway.
Influence of temperature, exposure time, and pH of the retrieval buffer on MIB-1 immunostaining results
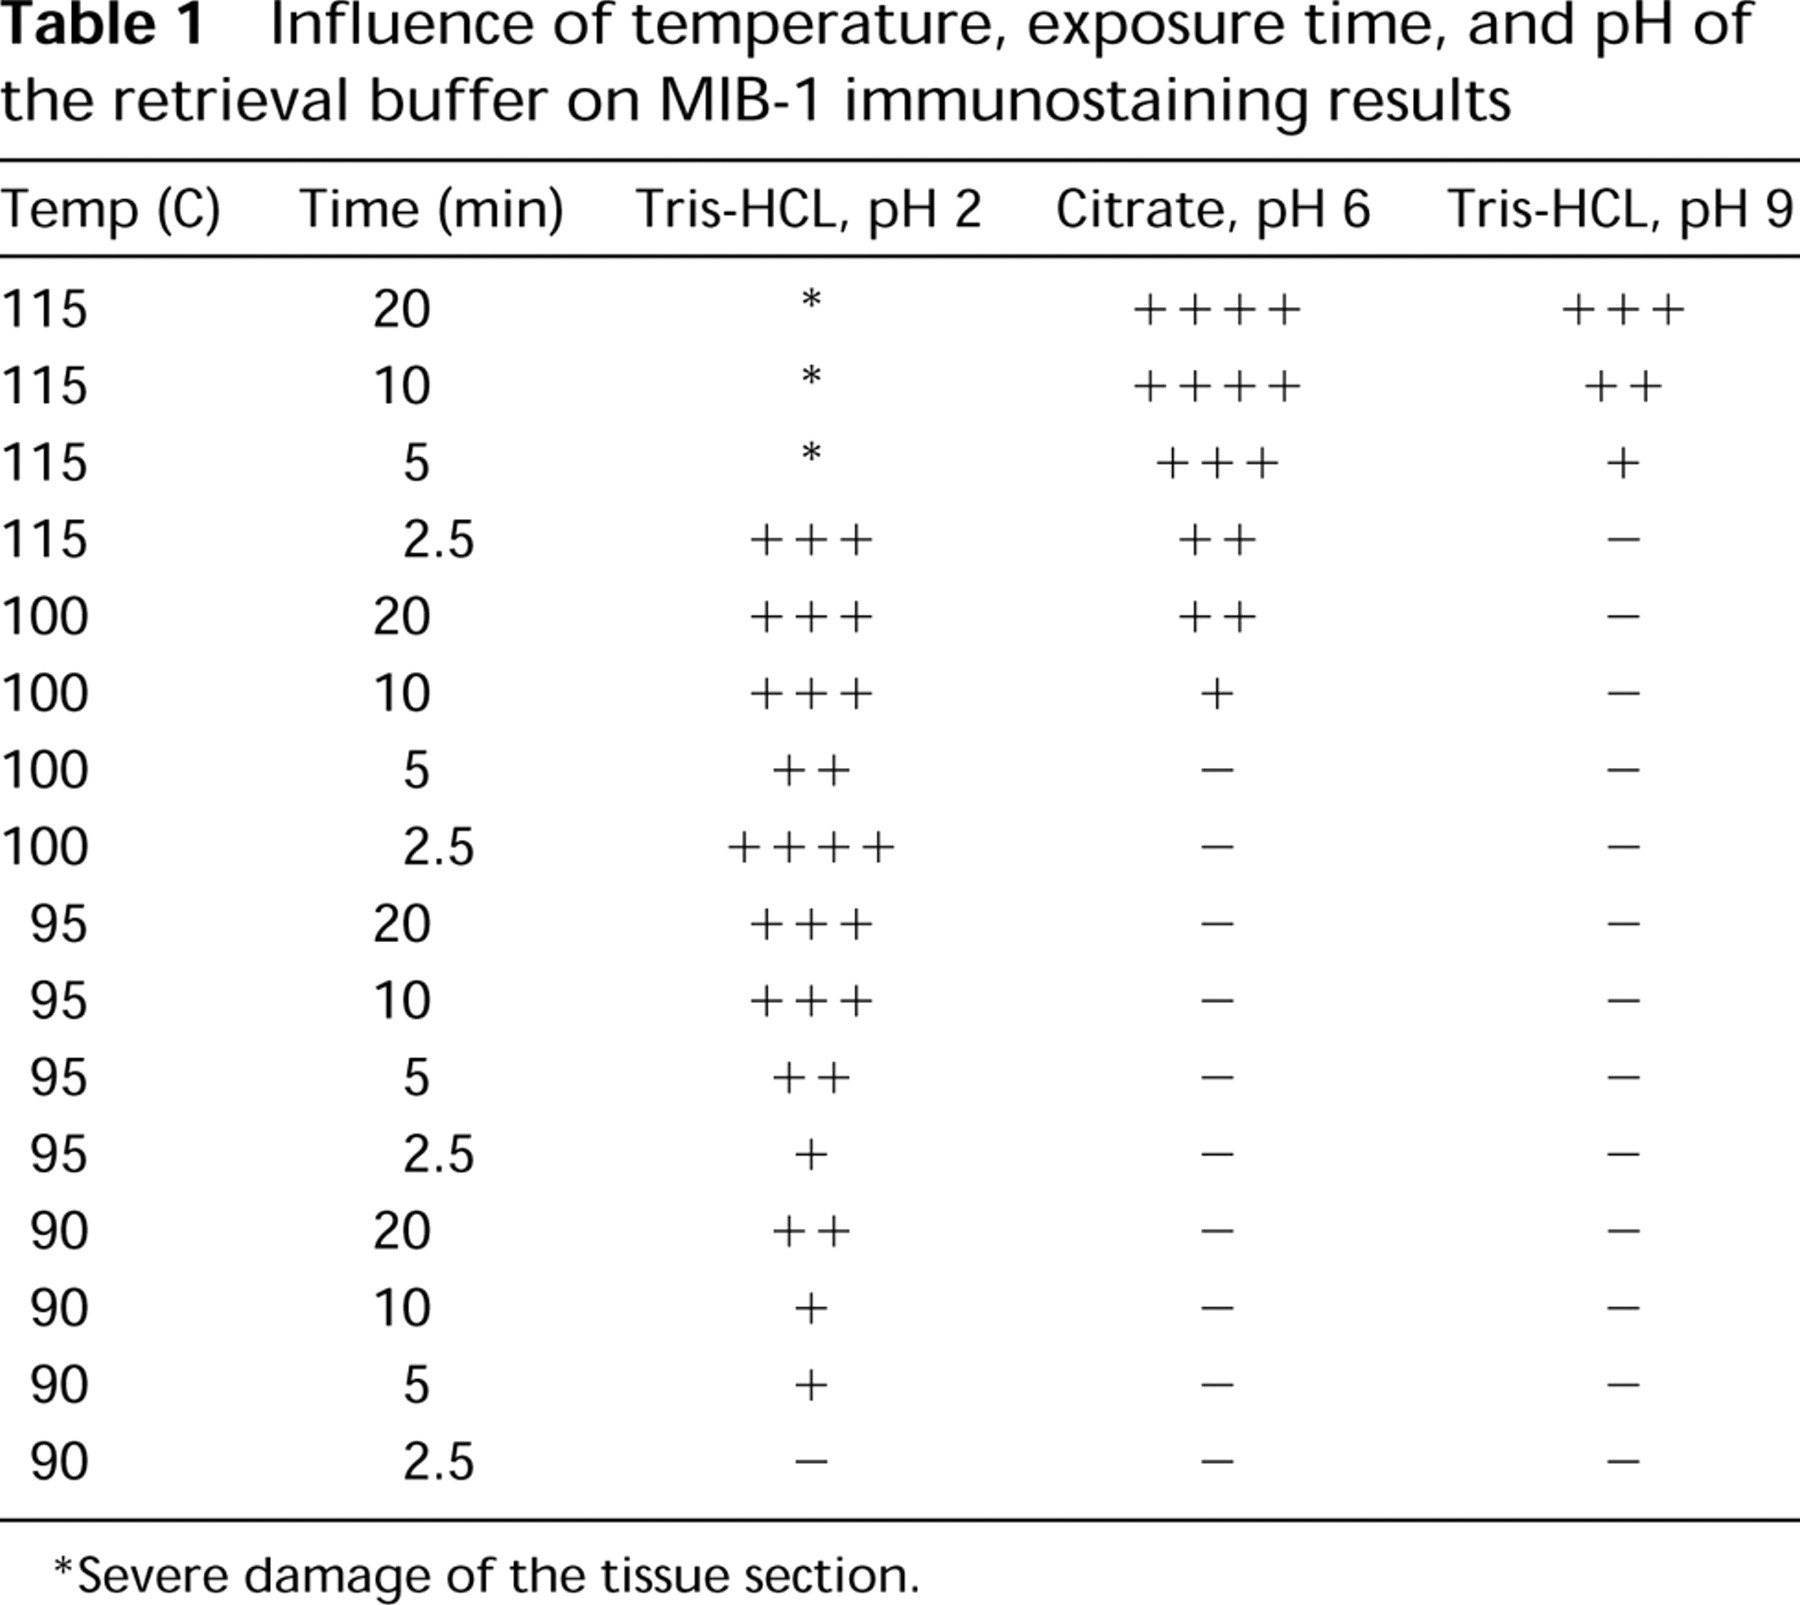
Severe damage of the tissue section.
Results
Histology
Table 1 summarizes the results of the test battery series of MW heating under pressure in the MicroMED URM for tissue samples fixed in formalin for 24 hr. The staining results depend on the pH of the retrieval fluid (note that we did not test for pHs between pH 2 and pH 6 because we know that in this range there is little or no staining). For the three tested pHs, the staining results depended on temperature and heating time. The higher the temperature, the sooner optimal staining could be achieved. In optimally stained (type ++++) sections, it was easy to identify the cells in the various phases of the mitotic cycle according to Du Manoir et al. (1991), with the exception of nuclei in the G1-phase of the so-called stable pKi-67 pathway (small speckled nuclei).
It should be remarked that in suboptimal sections type +, only nuclei in which the chromosomes have condensed to recognizable structures stain positively. Therefore, under such circumstances there are no longer any nuclei with nucleolar staining. In sections graded as type ++ and type +++, it was difficult or impossible to see the difference between the G1-, the S-, and the G2-phase. At low pH (2), the hematoxylin nuclear counterstaining became very pale and it became more difficult to count the numbers of MIB-1 staining nuclei because the nonstaining nuclei were not easily discerned. In addition, the tissue became highly damaged. At high pH (9), the opposite occurred: the hematoxylin counterstain was intense and the tissue remained intact.
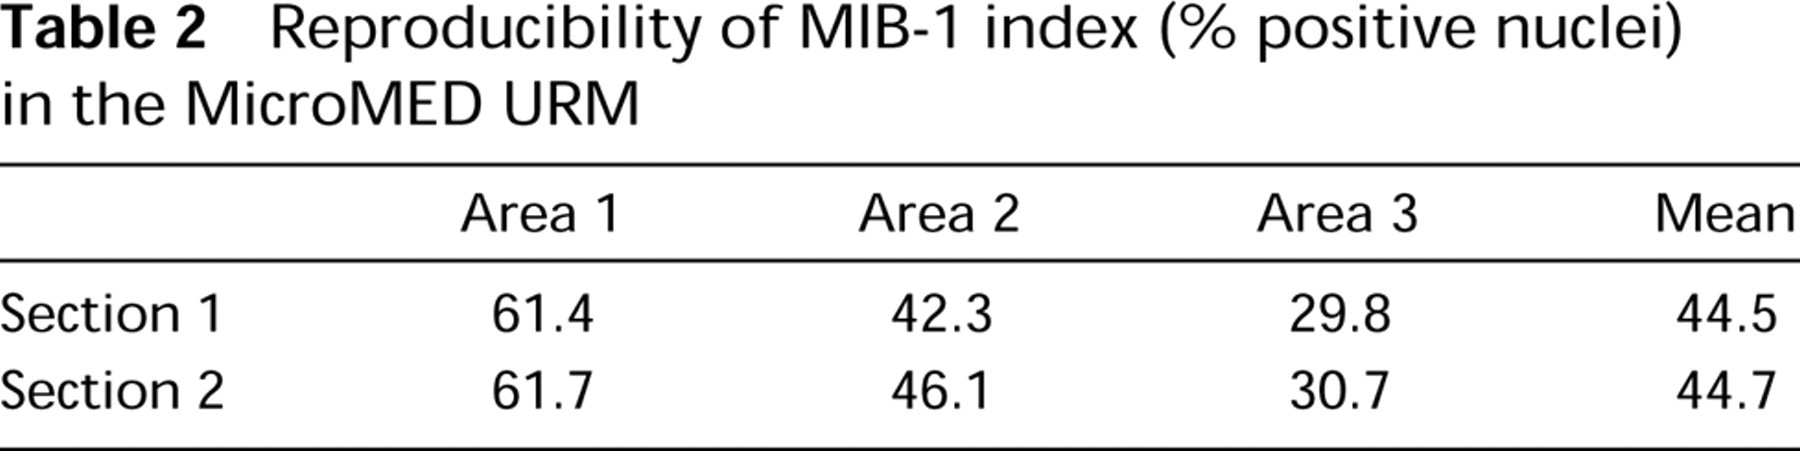
For routine use, the following method was chosen: pH 6, 115C, 10 min. With this method, the score was ++++ and the morphology of the MIB-1 staining nuclei was optimal. In addition, it resulted in a pleasant hematoxylin counterstain. This method was used to test the reproducibility of AR in the MicroMED URM. Counting 500 nuclei in three identical areas in two successive tissue sections, the MIB-1 counts in identical areas with low, intermediate, and high proliferative activity were almost the same. The mean MIB-1 counts were 44.5% and 44.7%. Fifty-three percent of MIB-1 positive nuclei showed a perinucleolar (G1) staining pattern, whereas 46% of the staining patterns were S-G2-M patterns.
In tissue samples fixed for 1 week, the MIB-1 counts were considerably lower than those in tissue fixed for 1 day. In our test sample, the mean MIB count in tissue fixed for 1 day was about 44% and in tissue fixed for 1 week about 28%. Moreover, extending MW heating under pressure exposure time to 20 min did not clearly improve staining results after prolonged fixation.
Cytology
For the cytological samples, only the optimal MIB-1 pretreatment method was used (pH 6, 115C, 10 min). In all the cytology specimens derived from malignant tumors, MIB-1 staining was seen. In the malignant lymphoma and the soft-tissue sarcoma, the number of cells with positive staining appeared to be very high. In the cytospin preparations, areas with a monolayer of tumor cells were very suitable for photography of the MIB-1-positive nuclei, as shown in the pictures taken from the melanoma sample (Figure 1). The different nucleolar and nuclear distribution patterns (see Materials and Methods) were discerned in these slides, reflecting the various phases of the mitotic cycle. In the melanoma sample we even identified a few cells with a staining pattern compatible with the G1-phase of the so-called stable pKi-67 pathway (Figure 1F).
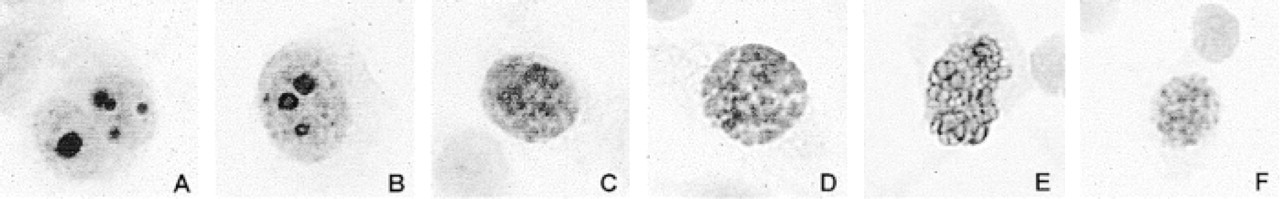
Putative sequence of MIB-1 staining patterns in melanoma cells in the various phases of the mitotic cycle (based on the study by Du Manoir et al. 1991). (A) Late G1-phase; (B) S-phase; (C) G2-phase; (D) prophase; (E) metaphase; (F) G1-phase of the so-called stable pKi-67 pathway.
Discussion
The protein pKi-67 is expressed in all active phases of the cell cycle (Gerdes et al. 1983) and appears to be specific for cell proliferation. As yet, there is no evidence that pKi-67 is associated with DNA repair (McCormick et al. 1993); its exact function is still unknown. Nevertheless, there is accumulating evidence that pKi-67 binds to DNA. With flow cytometric analysis, Landberg et al. (1990) showed that pKi-67 increases during the S-phase of the cell cycle, reaching a maximum in the mitotic phase. Cell fractions in the G1-, S-, G2-, and M-phases can be separated by combining pKi-67 staining with DNA staining. Sasaki et al. (1987) found that pKi-67 immunolabeling disappears with DNase I but not with RNase treatment. Lopez et al. (1994) reported that dissolved dsDNA modulates the form of pKi-67 and that this altered three-dimensional structure is more reactive to Ki-67 and MIB-1. Moreover, with fluorescence in situ hybridization, Ki-67 co-localizes with centromeric, telomeric, and satellite III DNA, which are heterochromatic (Bridger et al. 1998). Finally, the cell cycle-associated change in pKi-67 nuclear distribution suggests that it could have a chromatin-associated function (Starborg et al. 1996). Different cell cycle-related Ki-67 nuclear staining patterns have been described (Braun et al. 1988; Van Dierendonck et al. 1989; Isola et al. 1990; Du Manoir et al. 1991). In most of these studies, the diploid human mammary cancer cell line MCF-7 was used. Du Manoir et al. (1991) showed that Ki-67 immunostaining is related to DNA content and nuclear size. In their analysis, it appears that two different pathways are followed by MCF-7 cells when going through the 2c compartment. In about 10% of cells, the amount of pKi-67 remains constant (the pKi-67 stable pathway) and these cells exhibit a characteristic speckled nuclear staining pattern. In a large number of cells, however, there is a postmitotic decrease in the amount of pKi-67 (the pKi-67 decrease pathway) and these cells have small nuclei with nucleoplasmic staining and intermediate-sized nuclei with nucleolar staining. The larger nuclei in the G0-phase are negative. During the S-phase the amount of pKi-67 increases progressively in intermediate-sized nuclei, and nuclear enlargement is accompanied by both nucleolar and nucleoplasmic staining. During the mitotic phase, pKi-67 stains chromosomes, covering their surfaces, and this is most apparent in metaphase spreads in cell preparations. With image cytometry and double staining with antibody Ki-67 and Hoechst 33342 DNA stain, Guillaud et al. (1991) were able to produce an automatic classification of MCF-7 cells in cell cycle phases based on the discriminant variables nuclear area, Ki-67 skewness, Ki-67 quantity, and Ki-67 kurtosis.
Knowledge of these Ki-67 nuclear staining patterns in the cell cycle enabled us to use this qualitative parameter for analysis of immunostaining results, in addition to quantitative data. We used MAb MIB-1 for demonstration of pKi-67 in both formaldehyde-fixed, paraffin-embedded tissue sections and ethanol-fixed cytological preparations. Previous studies have revealed that MIB-1 immunostaining in tissue sections is not possible without AR (Cattoretti et al. 1992; Munakata and Hendricks 1993). Although the precise mechanism of AR in formalin-fixed, paraffin-embedded tissue is unclear, the net effect of AR is a decreased immunodetection threshold.
The results of our test battery in histological material confirm, again, that AR for MIB-1 needs careful monitoring and adjustment of heating time as well as buffer solution temperature and pH. The results found with MW superheating under high pressure in the MicroMED URM are, in general, comparable to earlier data on MW-AR. The retrieval results found with citrate buffer pH 6 and Tris-HCl buffer pH 9 are clearly dependent on heating intensity, i.e., the product of heating time and temperature (see Table 1). With 10 min of exposure time, we found optimal MIB-1 staining with Tris-HCl buffer, pH 2, at 100C and with citrate buffer, pH 6, at 115C, whereas the results seen with Tris-HCl buffer, pH 9, at 115C are only moderate and those with Tris-HCl buffer, pH 9, or citrate buffer, pH 6, at 100C are poor. With standard MWAR at 100C for 10 min, other investigators also report weak MIB-1 staining with Tris buffer, pH 8–10, and citrate buffer, pH 6, whereas they obtained strong MIB-1 staining with either Tris-HCl buffer, pH 1, or EDTA-NaOH solution, pH 8 (Pileri et al., 1997; Shi et al. 1998).
In a separate pilot study (not shown), testing a small panel of DAKO antibodies, including Abs reactive with keratins (KL-1), vimentin (V9), CD20 (L26), CD 45RO (UCHL-1), and CD34 (QBEND), we found that IHC staining results are comparable for citrate buffer, pH 6, and Tris buffer, pH 9, after 20 min of heating,. With superheating at 115C under pressure, Tris buffer, pH 2, gives poor results for immunostaining and preservation of morphology. Therefore, heating in citrate buffer, pH 6, at 115C for 10–20 min was considered optimal for tissue fixed in formalin for up to 24 hr.
It is well appreciated that IHC and the sensitivity of AR are dependent on fixation parameters, particularly formalin fixation time. Our data on MIB-1 are in accordance with those of Benini et al. (1997), who found suboptimal staining in tissue fixed for longer than 24 hr. Therefore, standardization of MIB-1 immunostaining using AR is not possible without paying attention to formalin fixation time, because overfixed tissue samples cannot be used for accurate measurement of cell proliferation with this antibody.
The immunostaining of cytological samples also depends strongly on type and duration of fixation. Van Dierendonck et al. (1989) tested different fixation protocols for immunostaining with Ki-67 in MCF-7 cell monolayers without the use of AR and found, among other results, moderate staining with short-term fixation in ethanol 70%, strong staining with 10-min in 2% paraformaldehyde, and very strong staining with 5-min fixation in cold (−20C) acetone. In routine cytology practice, the different specimens are either fixed in an ethanol-based fixative and stained with the Papanicolaou stain or air-dried, unfixed, and stained with a Giemsa technique. Cold acetone is the fixative of choice if fresh samples are studied and AR can be applied with ethanol-fixed samples (Boon et al. 1994). For this reason, ethanol-fixed cell preparations were used in this study.
In these ethanol-fixed cytological specimens strong MIB-1 staining was observed with our optimal protocol and the different cell cycle-related MIB-1 staining patterns described by Du Manoir et al. (1991) could be found, as shown in Figure 1. Under optimal conditions these different nuclear patterns are also found in tissue sections. However, in quantitative IHC with MIB-1, little or no attention is paid to this differential staining pattern, which is confusing. One wonders what is meant by the MIB-1 index used in many reports, e.g., the one by MacGrogan et al. (1997). It appears that only weak, moderate, or strong nuclear MIB-1 staining is included in MIB-1 counts and that the perinucleolar (late G1) staining pattern is disregarded. We found that under suboptimal conditions only nuclei with a large amount of Ki-67 protein stain positive and only S-G2- or M-phase staining patterns are seen. Therefore, we stress that only optimally stained histological sections showing the entire spectrum of MIB-1 staining patterns should be used for quantitation.
Reproducibility of MIB-1 index (% positive nuclei) in the MicroMED URM
It would be interesting to obtain additional data on different tumor samples, correlating MIB-1 staining patterns to cell cycle phases, tumor cell ploidy, tumor type, and tumor prognosis, extending studies of the diploid MCF-7 cell line by Du Manoir et al. (1991) and Guillaud et al. (1991). This was beyond the scope of the present study.
In this study we have shown that the main advantage of the MicroMED URM processor is control of important factors that determine AR results, such as time, temperature, and pH. This allows the implementation of a standardized AR protocol. AR-IHC in the MicroMED URM processor is highly reproducible (see Table 2). In all probability, the constant temperature observed during high-pressure microwave heating in the MicroMED URM is responsible for the consistent and reproducible MIB-1 immunostaining results. Fortunately, morphology is not affected by MicroMED URM superheating and is comparable to paraffin section morphology after MW-AR. Moreover, in the cytological specimens no boiling or denaturing effect was observed in nuclei, allowing discrimination of the various phases of the mitotic cycle. Although we hope that future studies will confirm that the use of the MicroMED URM is a step forward in the standardization of AR and paraffin section IHC, we realize that the high price of this commercially available apparatus will limit its use by many laboratories.
Footnotes
Acknowledgments
The excellent histotechnical work of this study was performed by Mr Joost A.P. Rens as part of his training assignment at the Leiden Cytology and Pathology Laboratory in the period from January to June of 1998.