
Abstract
In freshly isolated rat hepatocyte multiplets, Ca2+ signals in response to vasopressin are highly organized. In this study we used specific probes to visualize, by fluorescence and confocal microscopy, the main signaling molecules involved in vasopressin-mediated Ca2+ responses. V1a receptors were detected with a novel fluorescent antagonist, Rhm8 -PVA. The Gαq/Gα11, PLCβ3, PIP2, and InsP3 receptors were detected with specific antibodies. V1a vasopressin receptors and PIP2 were associated with the basolateral membrane and were not detected in the bile canalicular domain. Gαq/Gα11, PLCβ3, and InsP3 receptors were associated with the basolateral membrane and also with other intracellular structures. We used double labeling, Western blotting, and drugs (cytochalasin D, colchicine) known to disorganize the cytoskeleton to demonstrate the partial co-localization of Gαq/Gα11 with F-actin.
Keywords
T
The hepatocyte doublet system has been used to demonstrate that the intracellular Ca2+ wave begins in the pericanalicular (apical) region and propagates peripherally (Nathanson et al. 1994a) as in exocrine acinar cells (Kasai et al. 1993; Thorn et al. 1993; Tojyo et al. 1997). This subcellular Ca2+ wave organization probably results either from a higher density of the inositol 1,4,5-trisphosphate (InsP3) receptor in the pericanalicular region (Nathanson et al. 1994a,b; Lee et al. 1997; Yule et al. 1997) or from a gradient in InsP3 receptor sensitivity across the cell, with the receptors at the apical pole having higher affinity for InsP3 than those at the basolateral area (Kasai et al. 1993; Thorn et al. 1993). Ca2+ waves and synchronized oscillations travel from cell to cell in hepatocyte doublets (Nathanson and Burgstahler 1992a,b; Boyer 1997), in multicellular systems (Combettes et al. 1994; Tordjmann et al. 1997,1998), and in the intact perfused liver (Nathanson et al. 1995; Robb-Gaspers and Thomas 1995). Cell doublet preparations have been used to investigate a variety of cytoskeletondependent functions because the F-actin and tubulin networks remain polarized in these preparations (Boyer 1997). The actin cytoskeleton is responsible for bile canalicular contraction (Watanabe et al. 1991a,b), which is itself stimulated by increases in [Ca2+]i (Oshio and Phillips 1981), cytosolic ATP (Watanabe et al. 1991a), or vasopressin concentrations (Kawahara and French 1990).
Here we investigated the subcellular localization of the signaling molecules involved in vasopressin-mediated Ca2+ signals in multiplets of rat hepatocyte. This cellular model was used because the morphological and functional properties typical of liver tissues are preserved. Thus, vasopressin-induced calcium oscillation had been observed both on intact perfused liver (Nathanson et al. 1995; Robb-Gaspers and Thomas 1995) and on hepatocyte multiplets reported by our laboratory (Combettes et al. 1994; Tordjmann et al. 1997,1998). Such studies have been performed to improve our understanding of the spatiotemporal organization of the vasopressin-stimulated calcium wave. We found that V1a vasopressin receptors and PIP2 were located exclusively on the basolateral membrane, phospholipase Cβ3 (PLCβ3) was found, to a lesser extent, on the basolateral membrane and mainly on cytoplasmic structures, and αq/α11 G-protein sub-units (Gαq/Gα11) and InsP3 receptor were associated with both the basolateral membrane and intracellular structures.
Materials and Methods
Primary and Secondary Antibodies
The purified polyclonal antibody directed against the carboxy terminal decapeptide of Gαq/Gα11 has previously been described (Ibarrondo et al. 1995). It is specific for Gαq/Gα11 and inhibits vasopressin-stimulated PLC activity. Because the carboxy terminal decapeptide is common to αq and α11 G-protein subunits, the antibody recognizes both molecules. The purified polyclonal antibody directed against a 20-amino-acid C-terminal peptide from rat PLCβ3 was obtained from Santa Cruz Biotechnology (Santa Cruz, CA). The specific mouse monoclonal antibody directed against PIP2 (IgG2b subclass), has been described elsewhere (Fukami et al. 1988; Tran et al. 1993). The polyclonal antibody directed against the whole Type 1 InsP3 receptor molecule, purified from sheep cerebellum, was produced and characterized in our laboratory. A single band was detected with this antibody on Western blots, and this band corresponded to the rat liver InsP3 receptor. Therefore, this antibody was suitable for immunocytochemical experiments. It labeled the basolateral and canalicular domains of hepatocytes on rat liver cryostat sections (Lièvremont et al. 1996). The monoclonal anti-α-tubulin antibody and the Cy3-labeled goat anti-rabbit IgG were obtained from Amersham (Arlington Heights, IL). The polyclonal anti-actin anti body was purchased from Sigma (St Louis, MO). FITC-anti-mouse IgG2b was supplied by Nordic Immunological Laboratories (Tilburg, The Netherlands), TRITC-anti-mouse IgG and biotinylated anti-rabbit IgG were obtained from Jackson Immunoresearch Laboratories (West Grove, PA), and peroxidase-conjugated anti-rabbit and anti-mouse IgG were purchased from Sanofi Diagnostics Pasteur (Marnes-la-Coquette, France).
Properties of the Fluorescent Vasopressin Antagonist of the V1a Receptor
A fluorescent vasopressin antagonist, 4-HO-Ph(CH2)2-CO-DTyr(Me)-Phe-Gln-Asn-Arg-Pro-Lys(5-carboxytetramethylrhodamyl]-NH2 (Rhm8 -PVA), which binds to the V1a vasopressin receptor, has been synthesized (Durroux et al. in press). We used an antagonist to detect the cell surface V1a receptor because this prevented receptor endocytosis (Lutz et al. 1992). Rhm8 -PVA was synthesized by coupling 5-carboxy tetramethyl rhodamine to a Lys8 linear vasopressin antagonist. The dissociation constant (Ki) of Rhm8 -PVA was 70 pM, as assessed by competition experiments with CHO cells expressing V1a receptors. Nonspecific binding accounted for no more than 20% of total binding for a concentration of Rhm8 -PVA near the Ki value. The Ki of Rhm8 -PVA was 27 nM for Vlb, 7490 nM for V2, and 1.23 nM for oxytocin receptors. We also investigated inhibition of the functional responses of V1a receptors by Rhm8 -PVA. We found that Rhm8 -PVA alone did not stimulate InsP3 synthesis. It competitively inhibited the vasopressin-mediated synthesis of InsP3 in CHO cells expressing V1a receptors with an inactivation constant (Kinact) of 70 pM. (Durroux et al. in press).
Preparation of Rat Hepatocytes
Single-cell and multicellular (doublets, triplets, quadruplets) hepatocyte systems were prepared by collagenase (Boehringer Mannheim; Meylan, France) perfusion of liver from female Wistar rats (Janvier; Le Genest-St-Isle, France) as previously described (Combettes et al. 1986; Mauger et al. 1989). Isolated rat hepatocytes were maintained (2 × 10⁶ cells/ml) at 22C in modified Eagle's medium (MEM) (Gibco BRL Life Technologies; Paisley, UK) containing 1.5% gelatin (Labosi; Elancourt, France), through which O2/CO2 (19/1) was continually bubbled. Cell viability, assessed by trypan blue exclusion, was over 96% for 4-5 hr.
Cells (2.5 × 10⁵ cells/ml) were plated on collagen-coated glass coverslips and incubated in Williams' medium E (Gibco) containing 10% fetal calf serum, glutamine (2 mM), penicillin (100 U/ml), and streptomycin (100 μg/ml). They were incubated for 2 hr at 37C under an atmosphere containing 5% CO2 and 95% air.
Cells for treatment with cytochalasin D or colchicine were washed twice with MEM containing 5 mM NaHCO3, 20 mM Hepes, 1 g/liter glucose, pH 7.4, and were incubated for 1 hr at 37C in this medium with or without 2 μM cytochalasin D or 10 μM colchicine (Sigma).
Detection of Rhm8 -PVA Binding to the V1a Vasopressin Receptor in Rat Hepatocytes
Cells were rinsed twice and incubated for 15 min at 4C in MEM with (autofluorescence and nonspecific binding) or without (autofluorescence and total binding) 5 μM nonfluorescent antagonist V4253 ([β-mer-capto-β-β-cyclopenta-methylenepropionyl1, O-Et-Tyr2, Val4, Arg8]-vasopressin) or 100 nM vasopressin (Sigma). The cells were then incubated for 30 min at the same temperature with 10 nM fluorescent antagonist, Rhm8 -PVA, in MEM containing 1 mg/ml bovine serum albumin (BSA) (Miles Laboratories; Kankakee, IL). Cells were washed twice with MEM at 4C, fixed by incubation for 15 min with 4% formaldehyde (FA) (Merck; Darmstadt, Germany), and mounted in buffered glycerin (Sanofi Diagnostics Pasteur). In some experiments, fixed cells were further incubated with FITC-phalloidin (Sigma) (1 μg/ml) for 15 min at room temperature (RT) to label F-actin. Cells were then observed either with an Axioskop epifluorescence photomicroscope (Carl Zeiss; Le Pecq, France) equipped with a sensitive 3CCD-cooled camera LH750RC3 (Lhesa; Cergy Pontoise, France) or with a confocal microscope (BIORAD MRC 600; Ivry-sur-Seine, France) equipped with an argon-krypton mixed gas laser. The excitation wavelengths were 546 nm for Rhm8 -PVA and 490 nm for FITC-phalloidin. Images were processed using Photomat, Photoshop (epifluorescent microscope), or BIORAD (confocal microscope) software.
Immunodetection of Gαq/Gα11, PLCβ3, PIP2, the InsP3 Receptor, Tubulin and F-actin by Fluorescence and Confocal Microscopy
Cells were fixed in 4% FA in PBS for 15 min at RT and stored in 0.4% FA at 4C or were fixed in acetone at −20C for 5 min, then air-dried and stored desiccated at −20C. FA fixation was essential for labeling of PIP2 and Gαq/Gα11, whereas acetone fixation was better for PLCβ3. Both techniques were suitable for the InsP3 receptor, tubulin, and F-actin.
One of three methods was used to permeabilize FA-fixed cells: (a) 0.1% Triton X-100 (Sigma) in PBS for 2 min; (b) acetone: PBS (1:1) for 5 min; or (c) freezing and thawing after incubation with 1 M sucrose for cryoprotection (essential for PIP2).
Cells were washed with PBS and nonspecific binding sites were blocked by incubation for 15 min with 50 mM NH4Cl, then for a further 15 min with PBS containing 0.5% ovalbumin (Sigma). Cells were incubated overnight at 4C with the specific primary antibodies [anti-Gαq/Gα11 1:100, anti-PLCβ3 1:100, anti-PIP2 1:1000, anti-InsP3 receptor (InsP3R) 1:10 or anti-tubulin 1:400], then for 30 min to 1 hr with the appropriate secondary antibody (for details see figure legends). A second fixation step with 4% FA was generally performed after incubation with the secondary antibody to stabilize the immune complex. Cells were finally incubated for 20 min with 0.1% sodium borohydride (Sigma) in PBS to reduce autofluorescence.
Negative controls were carried out systematically by omitting the specific primary antibodies and, if possible, by incubating the primary antibodies with an excess (500- to 1000-fold molar excess) of the corresponding antigen before use.
The cells were incubated with fluorescent secondary antibodies or biotinylated secondary antibodies followed by FITC-streptavidin (Immunotech; Marseille, France). TRITC or FITC-phalloidin (Sigma) was used at a concentration of 0.5-1 μg/ml for 5-15 min for detection of F-actin. This staining of F-actin made it easier to identify the bile canaliculus between adjacent hepatocytes.
Cells were mounted using the Slow Fade-Light anti-fade kit (Molecular Probes; Leiden, The Netherlands) or buffered glycerin. They were then observed and the images recorded with epifluorescence and confocal microscopes equipped with appropriate software, as described above.
Preparation of Subcellular Fractions of Rat Hepatocytes
Hepatocytes plated and incubated for 2 hr on collagen-coated coverslips were rinsed twice with 20 mM Hepes buffer, pH 7.4, containing 50 mM NaCl, 5.6 mM KCl, 1.2 mM NaH2PO4, 5.1 mM NaHCO3, and were collected by scraping. The following steps were all performed at 4C. The collected cells were suspended in homogenization buffer [10 mM Tris-HCl, pH 7.4, 1 mM EDTA, 1 mM PMSF, 10 μg/ml leupeptin, and 10 μg/ml aprotinin (Sigma)], subjected to sonication four times for 10 sec each, and centrifuged at 100,000 × g for 1 hr. The pellet, containing total cell membranes (M), was resuspended in homogenization buffer. Cytosolic proteins (Cy) in the supernatant were precipitated overnight at −80C by adding 9 volumes of acetone and were collected by centrifugation at 21,000 × g for 6 min.
The cytoskeleton (CK) was prepared as described by Payrastre et al. (1991). The scraped hepatocytes were recovered by rapid centrifugation (1,500 × g, 1 min, RT). The pellet was extracted by incubation for 15 min at 4C with 0.5% Triton X-100 in 20 mM Hepes buffer, pH 7.4, containing 50 mM NaCl, 1 mM EGTA, 1 mM PMSF, 10 μg/ml leupeptin, and 100 μM orthovanadate. The extracted preparation was centrifuged at 12,000 × g for 2 min at 4C and the pellet containing the cytoskeleton and its associated proteins was washed twice at 4C with a buffer of the same composition but devoid of Triton X-100, and then suspended in 20 mM Hepes buffer.
All fractions were stored at −80C and their protein content was determined by the Bio-Rad protein assay reagent using BSA as a standard.
Western Blotting of Gαq/Gα11, PLCβ3, F-actin, and Tubulin
Proteins (10-20 μg per lane) were resolved by SDS-PAGE (7.5% acrylamide for PLCβ3 and 13% for actin, tubulin, and Gαq/Gα11) and transferred to nitrocellulose membranes. Blots were incubated for 1 hr at 37C in blocking medium (PBS containing 5% skimmed milk powder and 0.1% Tween-20). They were then incubated for 2 hr at RT with polyclonal anti-PLCβ3 (1:200), anti-Gαq/Gα11 (1:500), anti-F-actin (1:200), or monoclonal anti-α-tubulin (1:1000) antibodies in the blocking medium. The blots were washed with PBS and incubated for 1 hr at RT with peroxidase-conjugated anti-rabbit IgG or anti-mouse IgG (1:2000). Blots were washed with PBS and detected using the ECL kit (Amersham).
Fluorescence Intensity Profiles for Signaling Molecules Involved in the Vasopressin Response
Digitized confocal images of signaling molecules labeled with fluorescent probes were used to generate a radial line fluorescence intensity profile from the basal membrane to the nucleus using Matrox MAGIC software. One profile per cell was obtained for a total of more than 20 cells from two or three separate hepatocyte preparations. Fluorescence intensity profiles were normalized as a percentage of maximal fluorescence (arbitrary units) and were averaged to form a mean profile. For the X-axis, pixels were transformed into μm (1 pixel = 0.25 μm) and the cell membrane was positioned at point O. For double labeling (Gαq/Gα11-F-actin, Gαq/Gα11-tubulin, InsP3R-F-actin), pseudocolor images were generated from digitized confocal images by Photoshop software using green for FITC and red for TRITC. Red (F-actin or tubulin) and green images (Gαq/Gα11 or InsP3R) from double labeling experiments were superimposed. Fluorescence intensity profiles from the basal membrane to the nucleus were obtained as described above.
Results
Subcellular Distribution of the V1a Vasopressin Receptor as Detected by the Fluorescent Antagonist Rhm8 -PVA
We used a new specific fluorescent vasopressin antagonist, Rhm8 -PVA (Durroux et al. in press), to detect cell surface V1a receptors in rat hepatocytes in the absence of any receptor-mediated internalization (Lutz et al. 1992).
Rhm8 -PVA bound to the surface of rat hepatocytes (Figure 1A). There was also significant labeling within the cell, probably due to the high autofluorescence of rat hepatocytes (Berthon et al. 1984) because cells incubated without Rhm8 -PVA were also labeled (Figures 1B and 1D). The labeling around the periphery of rat hepatocytes with Rhm8 -PVA was specific and was prevented if rat hepatocytes were first treated for 15 min at 4C with either 100 nM vasopressin or 5 μM nonfluorescent vasopressin antagonist (Tran et al. in press). Confocal images (Figures 1C and 1D) confirmed the results obtained by epifluorescence microscopy. There was a thin layer of peripheral specific labeling presumably corresponding to the plasma membrane. The basolateral membranes of all hepatocyte multiplets examined were labeled (Figure 1B; Table 1). In contrast, in double labeling, the bile canaliculi that were strongly labeled for F-actin were not labeled with Rhm8 -PVA (Figures 1E and 1F).
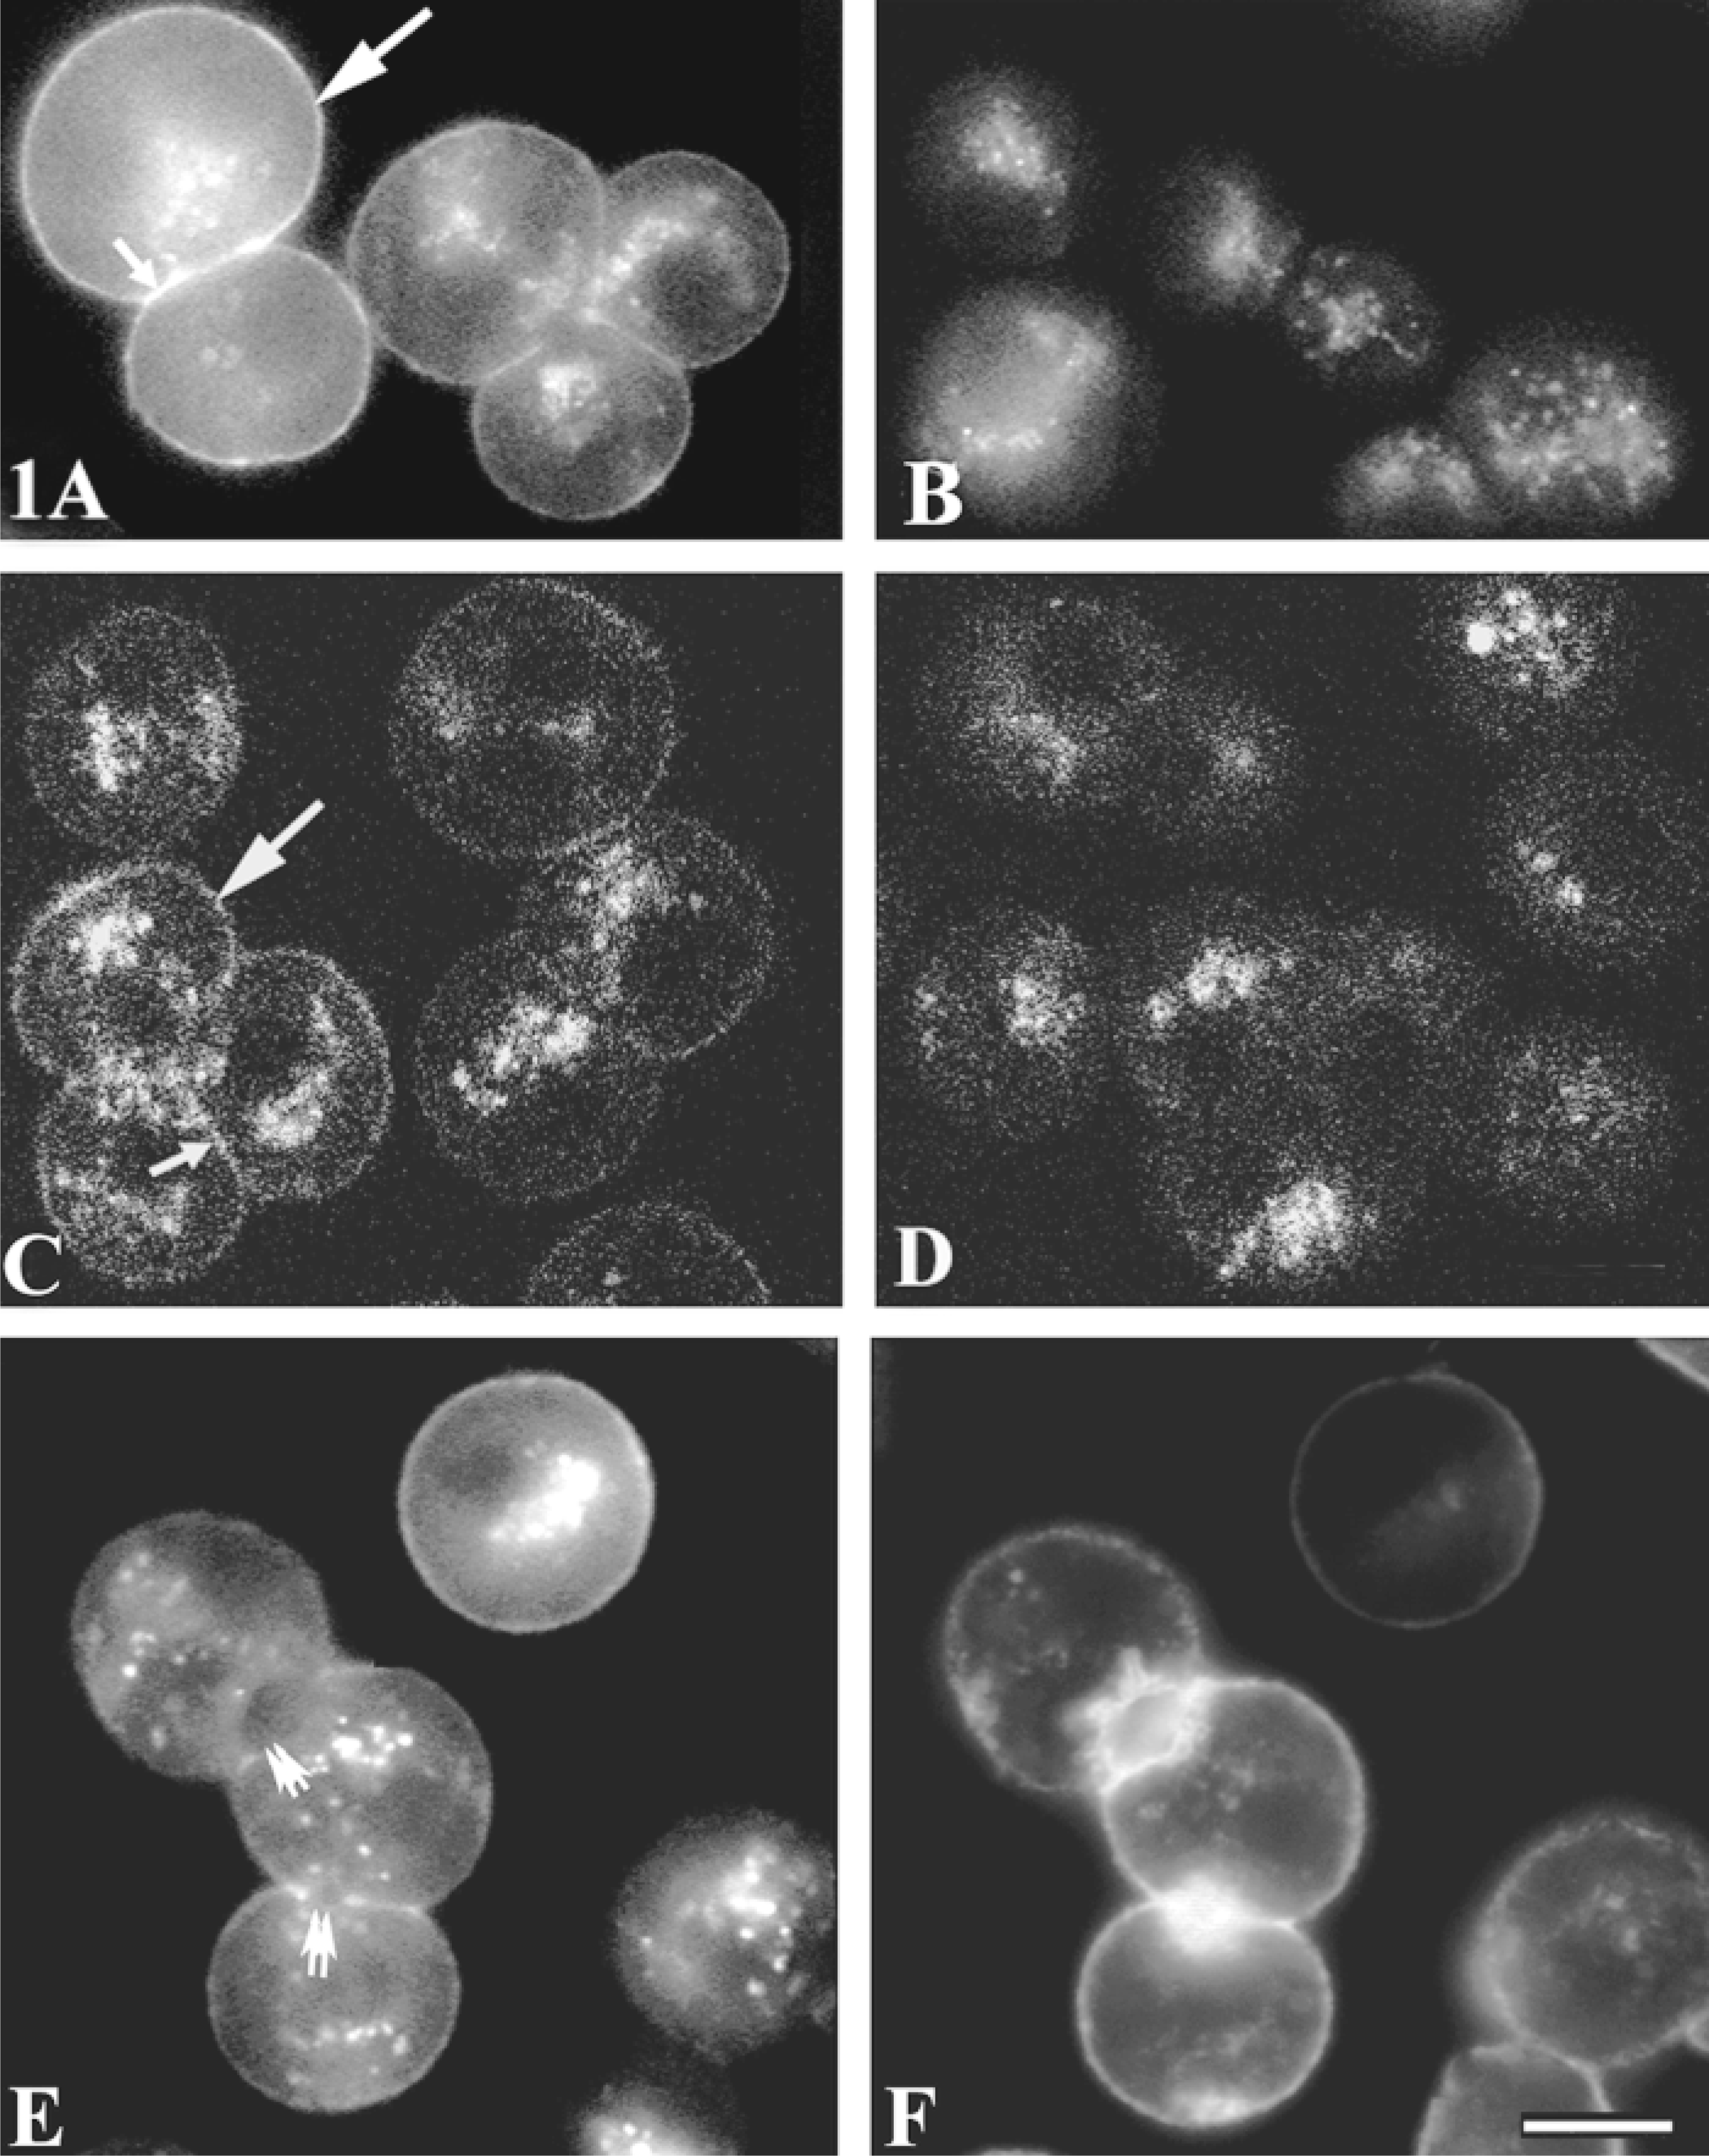
Detection of V1a vasopressin receptors using the fluorescent specific antagonist Rhm8 -PVA. Hepatocyte multiplets cultured for 2 hr on collagen-coated coverslips were incubated as described in Materials and Methods with (A,C) or without (B,D) 10 nM Rhm8 -PVA. The cells were washed, fixed with 4% FA, and observed under an epifluorescence microscope (A,B) and a confocal microscope (C,D). Specific signals for the V1a vasopressin receptor were detected at the basal (large arrows) and lateral (small arrows) membranes. Intracellular autofluorescence was evident in control cells not incubated with Rhm8 -PVA (B,D). In double labeling (E,F, epifluorescence microscope), the bile canalicular membrane (double arrows) was not labeled with Rhm8 -PVA (E) but was intensely stained by FITC-phalloidin (F). Images are representative of 54 cells and 26 bile canaliculi examined from three separate experiments. Bar =10 μm.
Subcellular distribution of cytoskeleton and signaling molecules of the vasopressin pathway in rat hepatocytes a
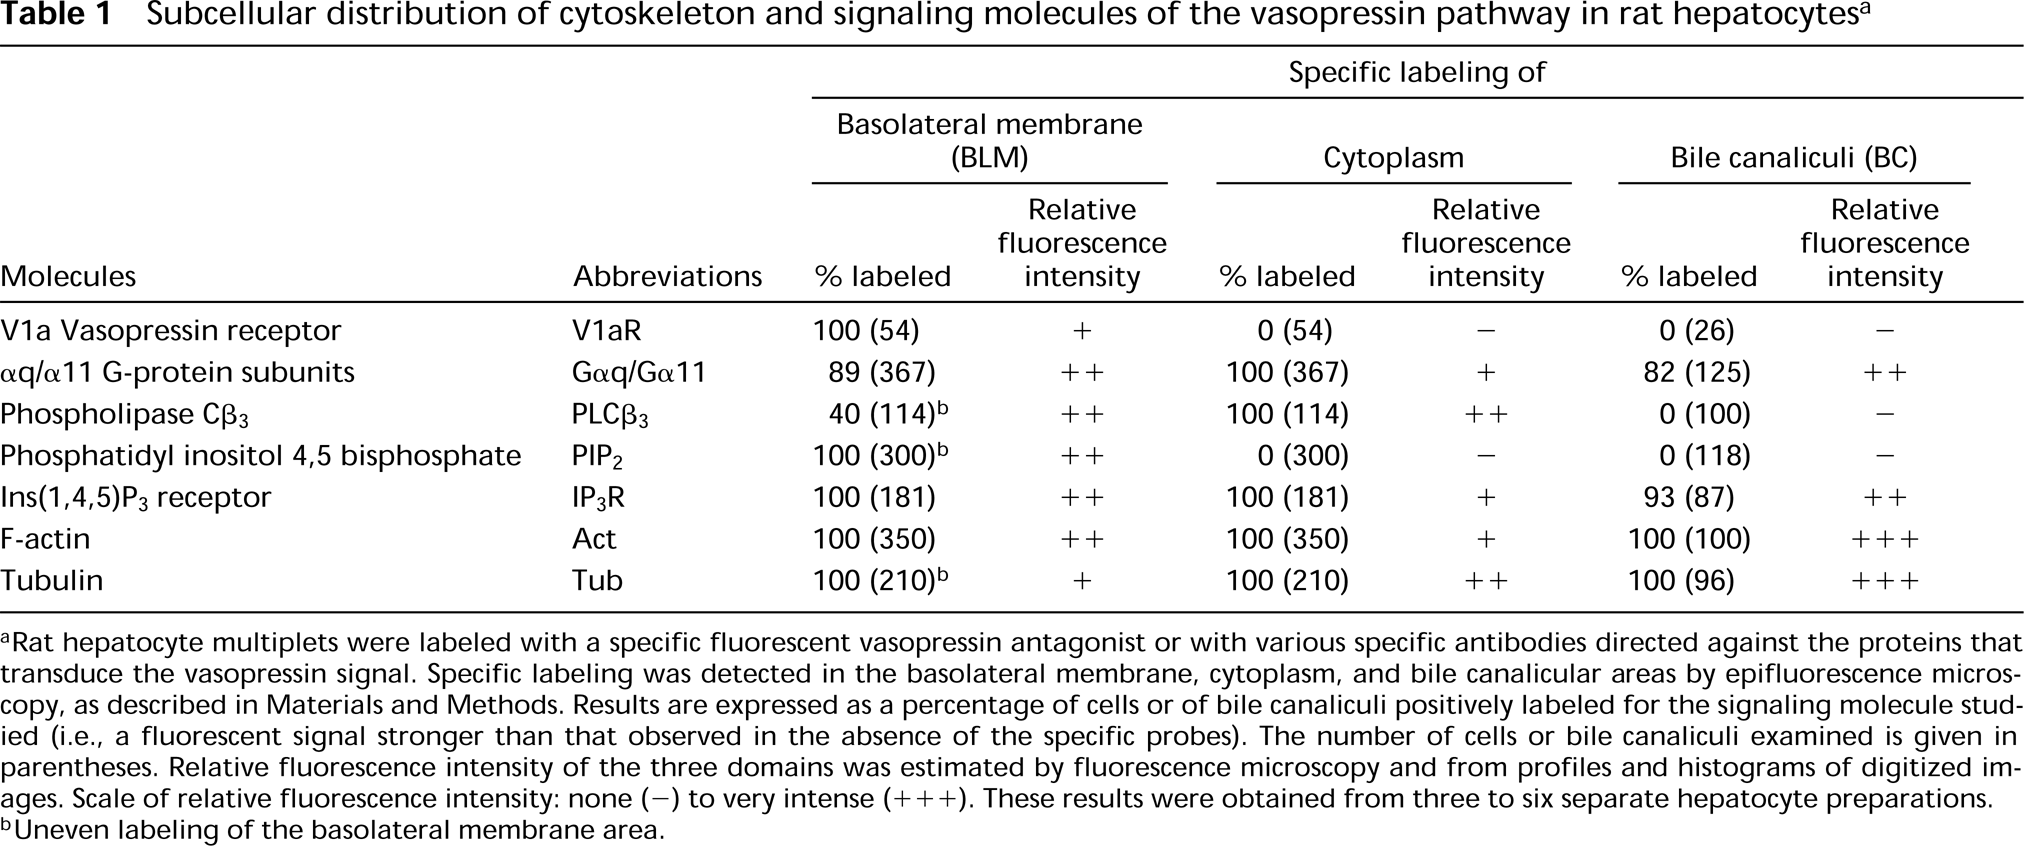
Rat hepatocyte multiplets were labeled with a specific fluorescent vasopressin antagonist or with various specific antibodies directed against the proteins that transduce the vasopressin signal. Specific labeling was detected in the basolateral membrane, cytoplasm, and bile canalicular areas by epifluorescence microscopy, as described in Materials and Methods. Results are expressed as a percentage of cells or of bile canaliculi positively labeled for the signaling molecule studied (i.e., a fluorescent signal stronger than that observed in the absence of the specific probes). The number of cells or bile canaliculi examined is given in parentheses. Relative fluorescence intensity of the three domains was estimated by fluorescence microscopy and from profiles and histograms of digitized images. Scale of relative fluorescence intensity: none (-) to very intense (+++). These results were obtained from three to six separate hepatocyte preparations.
Uneven labeling of the basolateral membrane area.
Subcellular Immunodetection of αq/α11G-protein Subunits
The polyclonal anti-Gαq/Gα11 antibody used in this study was characterized in WRK1 cells (Ibarrondo et al. 1995), in which it recognized only two bands, one of 42 kD and the other of 43 kD, in a fraction of rat hepatocyte plasma membrane and in a preparation of purified Gαq/Gα11 from rat liver. This antibody has been shown to be suitable for immunocytochemistry experiments (Ibarrondo et al. 1995). Epifluorescence images showed that the antibody labeled weakly the basal membrane and more intensely the lateral membrane. Some intracellular structures were also labeled (Figure 2A). These labelings were better illustrated by confocal microscopy (Figure 2C). The labeled area was broader and more intense below the lateral and bile canalicular membranes than for the basal membrane. This peripheral and intracellular labeling was not detected if the specific primary antibody was preincubated with an excess of peptide antigen (Figure 2B) or was omitted (Figure 2D). We examined more than 125 multiplets and found that 89% of basolateral and bile canalicular domains were labeled by the anti-Gαq/Gα11 antibody (Table 1).
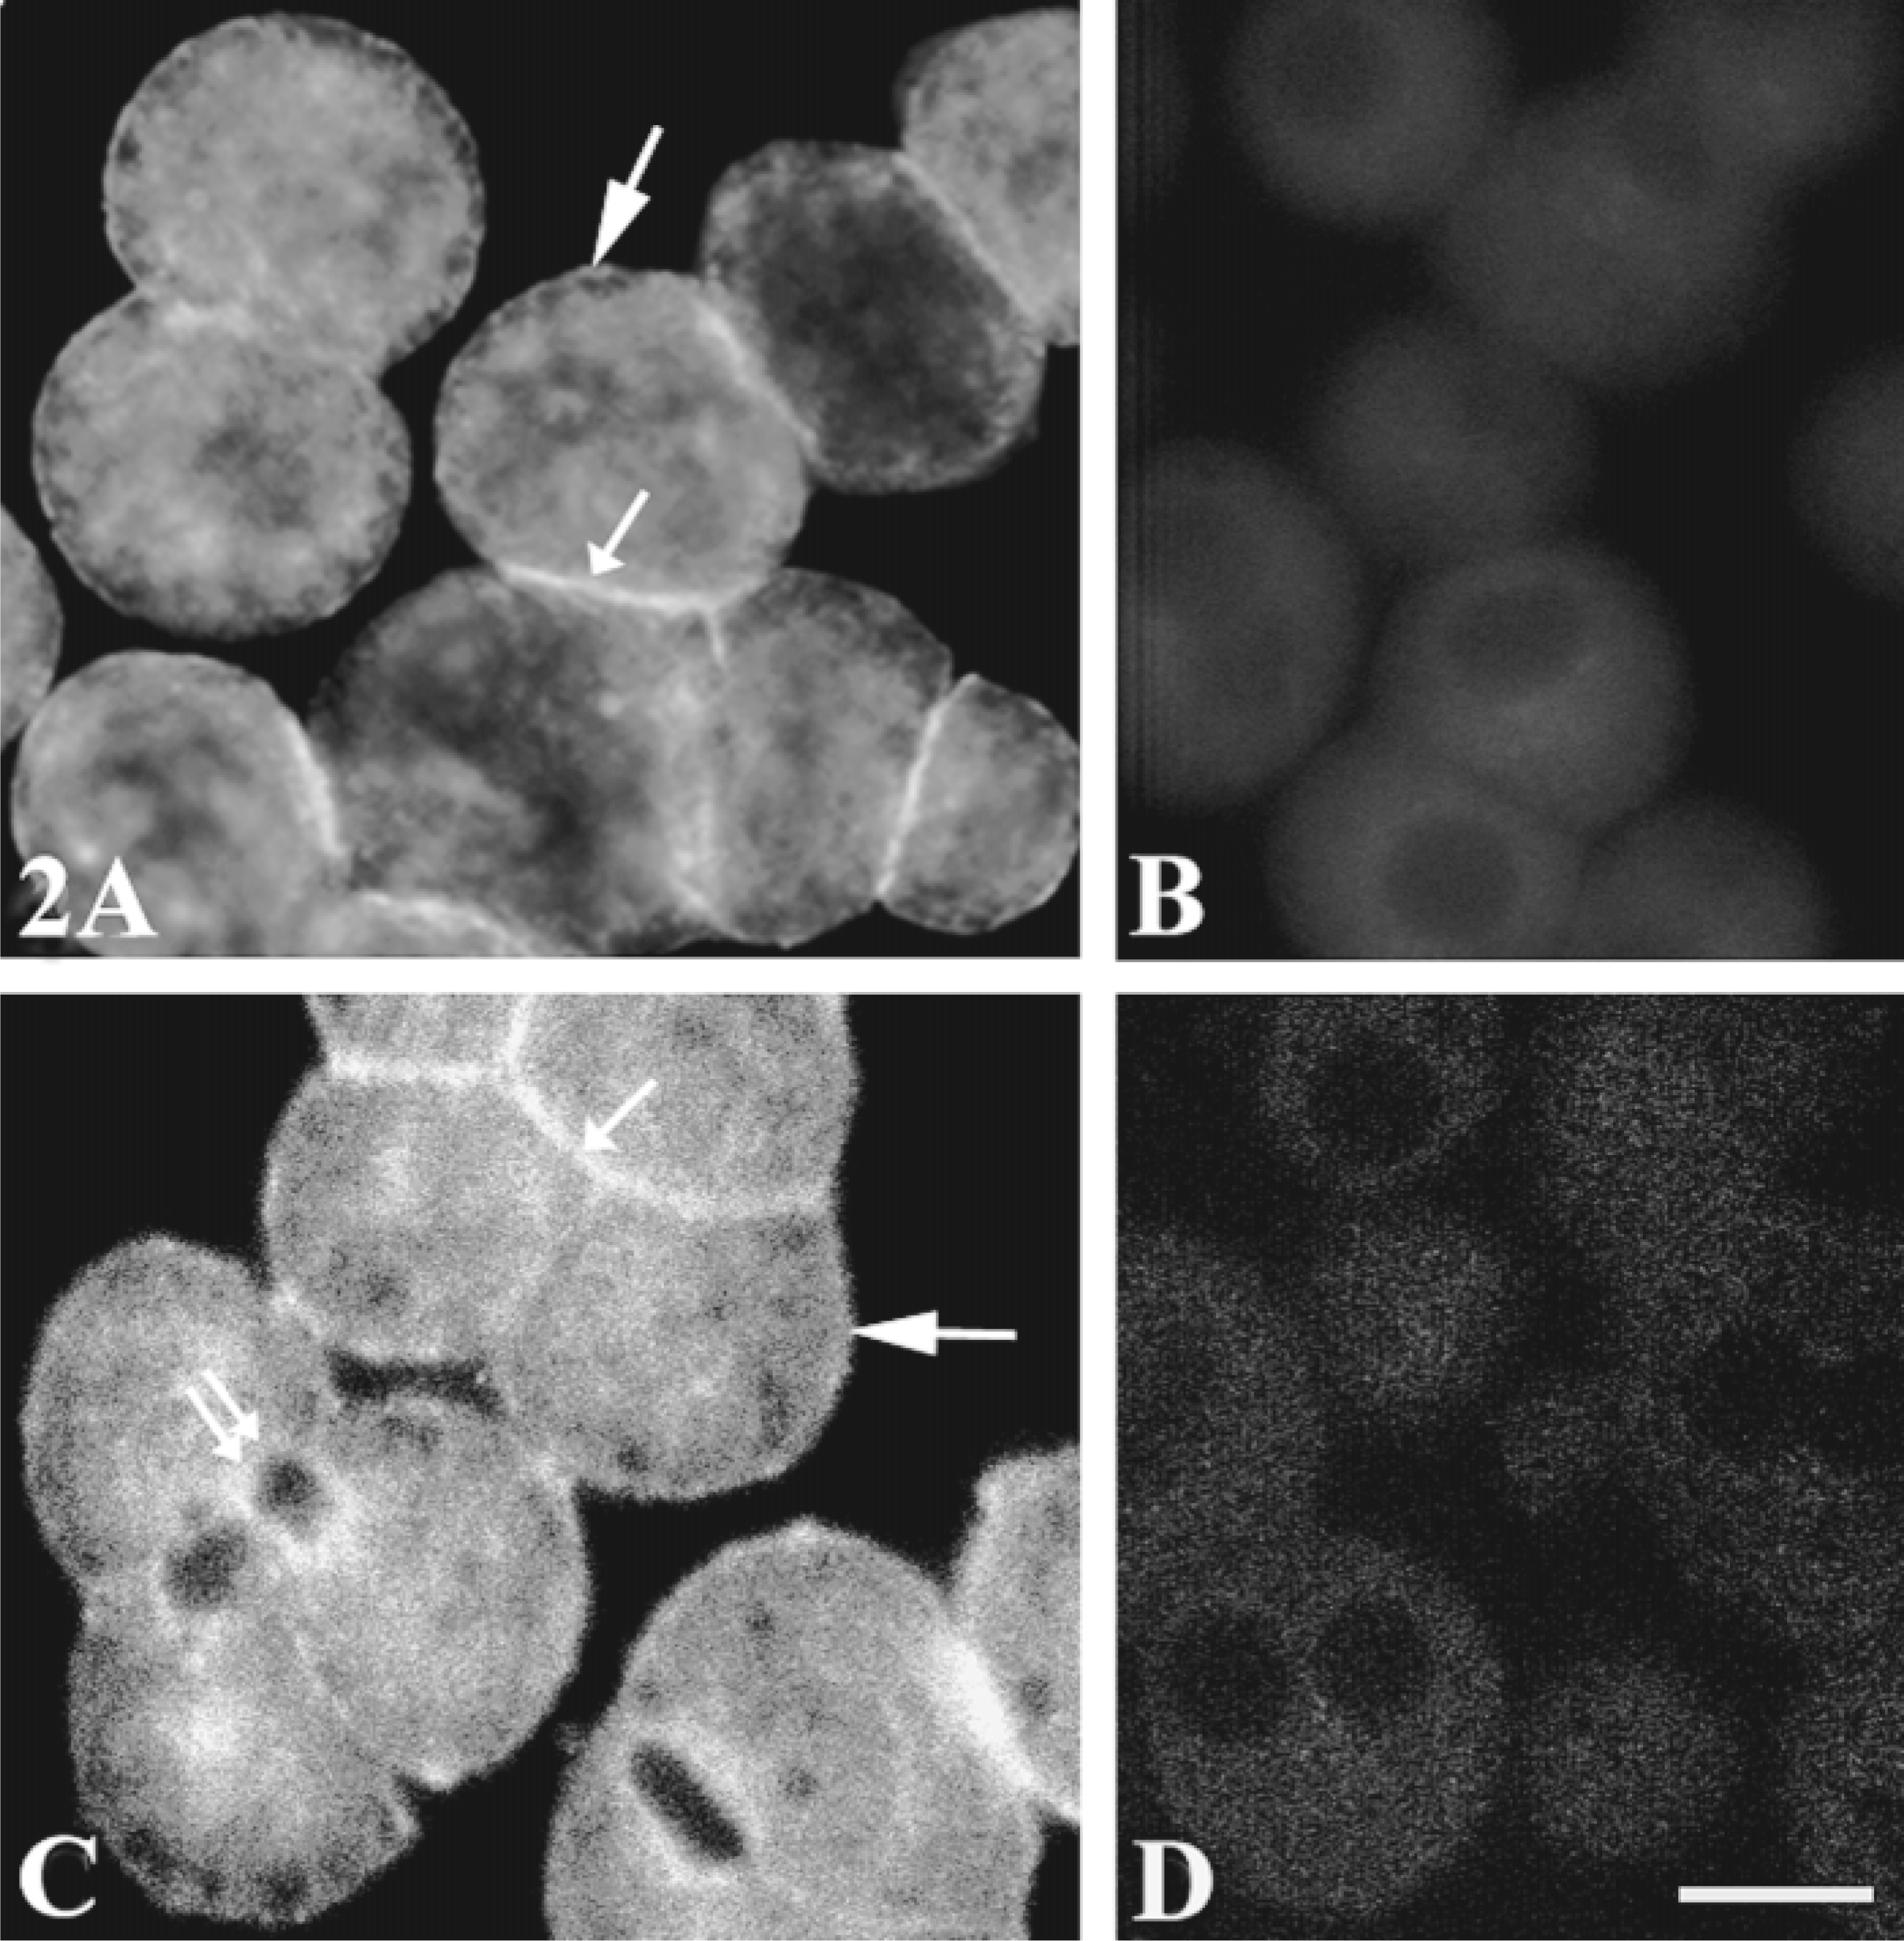
Subcellular distribution of αq/α11 G-protein subunits. Hepatocyte multiplets were grown as previously described, fixed with 4% FA, permeabilized with Triton X-100, and incubated with (A,C) or without (D) specific anti-Gαq/Gα11 antibodies (1/100) or with specific antibodies exhausted by an excess of peptide antigen (B). The cells were washed and incubated with biotinylated anti-rabbit IgG (1:200), then with FITC-streptavidin (1:500). The cells were then fixed again with 4% FA. (A,B) Images from the epifluorescence microscope. (C,D) Images from the confocal microscope. Labeling is significant in the cytoplasm, weak but detectable at the basal membrane (large arrows), more intense at the lateral mem brane (small arrows) and under the bile canaliculi (double arrows). Images are representative of 367 cells examined from six separate experiments. Bar =10 μm.
Association of αq/α11 G-protein Subunits with F-actin and Tubulin
Gαq/Gα11 is associated with the cellular cytoskeleton of many cell lines (Côté et al. 1997b; Ibarrondo et al. 1995), so we performed double labeling experiments (Gαq/Gα11-F-actin and Gαq/Gα11-tubulin) to investigate the effect of drugs known to disorganize the actin or tubulin networks on Gαq/Gα11 distribution in rat hepatocyte multiplets. Anti-Gαq/Gα11 antibodies, biotinylated anti-rabbit IgG, and FITC-streptavidin were used to detect Gαq/Gα11 (Figure 3B) and TRITC-phalloidin to detect F-actin (Figure 3A). There was clear but partial co-localization of F-actin and Gαq/Gα11. Both were detected under the bile canaliculus and basolateral membranes. Intracellular labeling for F-actin and Gαq/Gα11 was less intense. Cytochalasin D treatment strongly affected the actin network in both the basolateral membrane and bile canaliculus domains (Figure 3C), with no consistent peripheral labeling. Separate aggregates were labeled for F-actin. Cytochalasin D treatment also disorganized Gαq/Gα11 labelings (Figure 3D). However, co-localization of these two molecules was preserved, their distributions being almost identical. The effect of cytochalasin D on F-actin and Gαq/Gα11 distribution was specific, with no change in tubulin labeling observed (not shown). The close association of G-proteins and actin filaments was confirmed by biochemical experiments (see Figure 5). In the total cell membrane fraction, Gαq/Gα11 and actin were detected by Western blotting. By contrast, only Gαq was present with actin in the cytoskeleton fraction. Gα11 was not detected even if we doubled the amount of proteins.
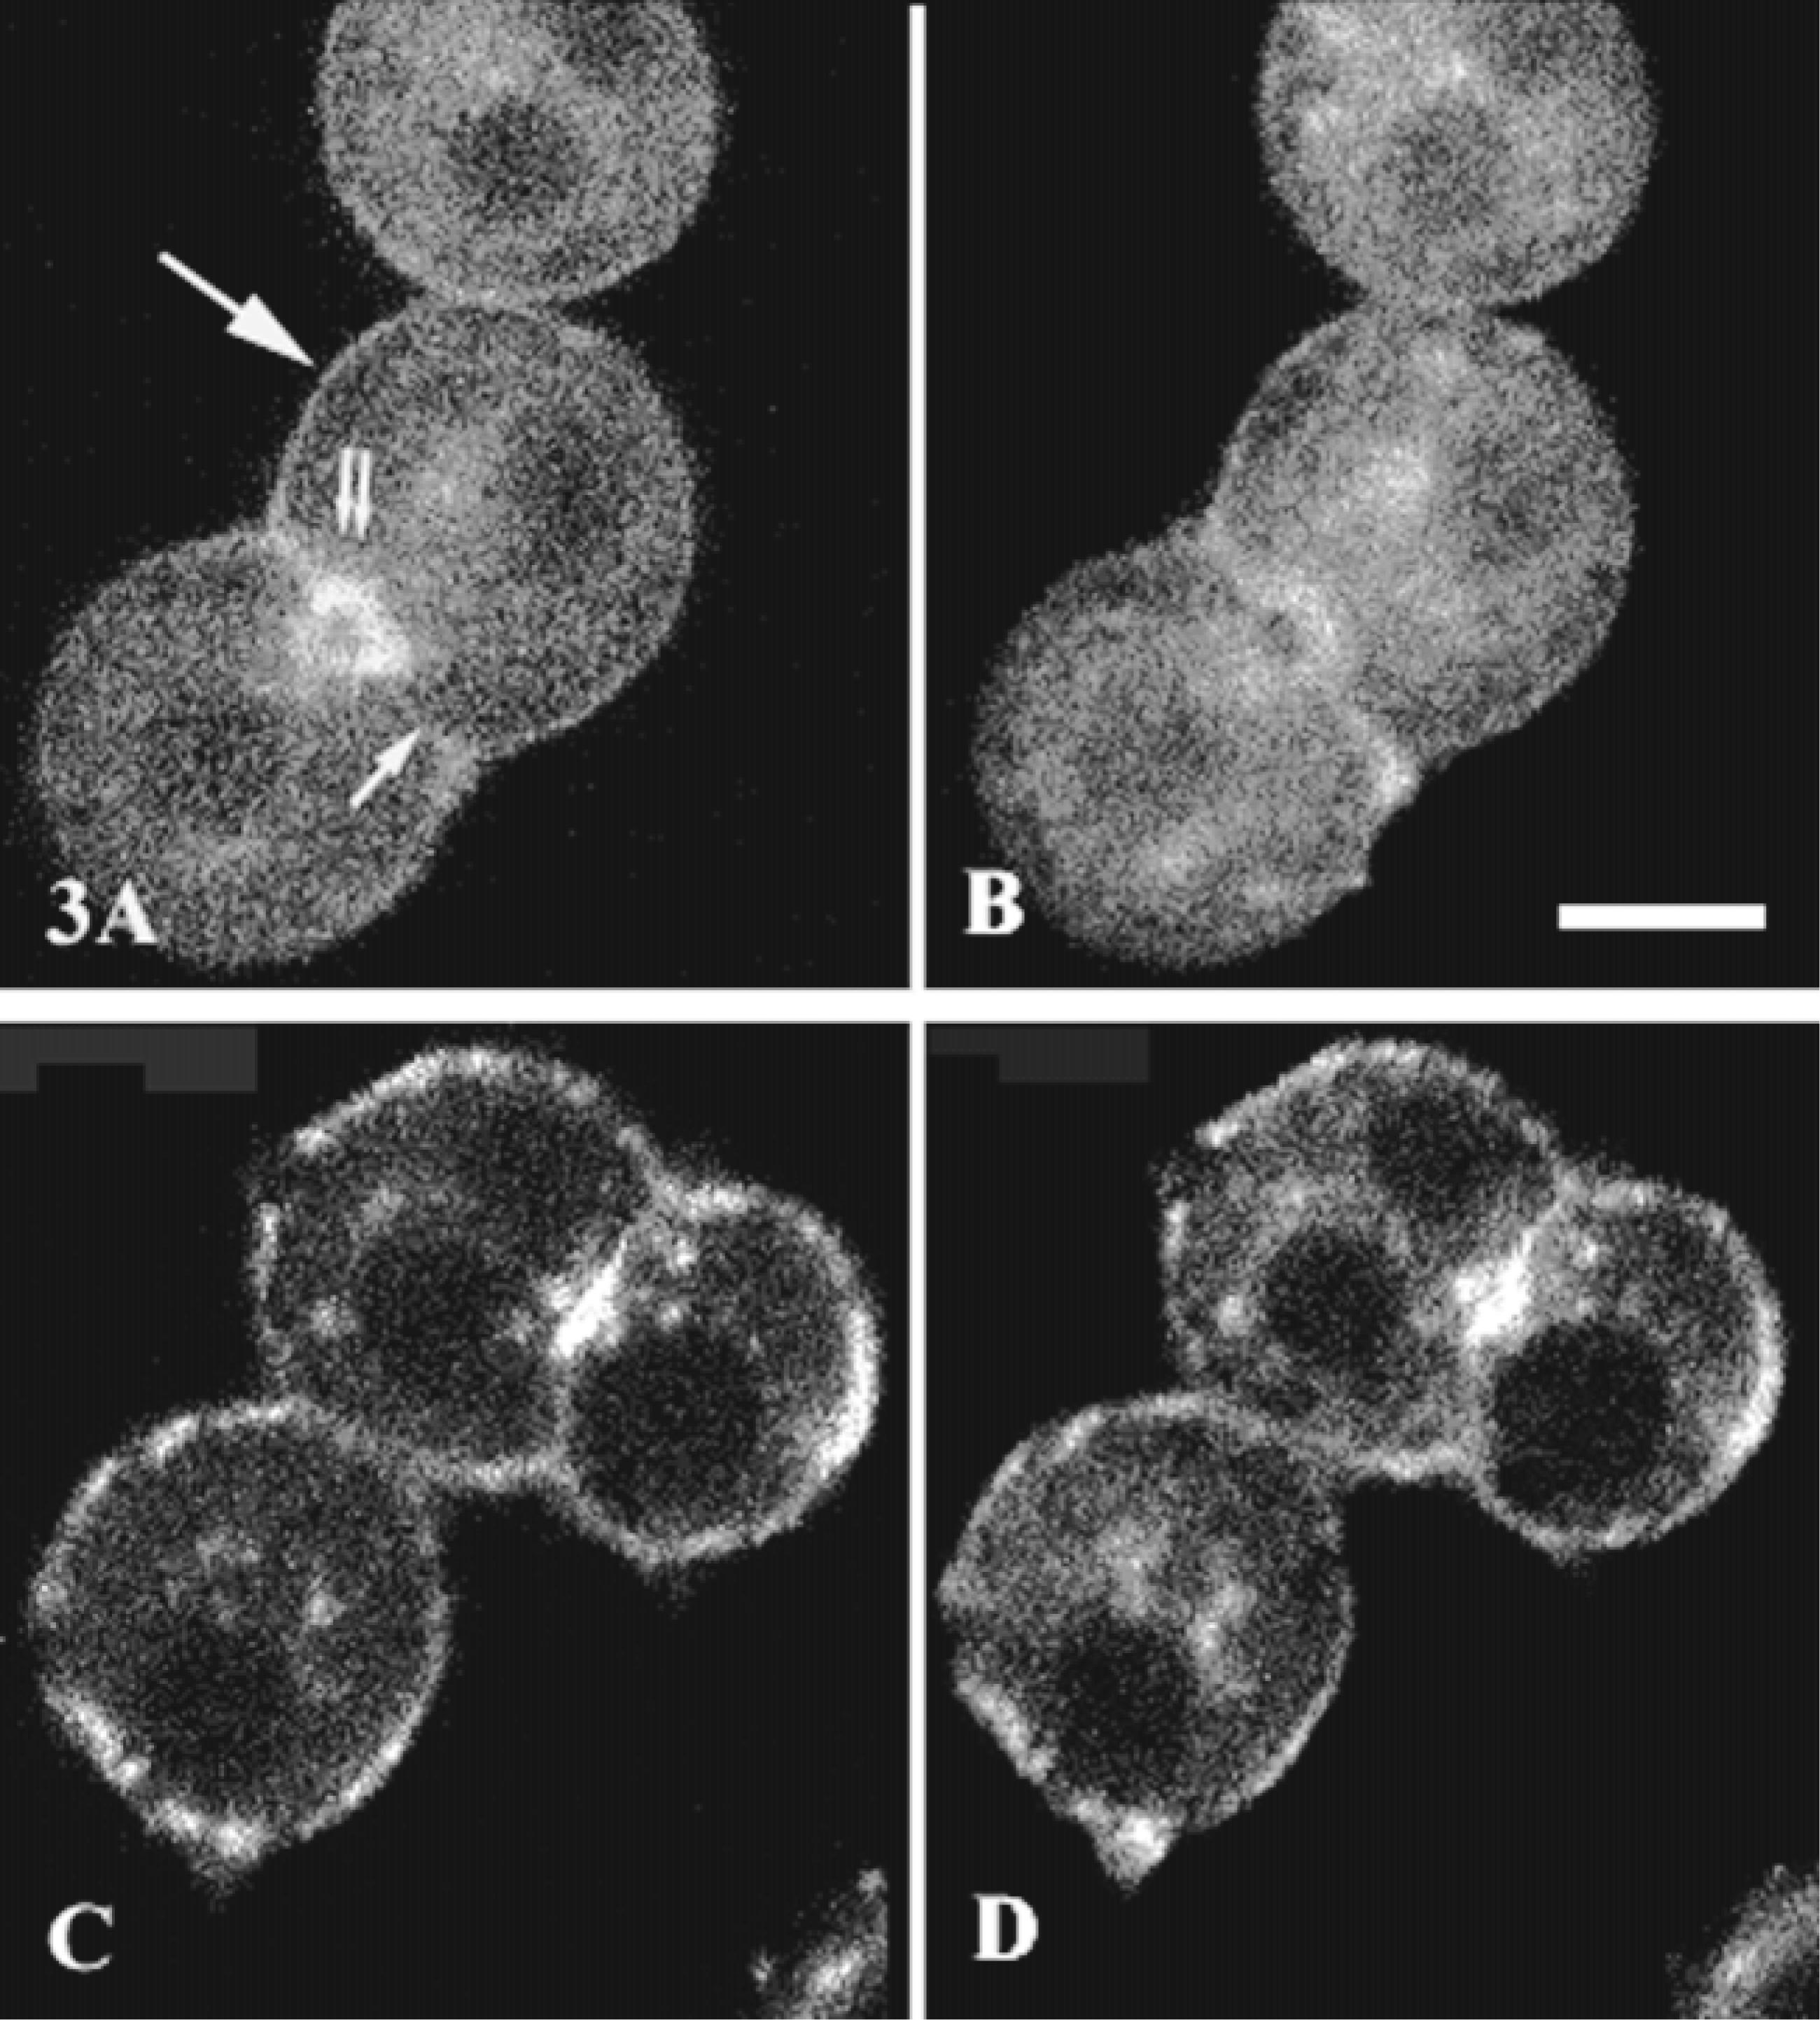
Effects of cytochalasin D treatment on Gαq/Gα11 and F-actin subcellular distribution. Hepatocyte multiplets grown on cover-slips were incubated with (C,D) or without (A,B) 2 μM cytochalasin D for 60 min at 37C. They were then fixed, permeabilized, and labeled for Gαq/Gα11 with FITC-streptavidin as described in the legend to Figure 2. F-actin was labeled with TRITC-phalloidin (1 μg/ml). TRITC (F-actin; A,C) and FITC (Gαq/Gα11; B,D) labeling was analyzed by confocal microscopy; basal membrane (large arrow), lateral membrane (small arrow), and bile canaliculi (double arrows). Images were representative of 80 cells examined from four separate experiments. Bar = 10 μm.
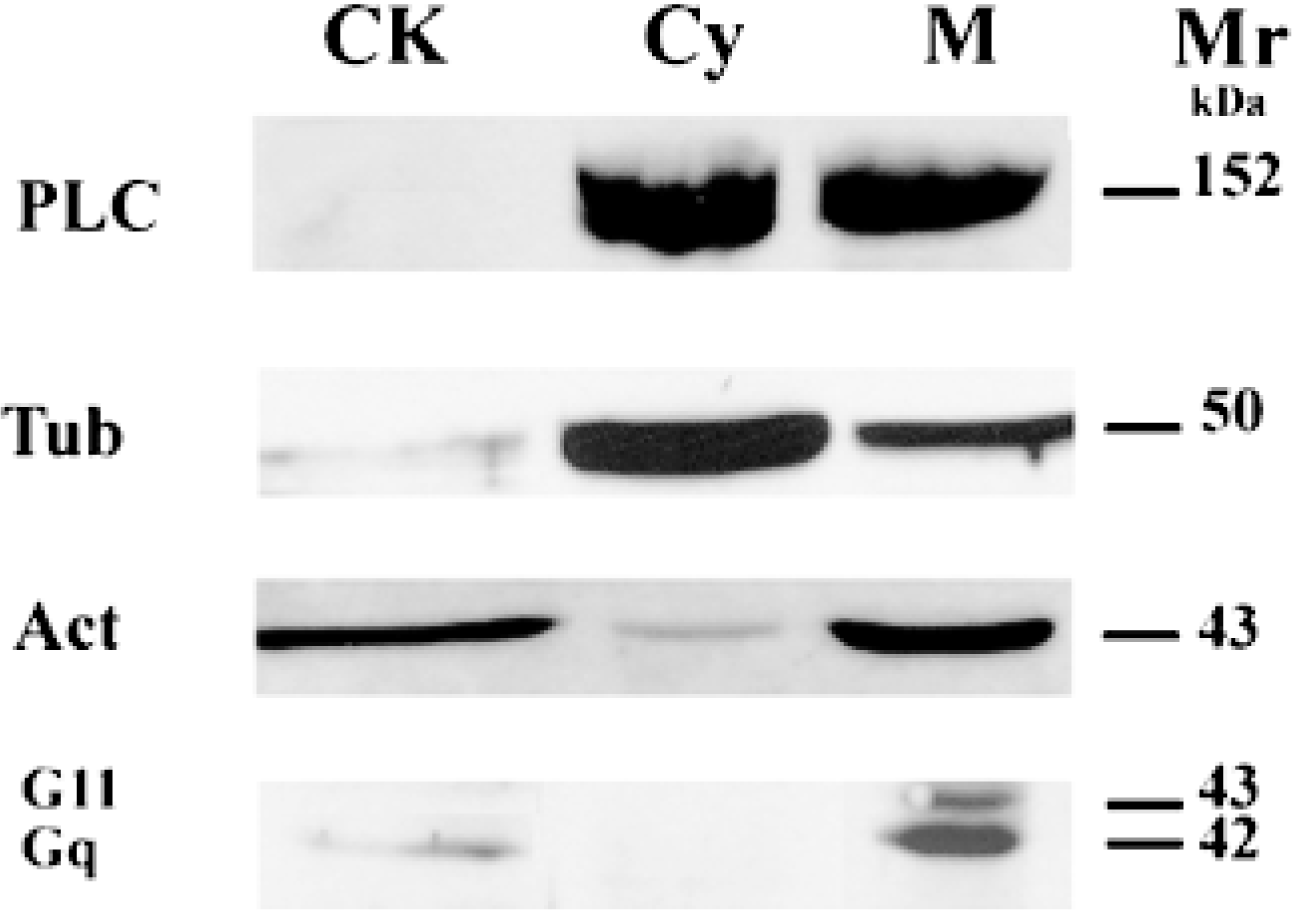
Immunoblot analysis of hepatocyte subcellular fractions using anti-phospholipase Cβ3, anti-tubulin, anti-actin, and anti-Gαq/Gα11 antibodies. Proteins from cytoskeleton (CK), cytosol (Cy), and total membrane (M) fractions (10μg/lane) were resolved by SDS-PAGE, transferred to nitrocellulose and probed with antibodies directed against phospholipase Cβ3 (PLC), tubulin (Tub), actin (Act), and Gαq/Gα11 as described in Materials and Methods. Results are representative of two to four experiments from two separate cell preparations. Mr, molecular weight.
Double labeling for tubulin and Gαq/Gα11 was performed in rat hepatocyte multiplets. The specific anti-α-tubulin antibody labeled the typical filamentous tubulin network, which was abundant in regions near the nucleus and around the bile canaliculi (Figure 4A). Sparse punctate labeling of the tubulin network, was detected associated with the basolateral membrane areas (Figure 4A), in contrast to the continuous labeling of Gαq/Gα11 proteins (Figure 4B). In contrast, tubulin and Gαq/Gα11 were both located under the bile canaliculus membrane (96% of 43 bile canaliculi observed). Prior treatment with colchicine (10 μM for 1 hr at 37C) completely disrupted the intracellular microtubule network and significantly reduced the labeling in the bile canalicular area (Figure 4C). This colchicine effect was specific because no change in the F-actin labeling was observed (not shown). The labeling of Gαq/Gα11 in the basolateral membrane and cytoplasm was not affected by colchicine treatment, but the treatment did reduce labeling around the bile canaliculus area (90% of bile canaliculi observed) (Figure 4D). On Western blots (Figure 5), Gαq/Gα11 and tubulin were detected in the total membrane and cytoskeleton fractions. In contrast, tubulin was abundant in the cytosolic fraction in which Gαq/Gα11 was not detected.
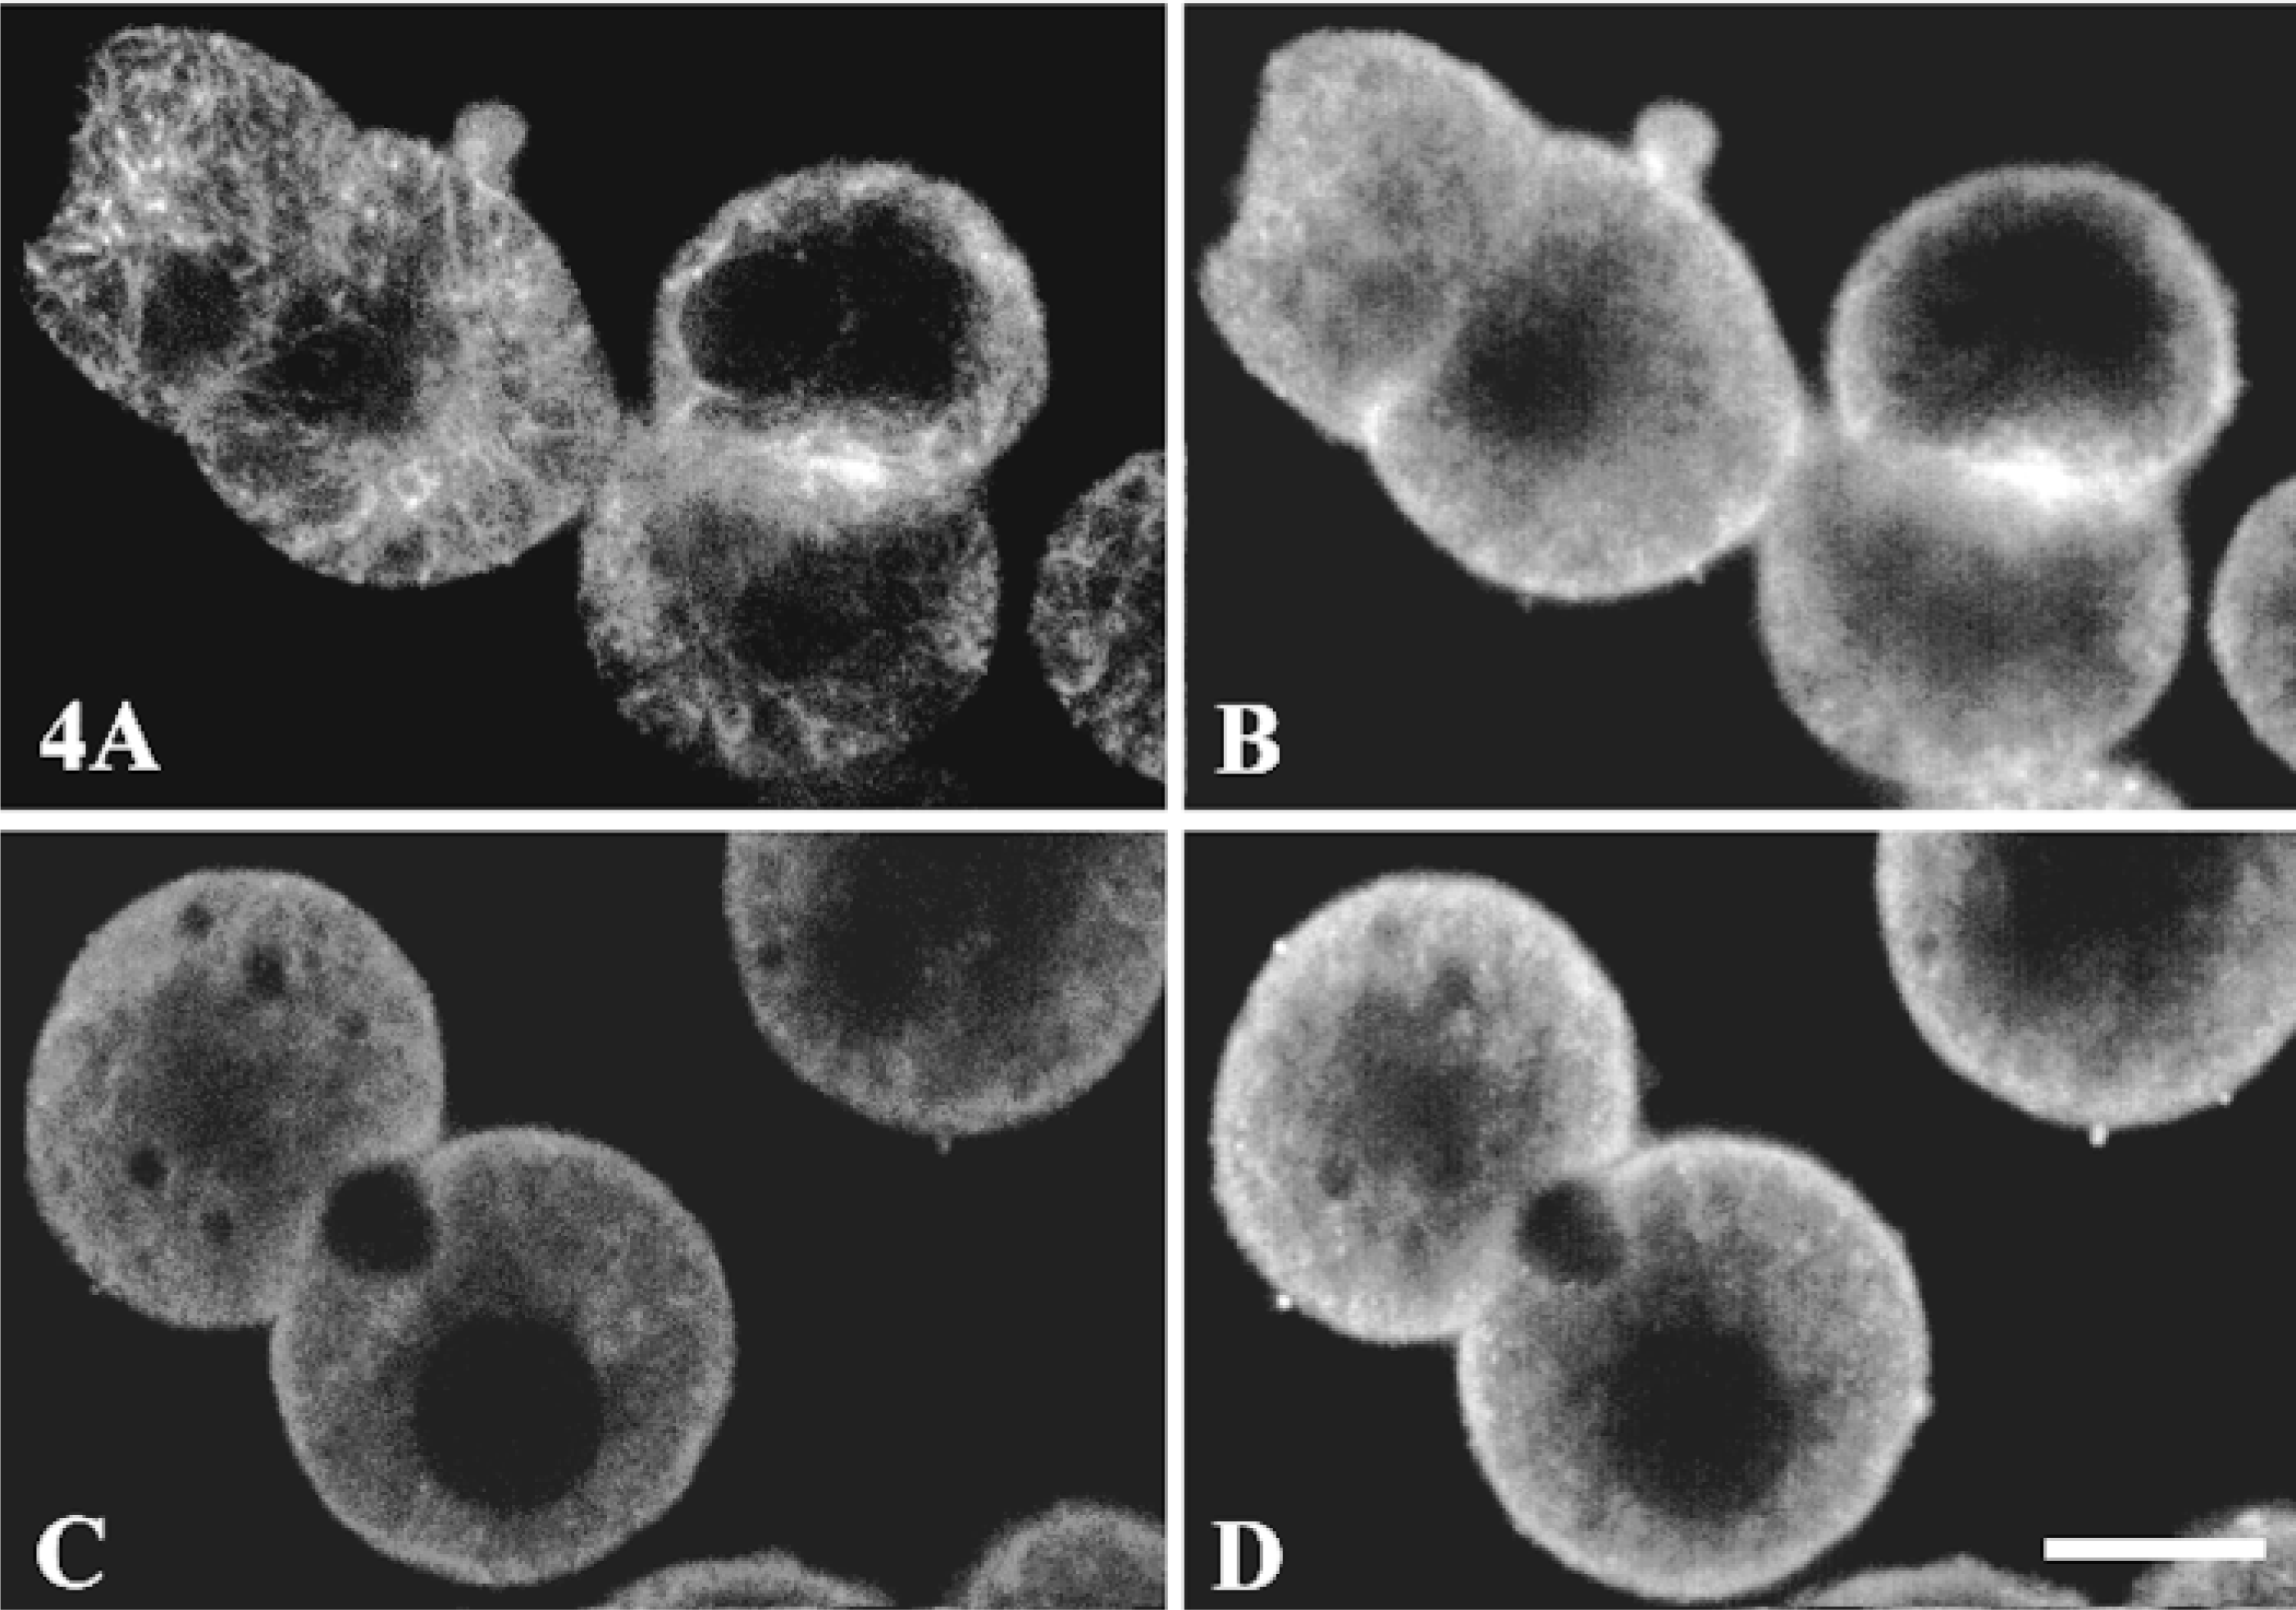
Effects of colchicine treatment on Gαq/Gα11 and tubulin subcellular distribution. Hepatocyte multiplets grown on coverslips were incubated for 60 min at 37C with (C,D) or without (A,B) 10 μ colchicine. They were then fixed and permeabilized as described in the legend to Figure 2. The cells were washed and incubated with a mixture of rabbit anti-Gαq/Gα11 antibody (1:100) and mouse anti-tubulin antibody (1:400). They were incubated with biotinylated anti-rabbit IgG (1:200), then with a mixture of FITC-streptavidin (1:500) and TRITC anti-mouse IgG (1:100). TRITC (tubulin; A,C) and FITC (Gαq/Gα11; B,D) labeling was analyzed by confocal microscopy. Images are representative of 75 cells examined from three separate experiments. Bar = 10 μm.
Subcellular Distribution of PLCβ3
The antibody used to detect PLCβ3 in rat hepatocytes was specific. On Western blots, it recognized only one band, with a molecular weight (152 kD) corresponding to that of PLCβ3 (Figure 5). PLCβ3 was present mostly in the cytosol and the total membrane fractions after cell fractionation. It was not detected in the cytoskeleton preparation. Immunofluorescence experiments showed similar results. There was heterogeneous labeling of vesicles in the cytoplasm, mainly under the basal membrane as shown by optical sections at a tangent to the cell surface (Figure 6A). To a lesser extent, labeling vesicles were also associated with the plasma membrane in equatorial sections (Figure 6B). The nuclear area was not specifically labeled, whereas an intense signal was obtained with an antibody directed against PLCβ1 (UBI; Lake Placid, NY) in rat hepatocytes (not shown). All labeling was abolished if the primary antibody was omitted from the first incubation medium or if it was incubated before the experiment with an excess of the antigen used to produce it (Figure 6C). More than 100 cells were examined and no labeling was observed near the bile canaliculi (Table 1).
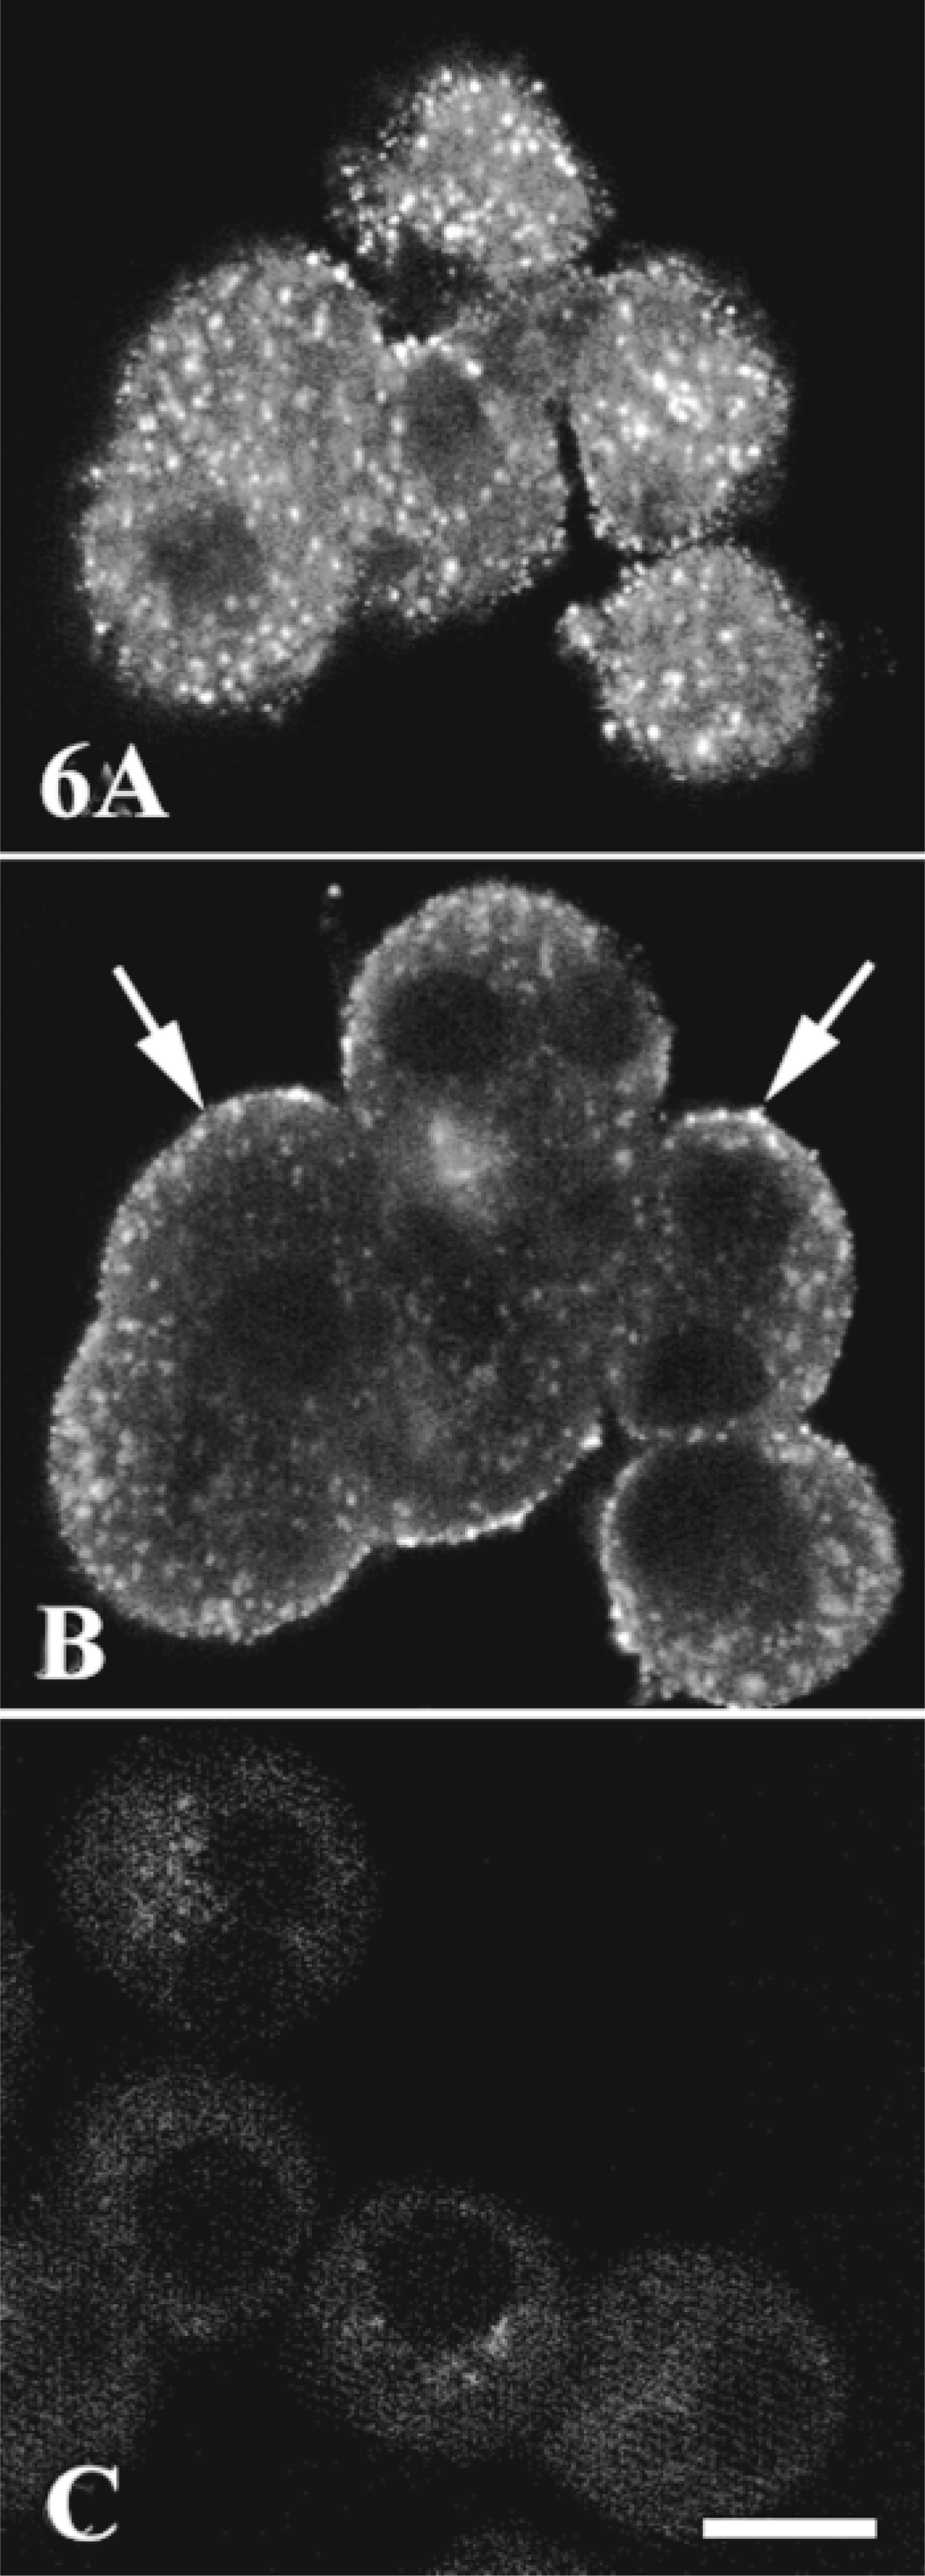
Subcellular distribution of phospholipase Cβ3. Hepatocyte multiplets grown on coverslips were fixed with acetone and incubated with specific rabbit anti-phospholipase Cβ3 antibody (1:100) (A,B). The cells were washed and incubated with Cy3 anti-rabbit IgG (1:1000). Cy3 labeling was analyzed by confocal microscopy. (A) Optical section at a tangent to the cell surface, showing many fluorescent vesicles. (B) Equatorial section of the same cell group shown in A. The fluorescent vesicles were associated with the cell membrane (arrows) and the cytoplasm under the cell membrane. (C) Control with specific primary antibody exhausted by an excess of the antigen. Images are representative of 250 cells examined from three separate experiments. Bar = 10 μm.
Subcellular Distribution of Phosphatidyl Inositol 4,5-bisphosphate
We used the previously characterized specific antibody directed against PIP2 (Fukami et al. 1988; Tran et al. 1993) to show that the substrate of PLCβ3 was primarily associated with the basal membrane, with labeling clustered in intense patches (Figure 7B). All cells examined were labeled in this heterogeneous manner (Table 1). The control rat hepatocytes incubated in the absence of primary antibody were not labeled (Figure 7D). PIP2 was not detected in the lateral and bile canaliculus membranes, whereas these areas were extensively labeled with F-actin (Figure 7A).
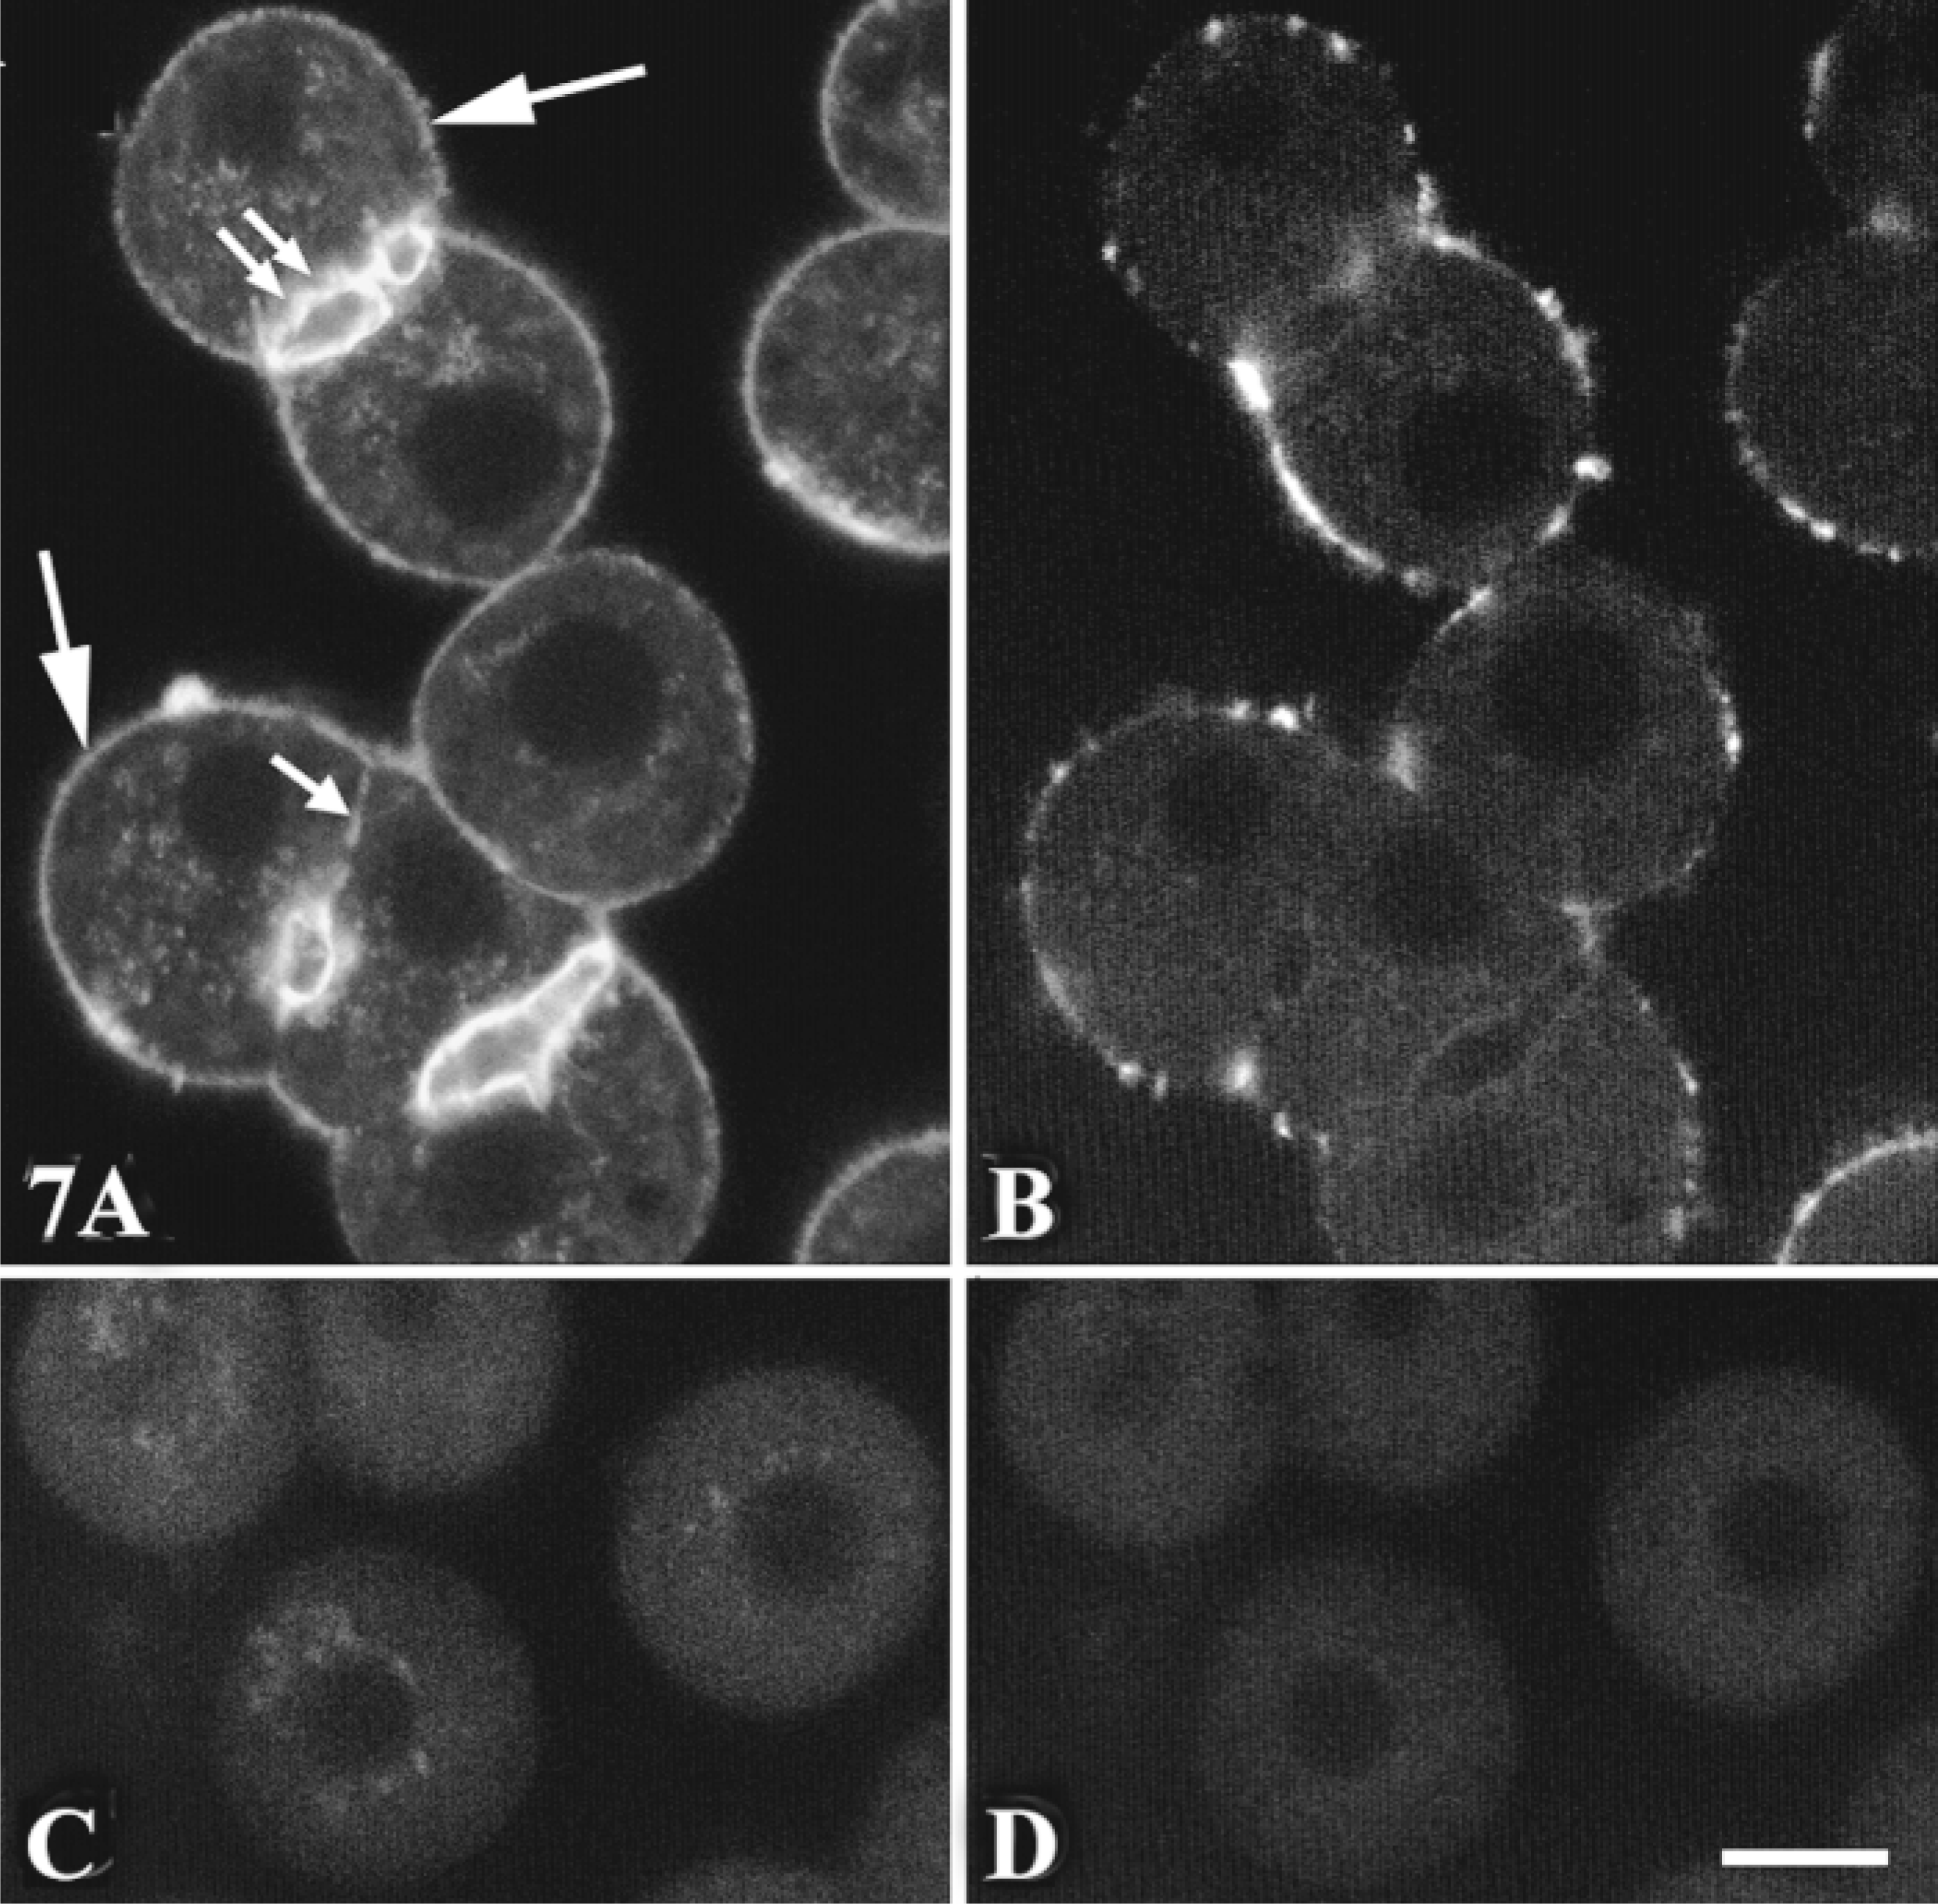
Subcellular distribution of PIP2. Hepatocyte multiplets grown on coverslips were fixed with 4% FA, permeabilized by the freeze-thaw technique (see Materials and Methods), and incubated with (B) or without (D) anti-PIP2 antibody (1:1000). The cells were fixed again with 4% FA to stabilize the antigen-antibody complex, then washed and incubated with FITC-anti-mouse IgG2b (1:100) and TRITC-phalloidin (1 μg/ml). TRITC (F-actin; A) and FITC (PIP2;B) labeling was analyzed by confocal microscopy. Control without TRITC-phalloidin (C); control without anti-PIP2 antibody (D). Images are representative of 200 cells examined from five independent experiments. Bar =10 μm.
Subcellular Distribution of the InsP3 Receptor
The polyclonal antibody used in this study was directed against the entire InsP3 receptor isoform 1 molecule purified from sheep cerebellum. This antibody recognized only one band of 260 kD in a plasma membrane-rich preparation of rat hepatocytes and was shown to be suitable for immunocytochemical experiments (Lièvremont et al. 1996). The anti-InsP3R antibody labeled both the basolateral membrane and the bile canalicular domain with almost the same intensity (see Table 1). An intracellular network near the membrane was also labeled (Figure 8A). Controls not incubated with the primary antibody were not labeled (Figure 8B). Partial co-localization of the InsP3 receptor and F-actin was observed at the basolateral membrane and around the bile canaliculi (Figures 8C and 8D).
Subcellular distribution of the InsP3 receptor. Hepatocyte multiplets grown on coverslips were fixed with 4% FA, permeabilized with PBS: acetone (1:1), and incubated with (A) or without (B) rabbit anti-InsP3R antibody (dilution 1:10). The cells were washed and incubated with biotinylated anti-rabbit IgG (1:200) and then with FITC-streptavidin (1:500). They were then fixed again with 4% FA and analyzed by confocal microscopy. Double labeling: FITC-labeled InsP3R (C) and TRITC-labeled F-actin (D) showed partial co-localization of the two molecules; basal membrane (arrow) and bile canaliculi (double arrows). A is representative of 181 cells examined from six separate experiments. Bar =10 μm.
Discussion
The cellular response to a given hormonal stimulus depends on many factors, the most important of which is the molecular equipment of the cell. Thus, for the hormonal G-protein-coupled receptors (GPCRs), the cell's specific patterns of response and regulation depend on the hormonal receptor subtype, the combination of heterotrimeric G-protein subunits (Kleuss et al. 1993; Macrez-Leprětre et al. 1997), and the isoform of adenylyl cyclase or phospholipase C (Jhon et al. 1993; Boyer et al. 1994; Kim et al. 1997). The subcellular distribution of the transducing molecules may also be important. For example, aquaporin-3 (AQP3) is constitutively expressed at the basolateral membrane of renal collecting duct cells (Ecelbarger et al. 1995) and AQP2 is predominantly present in subapical vesicles which, on activation of the V2 receptor with vasopressin, fuse with the apical membrane (Nielsen et al. 1995). Similarly, in rat hepatocytes, receptors for epidermal growth factor, low-density lipoproteins, asialoglycoproteins, and insulin are concentrated at the basolateral membrane, whereas many enzymes, such as 5′ nucleotidase, dipeptidylpeptidase IV, aminopeptidase N, and ecto ATPase HA4, are located at the apical membrane (Hubbard et al. 1994). The transduction mechanisms triggered by GPCRs involve several different molecules. We therefore decided to investigate the subcellular distribution of these molecules in freshly isolated rat hepatocyte multicellular systems because these multiplets retain some of the structural and functional properties of liver tissue (Gautam et al. 1987; Graf and Boyer 1990; Watanabe et al. 1991a; Spray et al. 1994; Boyer 1997). Furthermore, rat hepatocytes have been extensively used for analyzing vasopressin-induced calcium signals, which are organized as directional intracellular and intercellular waves (Rooney et al. 1990; Nathanson and Burgstahler 1992a,b; Combettes et al. 1994; Thomas et al. 1996; Tordjmann et al. 1997,1998). We used a new fluorescent vasopressin receptor probe, Rhm8 -PVA (Durroux et al. in press), specific antibodies directed against the molecules of the vasopressin transduction pathway (Fukami et al. 1988; Tran et al. 1993; Ibarrondo et al. 1995; Lièvremont et al. 1996), and accurate confocal microscopy techniques to determine the distribution of vasopressin-linked signaling molecules in rat hepatocyte multicellular systems.
The principal molecules involved in the generation of vasopressin-stimulated calcium waves were not evenly distributed within the cells (Table 1, Figures 9 and 10). The V1a receptor detected with Rhm8 -PVA was associated with the basolateral membrane and was absent from the bile canaliculi and cytoplasm. Phospholipase Cβ1 interacts with the αq/α11 G-protein (Taylor et al. 1991; Jhon et al. 1993; Blank 1996; Piiper et al. 1997; Rhee and Bae 1997) and therefore with the V1a receptor because these G-protein sub-units have been reported to bind to this vasopressin receptor subtype (Wange et al. 1991; Jhon et al. 1993; Thibonnier et al. 1993; Offermanns et al. 1994; Strakova et al. 1997). A commercial specific antibody against this PLC isoform did not recognize the expected band in Western blot analysis of total membrane and cytosol fractions from rat hepatocytes. The plasma membrane was weakly labeled and the perinuclear and nuclear regions strongly labeled, as previously observed for these cells (Divecha et al. 1993) and 3T3 cells (Zini et al. 1993). For all these reasons, we focused on PLCβ3, which also interacts with αq/α11 G-protein subunits (Jhon et al. 1993; Blank 1996; Rhee and Bae 1997; Piiper et al. 1997) and therefore with the V1a receptor. This isoform was associated with small vesicles in the cytoplasm near the basolateral membrane but was absent from the bile canalicular area. It was detected in the cytosol and total membrane fractions, as demonstrated by Western blotting (Figure 5). Preliminary results showed that, on vasopressin stimulation, PLCβ3 was translocated from cytoplasmic structures to the basolateral membrane (unpublished results). This suggests that the V1a receptor is functionally coupled to the PLCβ3 isoform in rat hepatocytes. Such a translocation of PLCβ3 has been reported in human platelets on thrombin stimulation (Banno et al. 1996). PIP2 also had a heterogeneous distribution. It was found exclusively in patches associated with the basal plasma membrane. By different experimental approaches, the compartmentalization of PIP2 has been reported in many cell lines, including A431 (Pike and Casey 1996), MDCK (Hope and Pike 1996), and Neuro 2a (Liu et al. 1998). This suggests that such a heterogeneous labeling could not arise from a fixation artifact. In contrast, the distribution of Gαq/Gα11 and InsP3 receptors is more homogeneous. Both are associated with the plasma membrane and the cytoskeleton (Bourguignon et al. 1993; Feng and Kraus-Friedmann 1993; Kraus-Friedmann 1994; Ibarrondo et al. 1995; Lièvremont et al. 1996; Côté et al. 1997b) or vesicles called caveoles (Fujimoto et al. 1992). Nathanson et al. (1994a) demonstrated that calcium waves induced by vasopressin originate from the apical pole (bile canaliculus) and propagate to the basolateral domain. They also demonstrated a higher density of InsP3 receptors at the apical pole of the rat hepatocyte couplet. Our study showed that the density of InsP3 receptors is similar in the basolateral and bile canaliculus domains of the rat hepatocyte (Figure 8). These different data are consistent with both a heterogeneous density of InsP3 receptors and a gradient of InsP3 receptor sensitivity across the hepatocyte. The receptors at the basal pole may have a low affinity for InsP3 and may therefore not be activated by locally produced InsP3. The InsP3 receptors at the apical pole may have a high affinity for InsP3 diffusing from the basal pole, as suggested for pancreatic acinar cells (Kasai et al. 1993; Thorn et al. 1993) and parotid acinar cells (Tanimura et al. 1998).
Distribution of vasopressin signaling molecules within the rat hepatocyte multiplets. The molecules involved in the generation of the calcium wave induced by vasopressin are represented in the various domains of a hepatocyte doublet. In this figure, the size of each molecule in a given area is proportional to its relative abundance.
Normalized fluorescence intensity profiles of signaling molecules involved in the vasopressin response. The V1a vasopressin receptor (V1aR), αq/α11 G-protein subunits (Gαq/α11), phospholipase Cβ3 (PLCβ3), phosphatidyl inositol 4,5-bisphosphate (PIP2), and InsP3 receptor (InsP3R) from rat hepatocytes, were labeled using fluorescent specific analogues or specific antibodies as described in Table 1. Digitized confocal images of signaling molecules were analyzed to obtain the fluorescence intensity profile from the basal membrane towards the nucleus using Matrox MAGIC software (see Materials and Methods). Results were normalized as a percentage of the peak fluorescence value (arbitrary units) for each signaling molecule profile. Data presented are the means of over 20 profiles per signaling molecule (one profile/cell) from two or three separate hepatocyte preparations. The dotted line from the fluorescence intensity profile of V1aR represents autofluorescence (cells incubated without the specific fluorescent antagonist). In all other cases, correction was made for autofluorescence by adjusting the origin for the Y-axis.
Transducing molecules may also be rapidly redistributed within the hepatocyte, from the basolateral pole to the bile canaliculus, during hormonal stimulation. Such a redistribution has been described for V1a and V2 vasopressin receptors in A7r5 and A10 smooth muscle and LLC-PK1 cell lines (Jans et al. 1989,1990; Lutz et al. 1990), for α-subunits of G-proteins (Ransnas et al. 1989; Svoboda and Milligan 1994; Banno et al. 1996; Côté et al. 1997a,b; Cornea et al. 1998), and for PLC (Yang et al. 1994; Banno et al. 1996). Experiments are now under way to investigate whether such a redistribution occurs in rat hepatocytes.
Previous studies have demonstrated the involvement of the cytoskeleton in the transduction mechanisms involving GPCRs. Drugs, such as cytochalasin D and colchicine, which disorganize actin or tubulin networks, inhibit second messenger production in a variety of cell types, including rat adrenal glomerulosa (Côté et al. 1997a,b) and WRK1 cells (Ibarrondo et al. 1995). They also reduce hormonal responses, such as steroidogenesis in frog adrenocortical cells (Feuilloley et al. 1993; Feuilloley and Vaudry 1996) and albumin secretion in rat hepatocytes (Saucan and Palade 1991). These effects probably arise from close interactions between transducing molecules and the cellular cytoskeleton. Thus, G-proteins subunits such as αi, αq, α11, αs, β, or γ12 have been found to be associated with actin and/or tubulin networks (Carlson et al. 1986; Särndahl et al. 1993; Ibarrondo et al. 1995; Côté et al. 1997a,b; Ueda et al. 1997). PLCβ3 and protein kinase C interact with the cytoskeleton in a cytochalasin D-dependent manner (Banno et al. 1996). Similar interactions were expected in rat hepatocytes because, first, cytochalasins B and D affect bile canalicular contractions (Phillips et al. 1983; Watanabe et al. 1991b; St Pierre et al. 1997) and decrease bile flow but do not affect the biliary secretion of organic anions (St Pierre et al. 1997). Colchicine inhibits the uptake, transport and secretion of horseradish peroxidase (Kono et al. 1997) second, hormonal receptors involved in the regulation of hepatocyte functions, such as the V1a vasopressin, AT1A angiotensin II, α1 adrenergic, and P2Y purinergic receptors, are coupled to PLC via αq/α11 G-proteins (Wange et al. 1991; Jhon et al. 1993; Thibonnier et al. 1993; Offermanns et al. 1994) that are associated with the actin and/or tubulin networks (Ibarrondo et al. 1995; Côté et al. 1997b). This study clearly demonstrates that αq/α11 G-proteins are associated with the cytoskeleton, presumably particularly with actin filaments in rat hepatocytes because (a) cytochalasin D treatment disorganizes both F-actin and Gαq/Gα11 labeling, whereas colchicine does not (Figure 3), (b) Western blot analysis showed that Gαq was associated with an actin-rich Triton X-100-insoluble cytoskeleton preparation (Figure 5), and (c) F-actin and Gαq/Gα11 double labeling gave similar profiles (Figure 11 A) for both molecules, whereas double labeling with tubulin and Gαq/Gα11 did not (Figure 11B). These data are consistent with results obtained with WRK1 cells (Ibarrondo et al. 1995) and rat adrenocortical cells (Côté et al. 1997b) but conflict with those showing a preferential association of the tubulin network with Gαq in Sf9 cells (Popova et al. 1997), and with Gαs and Gαi in rat cerebral cortex synaptic membranes (Wang et al. 1990). The distributions of F-actin and Gαq/Gα11 were not identical, however (Figure 11A), so we cannot exclude the possibility that Gαq/Gα11 also interacts with tubulin or other intracellular filaments, as observed in rat adrenocortical cells (Côté et al. 1997b). Therefore, the association of Gαq/Gα11 with cytoskeleton fibers appears to be a general phenomenon but its functional significance is unknown. Actin filaments rapidly depolymerize and repolymerize on hormonal stimulation (Rijken et al. 1991; Norman et al. 1994). They may therefore regulate the coupling of calcium-mobilizing hormone receptors and Gαq/Gα11. Remodeling of actin cytoskeleton networks may thus alter the generation of second messengers and regulate the physiological effects associated with GPCRs.
Fluorescence intensity profiles of cytoskeleton and signaling molecules. Double labeling of F-actin (Act) and tubulin (Tub) networks with either αq/α11 G-protein subunits (Gαq/Gα11) (A,B) or the InsP3R (C) was performed as described in the legends to Figures 3 and 4. Pseudocolor images were generated from digitized confocal images by Photoshop software using green for FITC and red for TRITC. Red images (Act or Tub) and green images (Gαq/Gα11 or InsP3R) were superimposed. Fluorescence intensity profiles from the basal membrane to the nucleus were obtained using Matrox Magic software. Results were normalized as a percentage of the peak fluorescence value for each profile. Data presented are the means of more than 20 profiles (one profile/cell) for each molecule studied from two separate hepatocyte preparations. Autofluorescence level (omission of specific primary antibodies and TRITC-phalloidin) corresponds to point zero on the Y-axis.
Further evidence for the involvement of the cytoskeleton in hepatocyte signal transduction is provided by the following facts. (a) Both F-actin and V1a receptor-specific labeling are concentrated (Figures 10 and 11 A) and co-localized (results not shown) in the basolateral membrane. (b) InsP3 receptors are associated with cytoskeleton structures in the liver (Feng and Kraus-Friedmann 1993) and in human platelets (Bourguignon et al. 1993) and are functionally sensitive to drugs that affect cytoskeleton structure (Bourguignon et al. 1993). This study also showed partial co-localization of the InsP3 receptor and the F-actin network in rat hepatocytes (Figure 11C).
We also found a difference in the distribution of the two α G-protein subunits studied. The plasma membrane contained both αq and α11 but in unequal proportions (73 ± 4 and 27 ± 4% respectively). The cytoskeleton fraction contained only the αq-subunit (Mr 42 kD). The α11 band was undetectable even if the amount of cytoskeleton proteins in the gel well was increased (Figure 5). This is one of the first examples of a cell preparation exhibiting only the αq G-protein subunit. However, the significance of this is unclear. It may reflect a preferential coupling of the V1a vasopressin receptor and the αq G-protein subunit in rat hepatocytes. Indeed, only the receptor-coupled G-protein subunit can be phosphorylated on hormonal stimulation, as previously observed in a transfected CHO cell line (Umemori et al. 1997). Therefore, only this G-protein can interact in its phosphorylated form with the cytoskeleton, as previously observed by Banno et al. (1996). Specific antibodies directed against αq or α11 G-proteins are required to test this hypothesis. Unfortunately, none of the available antibodies is suitable for immunocytochemical studies (unpublished results).
This study has determined the subcellular distribution of all the main transducing molecules involved in vasopressin signaling in the rat hepatocyte. Experiments are now in progress to study the translocation of signaling molecules from one compartment to another on hormonal stimulation, to improve our understanding of the hormonal signals in the liver.
Footnotes
Acknowledgements
We would like to thank R. Leuillet for excellent hepatocyte preparations, D. Villette for technical assistance, Dr K. Fukami for his gift of the anti-PIP2 antibody, and J. Knight for help in editing the manuscript.