
Abstract
To investigate the pattern of expression of the three calmodulin (CaM) genes by in situ hybridization, gene-specific [35 S]-cRNA probes complementary to the multiple CaM mRNAs were hybridized in rat brain sections and subsequently detected by quantitative film or high-resolution nuclear emulsion autoradiography. A widespread and differential area-specific distribution of the CaM mRNAs was detected. The expression patterns corresponding to the three CaM genes differed most considerably in the olfactory bulb, the cerebral and cerebellar cortices, the diagonal band, the suprachiasmatic and medial habenular nuclei, and the hippocampus. Moreover, the significantly higher CaM I and CaM III mRNA copy numbers than that of CaM II in the molecular layers of certain brain areas revealed a differential dendritic targeting of these mRNAs. The results indicate a differential pattern of distribution of the multiple CaM mRNAs at two levels of cellular organization in the brain: (a) region-specific expression and (b) specific intracellular targeting. A precise and gene-specific regulation of synthesis and distribution of CaM mRNAs therefore exists under physiological conditions in the rat brain.
Keywords
T
At least three distinct bona fide CaM genes (CaM I, CaM II, and CaM III) and four pseudogenes have been described in the rat (Nojima and Sokabe 1986, 1987; Nojima et al. 1987; Sherbany et al. 1987; Nojima 1989). The genuine CaM genes transcribe seven mRNA species by means of alternative polyadenylation signals (Nojima 1989; Ikeshima et al. 1993; Gannon and McEwen 1994). Although encoded by multiple genes, the protein products have an identical amino acid sequence (Putkey et al. 1983; Chien and Dawid 1984; Nojima 1989).
The CaM genes exhibit tissue-specific expression with differential regulation during development in the rat (McManus et al. 1989; Weinman et al. 1991; Ikeshima et al. 1993). They are strongly expressed in neural tissue (Nojima 1989; Weinman et al. 1991; Ikeshima et al. 1993). Under physiological conditions, a similar expression pattern in the rat brain (Ikeshima et al. 1993; Gannon and McEwen 1994) but a differential expression in the mouse brain (Solà et al. 1996) have been reported for the three CaM genes. A differential regulation in response to experimental conditions (Bai and Weiss 1991; Bai et al. 1992; Gannon and McEwen 1994; Barrón et al. 1995; Solà et al. 1997) has also been observed.
Because several lines of evidence point to the differential neuronal expression of the three CaM genes, a thorough quantitative comparison of the mRNA levels corresponding to the three CaM genes in the brain under physiological conditions would clarify our understanding of the detailed regional distribution and the real proportions of these transcripts. The complex role of CaM in cytoplasmic and synaptic functions suggests a precise intracellular transport, possibly involving the targeting of CaM mRNAs to the relevant sub-cellular compartments such as dendritic and/or axonal processes. In fact, the dendritic localization of CaM I mRNA during early postnatal development in the rat brain (Berry and Brown 1996) and of CaM I and II mRNAs in PC12 cells (Zhang et al. 1993) has been described. To answer the questions that have arisen in part from reported differences in previous studies, a comparative in situ hybridization study utilizing specific [35 S]-cRNA probes complementary to CaM mRNAs has now been performed in rat brain sections, with detection by quantitative film or high-resolution nuclear emulsion autoradiography.
Materials and Methods
Experimental Animals and Tissue Preparation
All animal experiments were carried out in strict compliance with the European Communities Council Directive (86/609/EEC) regarding the care and use of laboratory animals for experimental procedures. Male Sprague-Dawley rats (200-250 g) maintained under standard housing conditions were decapitated and the brains were quickly removed, embedded in Cryomatrix embedding resin (Shandon Scientific; Pittsburgh, PA), and frozen immediately at −70C. Serial coronal cryostat sections (15 (μm) from selected brain areas were cut and thaw-mounted onto Cr-Al-gelatin-coated glass slides. Sections were air-dried and stored at −70C until further processing.
cRNA Probes
[35 S]-cRNA probes were prepared as previously described (Palfi et al. 1998). Briefly, genomic sequences of the 3′-nonhomologue regions of CaM I, II, and III mRNAs (Nojima and Sokabe 1987; Nojima 1989) were amplified by the polymerase chain reaction (PCR). Sequence alignment was completed with the software BLASTN, version 2.0.6 (Zhang and Madden 1997). PCR was performed by employing EcoR I and BamH I restriction enzyme cleavage site-extended primers. The primer sequences complementary to rat genomic DNA were as follows: for CaM I, 5′-AGACCTACTTTCAACTACT, corresponding to the 30-48-BP sequence, and 5′-TGTAAAACTCAGTAGGGG, corresponding to the 237-255-BP sequence of exon 6 (Nojima and Sokabe 1987); for CaM II, 5′-ATTAGGACTCCATTCCTCC, corresponding to the 1929-1947-BP sequence, and 5′-CACAACTCCACACTTCAACAGC, corresponding to the 2138-2159-BP sequence of exon 5 (Nojima 1989); and for CaM, III 5′-ATGATGACTGCGAAGTGAAG, corresponding to the 7058-7077-BP sequence, and 5′-CAGGAGGAAGGAGAAAGAGC, corresponding to the 7228-7247-BP sequence of exon 6 (Nojima 1989). Standard PCRs were run for 35 cycles (Palfi et al. 1998), the resulting PCR products were cloned into a pcDNA3 vector (Invitrogen; Carlsbad, CA) and sequenced (AB 373 DNA Sequencer; PE Applied Biosystems, Foster City, CA) to confirm their identity. In vitro RNA syntheses from the purified and linearized vectors were carried out to prepare anti-sense and sense cRNA probes. The complementary probe sequences were 225 BP (CaM I), 231 BP (CaM II), and 157 BP (CaM III) long. For radiolabeling, [35 S]-UTPαS (1100 (μCi/nmol; Isotope Institute, Budapest, Hungary) was incorporated. Labeled probes were purified by size-exclusion chromatography on a ProbeQuant G-50 Sephadex microcolumn (Pharmacia Biotech; Uppsala, Sweden) and the probe-specific activity was determined to be 3.8-6.1 × 10⁸ cpm/μg.
In Situ Hybridization
The protocol for hybridization with [35 S]-cRNA probes was carried out according to Palfi et al. (1998). Briefly, coronal cryostat brain sections were fixed for 5 min in 2 × SSC (0.3 M NaCl and 0.03 M Na-citrate, pH 7.0) containing 4% formaldehyde, washed twice in 2 × SSC for 1 min, then rinsed in 0.1 M triethanolamine containing 0.25% acetic anhydride for 5 min at room temperature (RT). The sections were dehydrated, air-dried, and hybridized in 50 μl hybridization solution [50% formamide, 5 × SSPE (0.75 M NaCl, 60 mM NaH2PO4, and 6 mM EDTA, pH 7.4), 1 × Denhardt's reagent, 10% dextran sulfate, 50 mM DTT, 100 (μg/ml salmon sperm DNA, and 100 μg/ml yeast tRNA] containing 2.5 × 10⁵ cpm cRNA probe/section. Hybridization was performed under parafilm coverslips in a humified chamber at 48C for 20 hr. The sections were rinsed in 2 × SSC/50% formamide at RT for 5 min, twice in 2 × SSC/50% formamide at 50C for 10 min, and in 2 × SSC at RT for 5 min. The sections were then incubated in 1 × TE (0.01 M Tris and 0.001 M EDTA, pH 8.0) buffer containing 0.5 M NaCl and 16 μg/ml RNase A for 30 min at 37C, and rinsed twice in 2 × SSC/50% formamide at 50C for 10 min and in 2 × SSC at 50C for 10 min. The sections were dehydrated, airdried, and processed for autoradiography.
RNA Isolation and Northern Blot Analysis
Total RNA was prepared by the method of Chomczynski and Sacchi (1987). Briefly, frozen brain tissue was homogenized in guanidine isothiocyanate solution (4 M guanidine isothiocyanate, 25 mM sodium citrate, 0.5% laurylsarcosine, and 0.1 M 2-mercaptoethanol, pH 7.0), followed by phenol-chloroform-isoamyl alcohol extraction. RNA was precipitated with isopropanol, dissolved in guanidine isothiocyanate solution, reprecipitated, washed in 70% ethanol, and finally dissolved in RNase-free water. The RNA content and purity were determined by UV spectrophotometry (at 260 nm and the 260/280-nm ratio). For electrophoresis, RNA was denatured in a solution containing 15% formaldehyde, 20% formamide, and 10 mM MOPS buffer (10 mM MOPS, 4 mM Na acetate, 0.5 mM EDTA, pH 7.0) at 65C for 15 min. Samples (3 μg/lane) were loaded onto a 1.2% agarose gel containing 20 mM guanidium isothiocyanate (Goda and Minton 1995) and 20 mM MOPS buffer and were run in the same buffer at 5 V/cm for 100 min at RT. RNA was pressure-transferred (PosiBlot Pressure blotter; Stratagene, La Jolla, CA) in 10 × SSC at 75 mmHg for 60 min to Duralon-UV nylon membrane (Stratagene) and fixed by UV crosslinking (120,000 μJ/cm2; Stratalinker, Stratagene). Hybridization was carried out at 60C with [35 S]-cRNA probes (1.5 × 10⁶ cpm/lane) in a hybridization buffer (as described for in situ hybridization but complemented with 0.1% SDS and 5 × Denhardt's reagent) for 20 hr. Washing was performed under high-stringency conditions (2 × SSC, 0.5% SDS at RT for 5 min; 2 × SSC, 0.1% SDS at RT for 20 min; 0.1 × SSC, 0.5% SDS at 37 C for 20 min; 0.1 × SSC, 0.5% SDS at 65 C for 40 min; and 0.1 × SSC at RT for 20 min). Finally, the membranes were dried at 37C for 30 min and processed for autoradiography.
Membrane Standard Scale
A scale consisting of 12 halving dilutions of radiolabeled and size-exclusion chromatography-purified riboprobe was prepared (final activity range 1-2000 cpm/mm2), as described by Palfi et al. (1998). The radioactive probe was diluted in RNase-free water and the radioactivity was quantified by liquid scintillation counting. Fifty μl of each dilution was dot-blotted onto a Duralon-UV nylon membrane by vacuum-filtration (Minifold; Schleicher and Schuell, Keene, NH) and fixed by UV crosslinking as described above. Membranes were subsequently dried at 37C for 30 min and co-exposed with tissue sections to autoradiographic film.
Autoradiography
Tissue sections and membrane standards or Northern blots were apposed to Hyperfilm-βmax (Amersham; Arlington Heights, IL) autoradiographic film for 36 hr at 4C, as described by Palfi et al. (1998). Subsequently, representative brain sections were dipped into Hypercoat nuclear emulsion (Amersham) and exposed for 10-30 days at 4C. Films and emulsion-coated slides were developed in Kodak D19 developer (Eastman Kodak; Rochester, NY) for 3.5 and 5 min, respectively, at 19C and fixed in Kodak Fixer for 10 min at 19C.
Densitometry
Quantification was performed exclusively on film autoradiographic images, as described previously (Palfi et al. 1998). Briefly, autoradiographic images were captured by high-resolution (600 × 600 dpi, pixel size ∼42 μm), 8-bit (256 gray level) microdensitometry with a flatbed scanner (Mikrotec IIHR; Microtek International, Taiwan, ROC) attached to a Power Macintosh 8100/80 AV. Video images of the autoradiographs were analyzed by the public domain computer program NIH Image 1.59 (Rasband 1997). Gray values (GVs) between 0 and 255 were assigned to the grayness of autoradiographic images, the background (less than 20 GV) was subtracted, and the corresponding relative optical densities (ROD) were determined as:

For standardization, co-exposed nylon membrane standard scales were used. Radioactivity/pixel ± SD was plotted vs ROD ± SD corresponding to the data points of the standard scales, and nonlinear regression analysis using an exponential model was applied:

where p1 m and p2 m are parameters corresponding to the membrane and x is the radioactivity. The membrane standards were calibrated to tissue-equivalent radioactivity by a mathematical transformation of their curves (Palfi et al. 1998) with a predetermined transformation quotient γ (corresponding to brain paste standards) as:

Film background-corrected RODs (the nonspecific hybridization was indistinguishable from the background) of anatomically defined brain areas were determined in duplicate measurements in five animals. Radioactivity/pixel values corresponding to ROD ± SD measurements of the brain areas were calculated by interpolating with the exponential equations of the co-exposed calibrated membrane standard scales. The mRNA contents of different brain areas were estimated via the formula:
where the Avogadro no. = 6.02 2 5 × 10²³ and f = 37792.9 is a correction factor to scale up a pixel volume (42 μ × 42 μ × 15 μ) to 1 mm3. Final results were expressed in mRNA copy number ± SD.
Data Processing and Statistics
Nonlinear regression analysis was performed with the computer program Statgraphics 6.0 (Manugistics; Rockville, MD). Other data reduction was accomplished with Microsoft Excel 5.0a (Microsoft; Redmond, WA). Analysis of significance was carried out with the two-tailed Student's t-test. The differences between mRNA copy numbers of the same brain area were considered significant when p was less than 0.01.
Microscopy
Developed emulsion-coated tissue sections were air-dried and coverslipped with Entellan (Merck; Darmstadt, Germany). Some of the sections were counterstained with toluidine blue. Specimens were examined in a Leica DM LB microscope (Leica Mikroskopie und Systeme GmbH; Wetzlar, Germany) equipped for brightfield and darkfield microscopy. Microscopic images (1600 × 1200 pixel, 8-bit gray scale) were captured with a Polaroid DMC 1 digital microscope camera (Polaroid; Cambridge, MA) connected to a Power Macintosh 8100/80 AV. Defined brain areas in the autoradiographs (X-ray films or emulsion-coated sections) were identified according to toluidine blue-counterstained sections (Paxinos and Watson 1998).
Results
Control Experiments
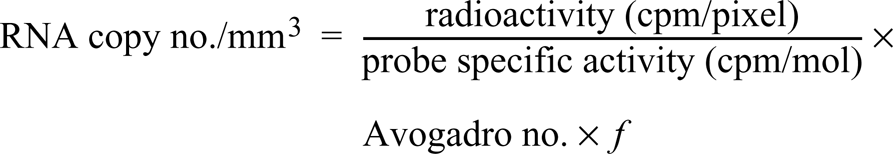
High specificity of the three probes for CaM I, II, and III mRNAs was expected, because no significant homology among the three probes could be determined by sequence alignment. Northern blot analysis of rat brain total RNA revealed two transcripts for CaM I (approximately 4.0 KB and 1.7 KB), a single transcript for CaM II (approximately 1.4 KB), and three transcripts for CaM III (approximately 2.3 KB, 1.9 KB, and 0.9 KB; Figure 1). No labeling was observed when the sense probes were hybridized (not shown). In situ hybridization of antisense probes to tissue sections established a specific and unique distribution, whereas hybridization with sense probes resulted in a very low labeling with nonspecific distribution (Figure 10E). Pretreatment of sections with RNase A resulted in a complete loss of the measurable signals (not shown).
Northern blot analysis of multiple CaM mRNAs in adult rat brain. Three μg total RNA from rat cerebral cortex was loaded and separated in each lane. Blots were separately probed with antisense [35 S]-cRNA probes for CaM I (Lane I), CaM II (Lane II), or CaM III (Lane III) and visualized by film autoradiography. Two transcripts for CaM I (approximately 4.0 KB and 1.7 KB), a single transcript for CaM II (approximately 1.4 KB), and three transcripts for CaM III (approximately 2.3 KB, 1.9 KB, and 0.9 KB) were detected. Lane M indicates marker and rRNA positions in the same membrane stained with ethidium bromide.
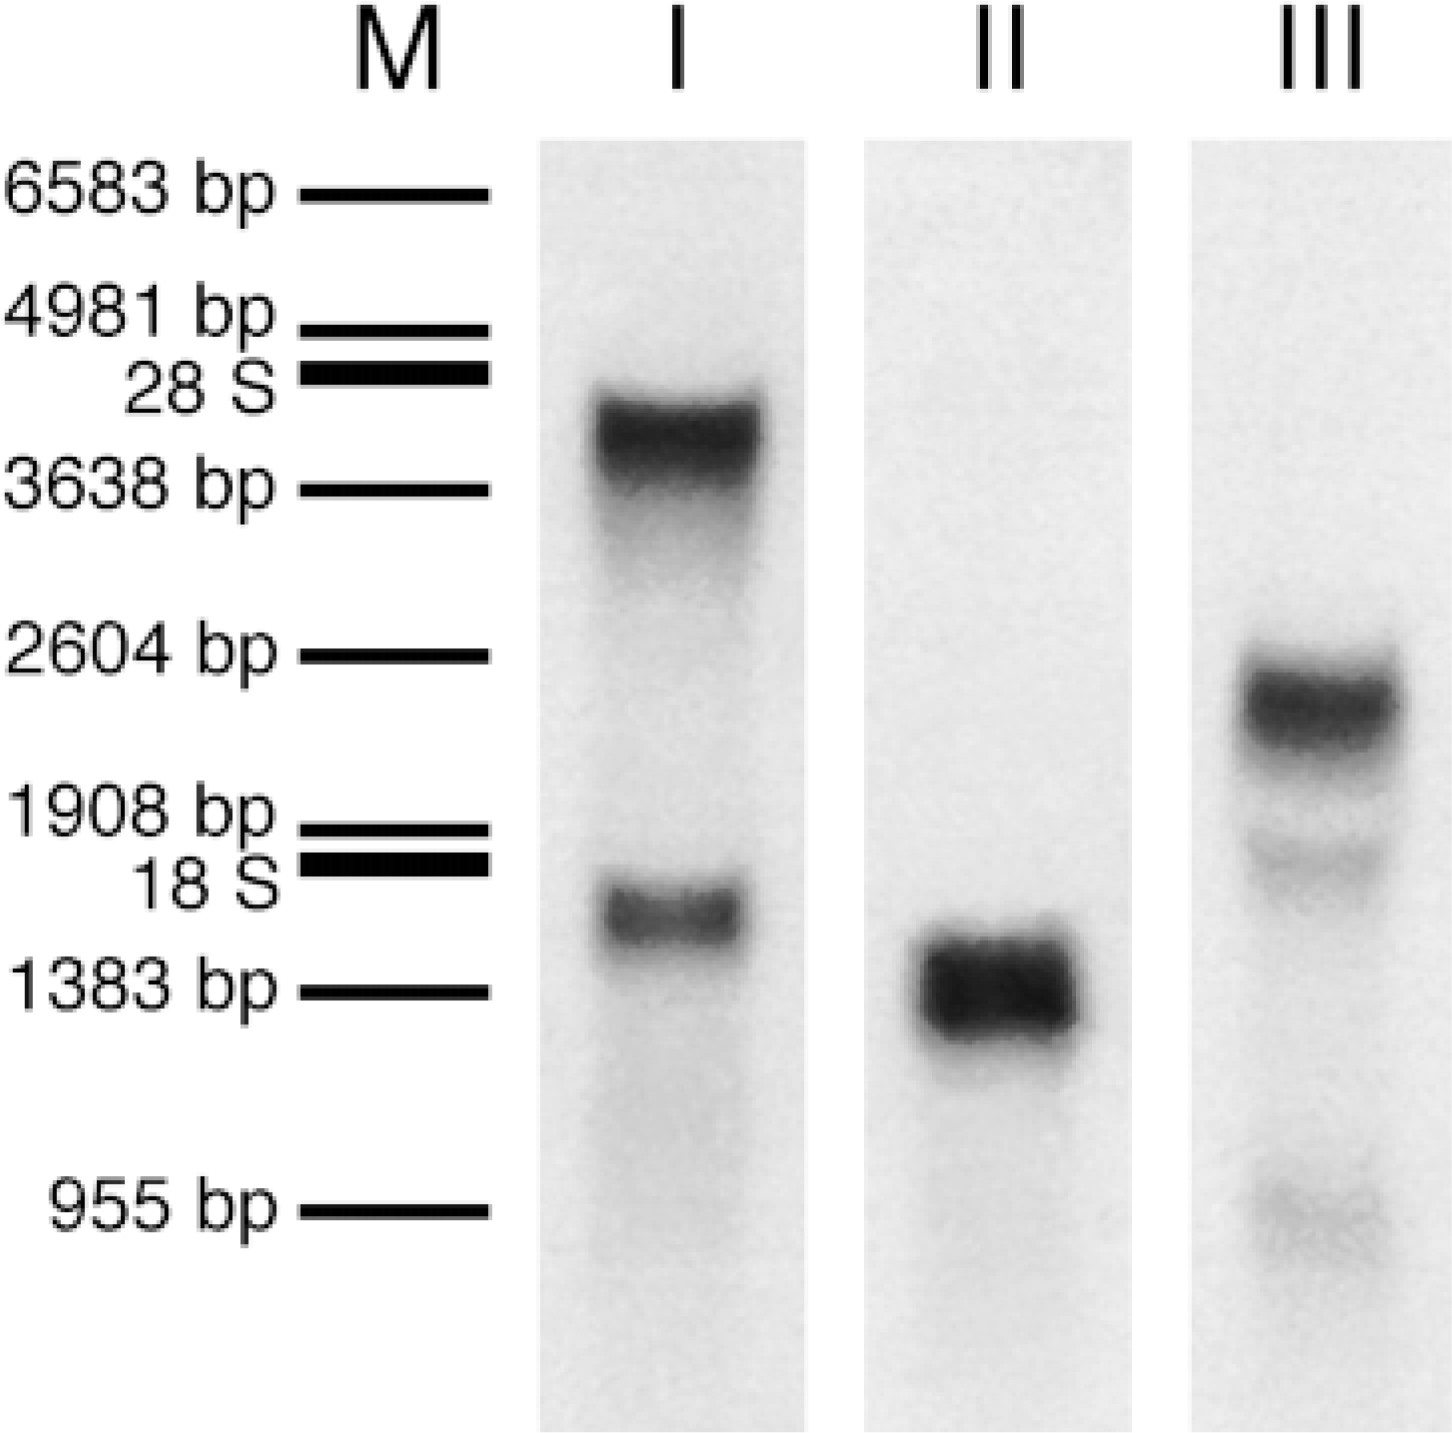
Distribution and cellular localization of CaM mRNAs in the lateral ventricle of adult rat brain. Coronal cryostat sections were cut at bregma −0.4 mm and were hybridized with antisense or sense [35 S]-cRNA probes. The figure shows darkfield emulsion autoradiographs with specific labeling for CaM I (A), CaM II (B), and CaM III (C) mRNA or a nonspecific hybridization signal with CaM III sense riboprobe (E). Brighter areas represent higher hybridization signals. Brightfield microscopic image of the area corresponding to A-C and E stained with toluidine blue is depicted in D. cc, corpus callosum; Ep, ependyma; ChP, choroid plexus; LV, lateral ventricle; LS, lateral septal nuclei; CPu, caudate putamen. Bar = 200 μm.
Calmodulin mRNA Distribution in the Rat Brain
The three distinct CaM genes were widely expressed throughout the rat brain (Figures 2–4; Table 1). An overall similar pattern and quantity of CaM gene expression was observed to be localized mainly in gray matter areas enriched in neuronal cell bodies, in contrast with the low hybridization signals of white matter structures. In spite of the similar general outline, significant differences in the distribution of the multiple CaM mRNA species were found in certain brain areas. A detailed, quantitative description and comparison of the differential distribution of the three bona fide CaM gene transcripts in the rat brain is given below.
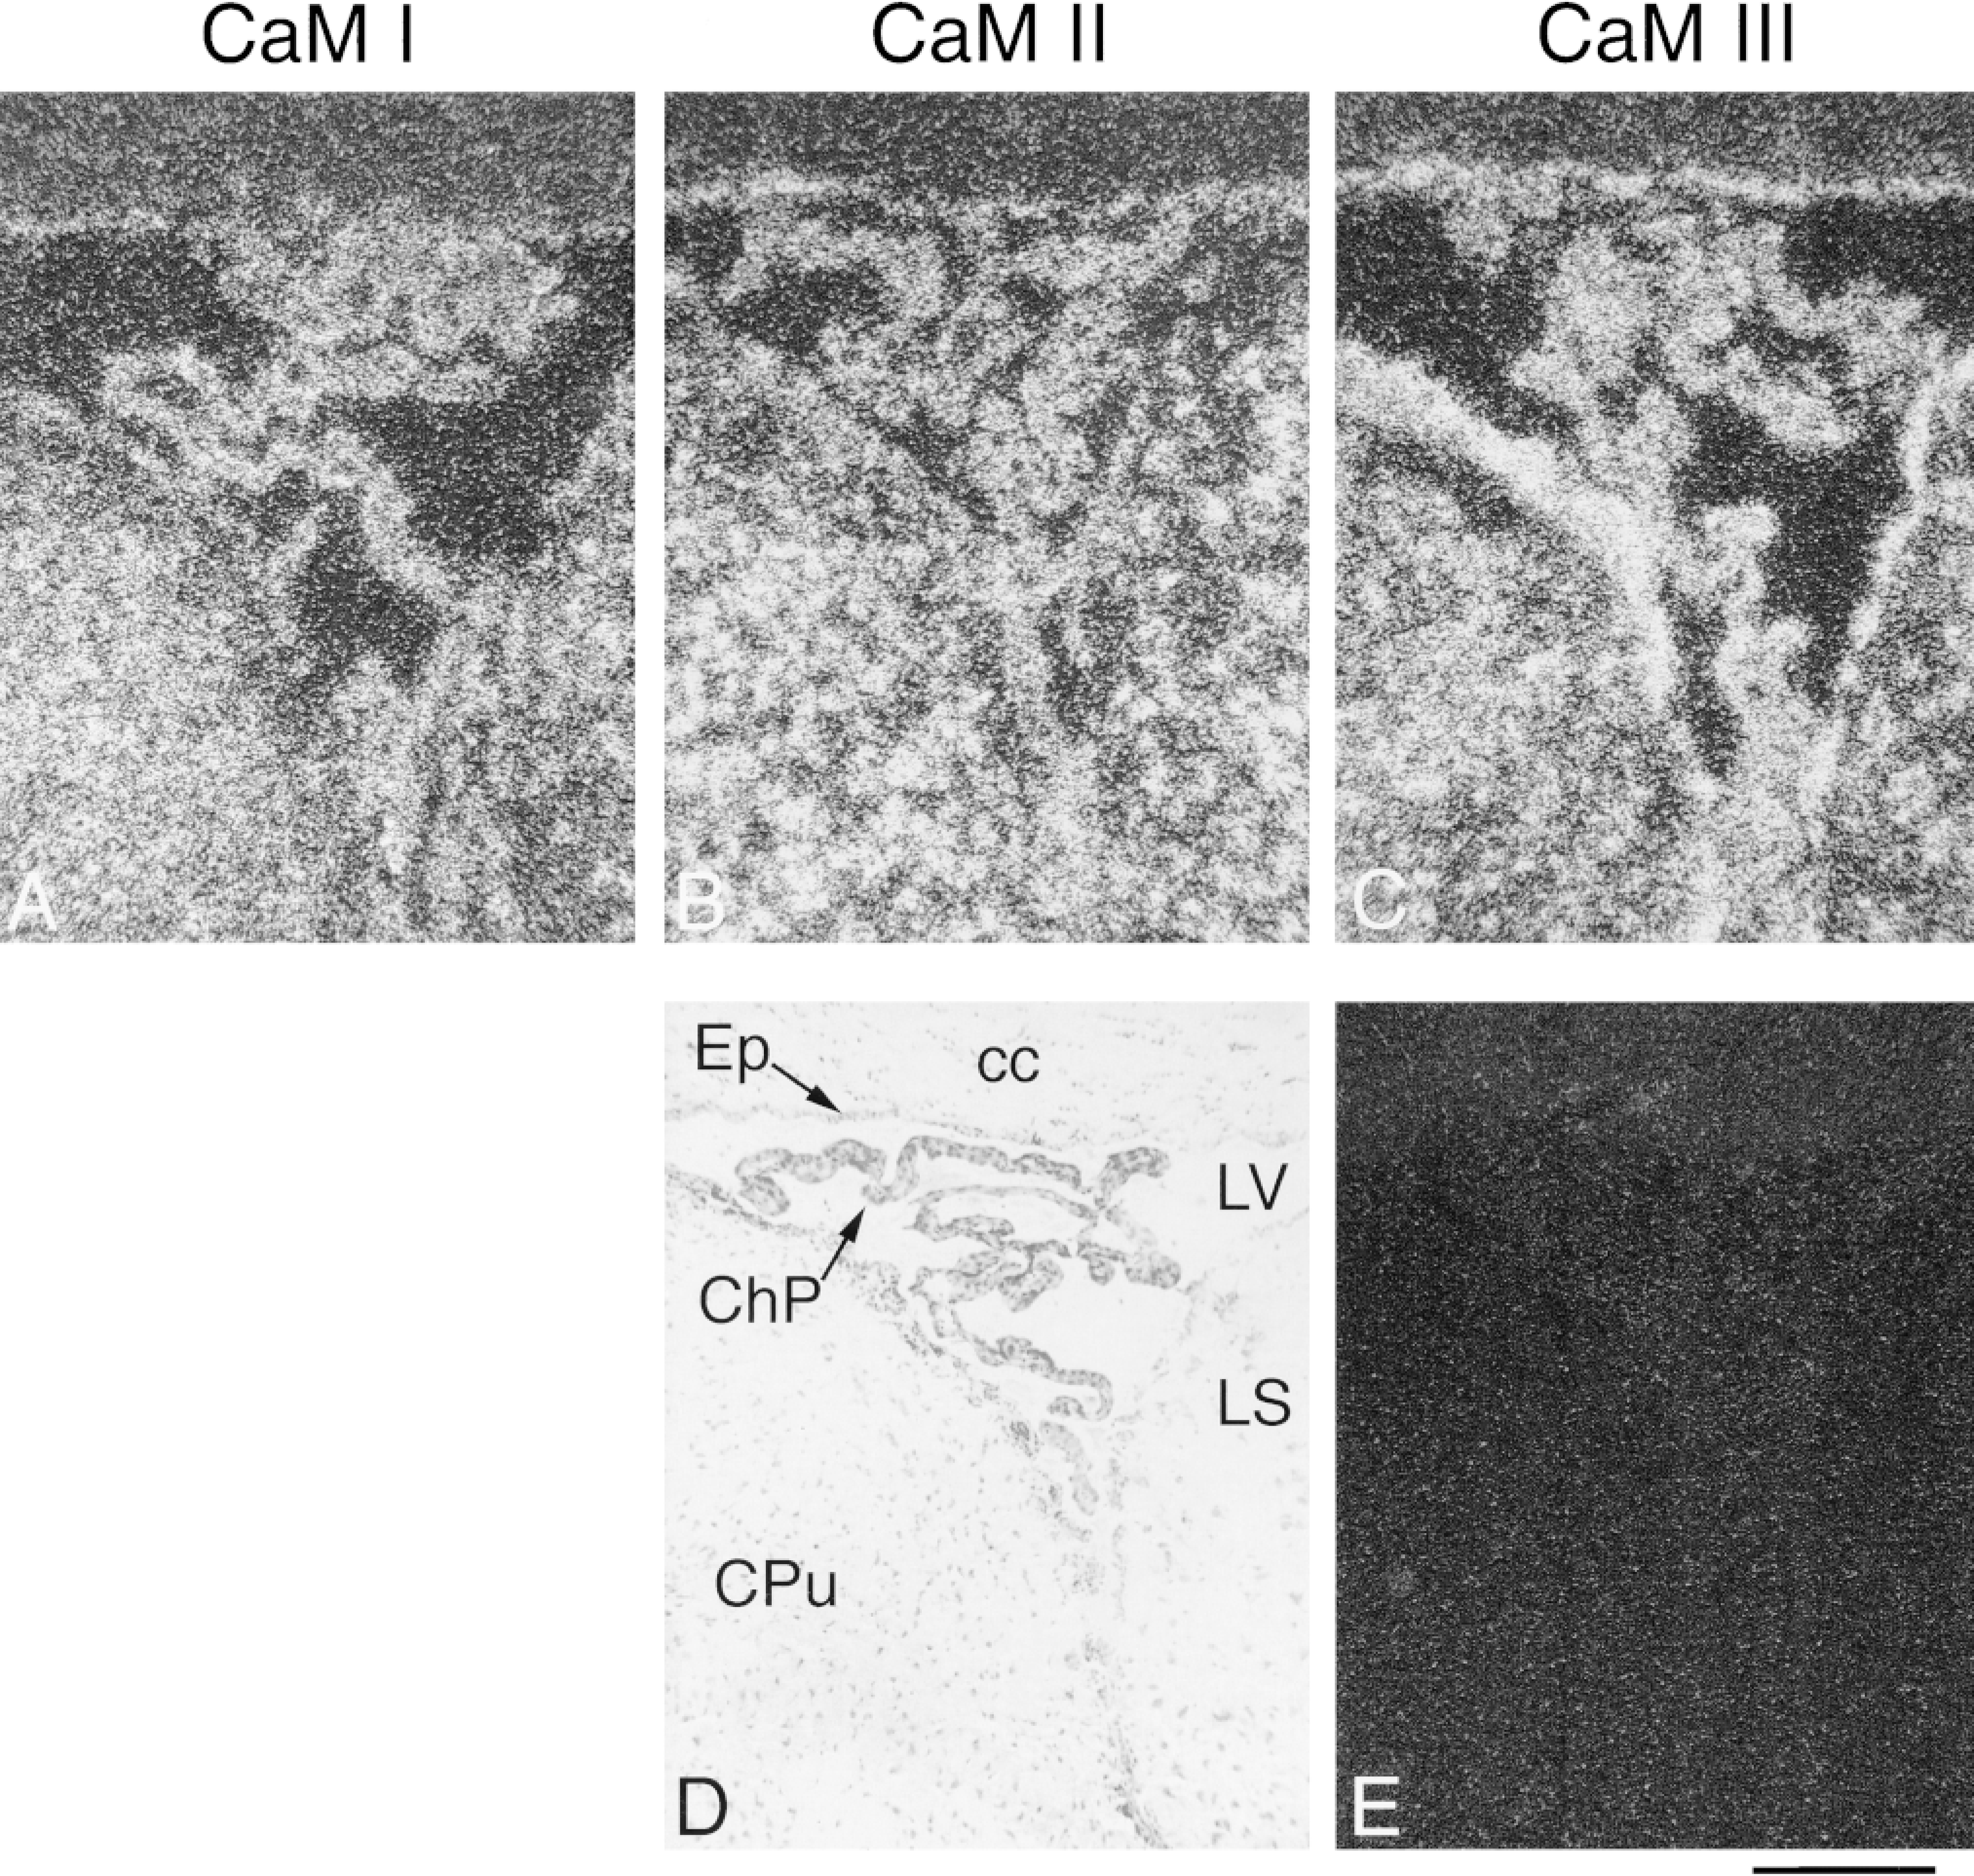
In situ hybridization analysis of CaM mRNA distribution in adult rat brain (rostral part). Coronal cryostat sections were cut at bregma 6.7 mm (A-C), 2.2 mm (D-F), 0.7 mm (G-l), and −0.4 mm (J-L) and were hybridized with antisense [35 S]-cRNA probes specific for CaM I (A,D,G,J), CaM II (B,E,H,K), or CaM III (C,F,I,L) mRNA. The figure shows positive film autoradiographs of labeled sections, where darker areas correspond to higher hybridization signals. Gr, granular cell layer of olfactory bulb; Gl, glomerular layer of olfactory bulb; Mi, mitral cell layer of olfactory bulb; ac, anterior commissure; Acb, nucleus accumbens; TT, tenia tecta; Pir, piriform cortex; Fr, frontal cortex; Cg, cingulate cortex; cc, corpus callosum; Par, parietal cortex; VDB, nucleus vertical limb, diagonal band; LS, lateral septal nuclei; CPu, caudate putamen; MPA, medial preoptic area; BST, bed nucleus of stria terminalis; HDB, nucleus horizontal limb, diagonal band. Bar = 5 mm.
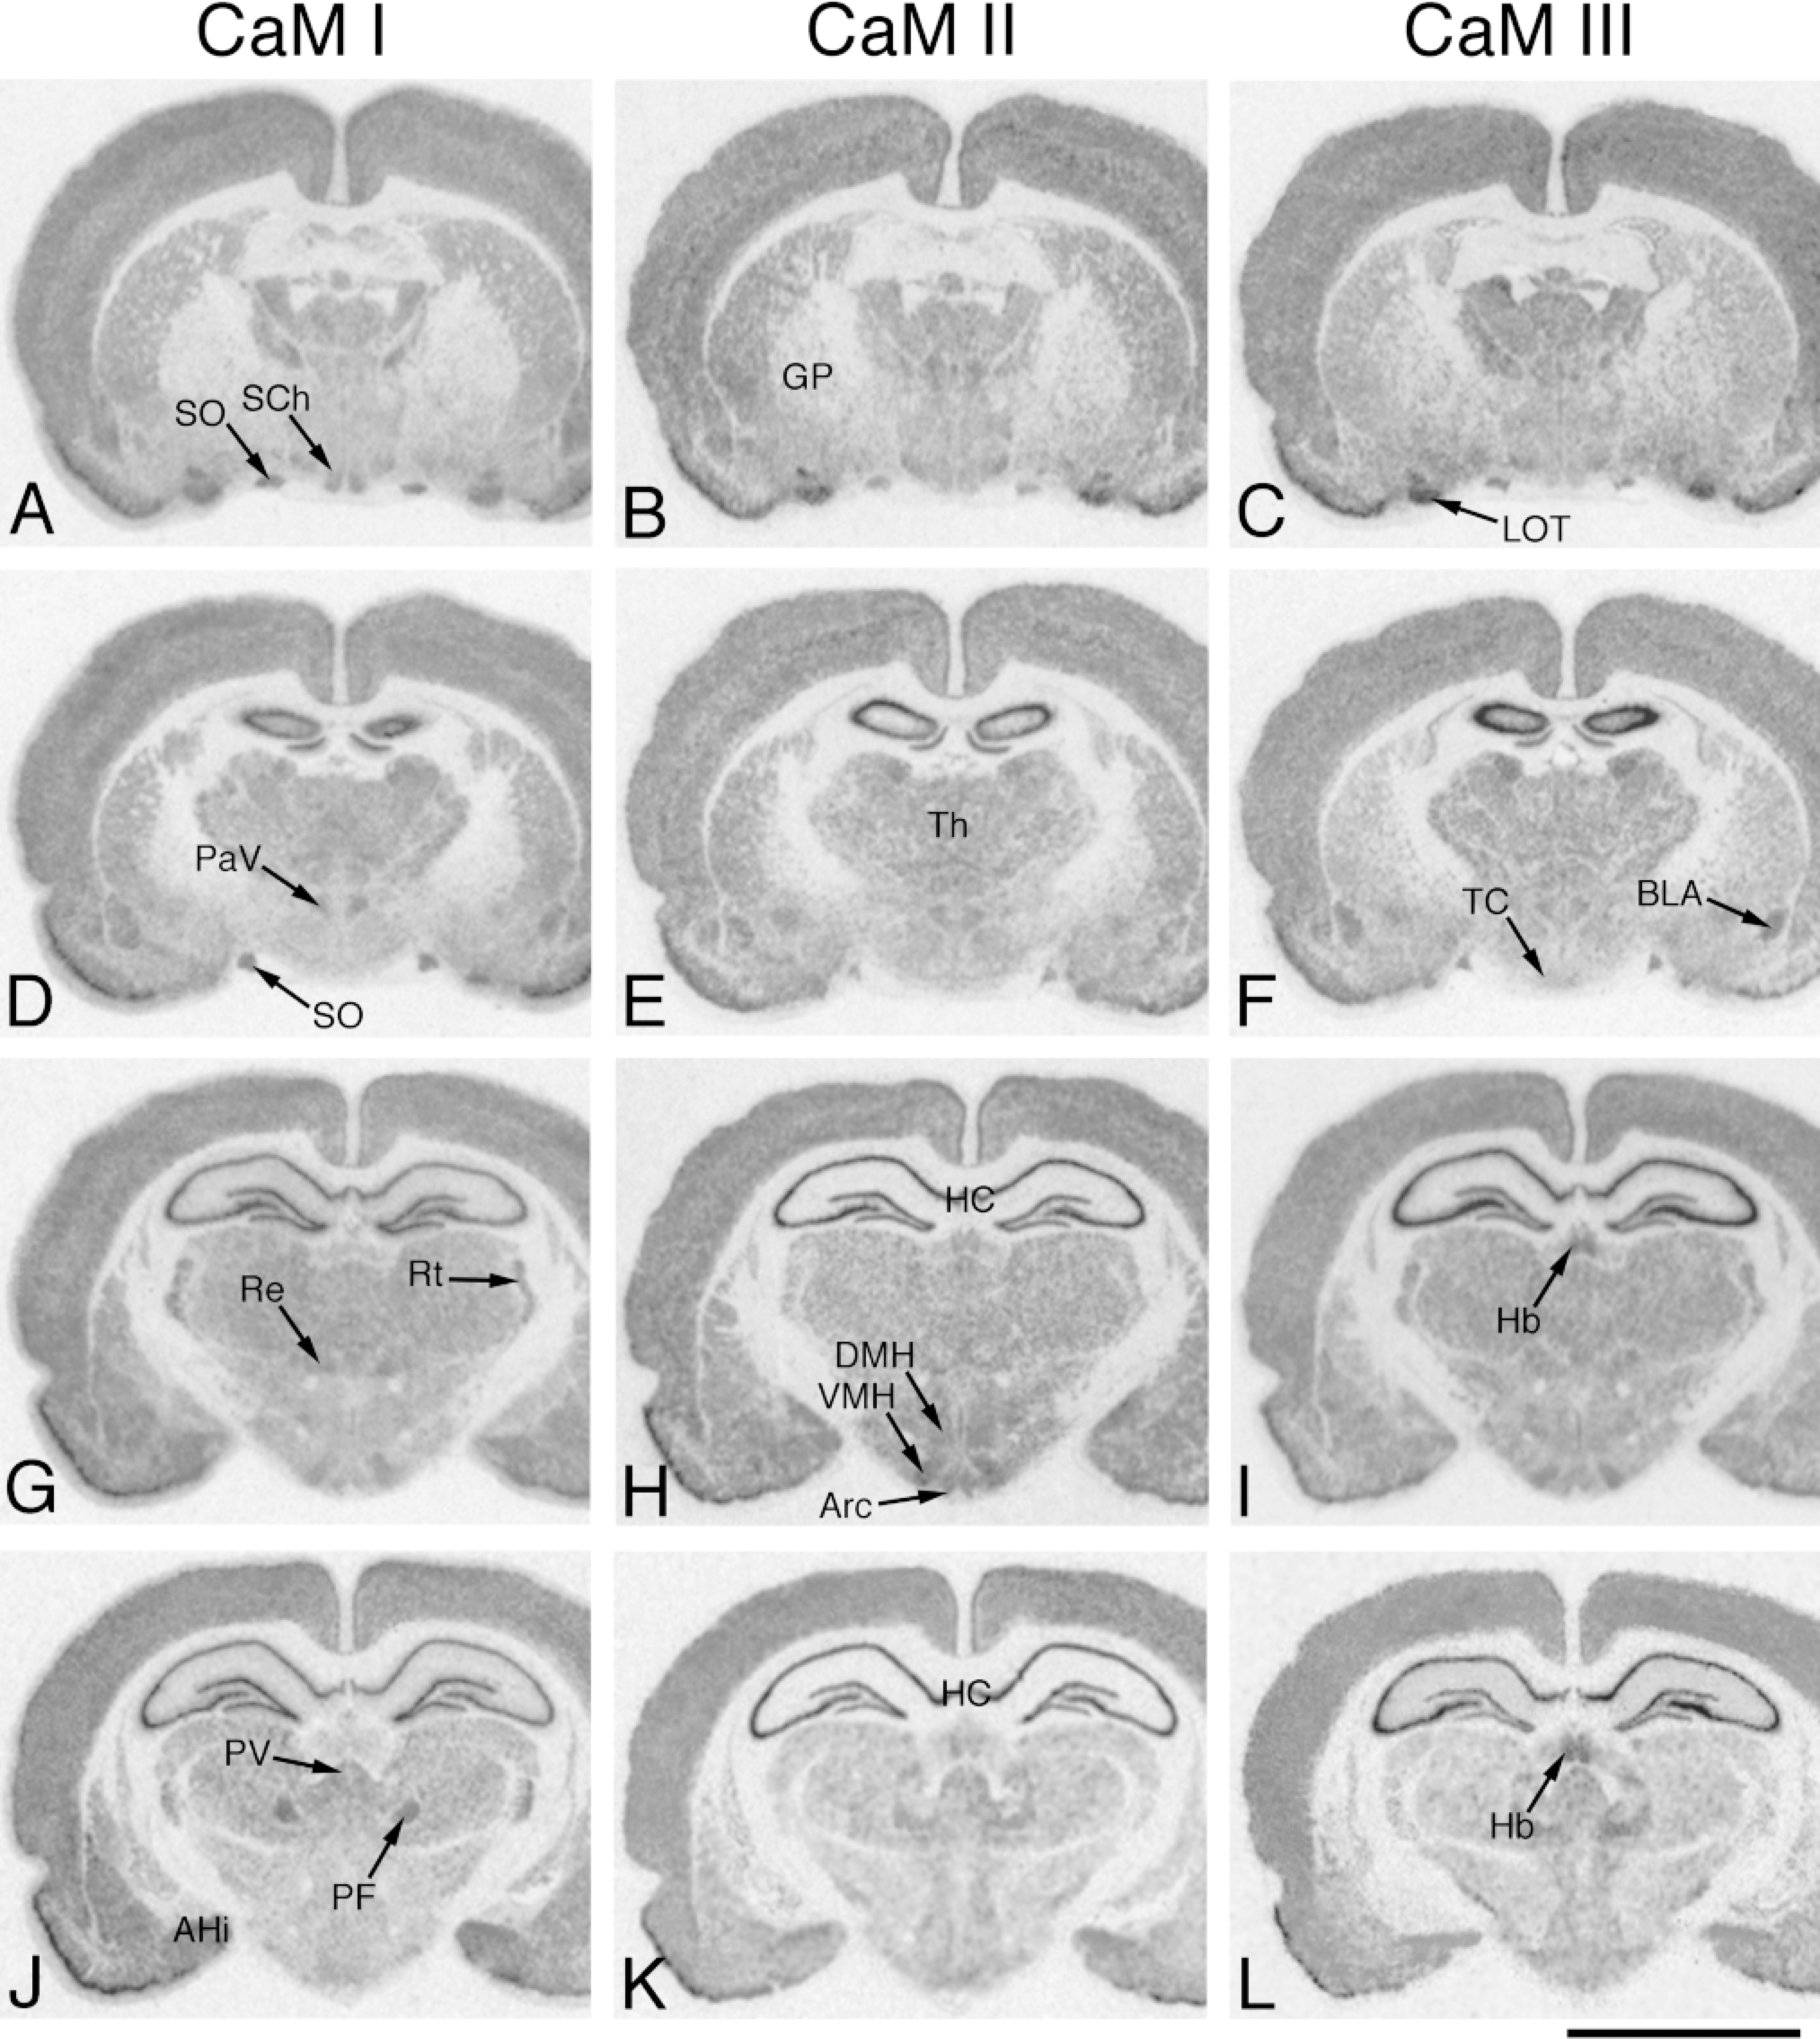
In situ hybridization analysis of CaM mRNA distribution in adult rat brain (medial part). Coronal cryostat sections were cut at bregma −1.1 mm (A-C), −2.1 mm (D-F), −3.1 mm (G-I) and −3.8 mm (J-L) and were hybridized with antisense [35 S]-cRNA probes specific for CaM I (A,D,G,J), CaM II (B,E,H,K) or CaM III (C,F,I,L) mRNA. The figure shows positive film autoradiographs of labeled sections, where darker areas correspond to higher hybridization signals. GP, globus pallidus; LOT, nucleus lateral olfactory tract; PaV, paraventricular hypothalamic nucleus; Th, thalamus; TC, tuber cinereum; BLA, basolateral amygdaloid nucleus; Re, reuniens thalamic nucleus; Rt, reticular thalamic nucleus; DMH, dorsomedial hypothalamic nucleus; VMH, ventromedial hypothalamic nucleus; Arc, arcuate hypothalamic nucleus; Hb, habenular nuclei; PV, paraventricular thalamic nucleus; PF, parafascicular thalamic nucleus; AHi, amygdalohippocampal area; HC, hippocampus; SO, supraoptic nucleus; SCh, suprachiasmatic nucleus. Bar = 5 mm.
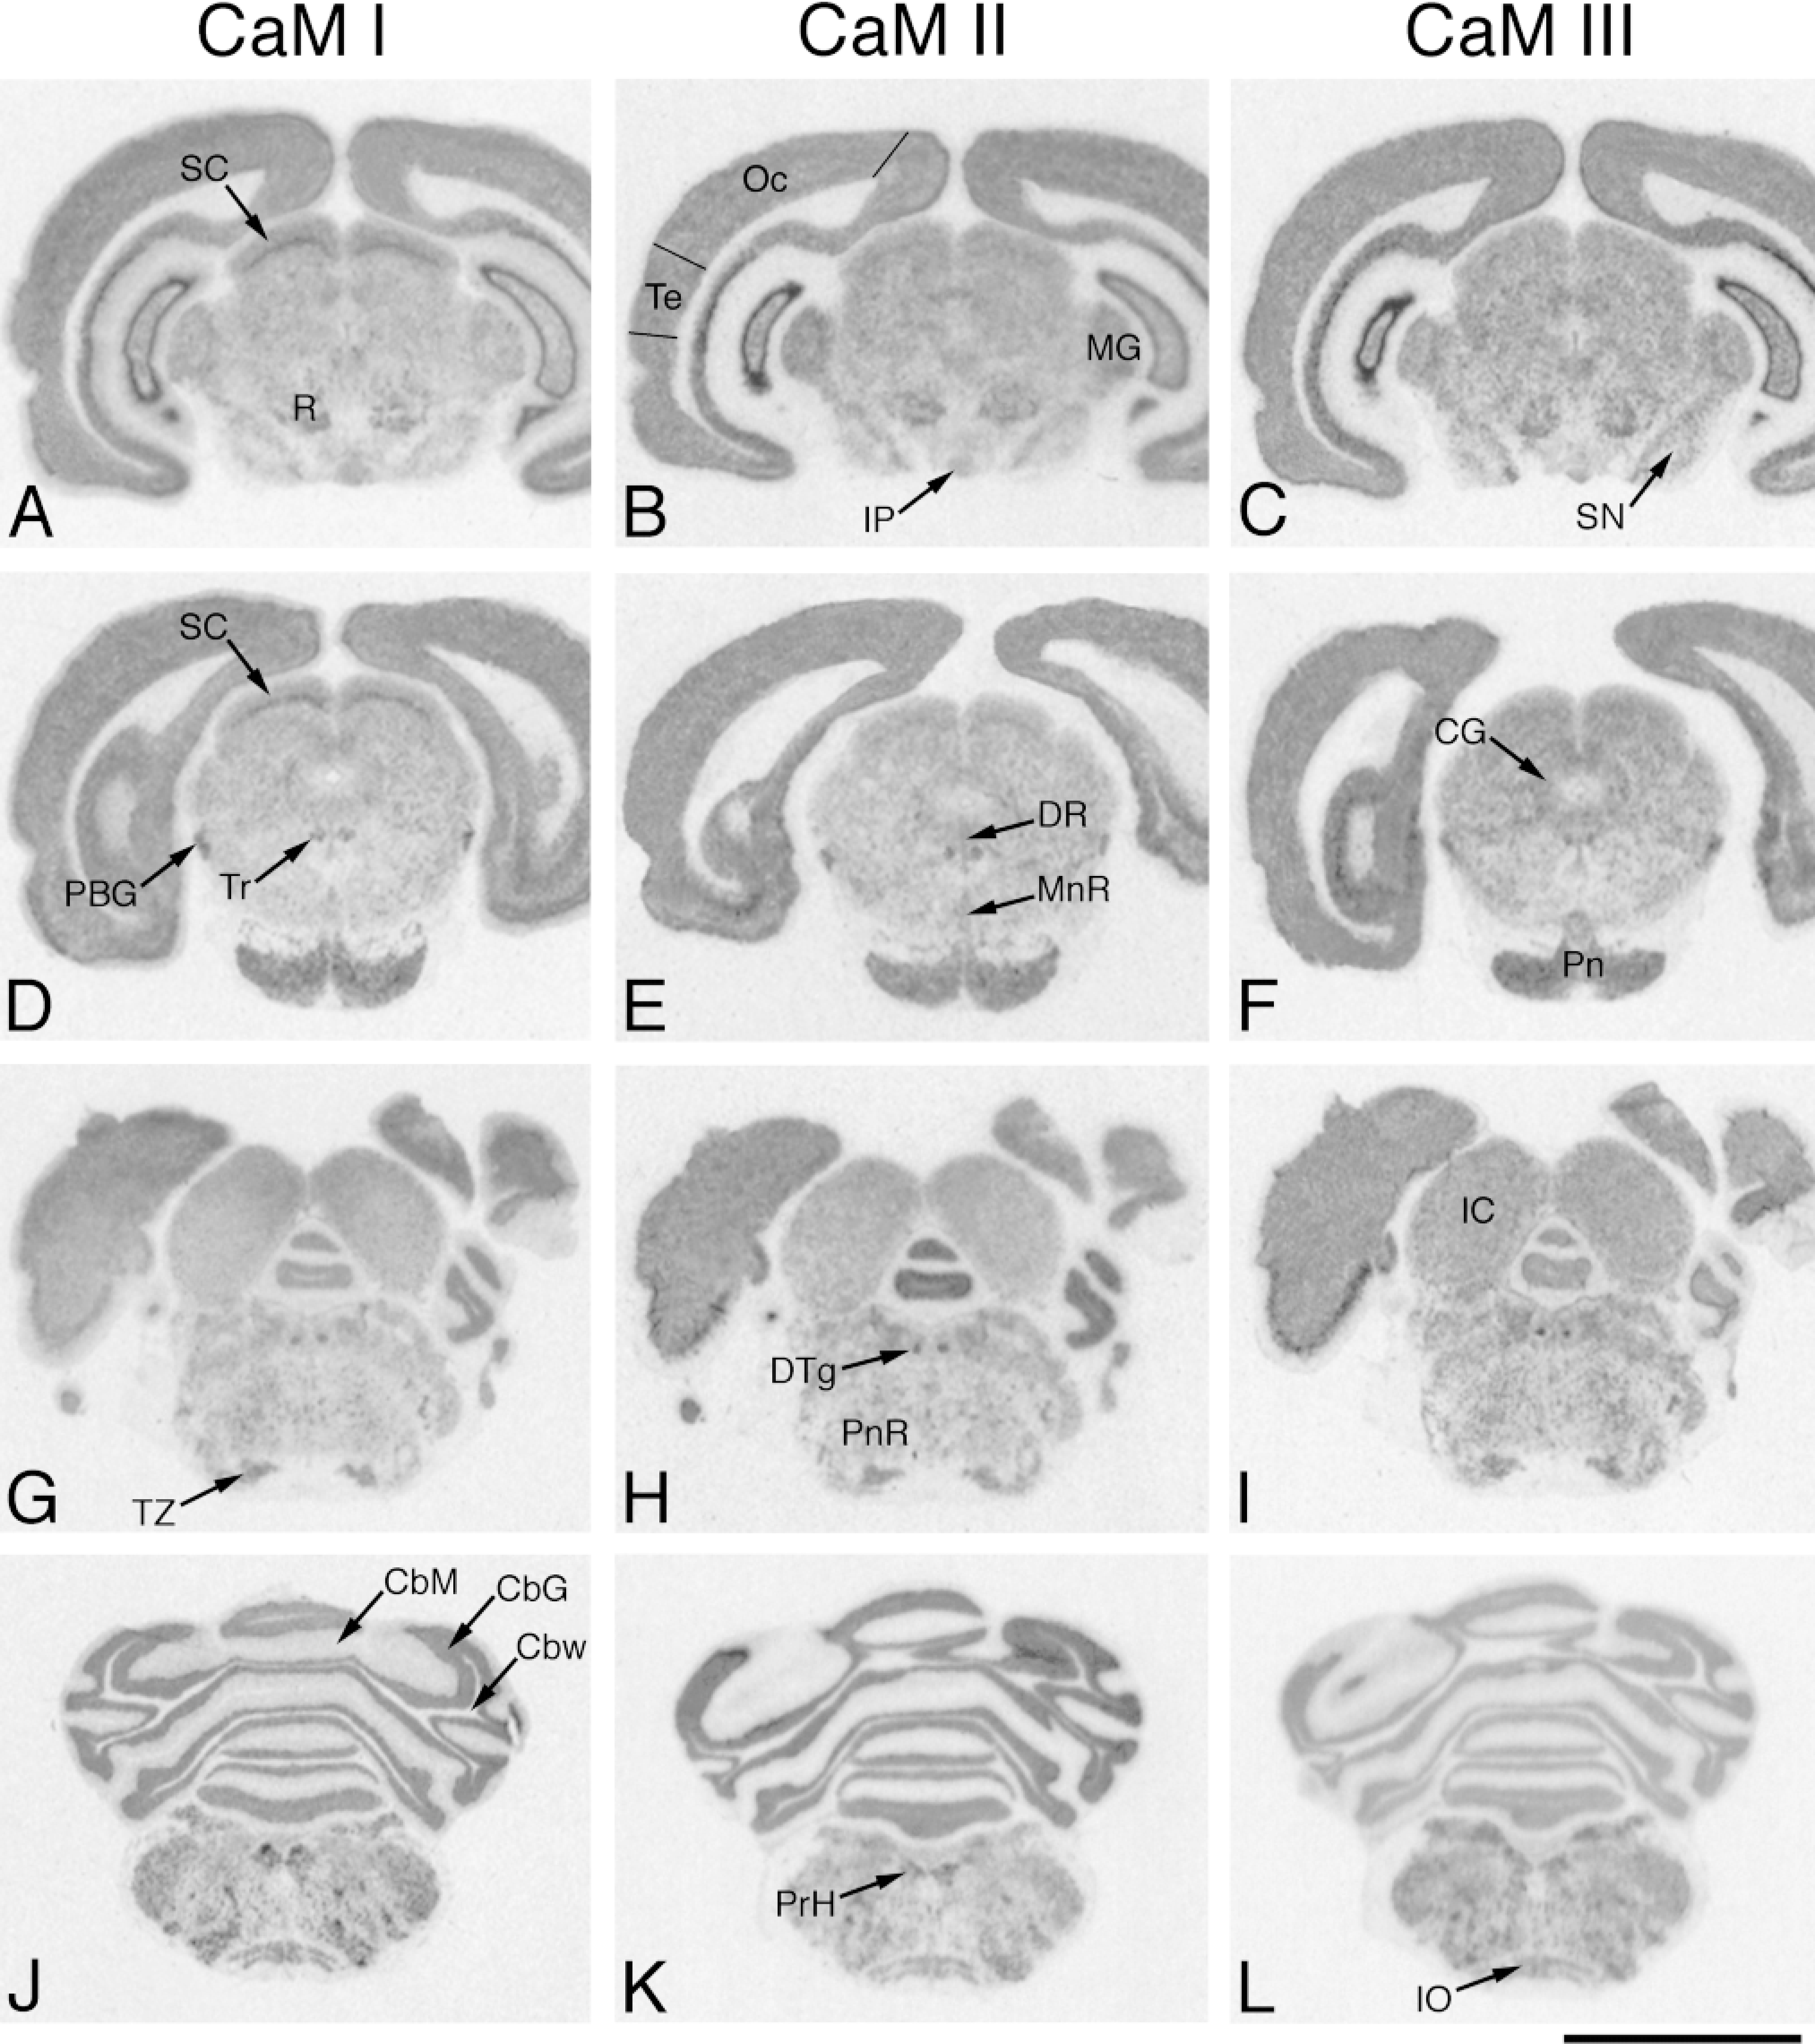
In situ hybridization analysis of CaM mRNA distribution in adult rat brain (caudal part). Coronal cryostat sections were cut at bregma −6.0 mm (A-C), −7.3 mm (D-F), −9.2 mm (G-I), and −12.3 mm (J-L) and were hybridized with antisense [35 S]-cRNA probes specific for CaM I (A,D,G,J), CaM II (B,E,H,K), or CaM III (C,F,I,L) mRNA. The figure shows positive film autoradiographs of labeled sections, where darker areas correspond to higher hybridization signals. R, red nucleus; IP, interpeduncular nucleus; MG; medial geniculate nucleus; SN, substantia nigra; SC, superior colliculus; PBG, parabigeminal nucleus; Tr; trochlear nucleus; DR, dorsal raphe nucleus; MnR, median raphe nucleus; CG, central gray; Pn, pontine nuclei; TZ, nucleus trapezoid body; DTg, dorsal tegmental nucleus; PnR, pontine reticular nucleus; IC, inferior colliculus; CbM, molecular layer, cerebellar cortex; CbG, granular layer, cerebellar cortex; Cbw, white matter, cerebellar cortex; PrH, prepositus hypoglossal nucleus; IO, inferior olive; Te, temporal cortex; Oc, occipital cortex. Bar = 5 mm.
Distribution of CaM mRNAs in the rat brain (copy no. ± SD) a
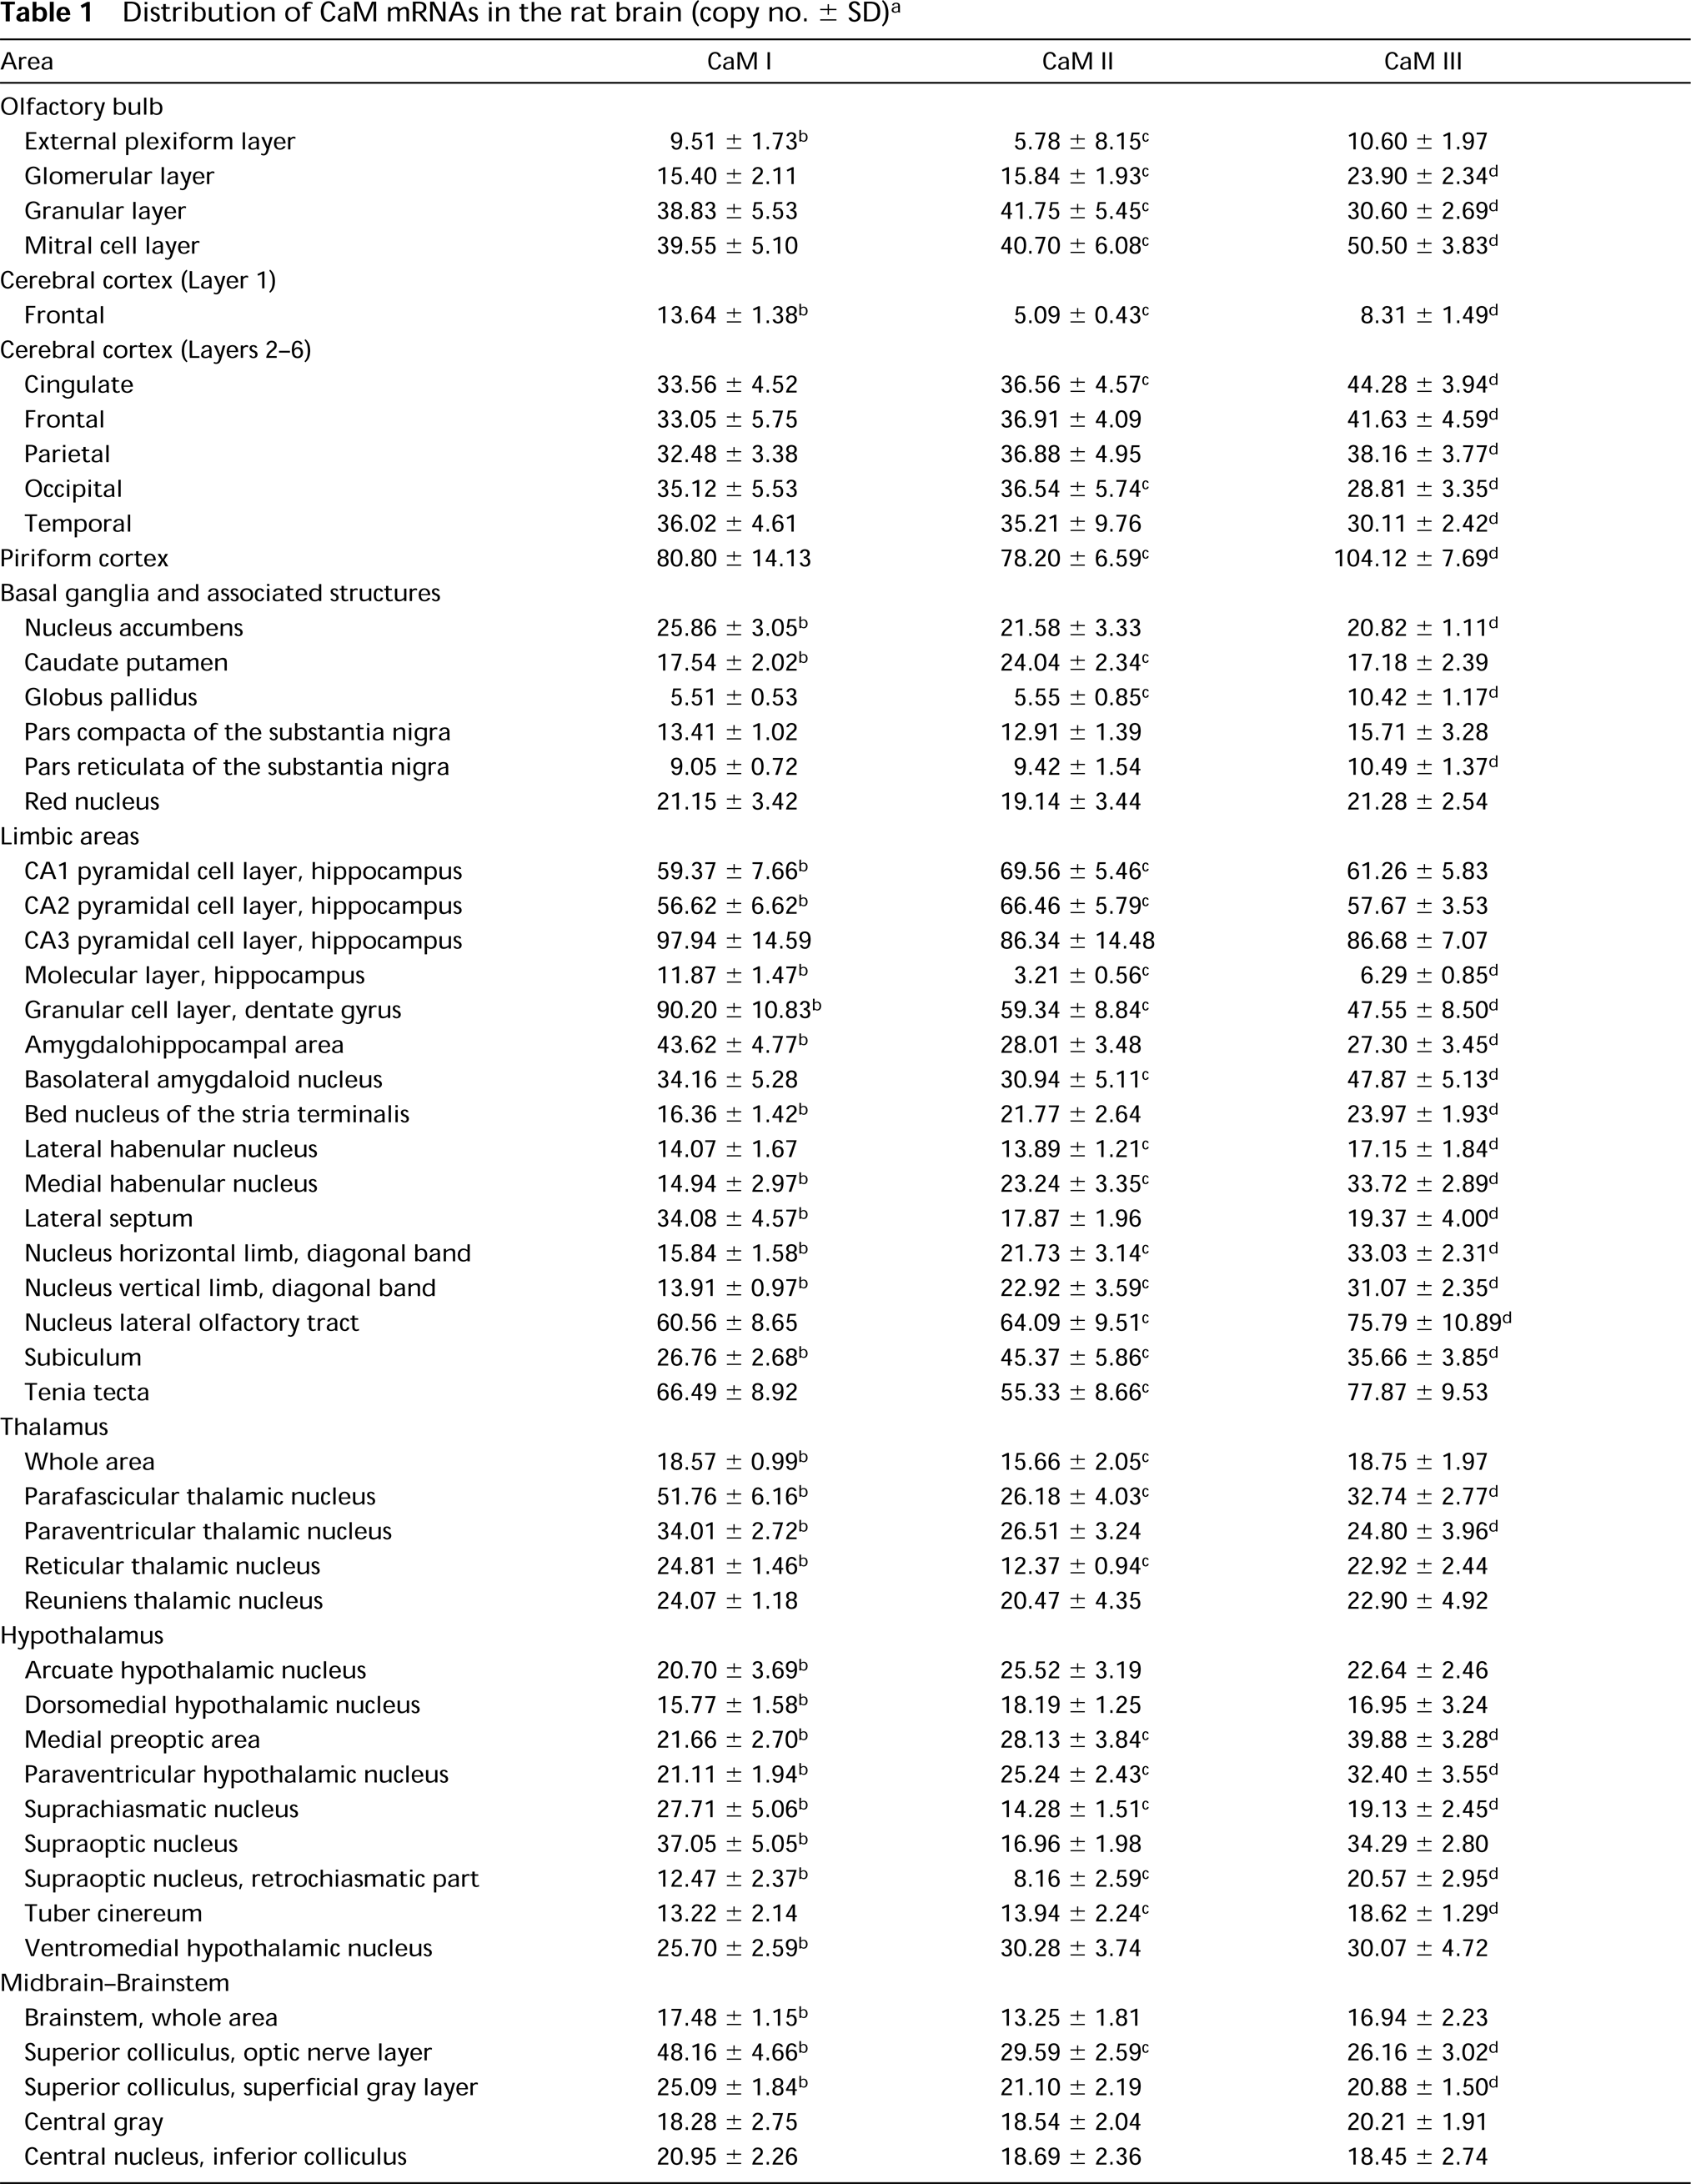
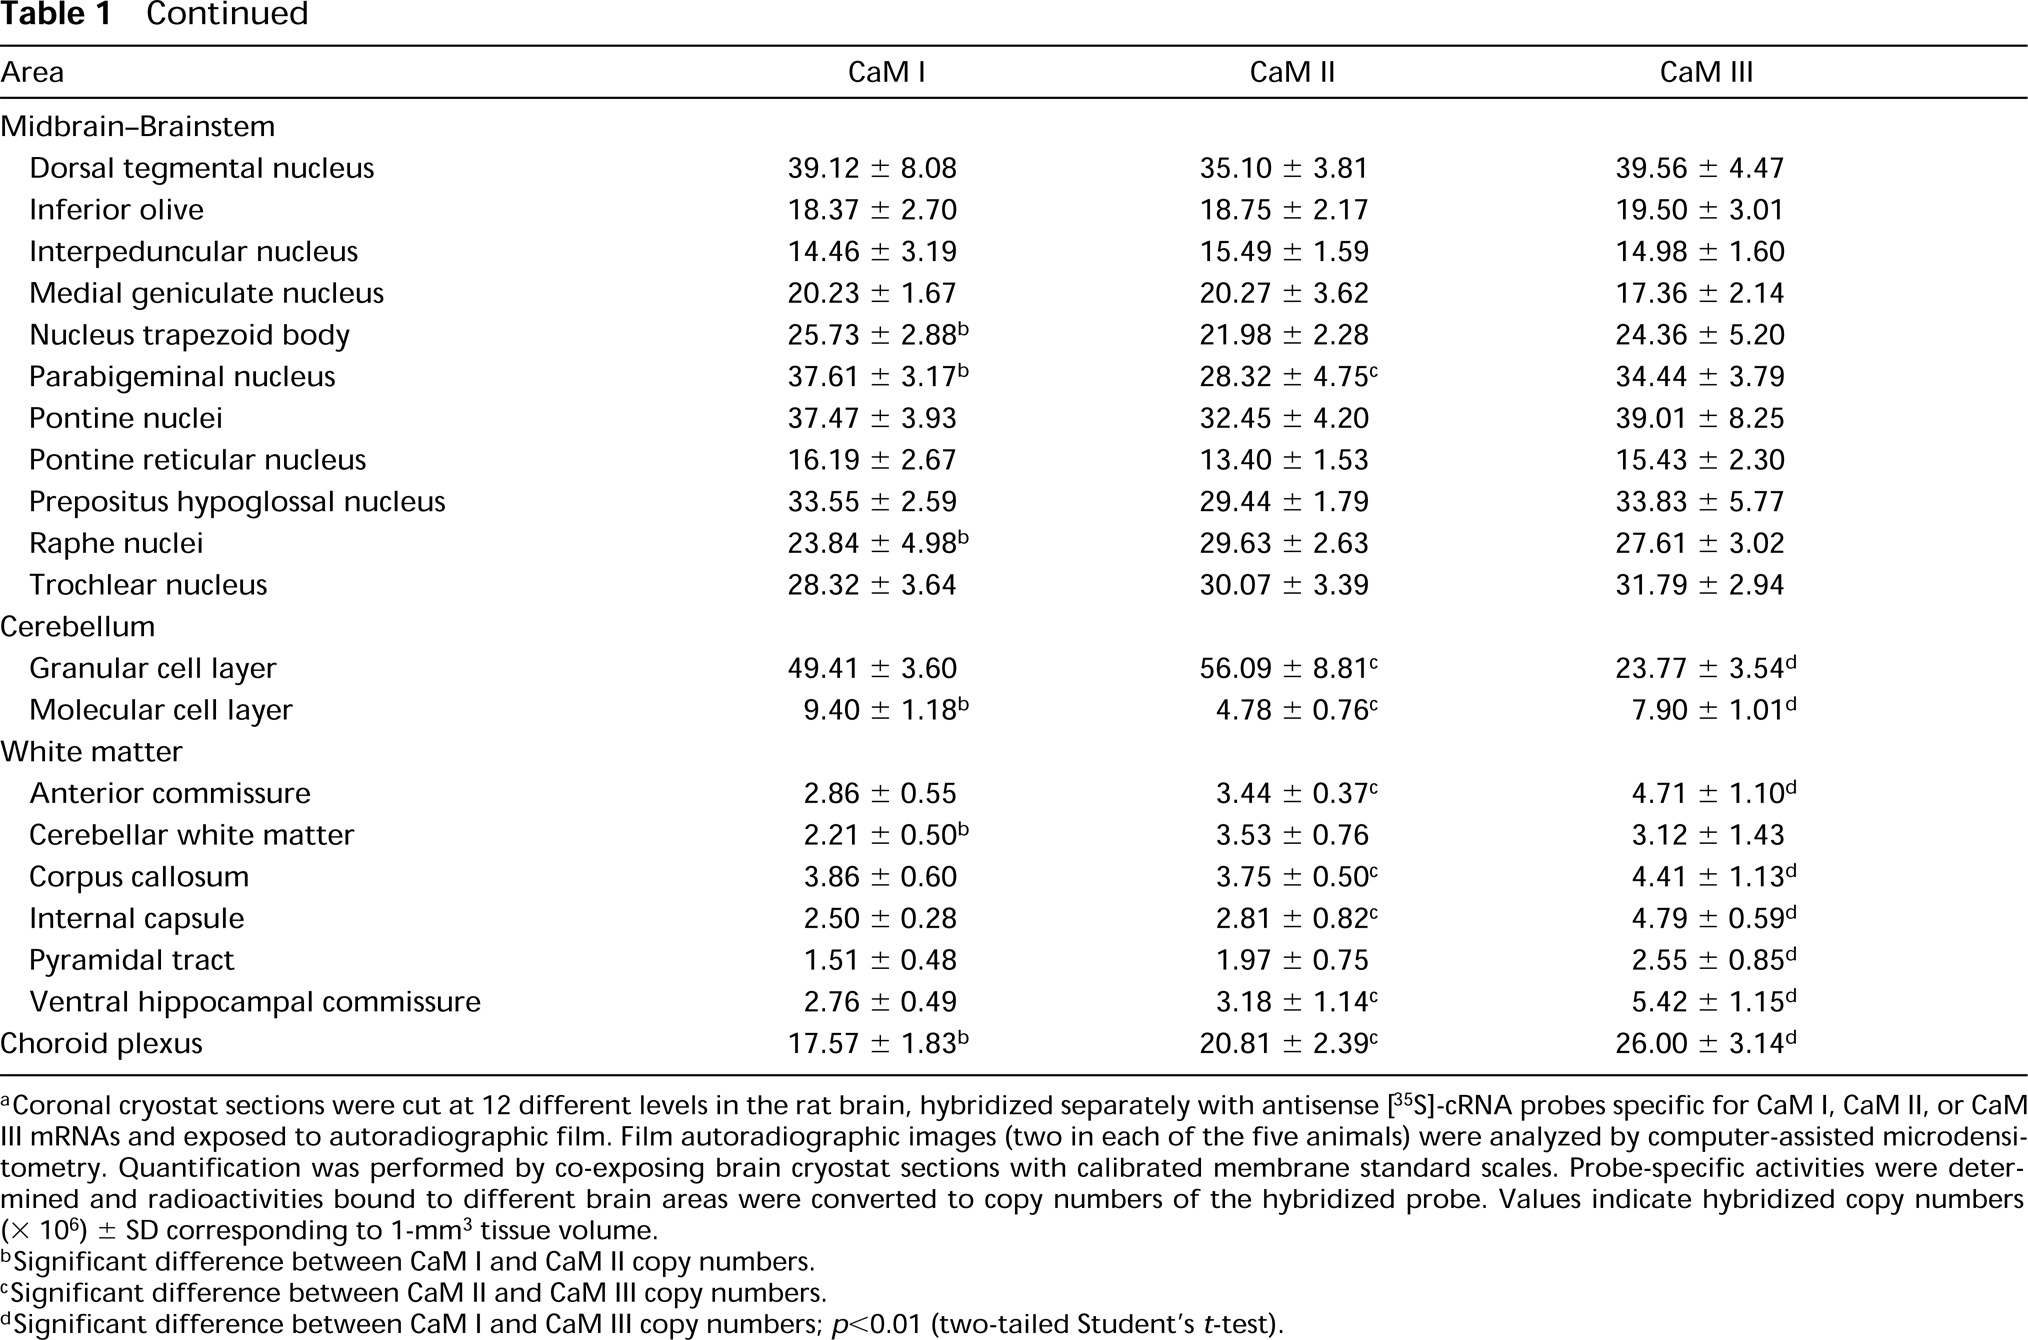
Coronal cryostat sections were cut at 12 different levels in the rat brain, hybridized separately with antisense [35 S]-cRNA probes specific for CaM I, CaM II, or CaM III mRNAs and exposed to autoradiographic film. Film autoradiographic images (two in each of the five animals) were analyzed by computer-assisted microdensitometry. Quantification was performed by co-exposing brain cryostat sections with calibrated membrane standard scales. Probe-specific activities were determined and radioactivities bound to different brain areas were converted to copy numbers of the hybridized probe. Values indicate hybridized copy numbers (x 106) ± SD corresponding to 1-mm3 tissue volume.
Significant difference between CaM I and CaM II copy numbers.
Significant difference between CaM II and CaM III copy numbers.
Significant difference between CaM I and CaM III copy numbers; p<0.01 (two-tailed Student's t-test).
Olfactory Bulb
The CaM genes exhibited a differential expression pattern and a relatively high mRNA occurrence in this region (Figures 2A-2C; Table 1). The CaM mRNAs were generally relatively abundant in the granular and mitral cell layers. The CaM I and CaM II mRNA contents of these areas were similar, but the CaM III mRNA levels were higher in the mitral cell layer and lower in the granular layer (Figures 5A-5C). The glomerular layer had lower hybridization levels; similar mRNA copy numbers were detected for CaM I and II but a significantly higher copy number for CaM III. The lowest mRNA levels in the bulb were measured in the external plexiform layer, where the majority of the transcripts were derived from the CaM I and III genes. Diffuse labeling, and also patchy labeling clearly corresponding to cell bodies, was evident for all CaM mRNAs.
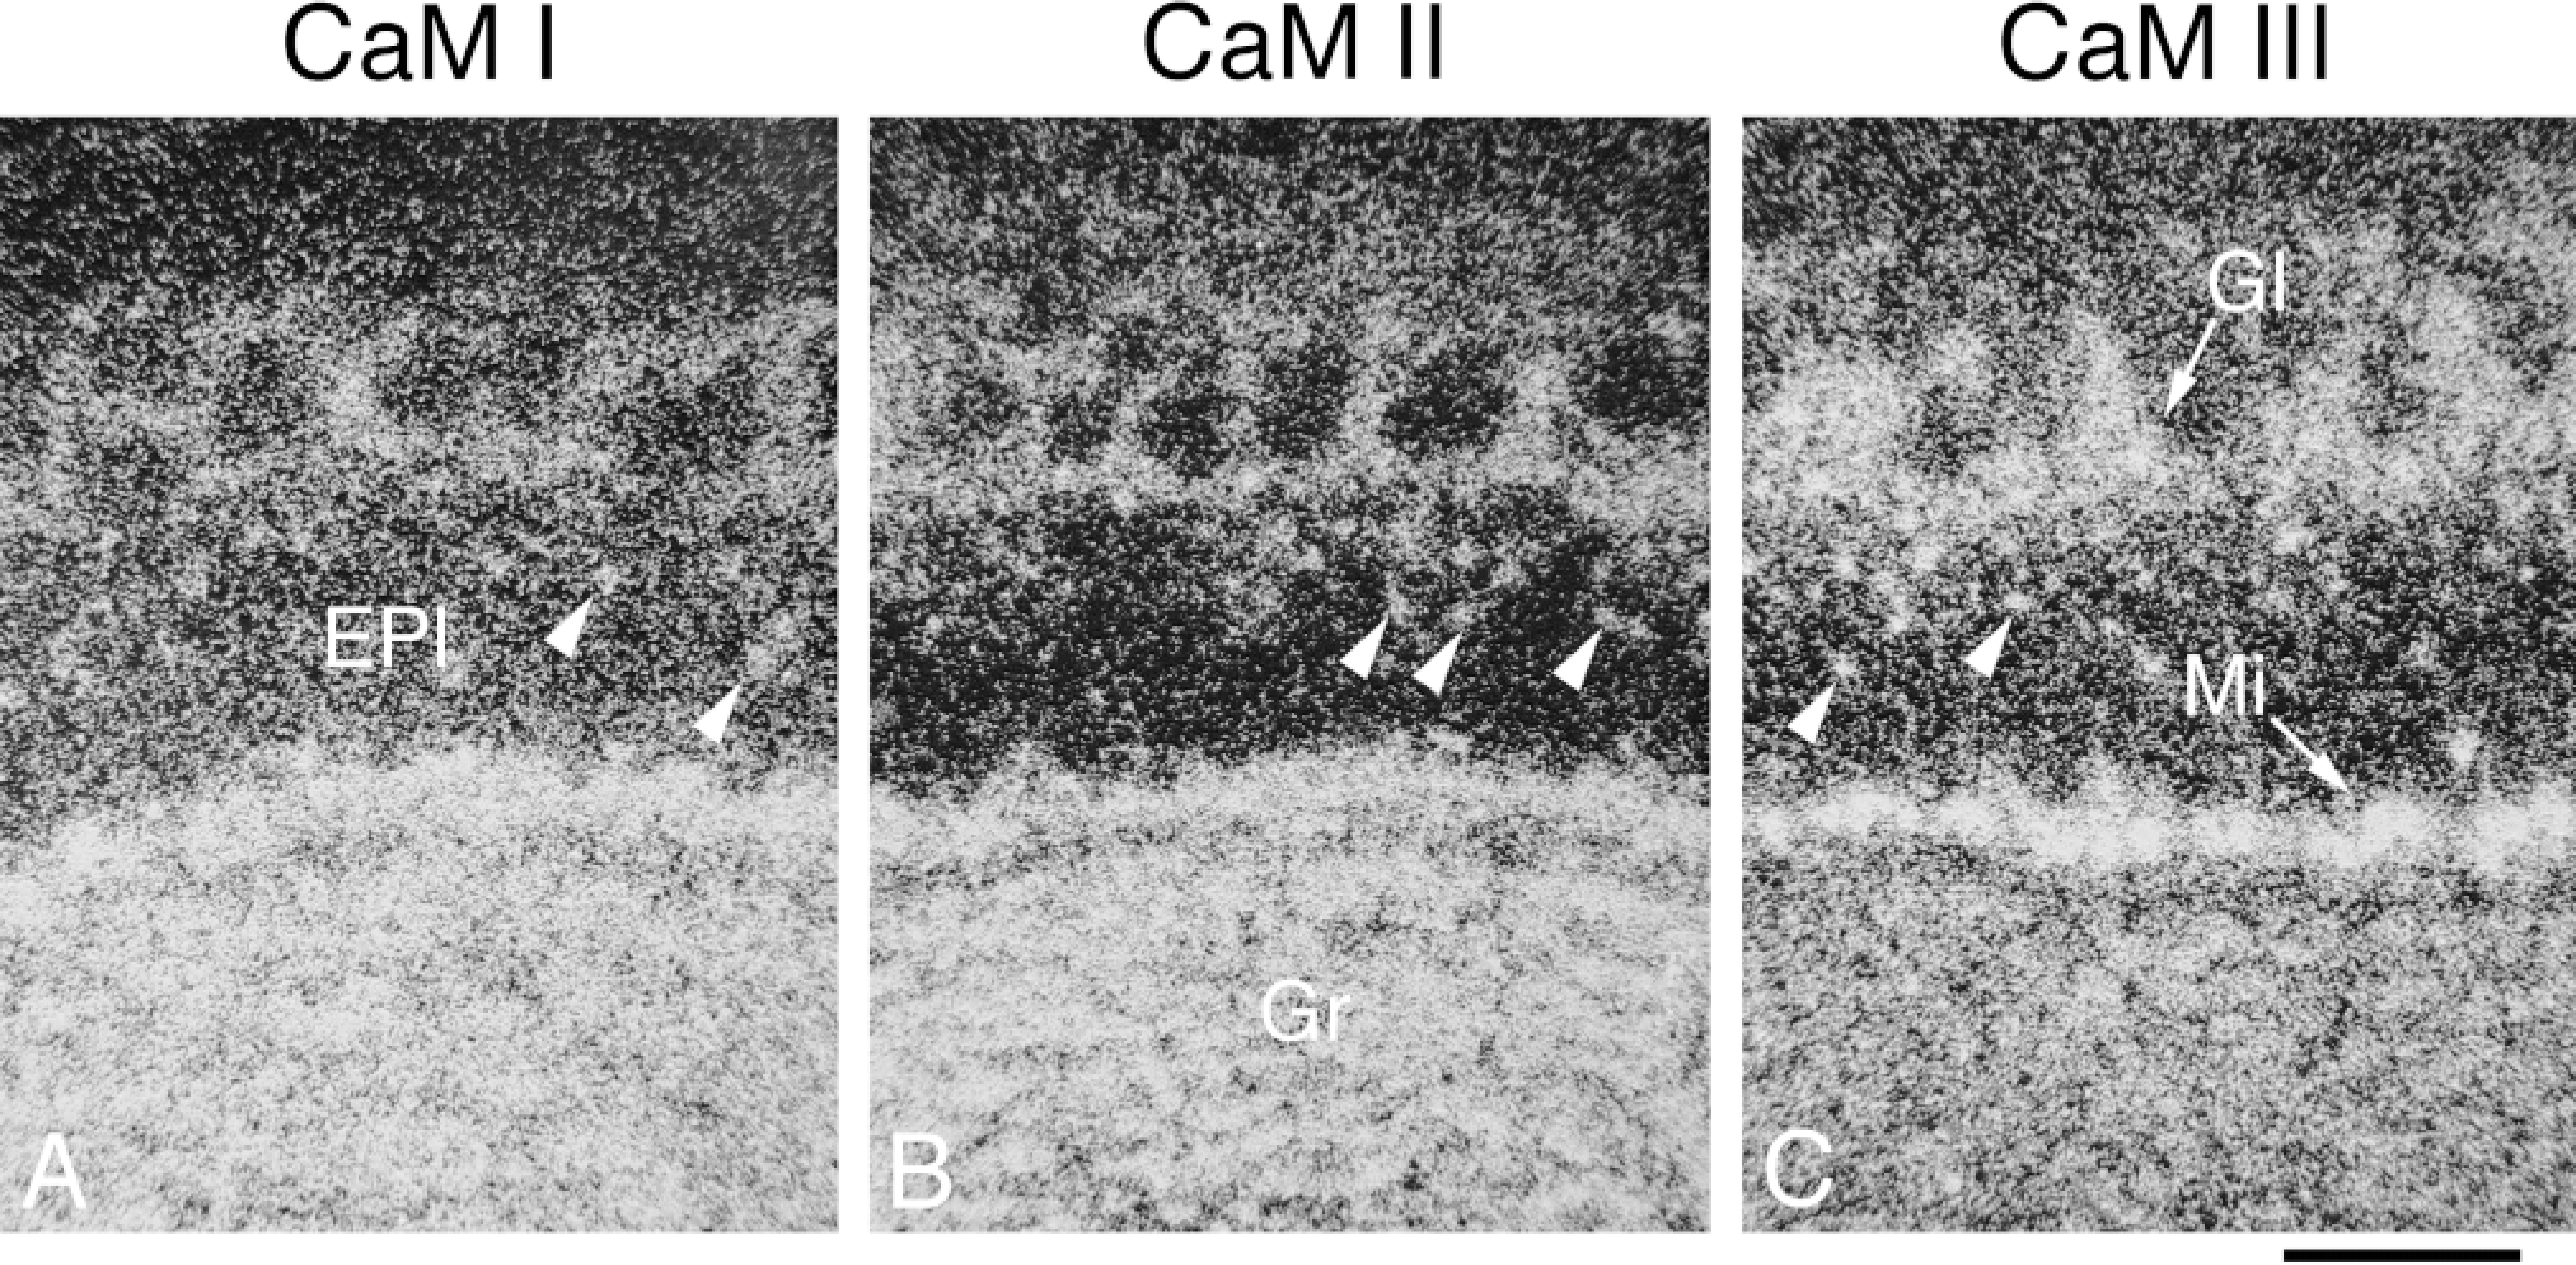
Distribution and cellular localization of CaM mRNAs in adult rat olfactory bulb. Coronal cryostat sections were cut at bregma −6.0 mm and were hybridized with antisense [35 S]-cRNA probes specific for CaM I (A), CaM II (B), or CaM III (C) mRNA. The figure shows darkfield emulsion autoradiographs of labeled sections, where brighter areas correspond to higher hybridization signals. Arrowheads indicate labeling corresponding to cell bodies present in the external plexiform layer. EPI, external plexiform layer, olfactory bulb; Gr, granular cell layer, olfactory bulb; GI, glomerular layer, olfactory bulb; Mi, mitral cell layer, olfactory bulb. Bar = 200 μm.
Cerebral Cortex
The expression of the CaM genes was relatively strong in layers 2-6 of the cerebral cortex (Figures 2D-2L, Figures 3A-3L, Figures 4A-4I, and Figures 6A-6C; Table 1), but low in Layer 1. In Layers 2-6, higher mRNA levels were observed for CaM III in the cingulate, frontal, and parietal cortices (38.2-44.3 × 10⁶ /mm3), but somewhat lower levels in the occipital and temporal cortices (28.8-30.1 × 10⁶ /mm3) compared with the CaM I and II copy numbers (32.5-36.9 × 10⁶ /mm3). The strongest labeling of the pyramidal cells of Layer 5 in the forelimb and hindlimb areas was more evident for CaM II and III mRNAs (Figures 6A-6C). The CaM II labeling was mainly associated with cell bodies, whereas the CaM I and III labeling was more diffuse, corresponding not only to perikarya but also to the surrounding neuropil areas (Figures 6D-6F). Diffuse labeling was likewise evident in Layer 1 of all cortical regions, where considerable differences were determined (CaM II < CaM III < CaM I; Figures 6D-6F). Very strong expression was observed for all CaM genes (CaM I, 82.8 × 10⁶ /mm3 ã CaM II, 81.3 × 10⁶ /mm3 Ĩ CaM III, 108.4 × 10⁶ /mm3) in the piriform cortex (Figures 2D-2L and Figures 3A-3L).
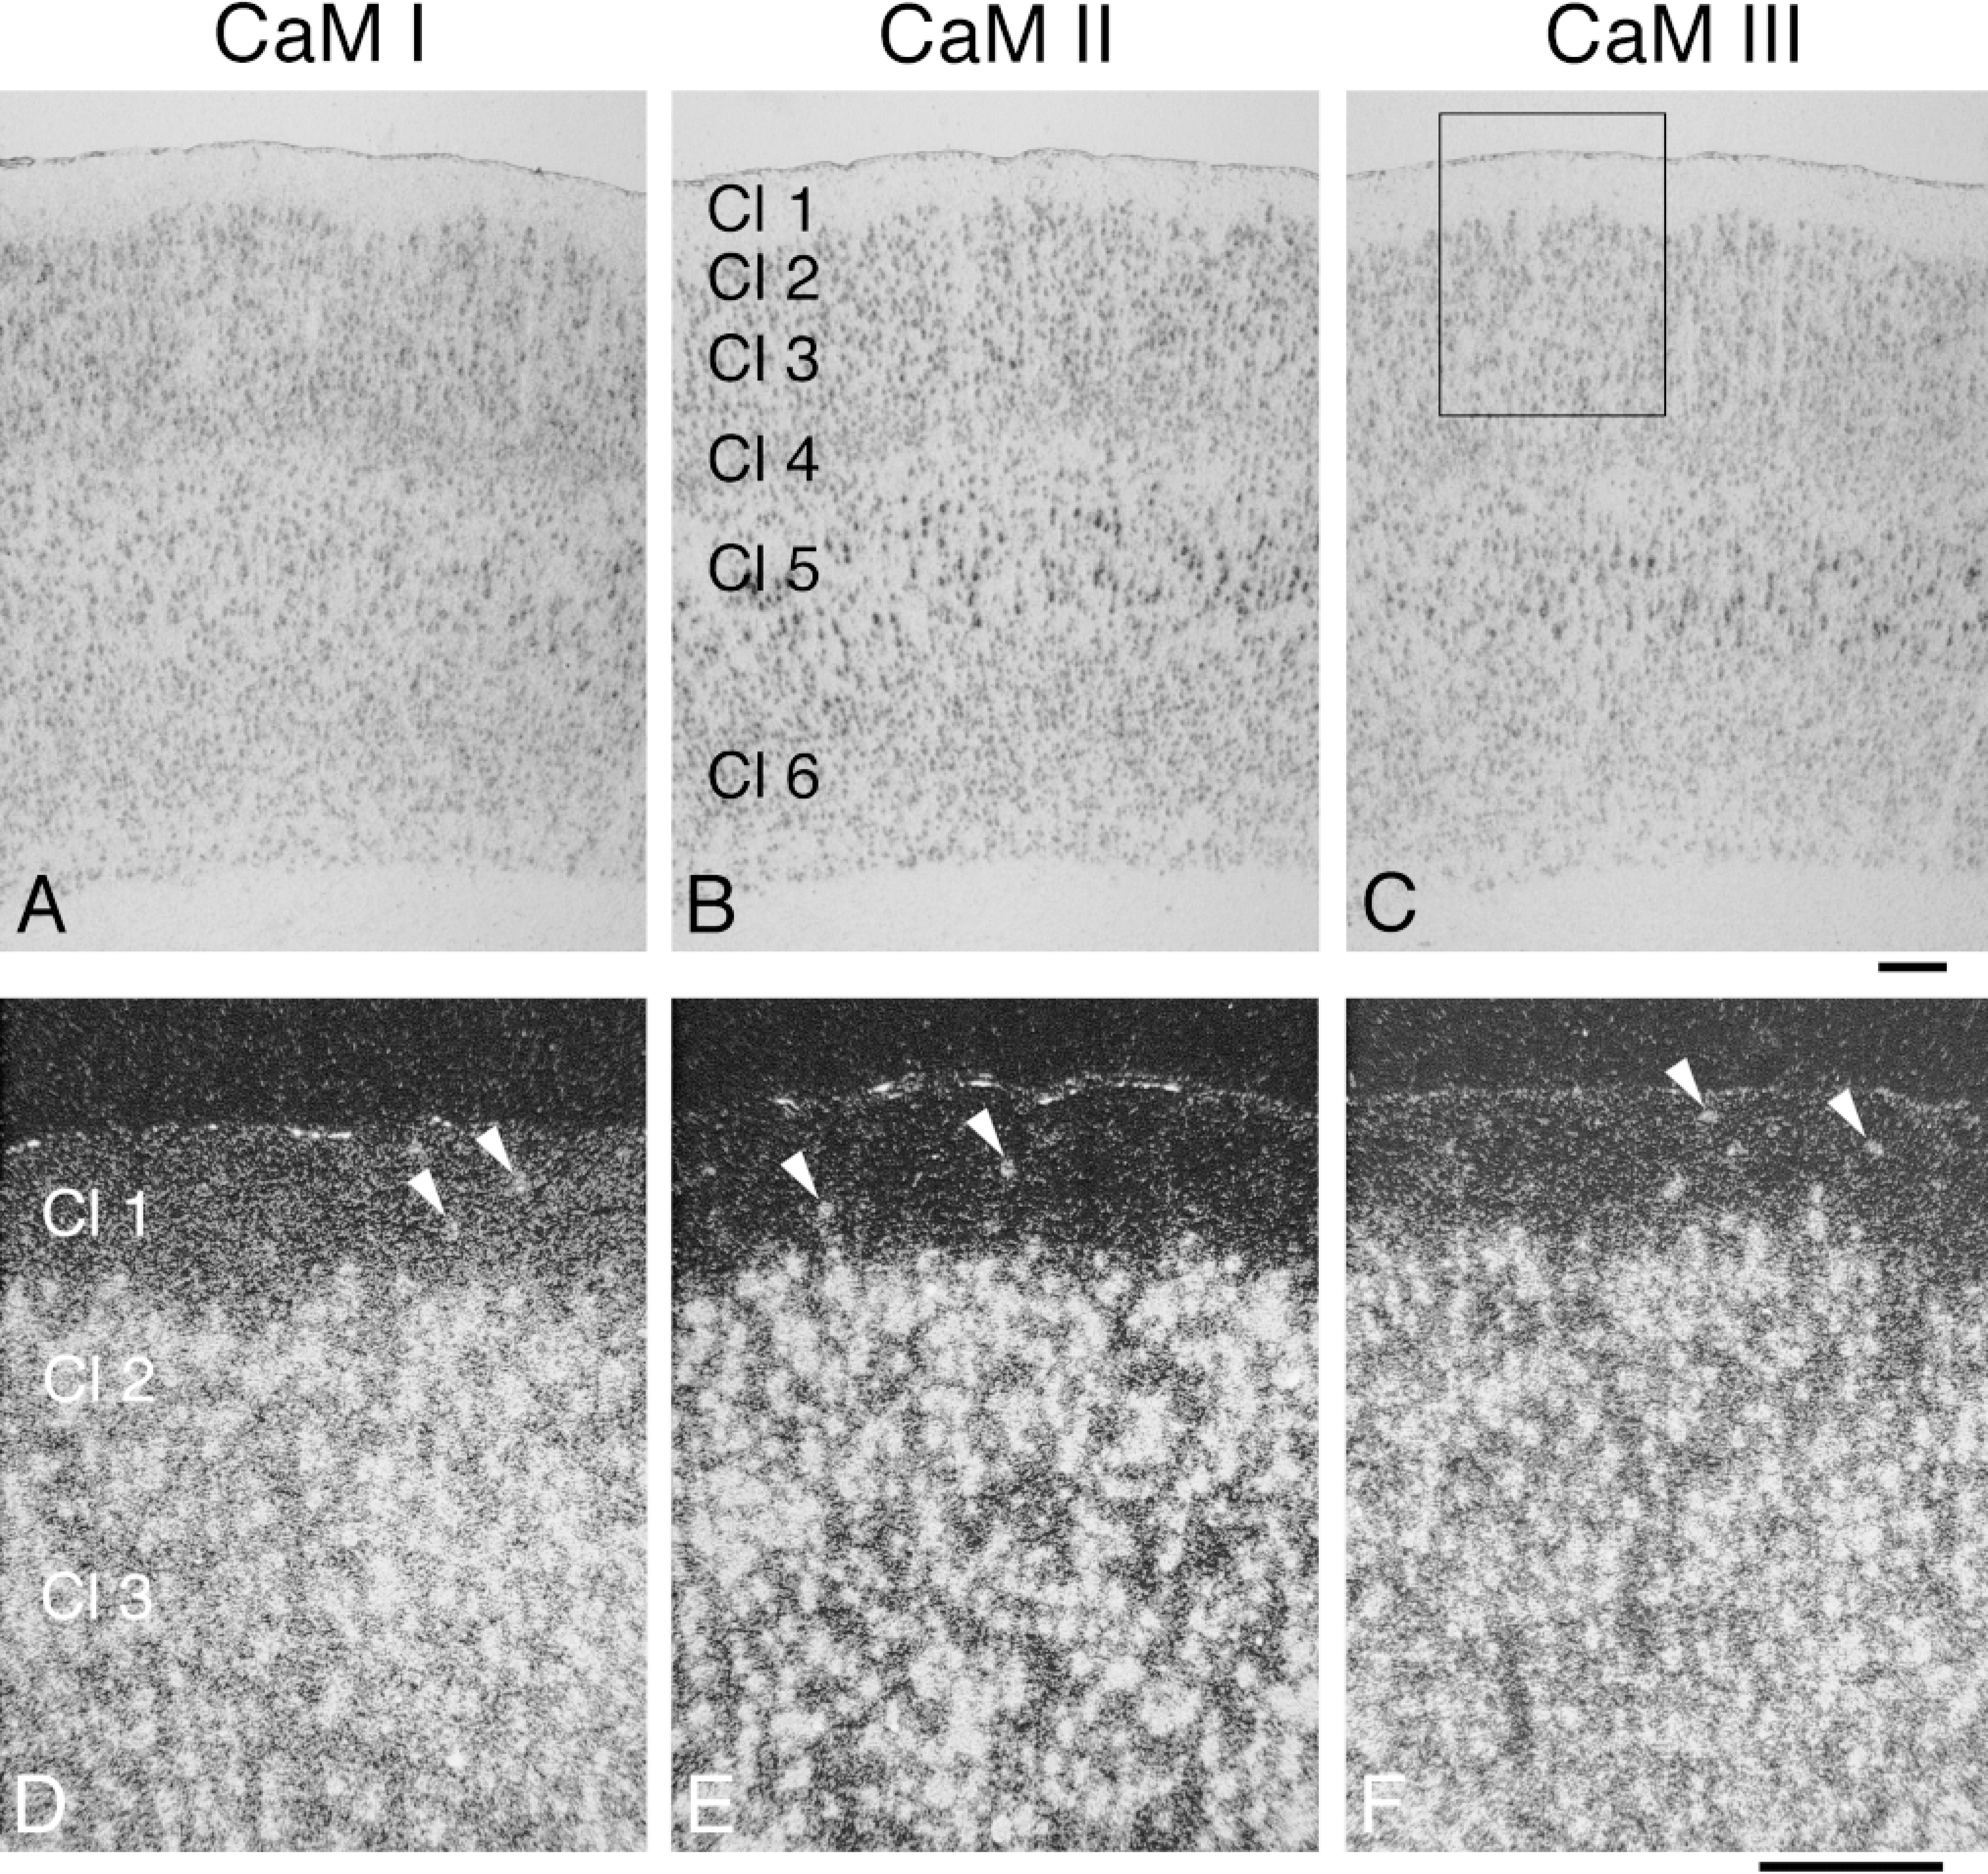
Distribution and cellular localization of CaM mRNAs in adult rat frontal cortex (forelimb and hindlimb areas). Coronal cryostat sections were cut at bregma −1.1 mm and were hybridized with antisense [35 S]-cRNA probes specific for CaM I (A,D), CaM II (B,E), or CaM III (C,F) mRNA. The figure shows brightfield (A-C) emulsion autoradiographs, where darker areas represent higher hybridization signals. Areas corresponding to the one in the rectangle in C are at higher magnification and visualized by darkfield illumination (D-F); here, brighter areas correspond to higher hybridization signals. Arrowheads in D-F point to labeling corresponding to cell bodies resident in Layer 1 of the cerebral cortex. Cl 1-6, Layers 1-6 of cerebral cortex. Bars = 200 μm.
Basal Ganglia and Associated Areas
Low to moderate CaM mRNA levels were observed in these structures (Table 1). Significantly higher mRNA levels were determined for CaM I in the nucleus accumbens (Figures 2D-2F), for CaM II in the caudate putamen (Figure 2G-2L), and for CaM III in the globus pallidus (Figures 3A-3C). The substantia nigra exhibited lower CaM gene expression (Figures 4A-4C), with higher mRNA copy numbers in the pars compacta than in the pars reticulata. Moderate expression for all CaM genes was characteristic in the red nucleus (Figures 4A-4C).
Limbic Areas
These areas exhibited moderate to strong CaM gene expression (Table 1). Very strong hybridization signals were detected in the hippocampus-dentate gyrus complex (Figures 3D-3L and Figures 4A-4C), where a differential expression pattern was again evident. Very high CaM mRNA levels for all CaM genes were measured in the pyramidal cell layer in the CA3 subfield (86.3-87.9 × 10⁶ /mm3; Figures 7A-7C). Lower mRNA levels were detected in the pyramidal cell layer of the CA1 and CA2 subfields, where the CaM II mRNA copy number (66.5-69.6 × 10⁶ /mm3) was significantly higher than those of CaM I and III (56.6-61.3 × 10⁶ /mm3). Differences in mRNA levels were similarly apparent in the granular cell layer of the dentate gyrus because the CaM I mRNAs were more abundant (90.2 × 10⁶ /mm3; a value equal to that for the CA1 pyramidal cell layer), whereas the CaM II (59.3 × 10⁶ /mm3) and CaM III (47.6 × 10⁶ /mm3) mRNA copy numbers were significantly lower. The molecular layers of the hippocampus displayed relatively low labeling associated with both cell bodies and the neuropil (Figures 7D-7F). Corresponding to the variable intensities of diffuse labeling (neuropil) with the three CaM probes, considerably different mRNA contents were determined in this region (CaM II < III < I). The CaM I mRNA copy number was significantly higher than those of CaM II and III in the lateral septal nucleus (Figures 2J-2L and Figures 8A-8C). The differential expression was obvious in the nuclei of the vertical (Figures 2G-2I) and horizontal (Figures 2J-2L) diagonal bands, where moderate expression for CaM I, intermediate expression for CaM II and strong expression for CaM III were demonstrated. Considerably higher mRNA contents were detected for CaM III in the basolateral amygdaloid nucleus (Figures 3D-3F) and for CaM I in the amyg-dalohippocampal area (Figures 3J-3L). Similar CaM I mRNA copy numbers were found in the medial and lateral habenular nuclei, whereas the CaM II level and especially the CaM III mRNA level were significantly higher in the medial than in the lateral (Figures 3G-3L and Figures 8D-8F) habenular nuclei. High levels of CaM mRNAs (CaM I ã II < III) were measured in the tenia tecta (Figures 2D-2F) and the nucleus of the lateral olfactory tract (Figures 3A-3C). Lower CaM gene expression was observed in the bed nucleus of the stria terminalis (CaM I Ĩ II ã III; Figures 2J-2L). A differential expression pattern was also evident in the subiculum (CaM I Ĩ III Ĩ II).
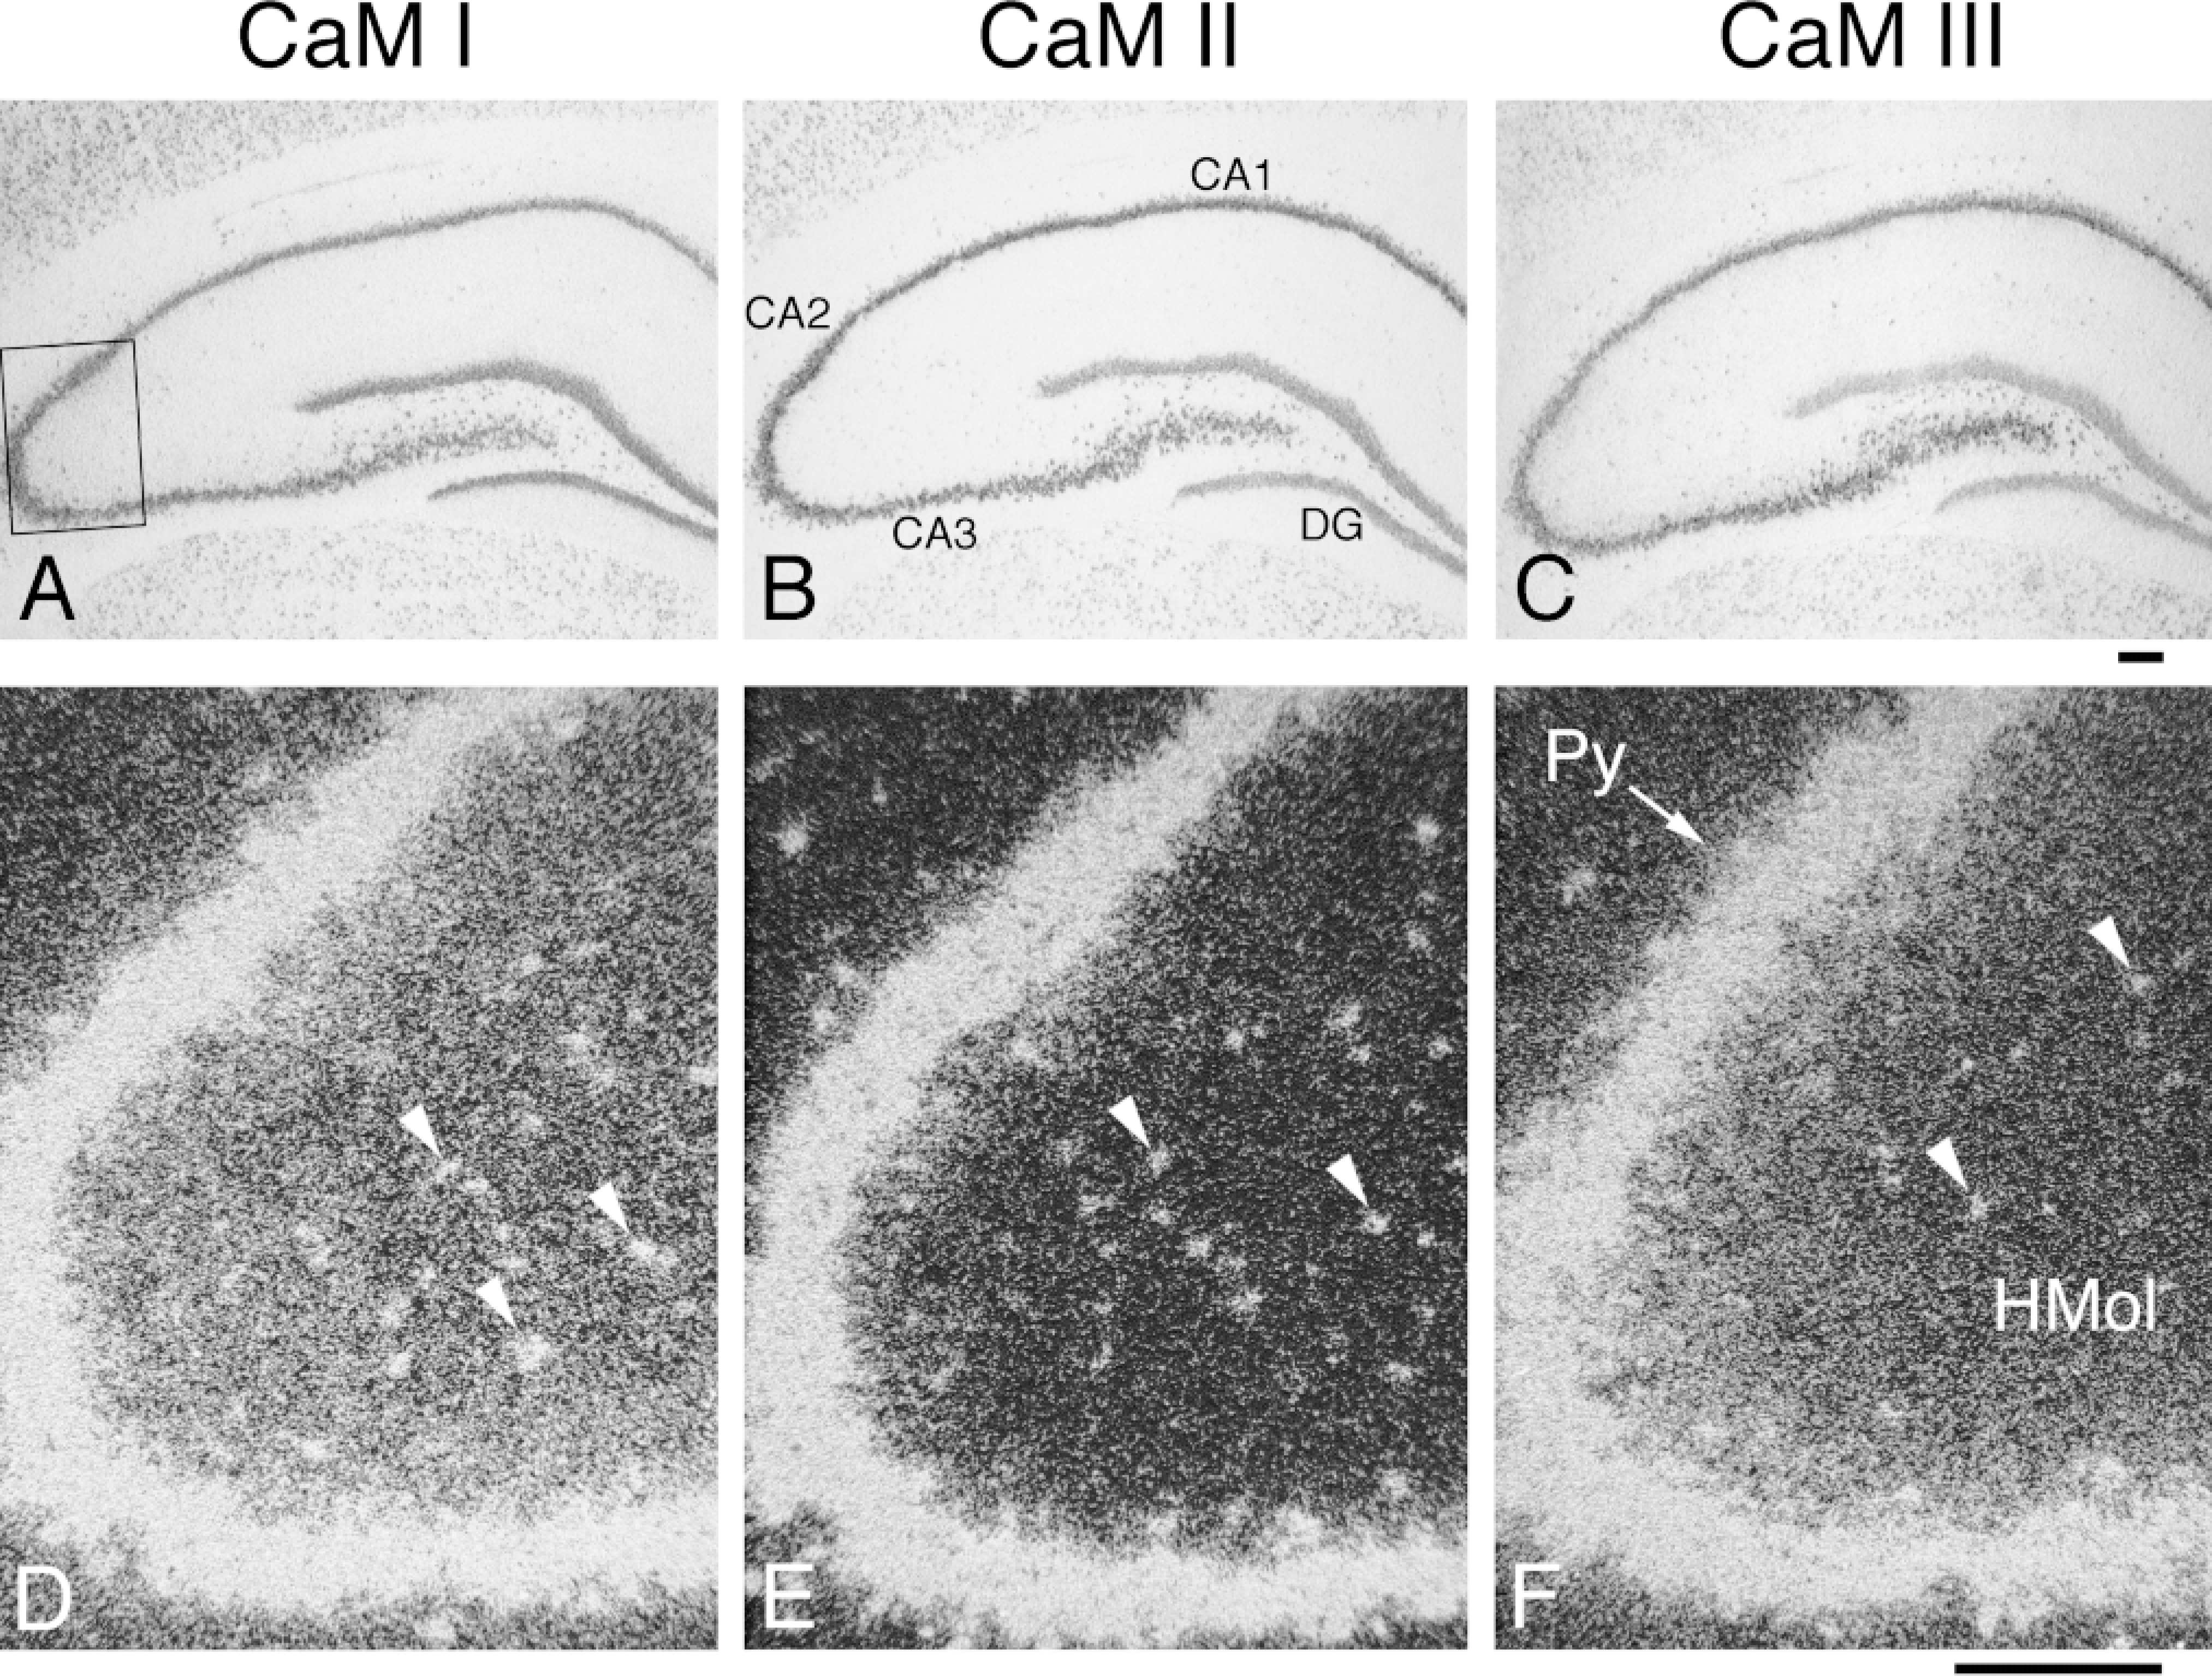
Distribution and cellular localization of CaM mRNAs in adult rat hippocampus-dentate gyrus complex. Coronal cryostat sections were cut at bregma −3.8 mm and were hybridized with antisense [35 S]-cRNA probes specific for CaM I (A,D), CaM II (B,E), or CaM III (C,F) mRNA. The figure shows brightfield (A-C) emulsion autoradiographs, where darker areas represent higher hybridization signals. Higher magnification darkfield images of areas corresponding to the one in the rectangle in A are depicted in D-F, where brighter areas correspond to higher hybridization signals. Arrowheads in D-F indicate labeling corresponding to cell bodies present in the molecular layers of the hippocampus. CA1-3, Ammon's horn fields CA1-3; DG, granular cell layer, dentate gyrus; Py, pyramidal cell layer, hippocampus; HMol, molecular layers, hippocampus. Bars = 200 μm.
Thalamus
In general, the thalamic nuclei exhibited moderate CaM mRNA levels (Table 1). Higher and differential expressions were detected in the parafascicular (CaM II < III < I; Figures 3J-3L) and the paraventricular (CaM II ã III Ĩ I; Figures 3J-3L) thalamic nuclei, while the reticular (CaM II Ĩ I ã III; Figures 3G-3I) and the reuniens (Figures 3G-3I) thalamic nuclei exhibited lower mRNA levels.
Hypothalamus
Moderate but differential CaM gene expression was characteristic of the hypothalamic nuclei (Table 1). Slightly lower mRNA levels for CaM I than for CaM II and III were detected in the arcuate, dorsomedial, and ventromedial hypothalamic nuclei (Figures 3G-3I). Differences in CaM mRNA copy numbers were characteristic of the medial preoptic area (CaM I < II < III; Figures 2J-2L), the suprachiasmatic nucleus (CaM II < III < I; Figures 3A-3C and Figures 8G-8I), the supraoptic nucleus (CaM II < I ã III; Figures 3A-3F and Figures 8G-8I), the retrochiasmatic part of the supraoptic nucleus (CaM II < I < III) and the paraventricular hypothalamic nucleus (CaM I < II < III; Figures 3D-3F). A slightly elevated CaM III mRNA content was observed in the tuber cinereum (Figures 3D-3F).
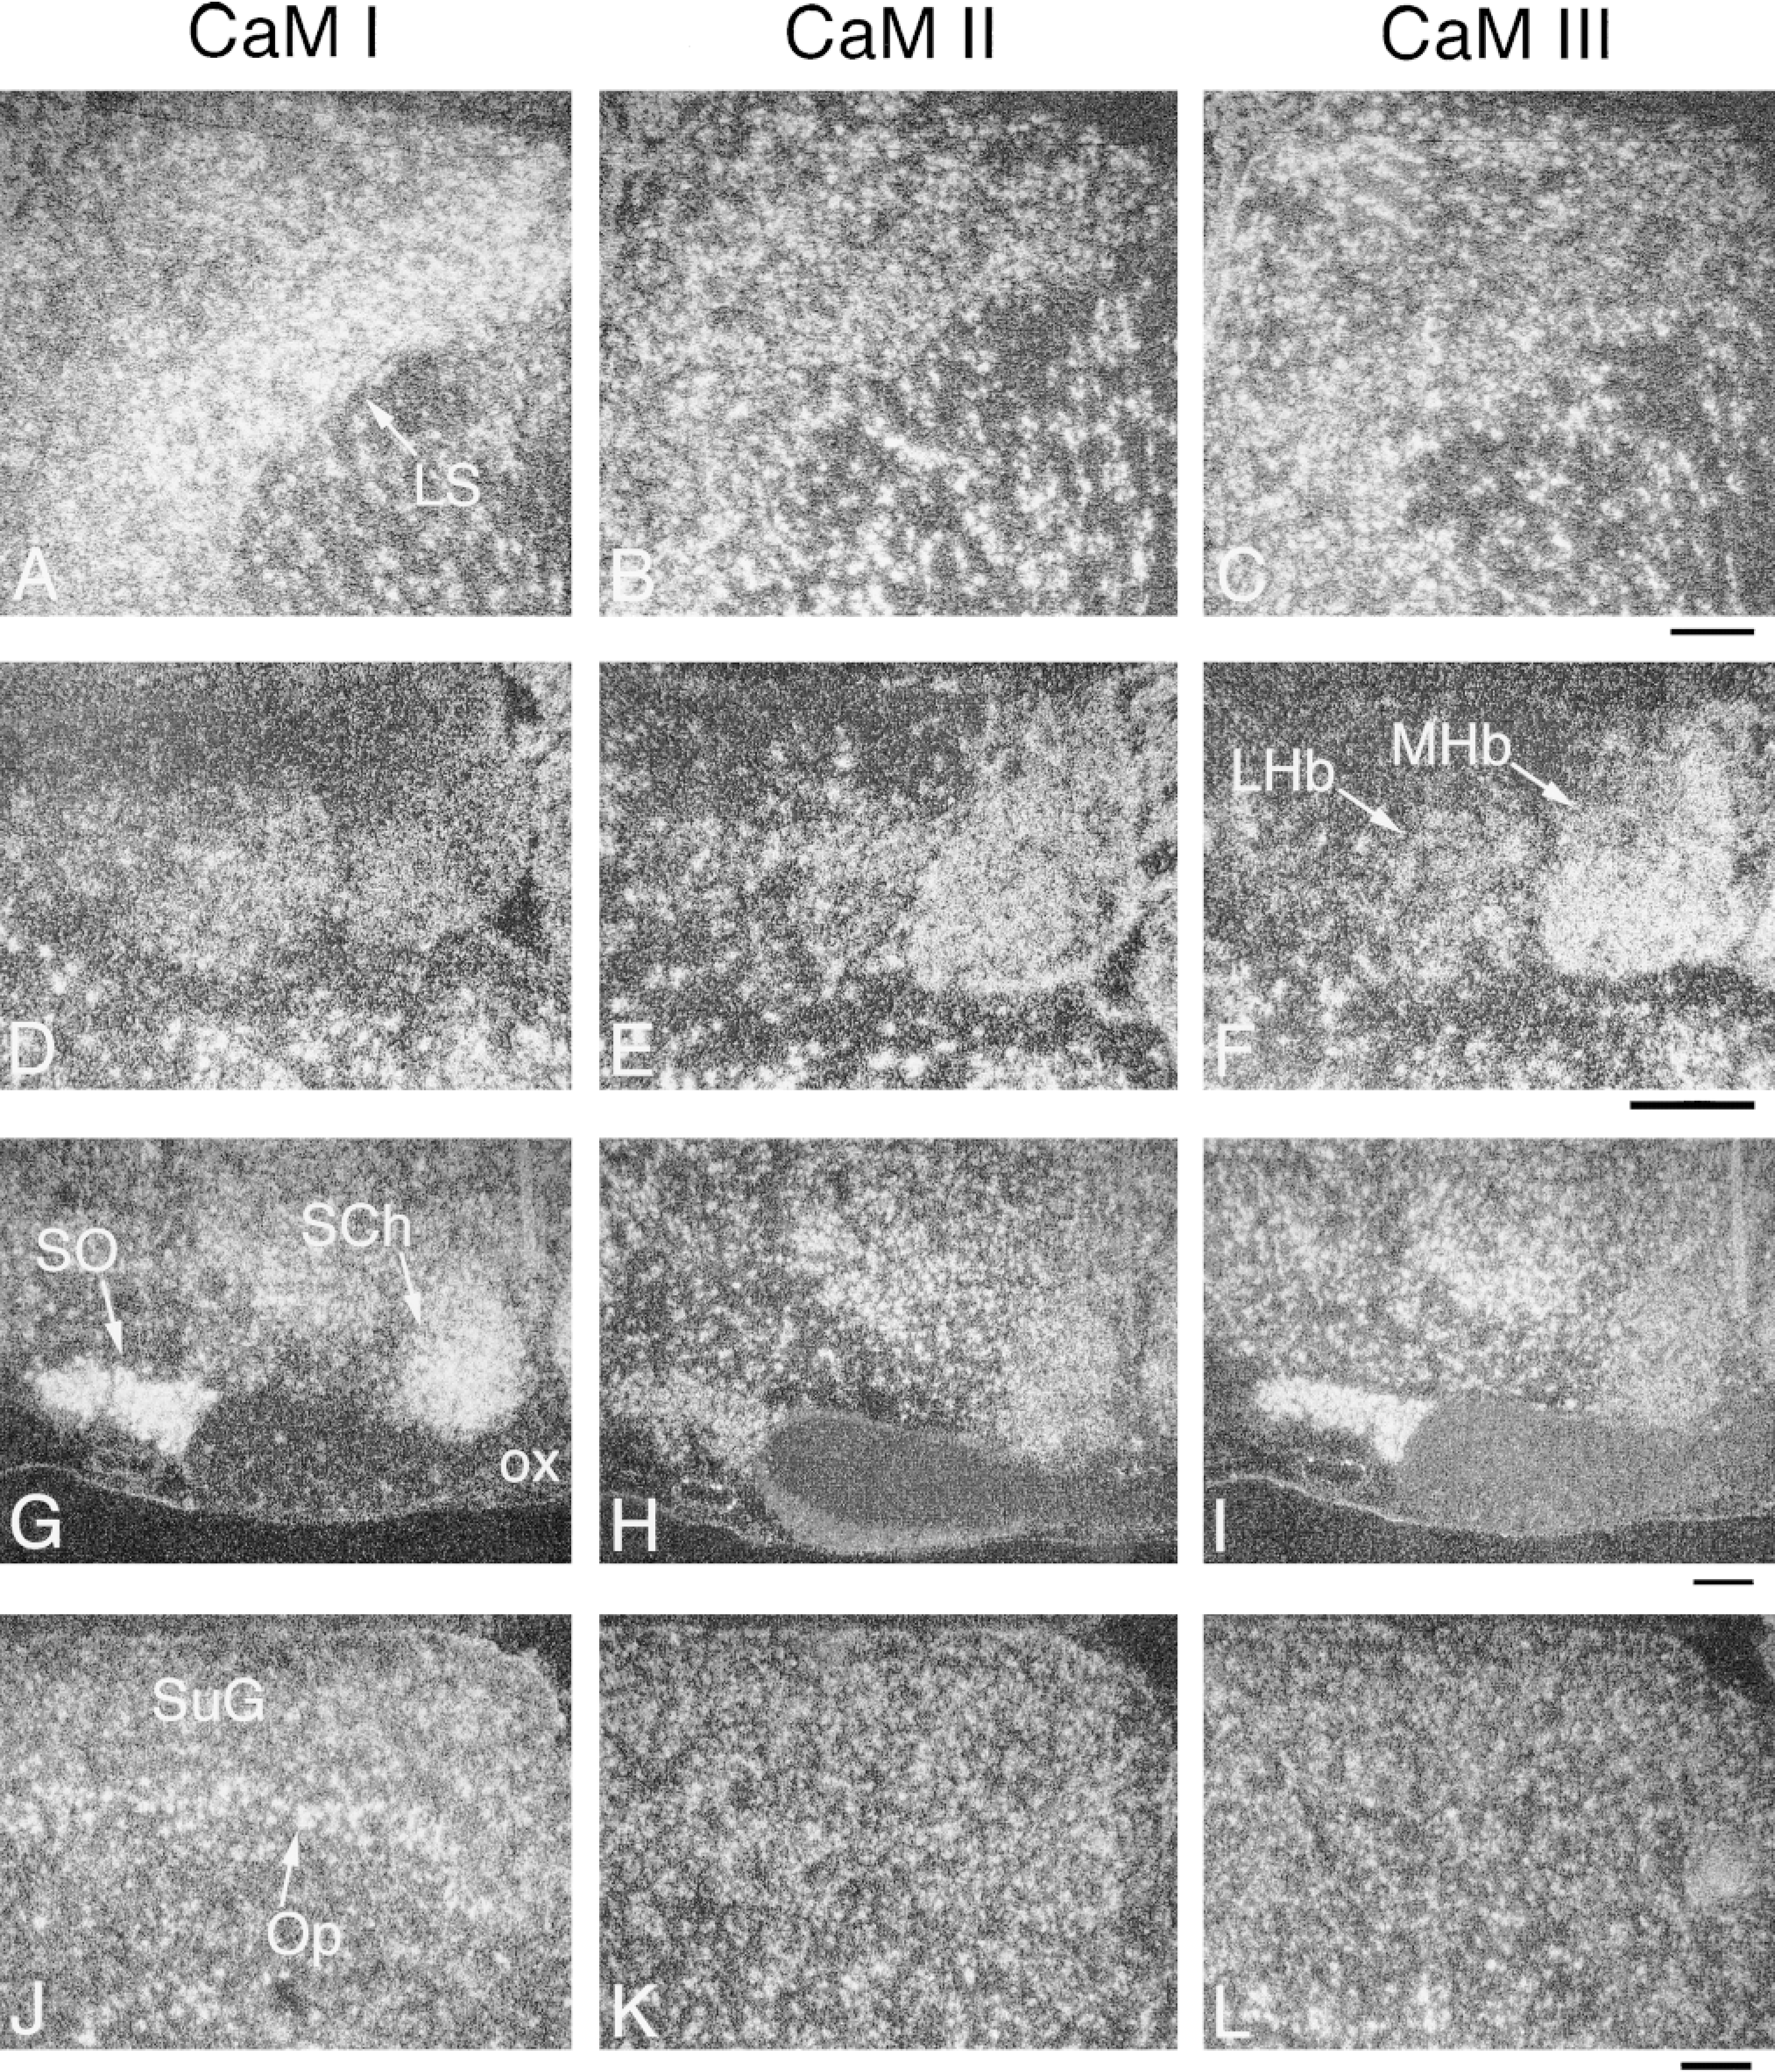
Distribution and cellular localization of CaM mRNAs in adult rat brain. Coronal cryostat sections were cut at bregma −0.4 mm (AC), −3.1 (D-F), −1.1 (G-I), and −6.0 (J-L) and were hybridized with antisense [35 S]-cRNA probes specific for CaM I (A,D,G,J), CaM II (B,E,H,K), or CaM III (C,F,I,L) mRNAs. The figure shows darkfield emulsion autoradiographs of labeled sections, where brighter areas correspond to higher hybridization signals. LS, lateral septal nuclei; LHb, lateral habenular nucleus; MHb, medial habenular nucleus; SO, supraoptic nucleus; SCh, suprachiasmatic nucleus; OX, optic chiasm; SuG, superficial gray layer, superior colliculus; Op, optic nerve layer, superior colliculus. Bars = 200 μm.
Midbrain-Brainstem
Moderate CaM mRNA levels, but a differential distribution, were observed in these structures (Table 1). Differential mRNA levels were detected in the superior colliculus (CaM II ã III < I). The superficial layer exhibited an intermediate gene expression, and the optic nerve layer a stronger one (Figures 4A-4F and Figures 8J-8L). Moderate differential CaM gene expression was determined in the raphe nuclei (CaM I < II ã III; Figures 4D-4F), the nucleus trapezoid body (CaM II ã III < I; Figures 4G-4I), and the parabigeminal nucleus (CaM II < CaM I ã III; Figures 4D-4F). The CaM mRNA levels were low to moderate, with out significant differences, in the central gray (Figures 4D-4F), the central nucleus of the inferior colliculus (Figures 4G-4I), the dorsal tegmental nucleus (Figures 4G-4I), the inferior olive (Figures 4J-4L), the interpeduncular nucleus (Figures 4A-4C), the medial geniculate nucleus (Figures 4A-4C), the pontine nuclei (Figures 4D-4F), the pontine reticular nucleus (Figures 4G-4I), the prepositus hypoglossal nucleus (Figures 4J-4L), and the trochlear nucleus (Figures 4D-4F).
Cerebellum
The differential expression pattern of the multiple CaM genes was evident in this area (Table 1). The granular cell layer exhibited strong expression for CaM I (49.4 × 10⁶ /mm3) and CaM II (56.1 × 10⁶ /mm3), whereas the CaM III mRNA level (23.8 × 10⁶ /mm3) was much lower (Figures 4J-4L). A low but differential expression (CaM II < CaM III < CaM I) was characteristic in the molecular cell layer (Figures 9D-9F). High-resolution autoradiography revealed very strong expression for CaM II but lower mRNA levels for CaM I and III in the Purkinje cells (Figures 9A-9F).
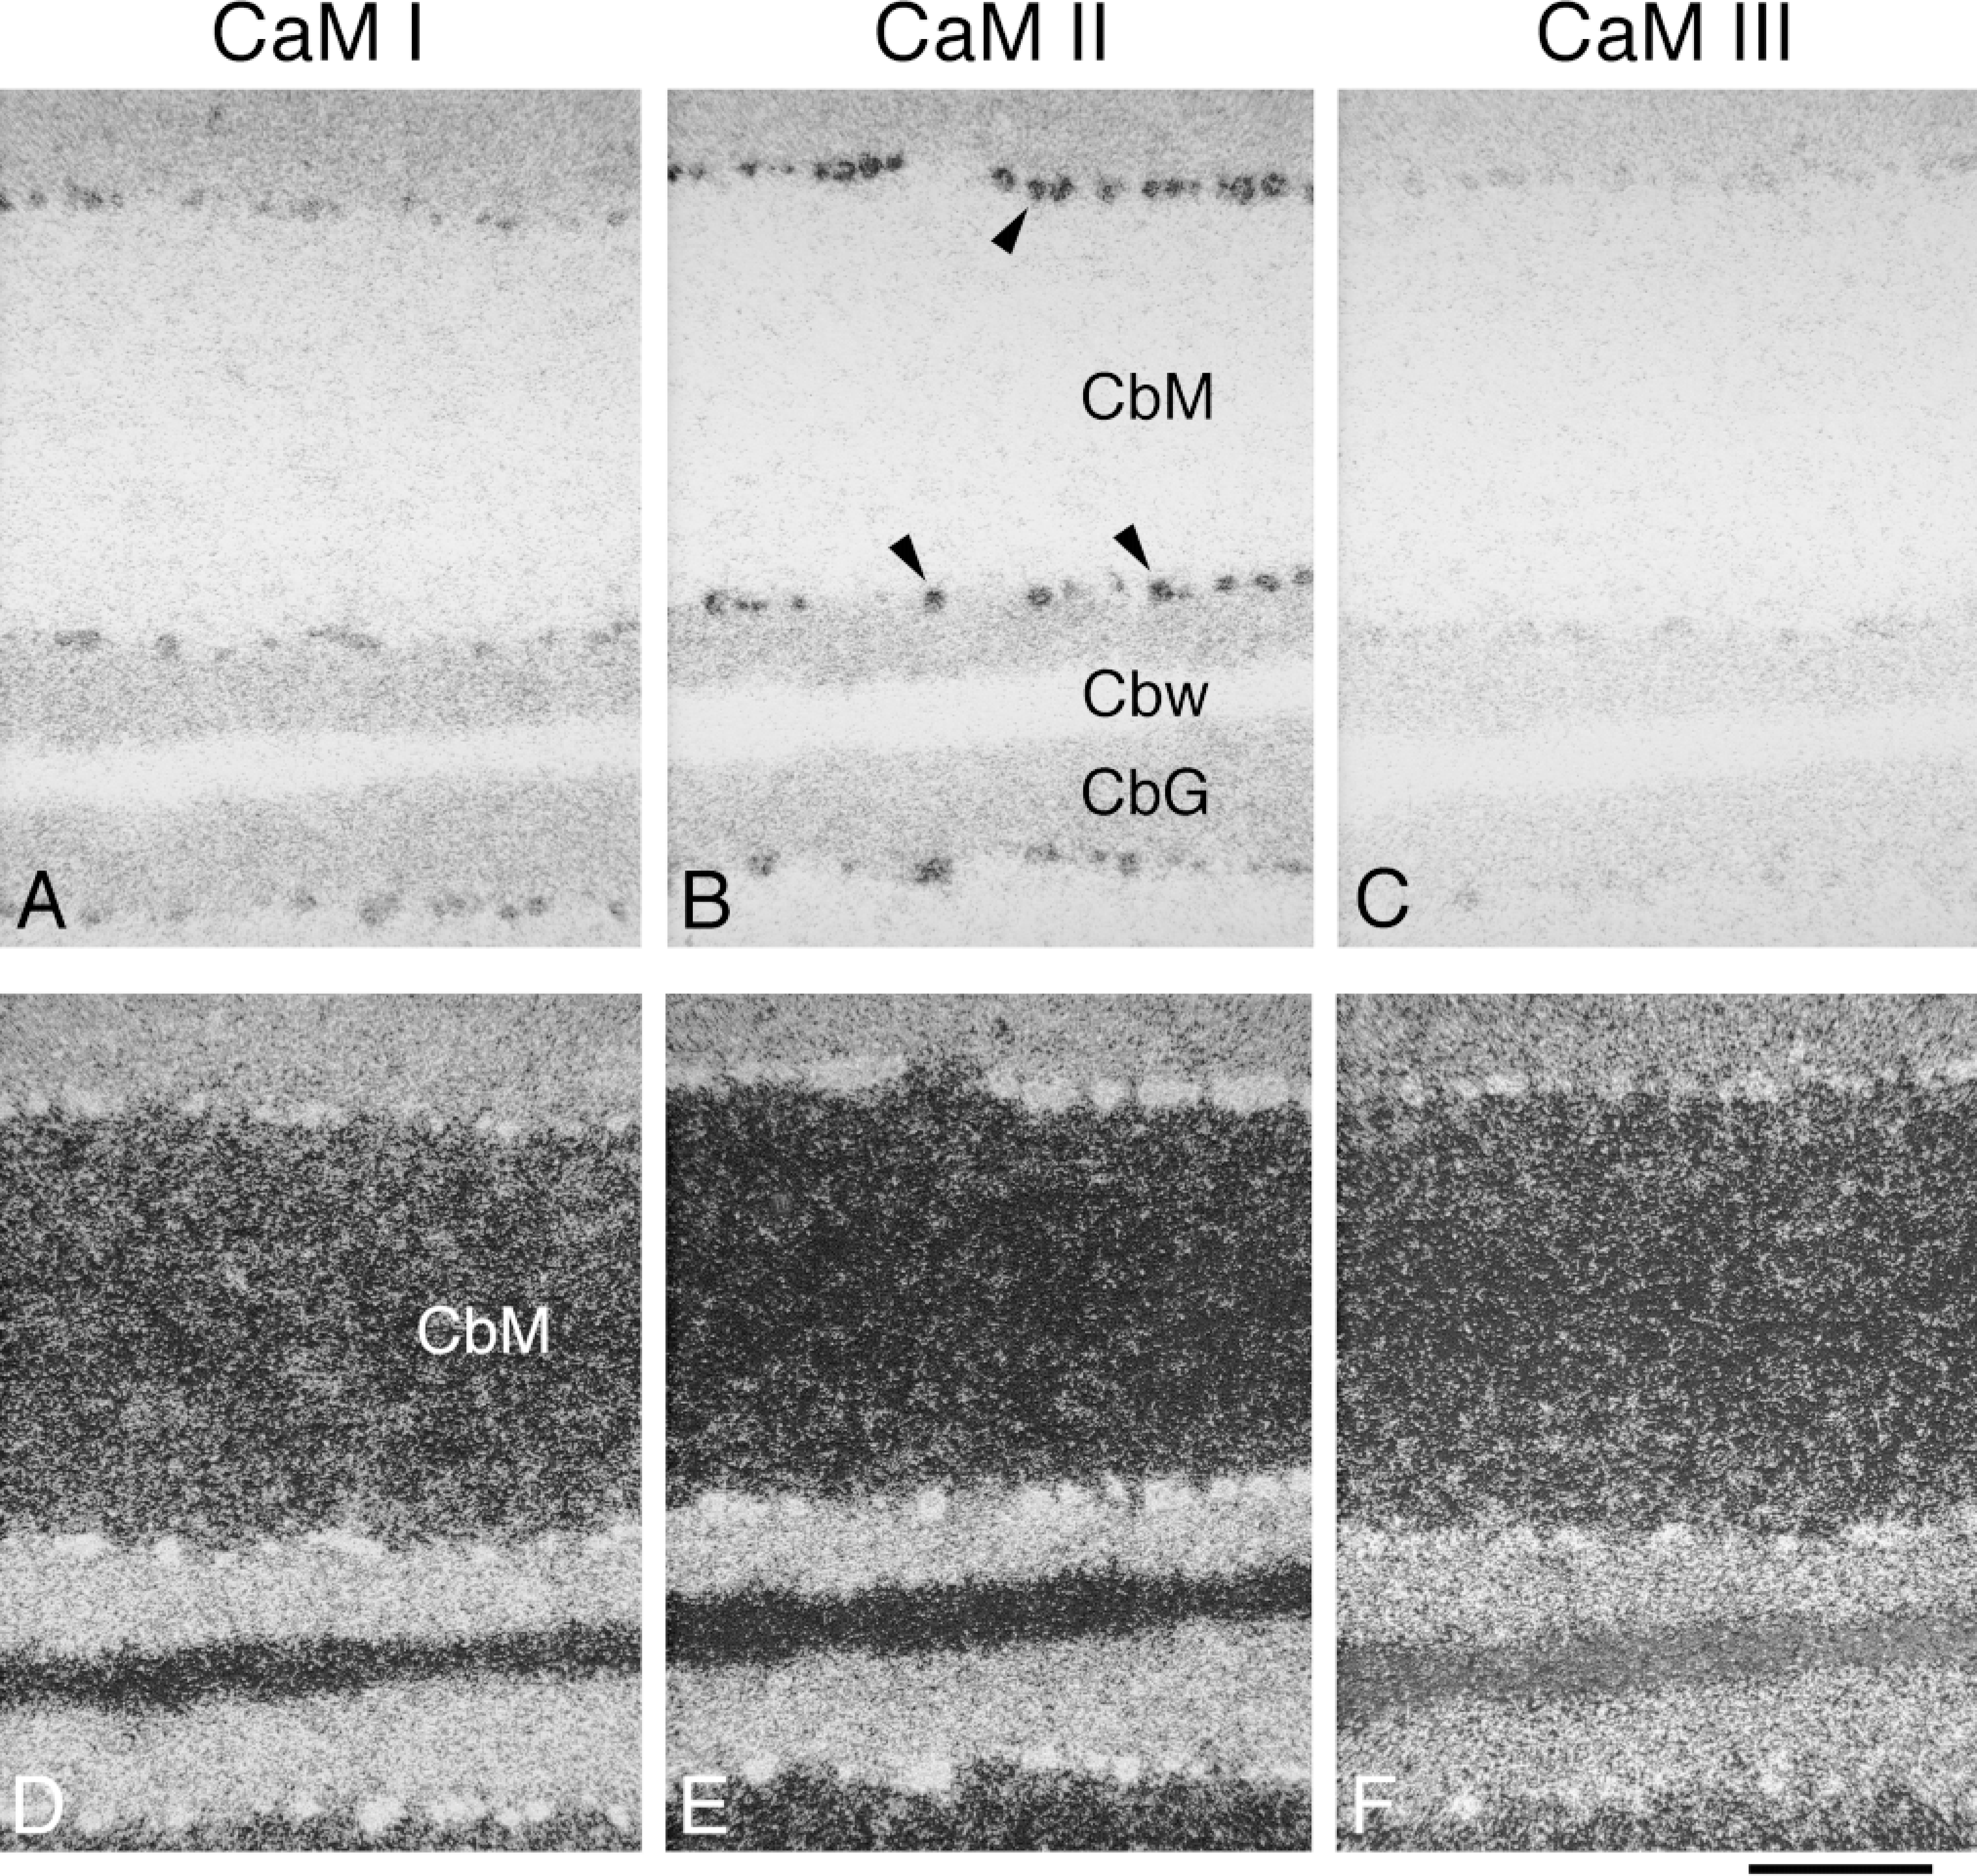
Distribution and cellular localization of CaM mRNAs in adult rat cerebellar cortex. Coronal cryostat sections were cut at bregma −12.3 mm and were hybridized with antisense [35 S]-cRNA probes specific for CaM I (A,D), CaM II (B,E), or CaM III (C,F) mRNA. The figure shows brightfield (A-C) emulsion autoradiographs, where arrowheads indicate the Purkinje cell bodies and darker areas represent higher hybridization signals. The same areas visualized by darkfield illumination are presented in D-F, where brighter areas correspond to higher hybridization signals. CbM, molecular layer, cerebellar cortex; Cbw, white matter, cerebellar cortex, CbG, granular layer, cerebellar cortex. Bar = 200 μm.
White Matter
Although the CaM gene expression dominated in gray matter areas, the autoradiographic signal in white matter areas (e.g. anterior commissure, Figures 2J-2L; corpus callosum, Figures 2D-2L, Figures 3A-3L, and Figures 4A-4F; cerebellar white matter, Figures 4J-4L) was unambiguous too. Low levels for all CaM mRNAs were determined in these areas (Table 1).
Ventricles
Moderate CaM gene expression was determined in the choroid plexus (CaM I < II < III; Table 1). Microscopic analysis of emulsion-coated sections demonstrated labeling similar to that of the choroid plexus in the ependymal cells lining the ventricles (Figures 10A-10C).
Intracellular Localization
Certain areas in the brain are highly laminated, in which layers containing neuronal perikarya, layers composed of mainly dendrites and their presynaptic afferents, or virtually exclusively axonal tracts, can be distinguished. Layers containing cell bodies, such as cerebral cortical Layers 2-6 (Figures 6A-6F), the cerebellar granular and Purkinje cell layers (Figures 9A-9F), the pyramidal cell layer of the hippocampus (Figures 7A-7F), and the granular and mitral cell layers of the olfactory bulb (Figures 5A-5C), exhibited very strong expression for all three CaM genes (Table 1). Lower but unambiguous CaM mRNA levels were detected in areas containing mainly dendrites and their presynaptic afferents, such as the cerebral (Layer 1; Figures 6D-6F), cerebellar (Figures 9D-9F) and hippocampal (Figures 7D-7F), molecular layers and the external plexiform layer of the olfactory bulb (Figures 5A-5C). In these areas, most of the labeling was diffusely distributed, presumably corresponding to structures of the neuropil, although patchy labeling corresponding to cell bodies was also evident (Figures 5A-5C, Figures 6D-6F, and Figures 7D-7F). A dispersed pattern of the silver grains was further evident in areas surrounding the heavily labeled cell bodies in cerebral cortical Layers 2-6 (Figures 6D-6F). The mRNA levels corresponding to the three CaM genes differed significantly in these areas, because relatively high CaM I, intermediate CaM III, and low CaM II mRNA levels were detected (Table 1). White matter structures (Figures 2–4) containing mainly axonal tracts (and glial cells as well) exhibited very low expression for all CaM genes.
Discussion
Three (CaM I, II, and III) gene-specific cRNA probes complementary to the 3′-nonhomologous (noncoding) regions of their mRNAs were designed. Probe speci ficity was determined by Northern blot analysis: the lengths of the six detected mRNA species were in good agreement with those previously obtained for the rat brain (Nojima 1989; Ikeshima et al. 1993; Gannon and McEwen 1994). No crosshybridization between mRNAs corresponding to different CaM genes or nonspecific hybridization to other mRNA species was observed. Strong expression of the three bona fide CaM genes in the rat brain was confirmed by Northern analysis and in situ hybridization, in agreement with the high concentration of CaM protein present in the mammalian brain (Cheung 1982; DeLorenzo 1982; Caceres et al. 1983; Zhou et al. 1985; Vendrell et al. 1991).
The results of our in situ hybridization study demonstrated that the three CaM genes are widely expressed, with a similar overall occurrence in the rat brain. The detected pattern of mRNA distribution corresponding to each CaM gene generally confirmed those previously described in the rat brain (Cimino et al. 1990; Matsuoka et al. 1992; Ni et al. 1992; Ikeshima et al. 1993; Matsuo et al. 1993; Gannon and McEwen 1994; Barrón et al. 1995). However, a comparative evaluation of these qualitative studies, most of which reported the expression of merely one or another CaM gene, is rather cumbersome. Only Ikeshima et al. (1993) and Gannon and McEwen (1994) demonstrated the presence of mRNAs corresponding to all three CaM genes. They found similar distributions and concluded that the expression of the CaM genes in the rat brain was coordinated. Here we have established a rather differential distribution of the CaM mRNAs in several areas in the rat brain under physiological conditions. A preliminary account of the quantitative distribution of the CaM mRNAs in the hypothalamic and adjacent areas has already been published to demonstrate the feasibility of our quantification method (Palfi et al. 1998). Our results are consistent with the findings of Solà et al. (1996), who likewise described differential expression for the three CaM genes in the mouse brain. Significant advances of the present study over existing ones include the quantitative measurement (in mRNA copy numbers) and the most comprehensive analysis to date (describing more than 70 areas) of the CaM gene expression in the mammalian brain. We expressed mRNA abundance in mRNA copy numbers. These values indicate the amounts of the hybridized probes, which underestimate the true mRNA copy numbers for several reasons: degradation of mRNA may occur during the tissue preparation, fixation may not retain all mRNAs, and retained mRNAs may be in a conformation unfavorable for stable hybridization or not actually accessible for probe hybridization. However, these factors should be similar for most or all of the different mRNA species.
By determination of the exact mRNA quantities, a direct and therefore more precise comparison of the expression of the different CaM genes was possible. For each CaM gene, a high regional variance (35-40-fold differences) in mRNA copy number was detected. The brain areas most prominently exhibiting a differential distribution of their CaM mRNAs were the external plexiform layer of the olfactory bulb, Layer 1 of the cerebral cortex, the globus pallidus, the diagonal band, the lateral septal nucleus, the suprachiasmatic nucleus, the supraoptic nucleus, the hippocampus-dentate gyrus complex, the medial habenular nucleus, the optic nerve layer of the superior colliculus, and the cerebellar cortex. For the first time, evidence has been established here that indicates differential CaM gene expression in several brain areas, most notably the molecular layers in the cerebral and cerebellar cortices and the hippocampus. Strong evidence of non-neuronal CaM gene expression was similarly observed in the ependymal cells and the choroid plexus. CaM II mRNA was detected in the choroid plexus by Matsuoka et al. (1992), and the presence of CaM protein in glial cells has also been reported by others (Caceres et al. 1983; Vendrell et al. 1991; Solà et al. 1997).
Differential labeling of the major structural specializations of the neurons too was also investigated. In agreement with the results of previous studies (Cimino et al. 1990; Matsuoka et al. 1992; Ni et al. 1992; Ikeshima et al. 1993; Gannon and McEwen 1994; Barrón et al. 1995; Berry and Brown 1996; Solà et al. 1996,1997), we observed strong expression for all three CaM genes in layers containing mainly cell bodies. However, we also detected CaM mRNAs in the molecular layers of the hippocampus, the cerebral and cerebellar cortices, and the external plexiform layer of the olfactory bulb. Primarily neuronal expression of CaM in these areas was indicated by CaM immunocytochemistry (Caceres et al. 1983; Berry and Brown 1996; Solà et al. 1996,1997) because the labeling corresponded to the heavily stained dendrites for the greatest part, although a few glial cells were also labeled. Therefore, in these molecular layers, the amount of CaM protein is much more abundant in neurons than in glial cells, suggesting that the bulk of the detected CaM mRNAs should reside in neurons (in their dendritic processes) rather than in glial cells. Further evidence supporting the dendritic translocation of CaM mRNAs was furnished by Berry and Brown (1996), who detected CaM I mRNAs in apical dendrites of cortical, hippocampal, and Purkinje neurons during early postnatal development (postnatal days 5-20) in the rat. Zhang et al. (1993) localized CaM I and II mRNAs to both cell bodies and neurites in PC 12 cells, whereas the presence of CaM III mRNAs was characteristic only of the perikarya in these cells. Because we found considerably and consistently different CaM mRNA levels in dendrite-rich areas, a differential dendritic translocation of CaM mRNAs in mature neurons appears conceivable. In harmony with previous findings (Cimino et al. 1990; Matsuoka et al. 1992; Ni et al. 1992; Solà et al. 1996), white matter structures containing mainly axonal tracts exhibited weak expression for all CaM genes. This observation not only renders the presence of axonal CaM mRNAs improbable but also verifies that glial CaM expression (here mostly in oligodendrocytes) is very low.
Our results indicate that the CaM mRNAs exhibit a dendritic localization in neurons in the adult rat brain. Moreover, transcripts of the three CaM genes are differentially targeted to the dendritic compartment, because we found mostly a perikaryal localization for CaM II mRNA, whereas the mRNA for CaM III, and especially for CaM I, is under somatodendritic targeting. Although the translocation of neuronal mRNAs to different subcellular domains has been described by several authors (Garner et al. 1988; Landry et al. 1994; St Johnston 1995; Steward 1995,1997; Gao 1998), the mechanisms involved in mRNA targeting are not yet clearly understood.
The results we obtained on CaM mRNA distribution by in situ hybridization exhibit a similar localization to those detected by CaM immunocytochemistry (Caceres et al. 1983; Solà et al. 1996,1997). However, an incomplete overlap between CaM activity (Zhou et al. 1985) and CaM mRNA distribution was found in several brain regions (e.g., the substantia nigra and the caudate putamen exhibited high activity but low mRNA levels). Furthermore, we detected 35-40-fold differences in CaM mRNA copy numbers in the different brain areas, whereas Zhou et al. (1985) found only 10-fold differences in CaM activity. Nevertheless, the CaM activity does not necessarily represent the amount of CaM protein, which may be present in an active or an inactive form. In addition, because the protein concentration is controlled at several transcriptional and translational levels, significant differences may exist between the proportions of CaM mRNA copy numbers, CaM protein concentrations, and CaM activities in different brain areas.
Conclusions
In agreement with the pivotal role of CaM in the nervous system, the multiple mRNAs corresponding to the three bona fide CaM genes are widely expressed in the rat brain. Differential expression of the CaM genes was detected at two different cellular organization levels. First, we found a differential area-specific CaM mRNA distribution in several brain areas under physiological conditions in adult animals. Second, differential in vivo intraneuronal CaM mRNA targeting was revealed. Other authors have already reported a differential regulation for the CaM genes under (patho) physiological or experimental conditions in the rodent brain and PC 12 cells (Bai and Weiss 1991; Bai et al. 1992; Ikeshima et al. 1993; Gannon and McEwen 1994; Solà et al. 1996,1997), and a dendritic localization also was described earlier (Zhang et al. 1993; Berry and Brown 1996). These results, taken together with our own, indicate that different brain areas and even different compartments of a neuron contain different proportions of CaM mRNAs, which presumably contribute differentially to the actual CaM protein levels. In different parts of the neurons or the brain, different stimuli might act in a unique manner on each CaM gene, resulting in shifts in the amounts and proportions of CaM mRNAs and finally in the amount of CaM protein on local demand. Therefore, a very exquisite control of the expression of the three CaM genes may exist, permitting the multiple functions of CaM in the mammalian brain.
Footnotes
Acknowledgements
Supported by grants from the National Scientific Research Fund, Hungary (OTKA F22658 and T22822 to AP and KG, respectively) and by the National Council on Technical Development (OMFB No. 97-20-MU-0028 to KG).
The skillful technical assistance of Ms Susan Ambrus and Ms Maria Kosztka is highly appreciated.