
Abstract
In estimations of mRNA copy numbers, quantitative in situ hybridization (ISH) is expected to be performed at saturating probe concentration. In practice, however, this condition can rarely be fulfilled when medium to high amounts of transcripts exist and/or in large-scale experiments. To resolve this problem, we developed and tested a double-step procedure involving the use of calmodulin (CaM) I, II, and III [35S]-cRNA probes on adult rat brain sections; the hybridization signals were detected with a phosphorimager. By means of hybridization at increasing probe concentrations for a time sufficient for saturation, saturation curves were created for and maximal hybridization capacity (Hmax) values were assigned to selected brain areas. The Kd values of these various brain areas did not differ significantly, which allowed the creation and use of one calibration graph of Hmax vs hybridized [35S]-cRNA values for all brain areas for a given probe concentration. Large-scale ISH experiments involving a subsaturating probe concentration were performed to estimate Hmax values for multiple CaM mRNAs. A calibration graph corresponding to this probe concentration was created and Hmax values (expressed in ISH copy no/mm2 units) were calculated for several brain regions via the calibration. The value of the method was demonstrated by simultaneous quantification of the total accessible multiple CaM mRNA contents of several brain areas in a precise and economical way.
Keywords
Q
[35S]-UTPαS-labeled riboprobes are preferentially used for quantitative ISH because of their advantageous features such as sensitivity, specificity, and single-cell resolution. When the aim is to quantify target mRNAs in absolute terms, target sequences are expected to be saturated with labeled nucleic acid probes. However, this condition can rarely be achieved with [35S]-cRNA probes when medium to high amounts of cell transcripts exist and/or in large-scale experiments, because of the practical problems associated with the synthesis of large molar quantities of riboprobes with high specific activity. Probes with high specific activity are required for quantitation of areas in a non-homogeneous tissue with relatively low amounts of the target mRNA. Employment of a mathematical approach to estimate the maximal hybridization signal attainable under given experimental conditions circumvents the use of large amounts of probes. For estimation of the maximal hybridization signal from a signal measured only when a subset of target sequences forms hybrids, maximal hybridization signal values should be calibrated to the measured labeling values. The problems associated with the creation of a calibration graph vary according to the medium containing the probes. When the target sequence is in solution, the accessibility of each target molecule is the same. Therefore, only one saturation curve has to be created. This curve can readily be calibrated because the maximal hybridization signal can be directly related to the absolute amount of target mRNA which, in turn, can be simply measured by independent methods (e.g., spectrophotometry, fluorimetry). For membrane blots, the same situation can be assumed for practical purposes. For single cells, it can be presumed that the accessibility of mRNAs among individual cells of similar type is the same. As regards the calculation method, an explicit theory has been put forward (Cash and Brahic 1986) that describes the saturation of viral target sequences in blood cells as a function of the probe concentration and the hybridization time. This quantitation was based on the quasi-linear part of the saturation curve used as a calibration line, and the measured signal was related to a viral RNA dot-blot standard. In (quasi-)homogenous tissues, it is also presumed that the accessibility of target sequences does not change from cell to cell. For this case, a calculation method has been described for heart muscle (Nunez et al. 1989), the slope of the quasi-linear part of the saturation curve being employed for calculation. For calibration, the Northern blot procedure was used as an independent method. In tissues with a heterogeneous structure, the accessibility and hence the saturation rate (saturation signal vs probe concentration or hybridization time) of the target mRNAs may vary in different parts of the tissue and distinct calibration curves may therefore be necessary for each region. As far as we are aware, no method has been published thus far that allows the simultaneous calculation of maximal hybridization signal values of individual regions in heterogeneous tissues. Similarly, the calibration of saturation curves for mRNA amounts (determined by using an independent method) present in individual regions of a non-homogeneous tissue is still awaited.
In the present study, labeling values were converted to molar quantities (expressed in [35S]-cRNA ISH copy no/mm2 units; for explanation of the ISH copy number, see the Discussion) for precise correction for the tissue background, and the maximal hybridization signals were converted to maximal hybridization capacities (Hmax; in ISH copy no/mm2 units). The Hmax of a tissue area was defined as the maximal molar quantity of a [35S]-cRNA probe (expressed in ISH copy numbers) hybridized in unit area (1 mm2) of the tissue under the experimental conditions employed.
Materials and Methods
Experimental Animals and Tissue Preparation
All animal experiments were carried out in strict compliance with the European Communities Council Directive (86/609/EEC) regarding the care and use of laboratory animals for experimental procedures, and also followed the Hungarian legislation requirements. Male Sprague-Dawley rats (260 ± 10 g) maintained under standard housing conditions were decapitated and the brains were quickly removed, embedded in Cryomatrix embedding resin (Shandon Scientific; Pittsburgh, PA), and frozen immediately at −70C. Serial coronal cryostat sections (15 μm) from selected brain areas were cut (according to Paxinos and Watson 1986), thaw-mounted onto Cr–A1–gelatin-coated glass slides, air-dried, and stored at −70C until further processing. [35S]-cRNA-labeled brain paste standards with radioactivities in the range of 2.2–5280 cpm/mm2 were prepared as described previously (Davenport et al. 1988; Palfi et al. 1998).
cRNA Probes
Rat genomic DNA was isolated by standard procedures (Sambrook et al. 1989). Genomic sequences of the 3′nonhomologous regions of CaM I, II, and III mRNAs (Nojima and Sokabe 1987; Nojima 1989) were amplified by polymerase chain reaction (PCR). PCRs were performed by employing EcoR I and BamH I restriction enzyme cleavage site-extended primers. The primer sequences complementary to rat genomic DNA were as follows: for CaM I, 5′-AGAC-CTACTTTCAACTACT, corresponding to the 30–48-bp sequence, and 5′-TGTAAAACTCATGTAGGGG, corresponding to the 236–254-bp sequence of exon 6 (Nojima and Sokabe 1987); for CaM II, 5′-ATTAGGACTCCATTCCTCC, corresponding to the 144–162-bp sequence (numbered 1929–1947), and 5′-CACAACTCCACACTTCAACAGC, corresponding to the 353–374-bp sequence (numbered 2138–2159) of exon 5 (Nojima 1989); and for CaM III, 5′-ATGATGACTGCGAAGTGAAG, corresponding to the 12–31-bp sequence (numbered 7058–7077) of exon 6, and 5′-CAGGAGGAAGGAGAAAGAGC, corresponding to the nontranscribed genomic sequence 153–172-bp downstream to the stop codon (numbered 7228–7247) (Nojima 1989). PCRs containing 1.5 mM MgC12, 30 μM dNTP mixture, 400 ng genomic DNA as template, and 20 pmol of each of the forward and reverse primers were run for 35 cycles (40 sec at 94C for denaturation, 30 sec at 55C for annealing, and 30 sec at 72C for extension). The resulting PCR products were cloned into a pcDNA3 vector (Invitrogen; Carlsbad, CA) and sequenced (AB 373 DNA Sequencer; PE Applied Biosystems, Foster City, CA) to confirm their identity. In vitro RNA syntheses from the purified and linearized vectors were carried out to prepare antisense and sense cRNA probes. The complementary sequences were 225 bp (CaM I), 231 bp (CaM II), and 157 bp (CaM III) long. For radiolabeling, [35S]-UTPαS (1250 Ci/mmol; ICN Biomedicals, Costa Mesa, CA) was incorporated by using Riboprobe System-T7 and Riboprobe System-SP6 (Pω Madison, WI) according to the manufacturer's instructions. Labeled probes were purified by size-exclusion chromatography on a Probe-Quant G-50 Sephadex microcolumn (Pharmacia Biotech; Uppsala, Sweden) and the specific activities of the complementary sequences of CaM I, II, and III antisense cRNA probes were determined to be 6.6442 × 10⁷, 4.6095 × 10⁷, and 3.1236 × 10⁷ cpm/pmol (i.e., 9.3047 × 10⁸, 6.1837 × 10⁸, and 6.1561 × 10⁸ cpm/μg), respectively. The specific activities of the synthetized CaM I, II, and III sense cRNA probes were 6.7063 × 10⁷, 7.6421 × 10⁷, and 5.6726 × 10⁷ cpm/pmol, respectively.
Membrane Standard Scales
Membrane standard scales were prepared as described previously (Palfi et al. 1998). Briefly, a scale consisting of 12 dilutions was prepared with a size-exclusion chromatography-purified [35S]-cRNA probe (final activity range 1.5–305.5 cpm/mm2). The radioactive probe was diluted in RNase-free water and the radioactivity was counted by liquid scintillation counting (LSC). Fifty μl from each dilution was dot-blotted onto a Duralon-UV nylon membrane (Stratagene; La Jolla, CA) by vacuum filtration (Minifold; Schleicher & Schuell, Keene, NH) and fixed by UV crosslinking (120,000 μJ/cm2; Stratalinker, Stratagene). Membranes were subsequently dried at 37C for 30 min and co-exposed with tissue paste standards or brain sections to a phosphor screen.
In Situ Hybridization
The protocol for hybridization with [35S]-cRNA probes was essentially the same as described previously (Palfi et al. 1998). Briefly, coronal cryostat brain sections were fixed for 5 min in 2 × SSC (0.3 M NaCl and 0.03 M Na-citrate, pH 7.0) containing 4% formaldehyde, washed twice in 2 × SSC for 1 min, then rinsed in 0.1 M triethanolamine containing 0.25% acetic anhydride and 0.9% NaCl, pH 8.0, for 5 min at room temperature (RT). The sections were dehydrated, air-dried, and hybridized in 50 μl hybridization solution [50% formamide, 6 × SSPE (0.75 M NaCl, 60 mM NaH2PO4, and 6 mM EDTA, pH 7.4), 5 × Denhardt's re agent, 10% dextran sulfate, 50 mM DTT, 100 μg/ml salmon sperm DNA, and 50 μg/ml yeast tRNA] containing a cRNA probe. The specific activity of the hybridization solution was determined by LSC and expressed in fmol/ml units. In saturation experiments, the antisense and sense probe concentrations, respectively, lay in the ranges of 10.0–2142.1 and 9.9–2018.4 fmol/ml for CaM I, 10.1–2065.7 and 13.8–2514.7 fmol/ml for CaM II, and 11.6–2752.5 and 14.4–2640.1 fmol/ml for CaM III. In the second set of hybridizations, the antisense and sense probe concentrations were 213.5 and 226.7 fmol/ml for CaM I, 212.9 and 269.4 fmol/ml for CaM II, and 633.8 and 430.8 fmol/ml for CaM III. During the preparation and application of dilutions to sections, the viscous hybridization solution was kept warm (45C). Hybridization was performed under parafilm coverslips in a humidified chamber at 45C for 21 ± 1 hr. The sections were rinsed in 2 × SSC/50% formamide at RT for 5 min, twice in 2 × SSC/50% formamide at 50C for 10 min, and in 2 × SSC at RT for 5 min. The sections were then incubated in 1 × TE (0.01 M Tris and 0.001 M EDTA, pH 8.0) buffer containing 0.5 M NaCl and 1.32 × 10⁻³ Kunitz U (∼25 mg protein)/ml RNase A at 37C for 30 min, and rinsed in 2 × SSC/50% formamide at 50C for 10 min and in 2 × SSC at 50C for 10 min. Sections were dehydrated, air-dried, and processed for phosphorimaging.
Phosphorimaging and Image Analysis
Brain and tissue paste sections and membrane standards were apposed to an SR Cyclone storage phosphor screen (Packard Instruments; Meriden, CT) at RT for 22 hr. Images were captured at 600 × 600 dpi resolution with the Cyclone Storage Phosphor System (Packard) and analyzed by the computer program OptiQuant version 3.0 (Packard). Images of membrane scales, tissue paste standards, and brain areas were outlined on the computer screen and their signal intensities were expressed in digital light units (dlu) per mm2 and corrected for the screen background (less than 7000 dlu/mm2). The final results were expressed in net dlu/mm2 values.
Quantitation was performed through several consecutive steps. First, it was assumed that identical concentrations of radioactivity in brain sections and brain paste standards resulted in identical net dlu/mm2 values in their images (Kuhar and Unnerstall 1985; Davenport et al. 1988). Brain paste standards were calibrated to membrane scales by plotting their net dlu/mm2 values vs cpm/mm2 values. In the knowledge of the relationship between the tissue paste and membrane scales, brain paste net dlu/mm2 values were converted to membrane cpm/mm2 values. Cpm/mm2 values were then converted to ISH mol/mm2 values, taking into account the radioactive decay and the specific activity (expressed in cpm/pmol) of the probe. These mol/mm2 values were multiplied by the Avogadro number, and the final results were expressed in ISH copy no/mm2 units ± SEM. The quantitation steps can be summarized in the equation
y = (H×L)/(Kd+L)
where RES is the result (ISH copy number/mm2), LAB is the labeling intensity (net dlu/mm2), AVO is the Avogadro number (6.02252 × 10²³ copy number/mol), LRF is the labeling vs radioactivity factor [(net dlu/mm2)/(cpm/mm2)], RDF is the radioactive decay factor, and SPA is the specific activity of the probe (cpm/pmol).
Correction for the tissue background was performed by taking into account the specific activity of the cRNA probes. The screen background-corrected labeling value of a brain region hybridized with the antisense probe was converted to a RES value and then corrected for the average of the RES values of the same brain region hybridized with a similar concentration of the corresponding sense probe. The resulting net RES value (ISH copy no/mm2) was regarded as an estimate of the copy no/mm2 of the mRNA to be quantified.
Data Processing
Saturation curves were created and Hmax values were calculated with the computer software GraFit 3.0 (Leatherbarrow 1992). Hmax was defined as the maximal hybridization capacity of a single class of the target mRNAs (in cRNA ISH copy no/mm2 units) and was derived from saturation curves created with simple and robust weighting by using the equation
where y is the [35S]-cRNA probe hybridized (ligand bound; in ISH copy no/mm2 units), H is the capacity for hybridizing the cRNA probe [Hmax, in ISH copy no/mm2 units; analogous to the capacity for binding the ligand (Bmax)], Kd is the dissociation constant, and L is the concentration of the nonhybridized [35S]-cRNA probe (free ligand). In practice, saturation curves were created by plotting ISH copy numbers of hybridized cRNA in a 1-mm2 area of a selected brain region vs the concentration of the cRNA probe in the hybridization solution in fmol/ml units. The amount of probe bound in one section was determined to be less than 2.5% (at reasonable probe concentrations it was less than 1%) of the total amount of probe applied to the section (see Figure 3). Thus, saturation curves were created by using the total probe concentration instead of the free probe concentration.
Data reduction and linear regression were accomplished with the computer software Excel 7.0 (Microsoft; Redmont, WA). Analysis of significance was carried out with the two-tailed Student's t-test. ISH copy number/mm2 values of the same brain area determined by saturation and calculation were considered significantly different when p was less than 0.05.
Results
Linear Relationship Between Tissue Paste and Membrane Scales
Tissue paste and membrane standards were co-exposed to the storage phosphor screen, the resulting images were then quantified, and the signal intensity values were plotted against radioactivity, as shown in Figure 1. Regression analysis resulted in the equations yb = abx for the brain paste standard and ym = amx for the membrane standard, where x is the radioactivity (cpm/mm2), y is the signal intensity (net dlu/mm2), and ab (= 5872.51) and am (= 3612.17) are the slopes of the brain paste and membrane standard graphs, respectively. In consequence of the wide linear dynamic range offered by the storage phosphor screen technology (Amemiya and Miyahara 1988; Ito et al. 1995), linear regression analysis of the data points spanning the labeling intensity range of the brain areas exhibited correlation coefficients r2>0.999. The knowledge of the relationship between the membrane and tissue-based standards (ab/am = 1.6258) rendered the use of brain paste scales unnecessary in subsequent exposures. Furthermore, the linearity of the relationship allowed a simple and exact conversion of dlu/mm2 values to cpm/mm2 values.
Control Experiments for In Situ Hybridization
The specificity of the CaM I, II, and III cRNA probes was verified previously by Northern blotting analysis (Palfi et al. 1999). Hybridization with medium concentrations of sense probes resulted in very low labeling (see Figures 6D-6F). Pretreatment of sections with RNase A resulted in a complete loss of the measurable signals (not shown).
Saturation of Brain Areas: Hmax
Determination of the Hmax values of brain areas by hybridizing a large number of sections with subsaturating concentrations of probe requires the establishment of Hmax values of selected brain regions by saturation hybridization experiments on a limited number of sections. Careful selection of the appropriate areas to be quantified in saturation experiments is a crucial issue. To minimize the amount of probe used for saturation, it is suggested that regions be chosen that display only minor alterations within a feasible range of the rostrocaudal axis of the brain, so as to facilitate the cutting of similar serial coronal sections. Selected areas must exhibit hybridized cRNA values covering a range as wide as possible (encompassing the hybridized cRNA values of all the brain areas to be quantified later by the calculation of Hmax) and distributed evenly within this range (to facilitate linear fitting).
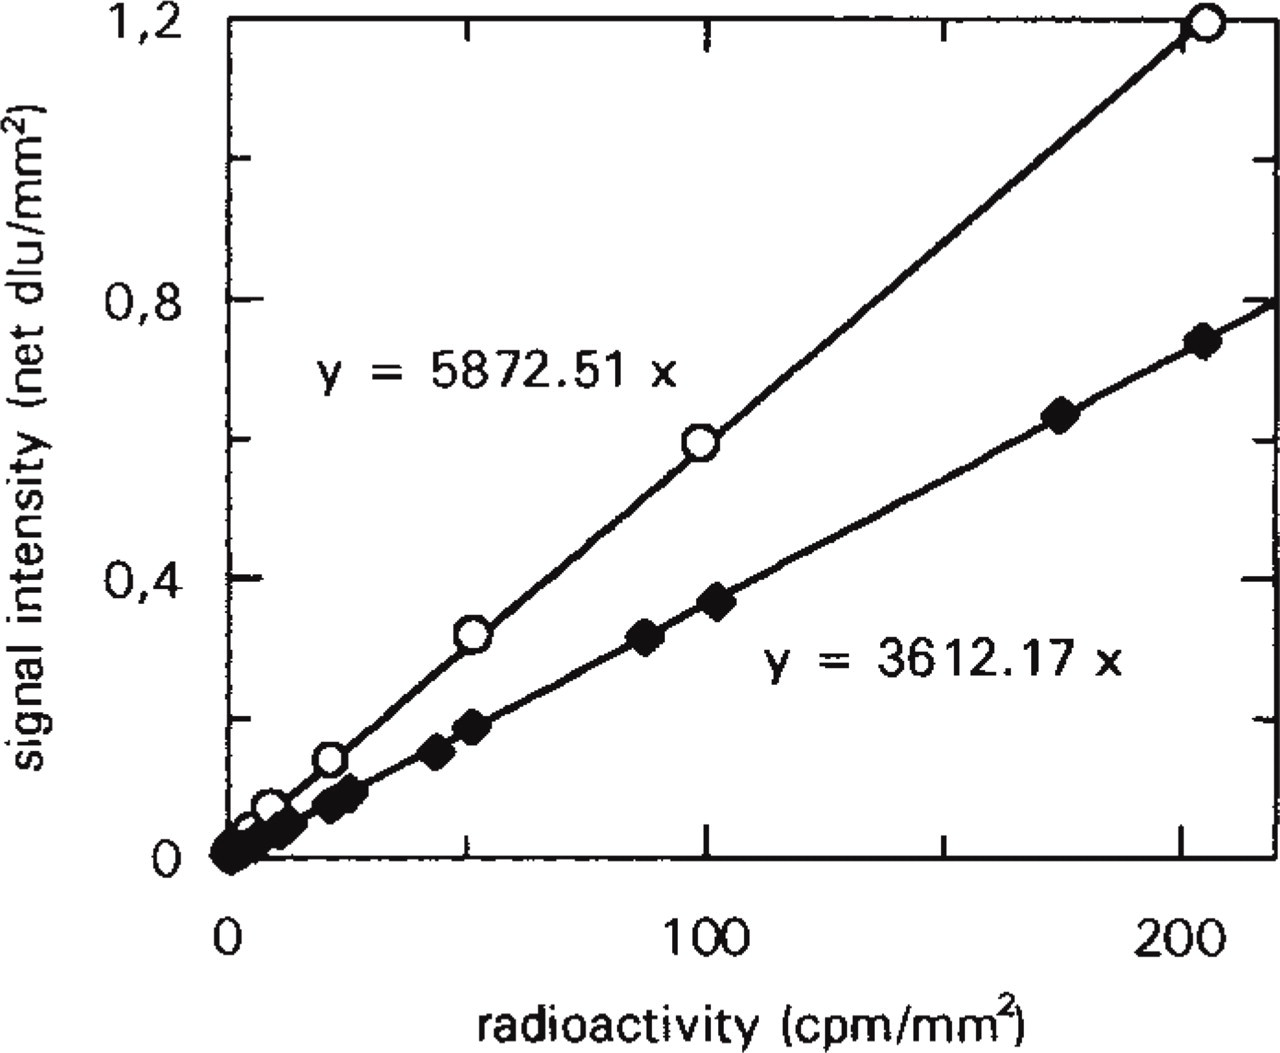
Calibration of membrane standard scale to brain paste standard scale. Membrane and tissue paste standards were co-exposed to a storage phosphor screen at RT for 24 hr. Digital images of standards were quantified in dlu/mm2 units and corrected for the screen background. Each data point is the average of the results of four separate measurements. Bars indicating the standard error of the mean (SEM) are contained within point symbols. Linear regression resulted in correlation coefficients of r2>0.999 for each scale. Data point symbols: brain paste (○), membrane (♦).
Brain areas fulfilling these criteria were chosen and serial (approximately halving) dilutions of antisense and sense [35S]-cRNA probes for CaM I, II, and III mRNAs were hybridized with the sections (Figure 2). Because the amount of the probe bound to the section was found to be less than 2.5% (at reasonable probe concentrations it was even less than 1%) of the total amount of the probe applied to the section (Figure 3), the total probe concentration was used for the creation of saturation curves, instead of the free probe concentration. In the digital images of the sections, selected brain regions were outlined and measured and saturation curves were created for them by plotting tissue background-corrected hybridized cRNA values against probe concentration (Figures 4A–4C). The saturation curves were then used to determine the Hmax values of the regions. Because multiple target CaM mRNA sequences were of medium to high abundance in the adult rat brain, high probe concentrations were needed for saturation. This often resulted in disproportionately heavy and patchy labeling of the sections hybridized with the highest concentration of probe (Figure 2), possibly in consequence of the physical sticking of the probe to the sections. Therefore, the determination of Hmax values only from measurements on saturated sections might well have led to biased results.
Transformation of Saturation Data
For the calculation of Hmax values of areas from hybridized cRNA values obtained from hybridization at a lower probe concentration, it was necessary to examine whether or not the Kd values of the saturation curves corresponding to different brain areas differed. None of the Kd values of the saturation areas was found to differ from the others at a significance level of 0.01 (two-tailed Student's t-test). At a significance level of 0.05, only one brain area, the lateral habenula (LHb), hybridized with the CaM I cRNA exhibited a Kd different from those of three brain regions (CA1, DG, and VPL+VPM; for abbreviations of brain areas see the legend to Figure 6), hybridized with the same riboprobe. Interestingly, in a repeated experiment, no Kd differed from the others at a significance level of 0.05. Therefore, we accepted that Kd was identical in the different brain areas, and defined Kav as the average of the Kd values for the brain areas hybridized with the same probe.
The constancy of Kd has important implications: with the use of Kav instead of Kd values and for a given L probe concentration, the equation used for saturation data fitting (see Materials and Methods)

can be rearranged for brain areas (1, 2, …, n) in the form

Thus,

that is, the ratios of the hybridized cRNA values of different brain areas are identical with the ratios of the corresponding Hmax values at any L probe concentration. This justifies the estimation of Hmax from measured hybridized cRNA values.
This estimation can readily be performed by rearranging equation (1) into the linear form

and multiplying the measured hybridized cRNA value (y) by the slope of the linear graph (Kav+L/L). However, use of this theoretically calculated slope of the Hmax vs hybridized cRNA graph gives less precise estimations (data not shown) than use of the slope of a similar graph based on experimentally determined Hmax and hybridized cRNA values. Such graphs corresponding to the probe concentrations used in saturation experiments can be created by plotting Hmax values vs hybridized cRNA values measured in saturation experiments (Figures 4D–4F). The correlation coefficients of these experimentally determined calibration graphs remain high even at lower probe concentrations (Figure 5), allowing precise estimations of Hmax by measurements from a hybridization at a medium to low probe concentration.
Calculation of Hmax Using Data from Hybridizations at Subsaturating Probe Concentrations
To test the method of calculating Hmax, hybridizations were performed on rat brain coronal sections cut in the same plane as previously, but this time with a single, lower probe concentration (Figure 6). In the images of the sections, the same brain regions were quantified as above. Hmax values (determined previously in saturation experiments) were plotted vs the hybridized cRNA values, resulting in calibration lines (Figures 7A–7C) corresponding to the probe concentration. Hmax for a brain region was then simply calculated by multiplying the hybridized cRNA value of the brain region by the slope of the calibration graph.
The accuracy of the estimation method was checked by creating separate calibration graphs for each particular brain area quantified in the saturation experiments by omitting the data point corresponding to the brain area from the fitting of the calibration line. Calculated Hmax values provided good estimations for the corresponding Hmax values derived from saturation experiments (Figures 7D–7F).
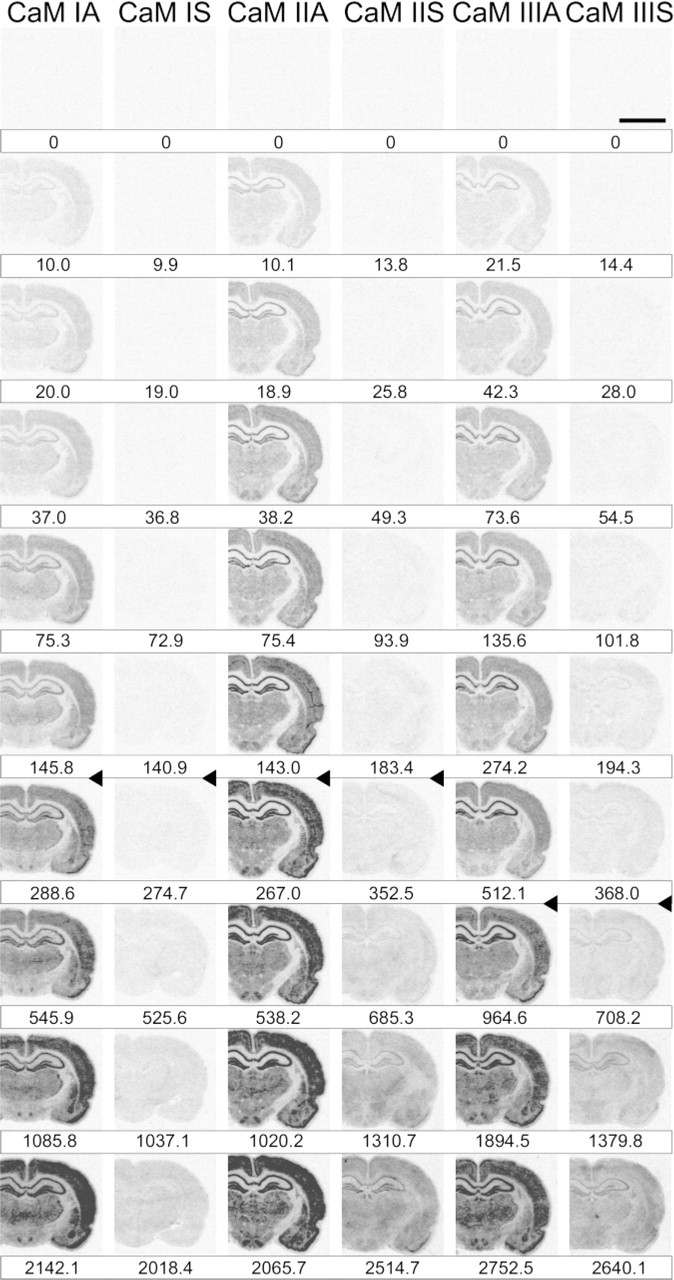
Representative images of rat brain sections from saturation ISH experiments. Serial coronal cryostat sections of rat brain (cut at bregma 3.14–3.6, according to Paxinos and Watson 1986) were hybridized with approximately halving dilutions of antisense and sense [35S]-cRNA probes for multiple CaM mRNAs. The probe concentration was determined by LSC and is presented under the corresponding image in fmol/ml units. CaM IA, [35S]-CaM I antisense riboprobe; CaM IS, [35S]-CaM I sense riboprobe; CaM IIA, [35S]-CaM II antisense riboprobe; CaM IIS, [35S]-CaM II sense riboprobe; CaM IIIA, [35S]-CaM III antisense riboprobe; CaM IIIS, [35S]-CaM III sense riboprobe; n (number of saturation experiments) = 3 for each riboprobe. Arrowheads indicate the positions of the concentrations of the probes hybridized with the sections from the corresponding nonsaturating ISH experiments presented in Figure 6. The brain areas quantified are indicated in Figure 6. Bar = 5 mm.
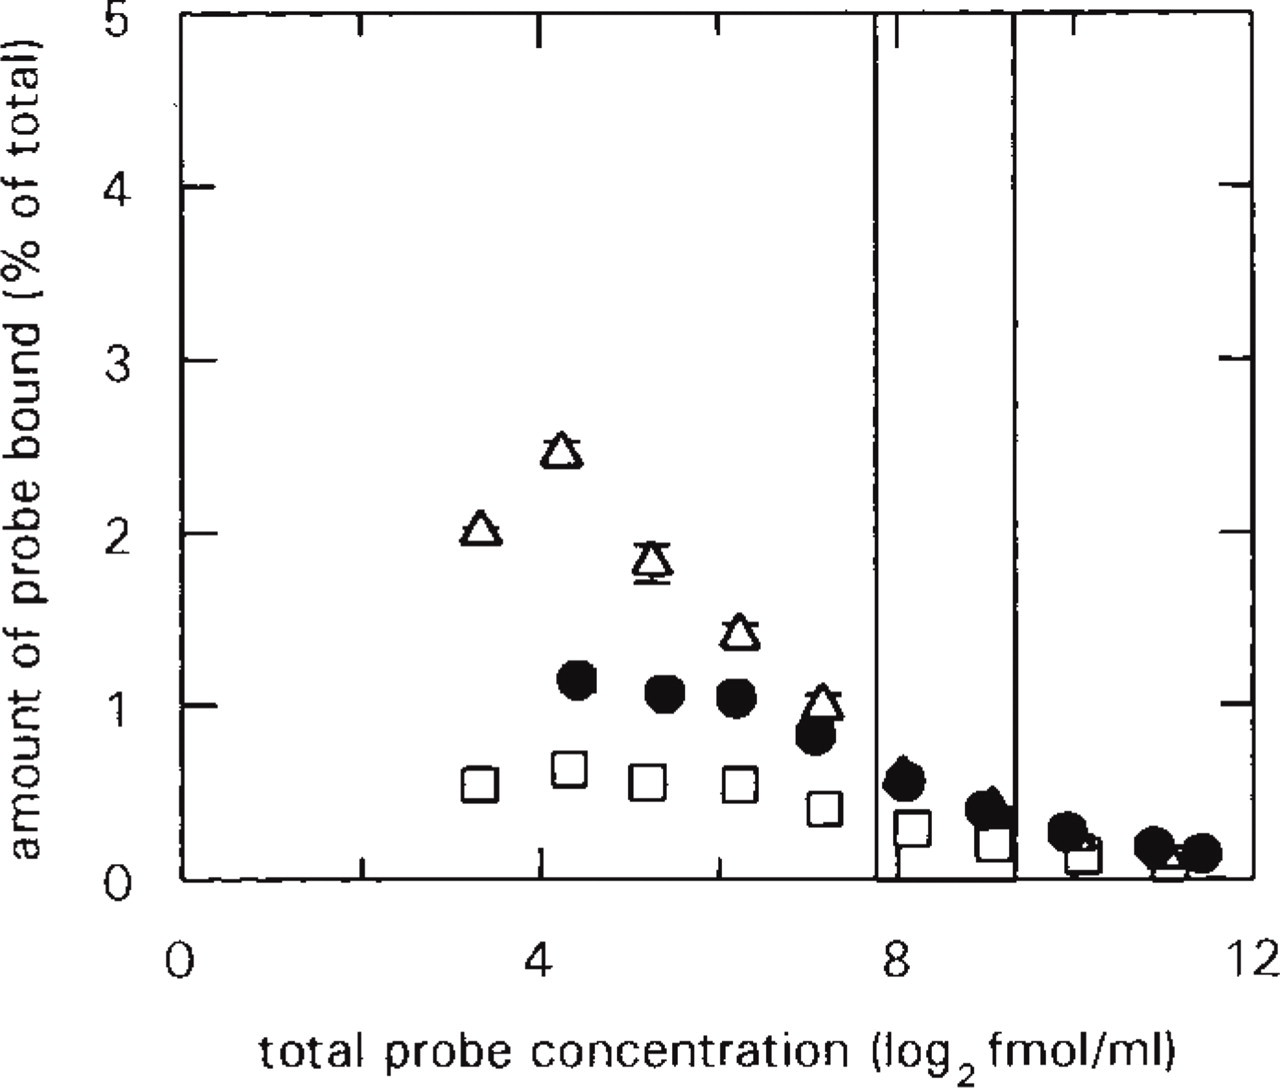
Quantities of CaM I (□), CaM II (Δ), and CaM III (•) [35S]-cRNA probes bound to the sections as a function of the probe concentration employed. The images of the sections from saturation hybridization experiments (Figure 2) were outlined and screen background-corrected labeling (net dlu/mm2) and section area (mm2) values were determined. Net dlu/mm2 values were converted to bound probe ISH fmol/mm2 values (see Materials and Methods) and then multiplied by the corresponding section area value. Because of the wide linear dynamic range of phosphor screens (Figure 1), the resulting ISH fmol values reflected real quantities of probe bound to the section. This ISH fmol value was expressed as a percentage of the total amount of probe (in fmol) applied to the section and was plotted against the total probe concentration employed. In consequence of the difference between ISH fmol and fmol units, the percentage values are presumably underestimations (see Discussion). The two vertical lines border the range encompassing probe concentrations employed in subsequent hybridization experiments in which medium cRNA-probe concentrations were applied. Bars indicate SEM; n = 3 for each data point.
Hmax values for brain areas not quantified in saturation experiments and having hybridized cRNA values within the range quantified in the saturation experiments can be calculated in the same way as described above.
Summary of the Method
1. Determination of Hmax values for selected tissue areas
1.1. Calibration of membrane standards to tissue-equivalent radioactivity in the signal range determined by the labeling values of the tissue areas to be quantified (Figure 1)
1.2. Selection of appropriate areas for saturation experiments and cutting of serial sections encompassing the selected areas
1.3. Preparation of serial (halving) dilutions of the probe, ensuring saturation of the target sequences
1.4. Hybridization of serial sections with serial dilutions of the probe
1.5. Exposure of hybridized tissue sections to the autoradiographic medium (together with membrane standards, when the autoradiographic signal detection system does not ensure a linear relationship between the radioactivity and the signal intensity, e.g., in film or photoemulsion autoradiography)
1.6. Detection of autoradiographic signals (Figure 2) and the creation of saturation curves for tissue areas by plotting hybridized cRNA values vs probe concentrations (Figures 4A–4C)
1.7. Determination of Hmax values by using appropriate computer software
1.8. Linearization of the saturation data by plotting Hmax values vs hybridized cRNA values (Figures 4D–4F)
1.9. Examination of the goodness of fit of the data points to the lines (Figure 5) to determine the probe concentration range allowing precise Hmax estimation.
2. Calculation of Hmax values for tissue regions
2.1. Cutting of sections from the same tissue
2.2. Hybridization of sections with a medium concentration of the same probe
2.3. Co-exposure of hybridized tissue sections and membrane standards to the autoradiographic medium
2.4. Detection of autoradiographic signals (Figure 6) and measurement of the hybridized cRNA values of the tissue areas to be quantified
2.5. Creation of the calibration graph by plotting Hmax values vs the hybridized cRNA values (Figures 7A–7C) corresponding to the medium probe concentration employed
2.6. Calculation of Hmax values for tissue areas (with hybridized cRNA values within the range quantified in the saturation experiments) by multiplying their hybridized cRNA values by the slope of the calibration curve (Figures 7D–7F).
Discussion
Recognition of the significance of alterations in gene expression requires the simultaneous localization and quantitation of nucleic acid sequences in tissues. The technique that is most promising as concerns acquisition of an answer to this commonly faced and technically demanding problem is quantitative ISH. To make a further improvement to the methodology of this powerful technique, we devised a simple and economical procedure for the simultaneous estimation of Hmax values for several areas in a heterogeneous tissue from hybridization data obtained at a subsaturating probe concentration.
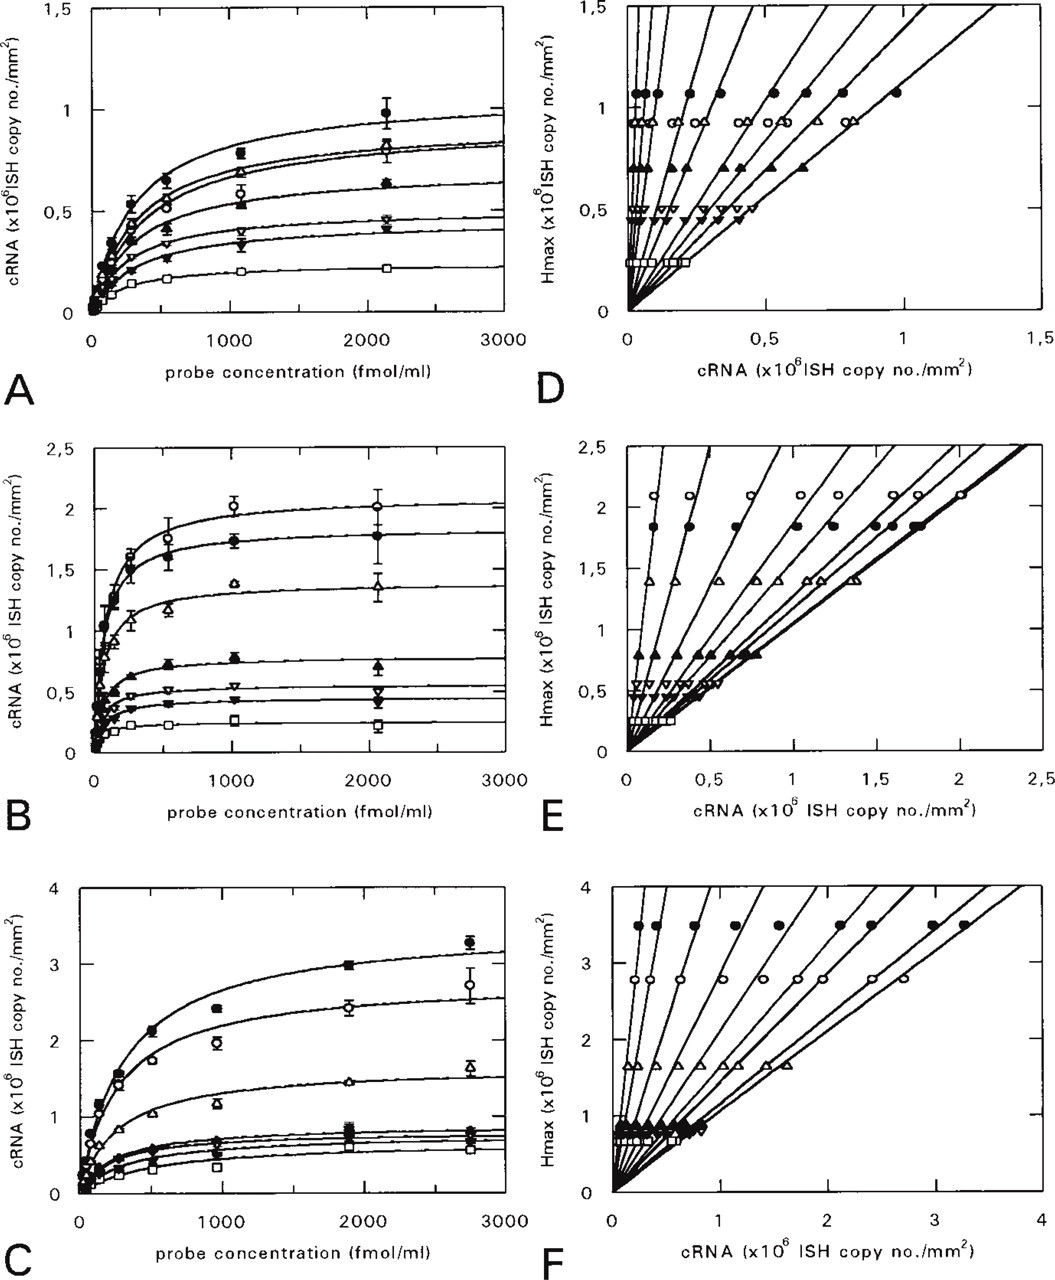
Saturation curves for selected brain areas. In digital images of serial sections, selected brain areas (indicated in Figure 6) were outlined and quantified. Tissue background-corrected hybridized cRNA values were plotted as a function of the total probe concentration (see Materials and Methods). The saturation curves were fitted to the data points and Hmax values were determined (with SE typically less than 5%) by using the computer software GraFit 3.0. (
Saturation of Areas in a Nonhomogeneous Tissue
By using the method presented above, we demonstrated that, under the experimental conditions we applied, the ratios of the hybridized cRNA values of different areas are constant, i.e., the accessibility of the mRNAs present in different regions of the tissue does not change as a function of the probe concentration (provided that the hybridization time is not a limiting factor). This allows use of the same calibration curve for each region in calculations of Hmax. Large differences in the permeability of different cell types, jeopardizing exact quantitation, are revealed by additional control experiments in which it is examined whether hybridization with a general probe, such as poly(U), labels all cells to a similar extent, or whether the ratios of the extents of labeling of the different regions under various fixation/proteinase digestion conditions are constant (Angerer et al. 1987).
Hmax Calculation Method
In pharmacology, an exact determination of the binding capacity is achieved through the use of purpose-designed software rather than different forms of linearization of dose–effect curves (Ross 1991). Application of such software in quantitative ISH to determine Hmax in the quantification of abundant transcripts can be more advantageous than measurements at the saturating probe concentration, because (a) hybridized cRNA values reach the theoretical value of Hmax at infinite probe concentration, and measurements performed at any probe concentration therefore inevitably underestimate Hmax, and (b) precise measurements may be compromised at very high probe concentration by the physical sticking of the probe into the section.
For the estimation of predetermined Hmax values from measurements at a lower probe concentration, an arbitrarily chosen quasi-linear part of the saturation curve was accepted as a calibration line in previous studies (Nunez et al. 1989). Here, we have verified that the Kd values of different brain areas hybridized with the same CaM probe are not significantly different. As a consequence, the ratios of the hybridized cRNA values of areas in a tissue measured at any sub-saturating probe concentration reflect the real ratios of the corresponding Hmax values (a rule presumed but not validated in many previous studies concerning the relative quantitation of changes in mRNA abundance through the use of normalized data), which permits the use of measurements made at any reasonable probe concentration for the estimation of Hmax. We used Hmax vs hybridized cRNA calibration graphs based on experimental data for the calculation of Hmax and tested this method successfully. The Hmax values calculated from the hybridized cRNA values measured in ISH experiments involving the use of radiolabeled riboprobes for CaM I, II, and III at medium concentration exhibited a good correlation with those obtained from saturation experiments. Hmax values expressed in cRNA ISH copy no/mm2 units displayed a region-specific expression pattern characteristic of the multiple CaM genes in the rodent brain, as previously demonstrated (Solà et al. 1996; Palfi et al. 1999).
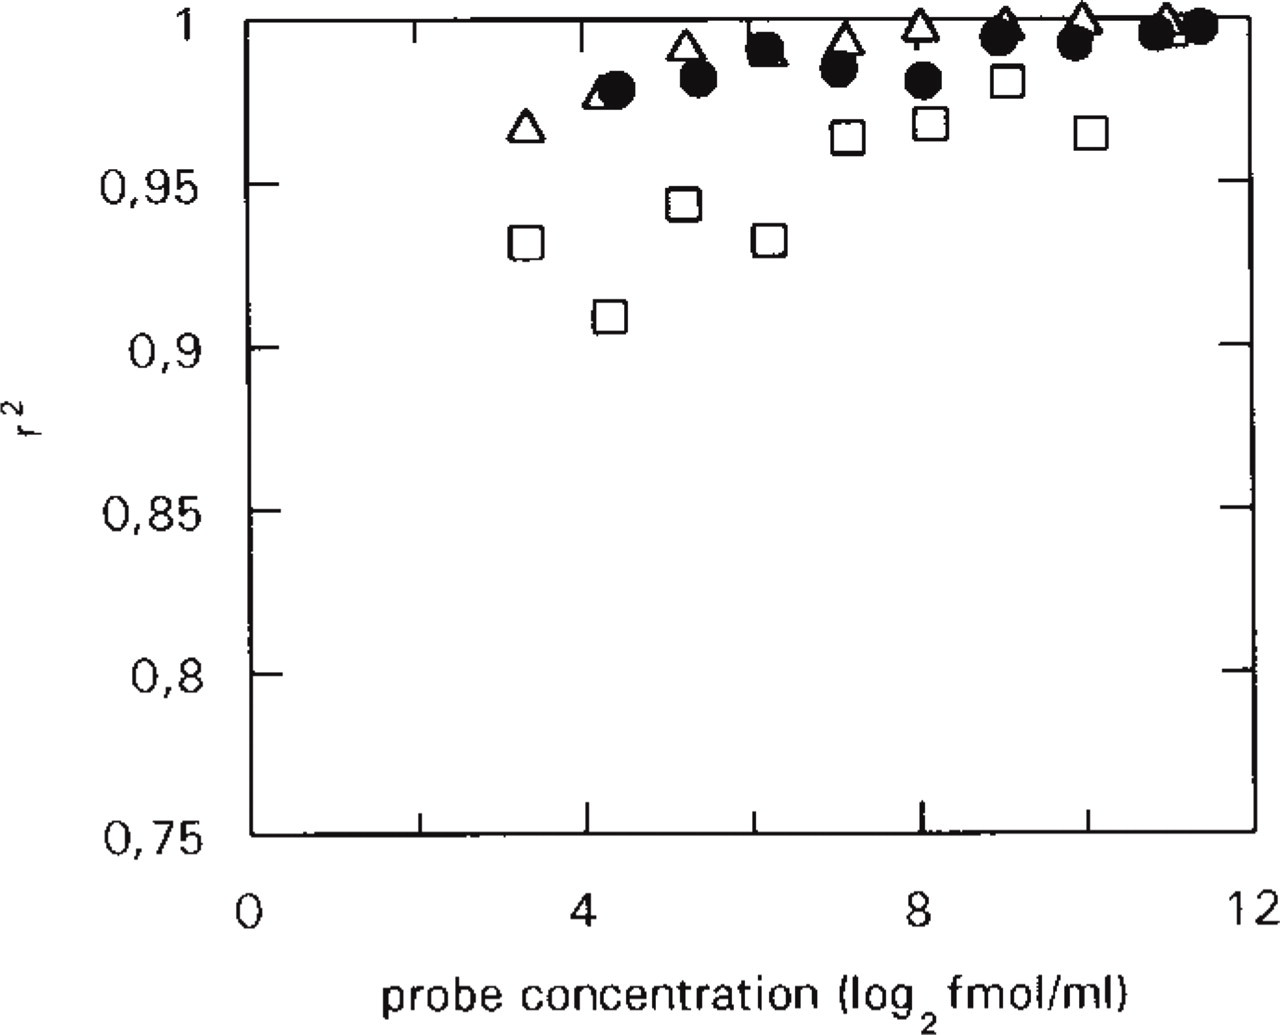
Implications derived from the linearized saturation data. Correlation coefficients (r2) of all lines fitted to linearized saturation data as a function of the probe concentration. CaM I (□); CaM II (Δ); CaM III (•). The data points show that the goodness of fit does not change significantly as a function of the probe concentration.
Probe Copy Numbers and mRNA Abundance
Abundance of the target mRNA is estimated by hybridization methods, such as Northern blotting and ISH. However, use of these methods for the estimation of in vivo copy numbers necessitates several presumptions. (a) First, calculation of the specific activity of a [35S]-UTPαS-labeled riboprobe requires the assumption that the RNA polymerase incorporates labeled and unlabeled nucleotides at the same rate (this is not valid for [35S]-UTPαS-labeled riboprobes [Angerer and Angerer 1992], although the difference is generally ignored). (b) Conversion of the hybridization signal to cpm values is performed by means of a radioactive scale. Use of a tissue paste scale requires the assumption that sections of the same thickness cut from a tissue and its paste have the same quenching properties for 35S. (c) For conversion of the cpm values to ISH-detected molar quantities of the riboprobe, the ratio of the labeled and unlabeled nucleotides in the hybridizing segments of the antisense probe must be the same before and after the hybridization, for the totality of the probes. This can be presumed only if the labeled nucleotides do not convert to unlabeled ones during the hybridization by releasing their label and if the labeled and unlabeled nucleotides are digested by RNase with the same probability. The molar quantity of the probe (calculated by dividing the cpm value by the specific activity of the probe) can then be expressed as an ISH-detected maximal cRNA copy number (Hmax in ISH copy numbers).
This copy number is inevitably smaller than the in vivo copy number and does not correspond to any real subset of it. The in vivo target sequences fall into two categories: sequences not detectable at all by hybridization (lost during the steps of tissue removal, fixation, embedding and ISH, by washing out and/or degradation) and sequences having detectable and non-detectable segments [hybridization of the latter can be prevented by secondary nucleic acid structures, by steric hindrance, e.g., by crosslinks of fixatives, or simply by their degradation (Lawrence and Singer 1985; Jilbert et al. 1986; Guiot and Rahier 1995)]. Thus, the sum of the lengths of the hybridizing segments of one target sequence is necessarily smaller than the length of the hybridizing segment of the antisense probe. In spite of this, the specific activity used for the calculation of ISH copy numbers refers to the length of the hybridizing segment of the antisense probe, resulting in an underestimation of the copy number of the hybridizing target mRNAs.
Despite the above-mentioned presumptions and the possibility of underestimation, there are significant advantages to the use of ISH copy number units. First, a precise correction for the tissue background can be made only by using molar quantities of probes. The performance of tissue background correction at the level of raw measurements (expressed in net dlu/mm2) or on the directly proportional data in cpm/mm2 units can result in negative background-corrected values for brain regions with low labeling when the specific activity of the sense probe is higher than that of the anti-sense probe. Then, the ISH-detected maximal copy numbers can be reproduced reliably by keeping the experimental conditions constant. This means that the ratios of the copy numbers detected by ISH, the copy numbers detected by Northern blotting, and the copy numbers of mRNAs present in vivo are constant, resulting in a constant ISH–Northern blotting calibration for a given probe–target mRNA–ISH protocol combination. The use of cpm or dpm values instead of ISH-detected maximal copy numbers would require a separate ISH–Northern blotting calibration for each ISH performed with a newly synthesized probe.
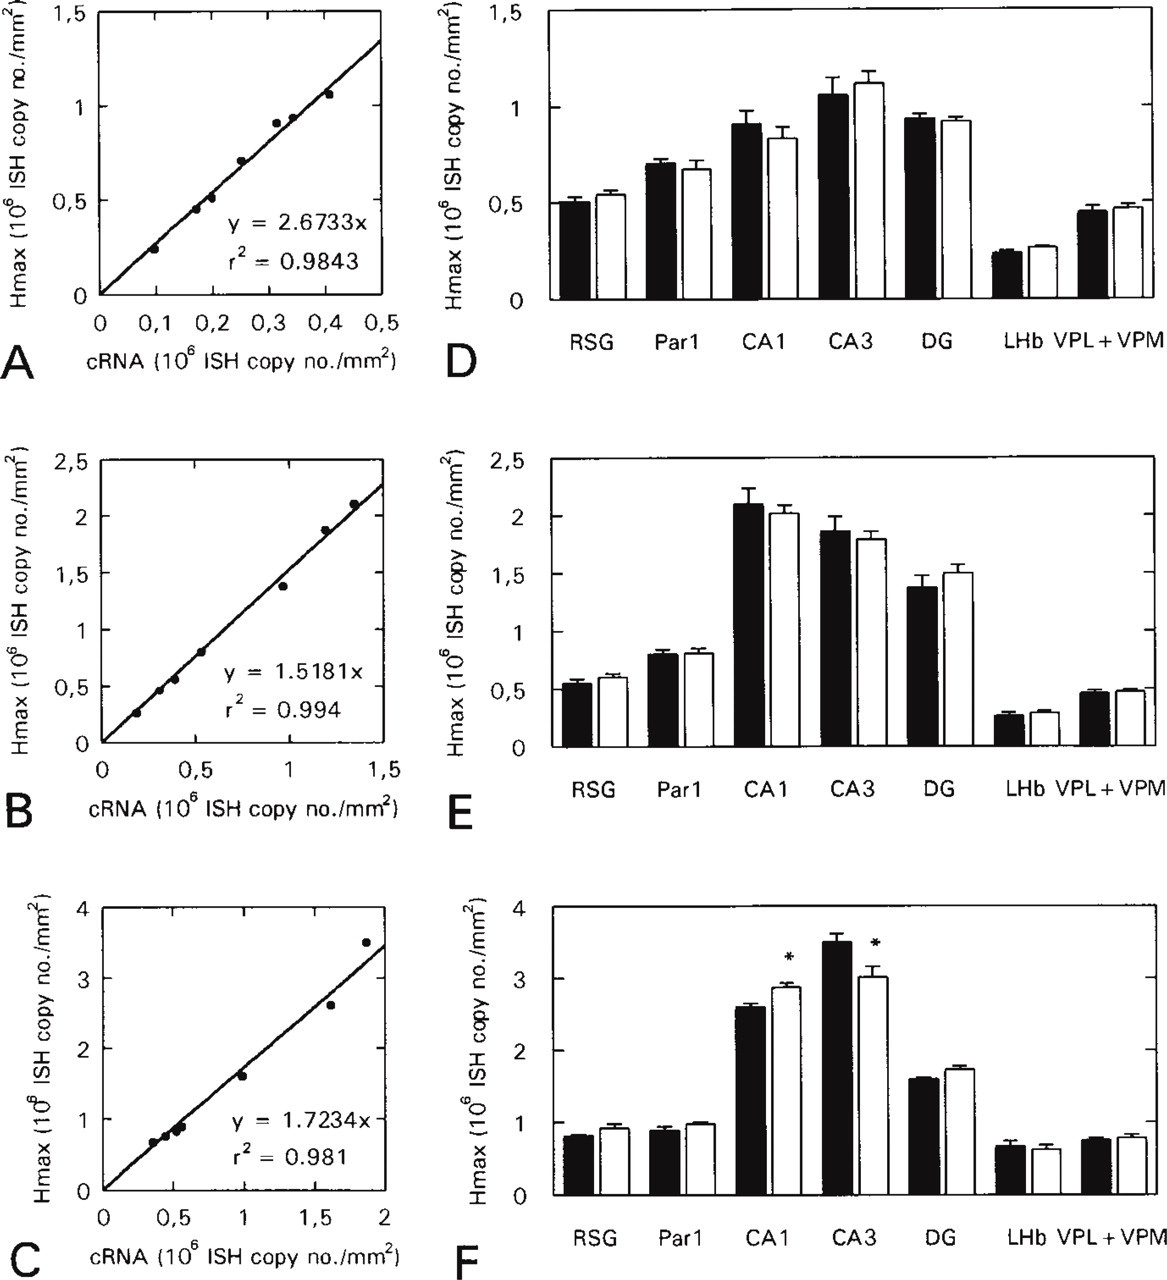
Calibration graphs for hybridizations with sub-saturating concentrations of CaM I (
In this study, the ISH copy numbers refer to an area unit (1 mm2 surface area of a 15-μm-thick section). Similarly to the ISH copy number, this area unit is also relative: it can not be simply converted to a volume unit (mm3) by multiplying it by a volume factor (in this case by (1 mm3/0.15 mm2 = 66.6 mm), because change of the section thickness would modify the ISH copy number (due to alterations in target mRNA loss and probe penetration).
To reduce the difference between ISH copy numbers and in vivo copy numbers, we attempted to minimize the loss of the target sequences by utilizing quick embedding, cryosectioning, formaldehyde fixation (demonstrated to ensure the best compromise between target mRNA retention and accessibility; Lawrence and Singer 1985), and short washes during fixation and ISH (to prevent the washing-out of target mRNAs). Nevertheless, until attainable Hmax values for regions of a heterogeneous tissue can be directly calibrated to mRNA amounts in regions determined by a more accurate, independent method, results similar to those presented here can be regarded only as estimations of real mRNA abundances.
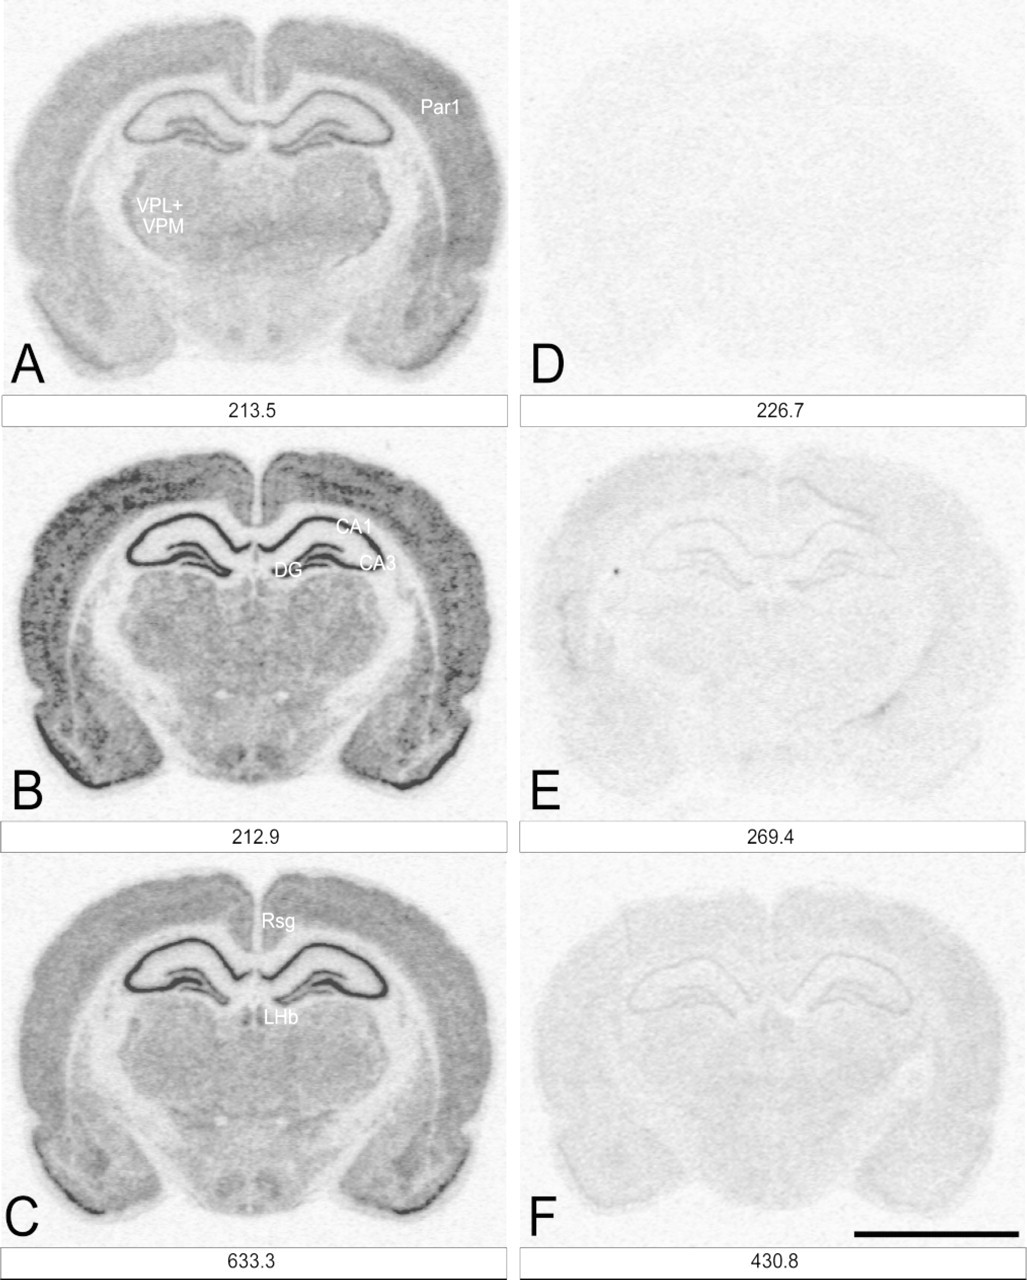
Representative images of rat brain sections from ISH experiments in which subsaturating probe concentrations were used. Coronal cryostat sections of rat brain (bregma 3.14–3.6) were hybridized with (
Generalization of the Method
In this article we have presented and, using CaM I, II, and III cRNA probes, tested a method for the simultaneous determination of the attainable Hmax values of several regions in a heterogeneous tissue. Because the basic principles of quantitation extend over methodological boundaries, this technique can be of use not only in ISH experiments, with the application of a variety of probes, tissues, and detection systems, but in other histological methods also.
Footnotes
Acknowledgements
Acknowledgments
Supported by grants from the National Scientific Research Fund, Hungary (OTKA T22822 to KG), and the National Council on Technical Development (OMFB 97-20-MU-0028 to KG).
We are grateful to Prof Laszlo Hatvani for his valuable comments on the manuscript. The skillful technical assistance of Ms Susan Ambrus is highly appreciated.