
Abstract
We describe a nonradioactive preembedding in situ hybridization protocol using digoxigenin-labeled RNA probes and tyramide signal amplification to increase the sensitivity of detection. The protocol is sensitive enough for electron microscopic localization of endogenous messenger RNAs encoding β-actin and amphoterin. Three visualization methods were compared: diaminobenzidine enhanced by nickel, Nanogold enhanced by silver and gold toning, and fluorescently labeled tyramides. Diaminobenzidine and Nanogold can be used in both light and electron microscopy. The nickel-enhanced diaminobenzidine was the most sensitive visualization method. It is easy to accomplish but a drawback is poor spatial resolution, which restricts its use at high magnifications. Nanogold visualization has considerably better spatial resolution and is therefore recommended for electron microscopy. Fluorescent tyramides, especially TRITC-tyramide, offer a good detection method for fluorescence and confocal microscopy. The methods were used to localize amphoterin and β-actin mRNAs in motile cells. Both mRNAs were found in the soma and cell processes. In double labeling experiments, β-actin mRNA localized to filamentous structures that also contained ribosomal proteins. Especially in the cortical cytoplasm, β-actin mRNA was associated with actin filaments. Direct localization to microtubules was only rarely seen.
Keywords
Subcellular compartmentalization of mRNA has been recognized as a mechanism for regulation of gene expression and protein sorting (Hesketh 1996; Nasmyth and Jansen 1997; Steward 1997; Gao 1998; Nung and Jan 1998). β-Actin mRNA is one of the best known examples. It locates in the leading edge of migrating cells (Lawrence and Singer 1986; Hoock et al. 1991) and in the growth cones of neurites in cultured neurons (Bassell et al. 1998). Targeting of the mRNA to the leading edge augments cell motility (Kislauskis et al. 1997), suggesting that localized protein synthesis is important for this cell function. Amphoterin was identified and cloned from rat brain as a molecule that binds heparin and promotes neurite outgrowth (Rauvala and Pihlaskari 1987). Amphoterin lacks a signal sequence, which suggests that it is synthesized in the cytoplasm outside the endoplasmic reticulum. The protein localizes to the cytoplasm and is particularly enriched at the leading edges of motile cells (Parkkinen et al. 1993) and at the filopodia and neurites in neuronal cells (Merenmies et al. 1991). The localization of amphoterin and β-actin proteins is therefore strikingly similar (Fages et al. 1997). Moreover, both mRNAs are found in the cell soma and growing cell processes in cultured neuroblastoma cells (Fages et al. 1997). It is possible that these cell motility-associated molecules are transported to the cell processes as mRNA and translated locally at the site at which the proteins are needed.
These recent findings have greatly added to the need for sophisticated electron microscopic localization methods for mRNA, which have not been widely available thus far. The ultrastructural localization of mRNA has mainly been limited by the low sensitivity of the methods described for in situ hybridization at the electron microscopic level. The specificity of mRNA localization is based on specific hybridization between the target and the complementary probe molecule (Gall and Pardue 1969). The sensitivity of detection and preservation of cell structure are dependent on several factors, including probe construction and labeling, conditions of hybridization, tissue fixation, pretreatments, embedding, and signal detection method. Le Guellec et al. (1992) compared ultrastructural in situ hybridization methods using preembedding and postembedding protocols as well as ultrathin frozen sections. They concluded that preembedding conserved the ultrastructure well but had poor resolution, whereas postembedding gave medium preservation but the lowest sensitivity. Frozen sections offered the highest sensitivity but suffered from poor ultrastructural preservation. Another drawback of the cryosection technique is that the orientation of cultured cells cannot be retained because no good methods exist for flat-embedding. This is particularly detrimental if cell processes and leading edges are to be studied, as is the case in the present study.
Here we describe a sensitive preembedding in situ hybridization protocol for β-actin and amphoterin mRNAs, both encoding cytoplasmic proteins that are synthesized outside the endoplasmic reticulum. β-Actin mRNA is abundant and expressed in practically all cell types and is widely used as a control in Northern blot hybridization. Amphoterin mRNA is mainly expressed in the developing nervous system and motile cells in culture (Merenmies et al. 1991; Parkkinen et al. 1993). The amount of amphoterin mRNA is about one fifth of the β-actin mRNA level in cultured cells (Fages et al. 1997).
Tyramide signal amplification (Bobrow et al. 1989) was recently introduced as a method to amplify signals in immunoelectron microscopy and in situ hybridization (Schöfer et al. 1997). It is based on the use of peroxidase activity to introduce labeled tyramide molecules to the reaction site. We have applied this amplification to enhance the sensitivity of detection. We used three signal detection methods: diaminobenzidine enhanced by nickel, ultrasmall gold enhanced by silver and gold toning, and fluorescent detection. Our method produced good sensitivity, spatial resolution, and ultrastructural preservation. We show localization of β-actin and amphoterin mRNA in the cell soma and processes and describe association of β-actin mRNAs with ribosomes and cortical actin filaments.
Materials and Methods
Cell Culture
Rat C6 glioma cells were cultured in Dulbecco's modified Eagle's medium (DMEM) containing 10% fetal calf serum at 37C in 5% CO2. For the experiments, the cells were plated on glass (light microscopy) or plastic (electron microscopy) Lab-Tek chamber slides (Naperville, IL) or on plastic Lab-Tek coverslips coated with laminin (Sigma; St Louis, MO) (10 μg/ml in PBS, overnight at 4C). The cells were plated in DMEM containing 1% bovine serum albumin 3-4 hours before fixation. These conditions were used to produce well-spread, motile cells having many processes. In some experiments, the cells were extracted with 0.1% Triton X-100 in extraction buffer (10 mM Pipes, pH 6.9, 0.3 M sucrose, 0.1 M NaCl, 3 mM MgCl2, 1 mM EGTA) for 60 sec at room temperature (RT) before fixation. This protocol removes the plasma membrane and most of the soluble cytoplasm, leaving the cytoskeleton intact, including the material that is associated with it (Lenk et al. 1977).
Probes
Linearized Bluescript plasmid containing the full-length coding region (650 BP) of rat amphoterin (Merenmies et al. 1991) or the Hinc II fragment (850 BP) of rat β-actin was transcribed in vitro using a DIG RNA labeling kit (Boehringer Mannheim; Mannheim, Germany). Incorporation of digoxigenin into the probes in the sense or anti-sense orientation was confirmed as instructed by the manufacturer. Some of the probes were partially hydrolyzed with sodium carbonate buffer to reduce the probe size.
In Situ Hybridization
The cell monolayers were fixed in 4% paraformaldehyde and 0.05% glutaraldehyde in 0.1 M Hepes buffer, pH 7.4, for 30 min at RT. In situ hybridization protocol was modified from Macville et al. (1995). After fixation, the cells were permeabilized in 0.1% saponin in PBS for 30 min at RT, then washed in PBS, and treated with 50 mM NH4Cl in PBS for 15 min. The hybridization solution contained 60% deionized formamide, 2 x SSPE, and 500 μg/ml yeast total RNA (Boehringer) or 200 μg/ml salmon sperm DNA (Boehringer). The probes were used at a concentration of 20 ng/ml and hybridization was carried out at 42C for 16 hr. The cells were then washed in 60% formamide, 2 x SSC three times for 10 min at 42C, in 1 x SSC twice for 15 min at RT, and finally in PBS twice for 15 min. Nonspecific protein binding sites were blocked with 10% skimmed milk powder or 0.5% blocking reagent (NEN Life Science Products; Boston, MA) in 0.1 M Tris, pH 7.4, 170 mM NaCl, 0.1% saponin (TBS-saponin) at RT for 60 min. Digoxigenin epitopes were detected with sheep anti-digoxigenin F(ab) fragments coupled to horseradish peroxidase (Boehringer), diluted 1:50-1:400 in the blocking solution for 60 min. The cells were then washed in TBS-saponin five times for 5 min. Visualization of the peroxidase activity was performed with one of the three alternative methods.
Detection Methods
Direct Visualization of Peroxidase with Diaminobenzidine. DAB (Sigma) was diluted to 150 μg/ml in 50 mM Tris, pH 7.5. Nickel ions were added to the solution as diammonium nickel(II)sulfate 6-hydrate (BDH; Poole, UK) at 6 mg/ml to increase sensitivity (Tago et al. 1986). Finally, H2O2 was added to the mixture at 0.0003%. The mixture was kept on the cells for 20 min to 16 hr. Color development was followed under an inverted light microscope and the reaction was stopped by rinsing with 50 mM Tris. The nickel-enhanced DAB signal was unstable in glutaraldehyde and Mowiol. Therefore, the samples were brought directly to osmium tetroxide postfixation (electron microscopy) or to dehydration in a graded series of ethanol, air-drying, and DPX-embedding (light microscopy).
Tyramide Signal Amplification. The cells were incubated in biotinylated tyramide (NEN Life Science Products) diluted 1:50 in amplification diluent (NEN Life Science Products) at RT for 4-10 min. For fluorescence microscopy, tyramide coupled to tetramethylrhodamine (TRITC) or fluorescein (FITC) was used. The cells were then washed in TBS-saponin three times for 5 min. After biotinyl-tyramide, the biotin epitopes were detected with (a) streptavidin-peroxidase (NEN Life Science Products) diluted 1:100, (b) streptavidin-Nanogold (1.4 nm gold) (Nanoprobes; New York, NY) diluted 1:300-1:400, or (c) streptavidin-fluorescein (NEN Life Science Products) diluted 1:400 in TBS-saponin containing 1% bovine serum albumin or 0.5% blocking reagent (NEN Life Science Products), at RT for 1 hr. The cells were then washed in TBS-saponin four times for 5 min. Peroxidase activity (a) was visualized with DAB as described above. After Nanogold incubation (b), the samples were fixed in 1% glutaraldehyde in 0.1 M phosphate buffer, pH 7.4 for 10 min. Nanogold was silver-enhanced with the HQ Silver kit (Nanoprobes) for 5-9 min once or twice and then toned with gold chloride (Liposits et al. 1982; Trembleau et al. 1994) to make the signal more stable for osmium tetroxide and irradiation. The cells were treated with 2% sodium acetate three times for 5 min, then with 0.05% gold chloride (Sigma) on ice in the dark for 10 min, and finally with a fresh solution of 0.3% sodium thiosulfate on ice in the dark twice for 10 min. The samples were then rinsed in distilled water and PBS and postfixed in osmium tetroxide. Samples for light microscopy were dehydrated, air-dried, and embedded in DPX. Samples for fluorescence microscopy (c) were embedded in Mowiol containing DABCO (Sigma) as an antifading agent.
Immunolabeling of Tubulin, Actin, and Ribosomal 60S Subunit
For double localization, TRITC-tyramide or Nanogold enhanced by silver and gold was first used for detection of mRNA. Cells extracted with Triton X-100 before fixation were used for electron microscopic experiments. In this case, the cells were fixed in 0.1% glutaraldehyde in 0.1 M phosphate buffer for 10 min before the silver enhancement step. After in situ hybridization, cytoskeletal filaments were labeled with monoclonal antibodies. Anti-tubulin (clone E7) was from Developmental Studies Hybridoma Bank (Iowa City, IA) and anti-actin was from Boehringer (clone C4) or Sigma (AC-15, anti-β-actin). Proteins of the ribosomal 60S subunit were labeled with a rabbit antibody kindly provided by Dr. John Hesketh (Horne and Hesketh 1990). The antibodies were diluted in 3% bovine serum albumin, 0.1% saponin in PBS (PBS-saponin) and incubated at RT for 1 hr. After washing in PBS-saponin, the antibodies were visualized with F(ab)2 goat anti-mouse-FITC or anti-rabbit-FITC (Jackson Immuno Research Laboratories; West Grove, PA). F(ab)2 goat anti-mouse 5-nm colloidal gold, or anti-rabbit 10-nm colloidal gold, (British BioCell; Cardiff, UK) was used for electron microscopy. After washing in PBS-saponin, the fluorescent samples were embedded in Mowiol+DABCO and the electron microscopic samples were fixed in 1% glutaraldehyde in 0.1 M phosphate buffer for 10 min before Epon embedding.
Epon Embedding
The cells were postfixed in 1% osmium tetroxide in 0.1 M phosphate buffer, pH 7.4, dehydrated in a graded series of ethanol, and flat-embedded in Epon. After dehydration, the cells were covered with a thin layer of Epon. The samples were then examined under an inverted microscope, and gelatin capsules filled with Epon were inverted to the monolayers on sites containing an adequate number of labeled cells. Thin sections were cut parallel to the culture substrate, mounted on single-slot copper grids, and stained with uranyl acetate and lead citrate.
Microscopy
The samples were examined and photographed under an Olympus AX-70 light microscope, a Zeiss Axiovert 135M inverted fluorescence microscope with BioRad MRC1024 confocal equipment, or a Jeol JEM 1200EX transmission electron microscope.
Results
Evaluation of the Detection Methods with Light Microscopy
Detection with Diaminobenzidine. β-Actin mRNA levels in spreading C6 cells were high enough to be detected by direct labeling with anti-digoxigenin-peroxidase followed by DAB incubation (Figure 1A). It was essential to use nickel ions in the DAB solution to enhance the signal (Tago et al. 1986). Cells labeled with the sense probe were completely negative (Figure 1B). Amphoterin mRNA levels were too low to be reliably visualized with this direct protocol.
Tyramide Amplification Followed by Streptavidin-Peroxidase and DAB or by Streptavidin-Gold. Tyramide was used to amplify the signals after hybridization with digoxigenin-labeled probe and labeling with anti-digoxigenin-peroxidase. Peroxidase activity causes covalent incorporation of tyramide (in this case biotinylated tyramide) molecules to the reaction site (Bobrow et al. 1989). Visualization of the bound biotin was then performed using either streptavidin-peroxidase followed by DAB (Figures 1C, 2A, and 2B), or streptavidin-Nanogold followed by silver enhancement (Figures 1D, 2C, and 2D. The amplification step greatly increased the sensitivity. For detection of β-actin mRNA, the DAB incubation time was shortened from overnight in the direct visualization (Figure 1A) to 25 min after a 10-min amplification with biotinyl-tyramide (Figure 1C). No background was detected with the β-actin sense probes (not shown). Amphoterin mRNA was also visible after tyramide amplification and a 40-min DAB incubation (Figure 2A). The samples hybridized with the amphoterin sense probe (Figure 2B) and those hybridized without any probe (not shown) started to develop some background after a 40-min DAB incubation. In DAB visualization, background can be avoided by monitoring the reaction under a light microscope.
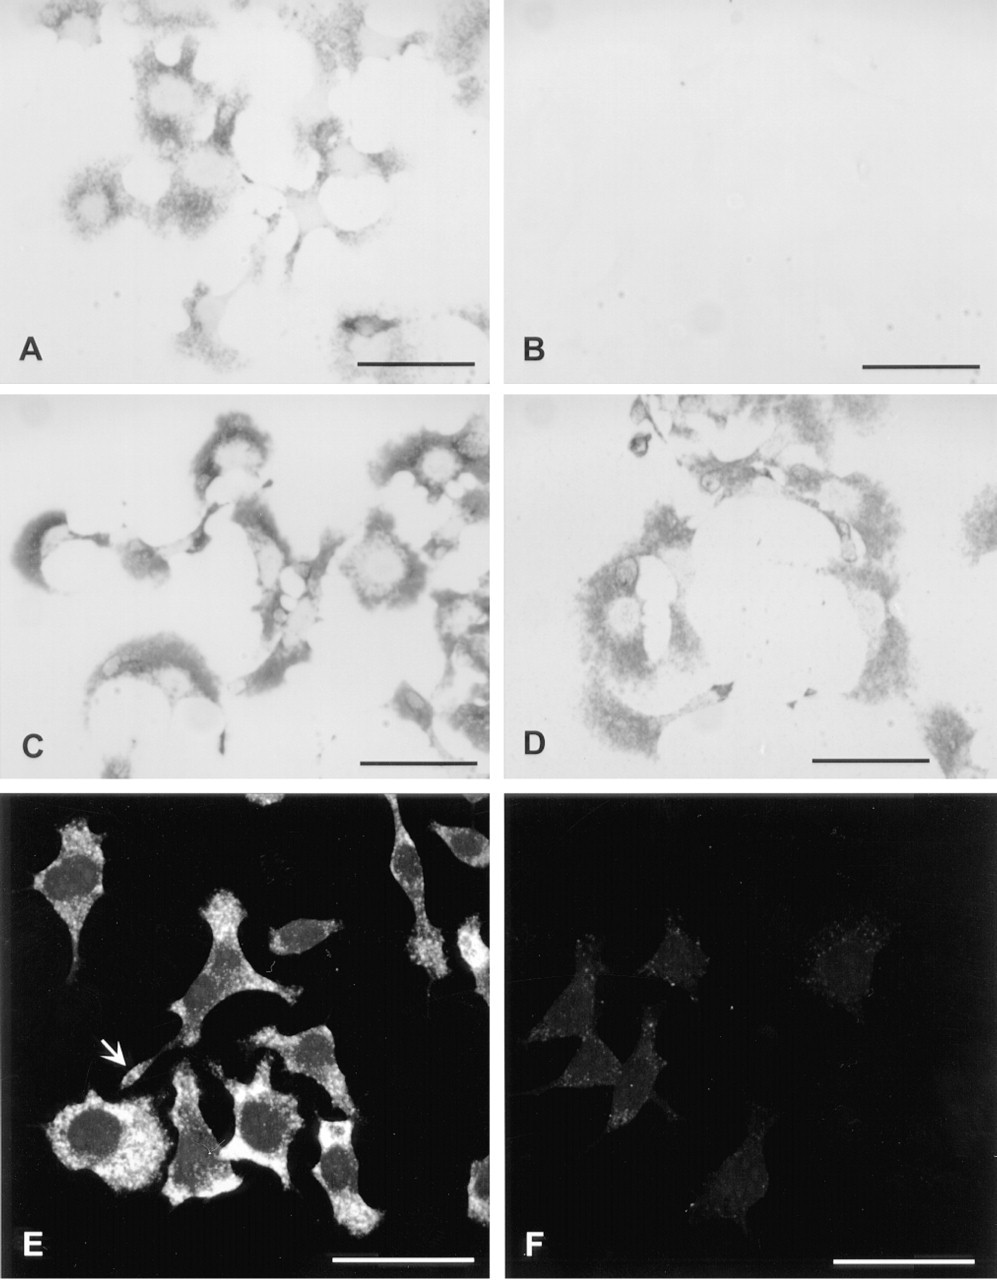
In situ hybridization of β-actin mRNA in C6 cells. The cells were hybridized with digoxigenin-labeled anti-sense (
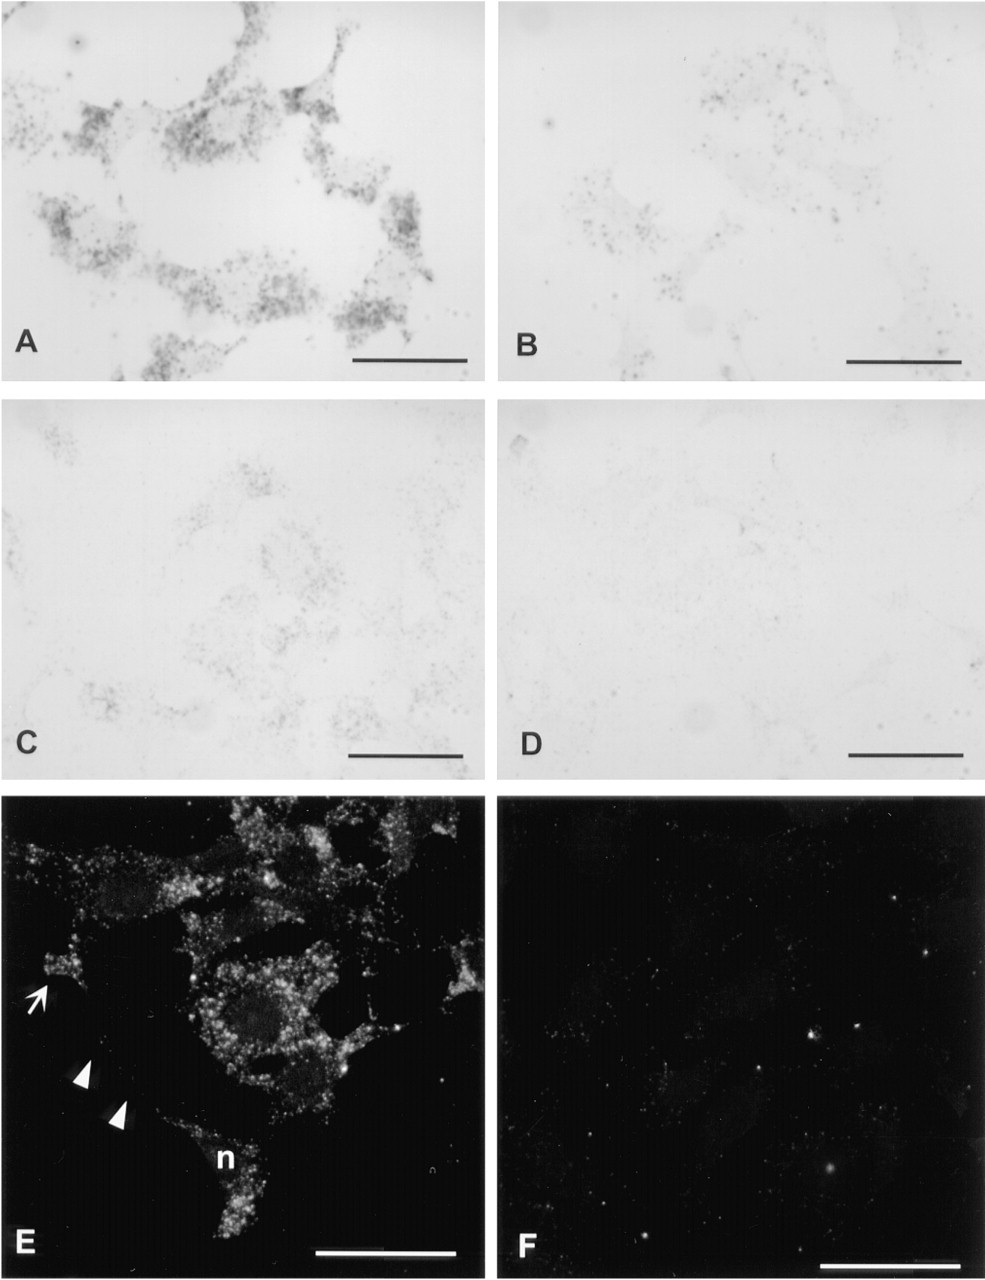
In situ hybridization of amphoterin mRNA in C6 cells. The cells were hybridized with digoxigenin-labeled anti-sense (
Visualization with Nanogold and silver enhancement, after tyramide amplification for 10 min, was not as sensitive as DAB and nickel. β-Actin mRNA was readily detectable (Figure 1D), but amphoterin mRNA was only weakly visible, even after repeated incubations with the silver-enhancement solutions (Figure 2C).
In conclusion, visualization with DAB and nickel can be recommended for light microscopic experiments. It is less expensive and simpler to perform than ultrasmall gold and silver enhancement. In addition, the development of color can be followed during DAB incubation and the reaction can therefore be stopped once the desired signal intensity has been reached or background starts to appear. In our experiments, the anti-digoxigenin-peroxidase conjugate was the most obvious source of background. This was evident after longer tyramide amplification (Figure 2B), both in cells hybridized with the sense probe and in cells treated identically but without any probe. No background developed if anti-digoxigenin-peroxidase was omitted.
Detection for Fluorescence Microscopy
Two protocols were tested: indirect labeling with biotinyl-tyramide followed by streptavidin-FITC, and direct labeling with FITC or TRITC-tyramide. Indirect labeling was the most sensitive method. Both β-actin (Figure 1E) and amphoterin (Figure 2E) mRNA were readily visible with this protocol, without background in cells hybridized with the sense probes (Figures 1F and 2F). However, a longer biotinyl-tyramide amplification was necessary to visualize amphoterin mRNA. In direct detection, only TRITC-tyramide gave signal for amphoterin mRNA. TRITC-tyramide is therefore more sensitive than FITC-tyramide. In addition, TRITC-tyramide gave a better spatial resolution. It produced well-structured granular label (Figure 5), whereas FITC-tyramide gave a more diffuse signal (not shown).
Electron Microscopy
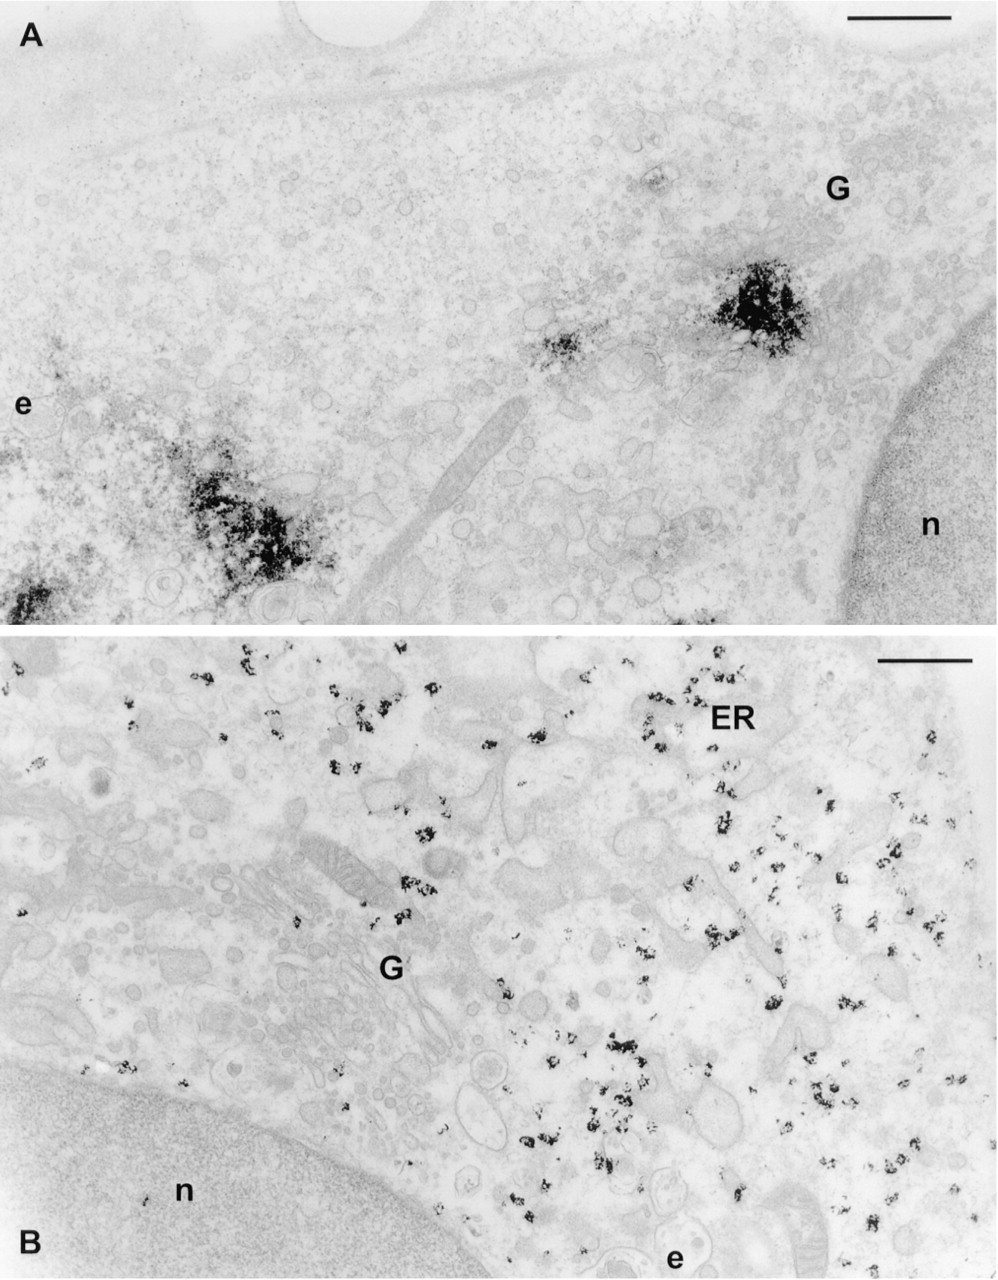
Visualization of the hybridized probes with DAB and nickel ions produced electron-dense precipitates that were visible as spots in the cytoplasm (Figure 3A). β-Actin was readily detectable without tyramide amplification (not shown), whereas a 10-min biotinyl-tyramide amplification step, followed by incubation with streptavidin-peroxidase, was necessary to reliably visualize amphoterin mRNA (Figure 3A). The ultrastructure of the cells, especially endoplasmic reticulum, endosomal vesicles, and the Golgi apparatus, was good (Figure 3A). Some of the mitochondria were partially swollen (not shown).
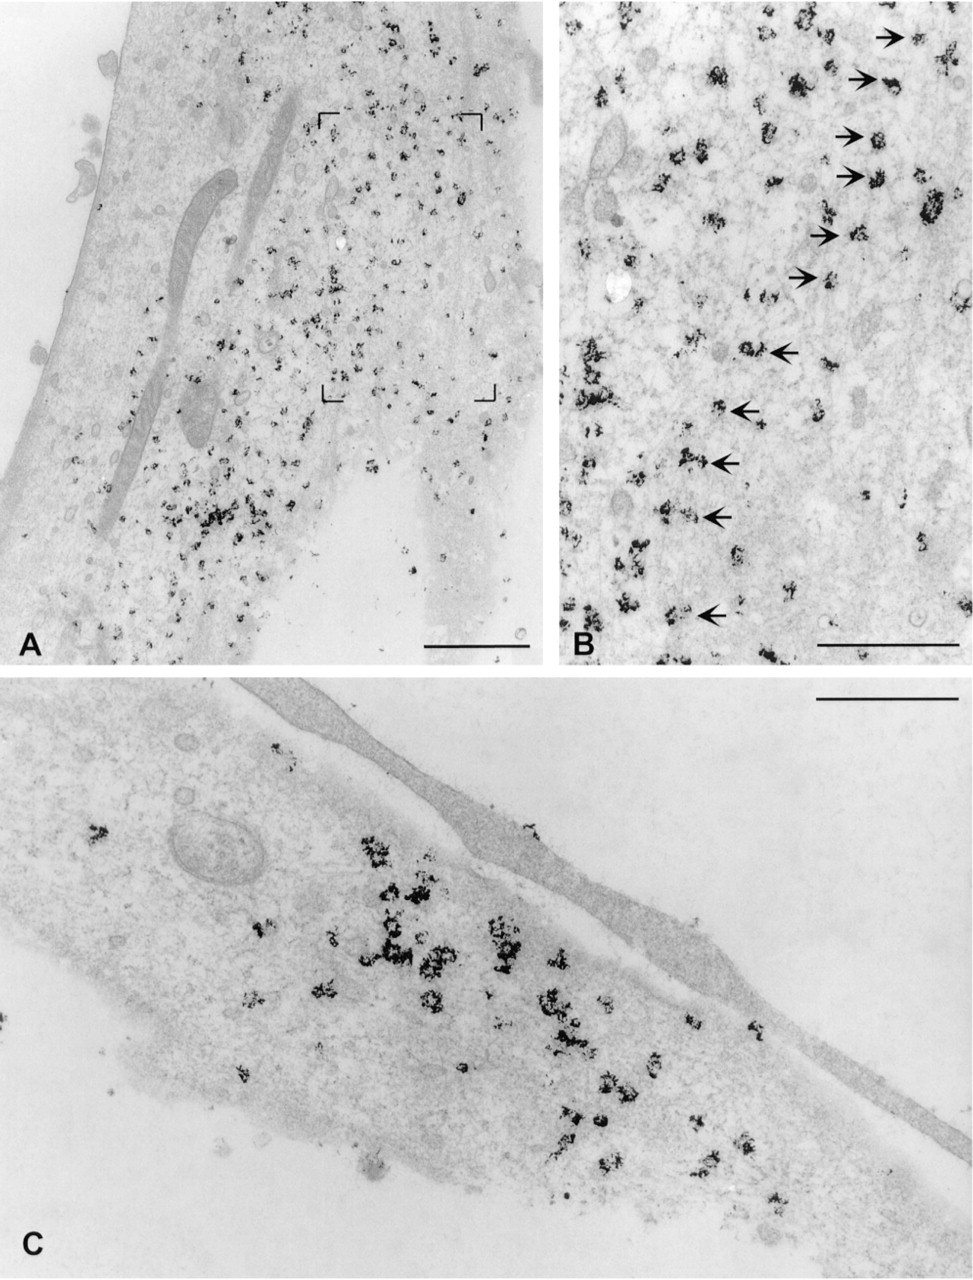
The use of ultrasmall gold (1-1.4 nm in diameter) is essential for penetration of the conjugates into cells if the use of drastic permeabilization methods is to be avoided to preserve the ultrastructure of membrane-bound organelles. Ultrasmall gold has the additional advantage of high sensitivity. Compared to 5- or 10-nm colloidal gold particles, it has been shown to markedly increase the sensitivity of labeling (Takizawa and Robinson 1994). Visualization of the hybridization signals with streptavidin coupled to 1.4-nm gold after biotinyl-tyramide amplification gave a good spatial resolution compared to DAB and nickel (Figures 3B and 4A-4C). β-Actin mRNA signals in particular occasionally formed rows (Figures 4A and 4B), suggesting that the mRNA is aligned along cytoskeletal filaments.
Silver enhancement is necessary for visualization of the ultrasmall gold in heavy metal-stained samples. Humbel et al. (1995) tested all commercially available silver enhancement kits and found the HQ Silver kit (that was used in our experiments) to be best suitable for electron microscopy. This kit is light-sensitive, which has the drawback that the development of enhancement cannot be followed under a light microscope. Unfortunately, the silver produced on the gold particles may be destroyed or displaced by the electron beam (Humbel et al. 1995). In our hands, the silver was often lost from the Epon sections even before observation in the electron microscope, leaving empty holes in the thin sections (not shown). To avoid this, we replaced the silver with gold according to the protocol of Liposits et al. (1982) as modified by Trembleau et al. (1994). The appearance of the resulting label was dependent on the length of the silver enhancement step before gold toning. Repeated silver enhancement, which was necessary to make the signal visible in the light microscope, produced small (about 40-80 nm in diameter) clusters of gold grains (Figures 3B and 4A-4C). Shorter silver enhancement produced smaller clusters that were not visible in the light microscope (Figure 6B).
In addition to producing larger gold clusters after gold toning, repeated silver enhancement also produced more intense labeling. This is probably due to the nonhomogeneous growth of ultrasmall gold particles in the silver enhancement step (Humbel et al. 1995). Relatively long enhancement appears to be necessary to enlarge all 1.4-nm particles to a visible size. The attempts to produce light microscopically visible silver particles in one enhancement step produced unspecific precipitation. We therefore chose to use a shorter silver enhancement and repeat it when necessary. The ultrastructural preservation of the cells after silver enhancement and gold toning steps was comparable to the structure seen after DAB detection (Figures 3B and 4A-4C).
In situ hybridization of amphoterin mRNA (
Localization of β-actin (
Subcellular Localization of β-Actin and Amphoterin mRNAs
Both β-actin and amphoterin mRNAs were found in the cell body and cell processes (Figures 1E, 2E, 3A, 3B, and 4A-4C). This is compatible with the role of both proteins in cell motility and process growth (Merenmies et al. 1991; Kislauskis et al. 1997).
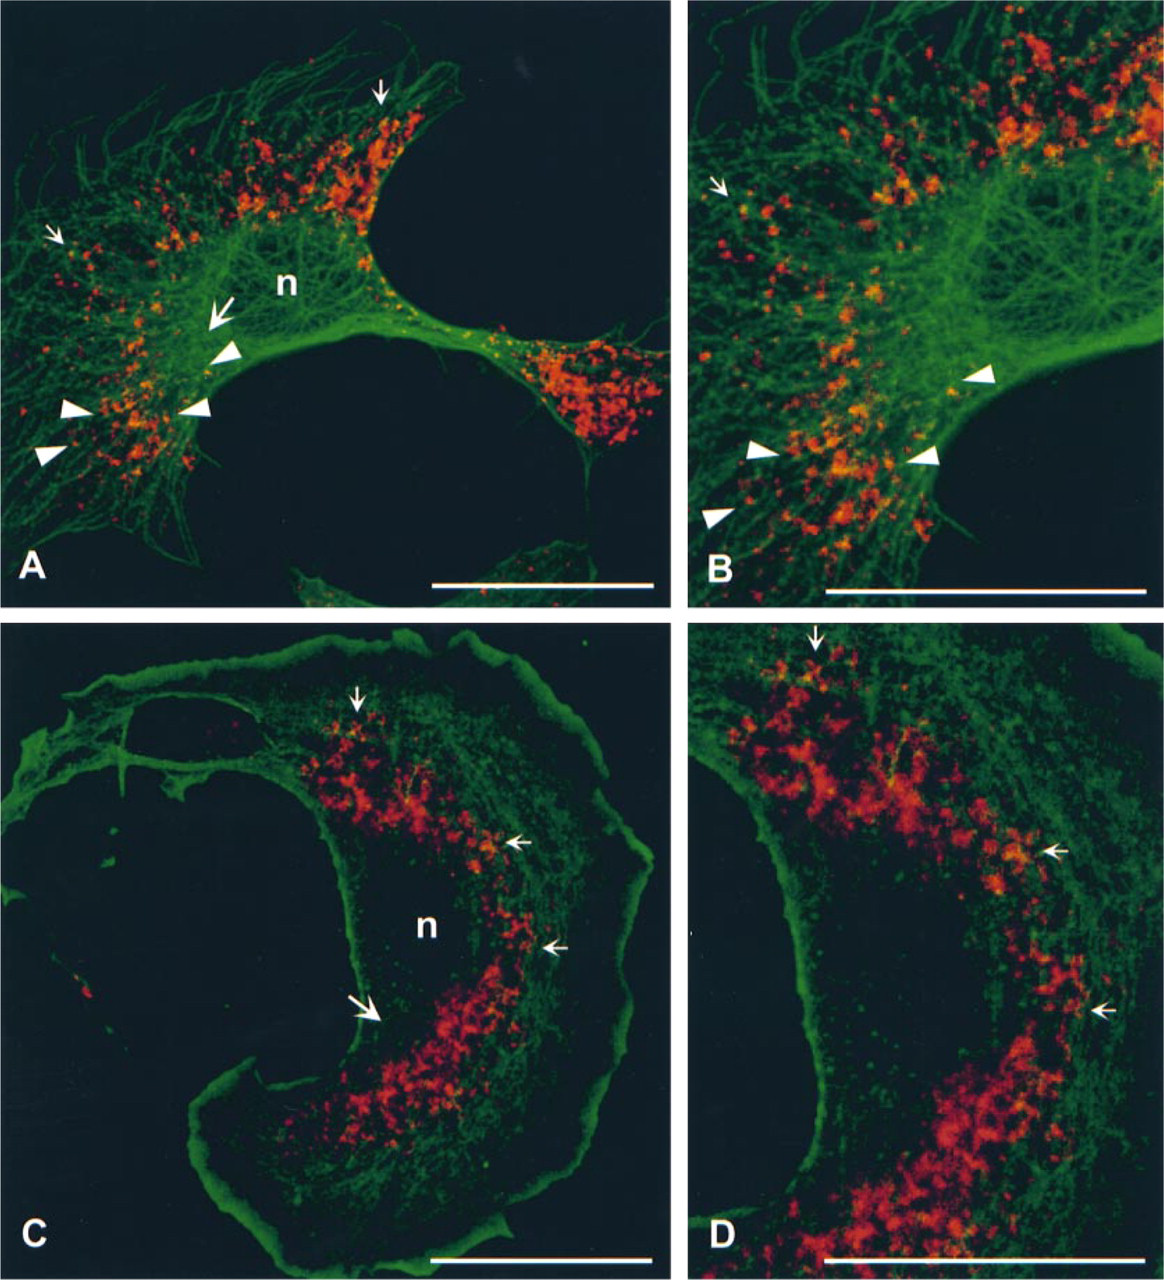
Double labeling of β-actin mRNA (red) and tubulin (green,
Summary of the detection methods
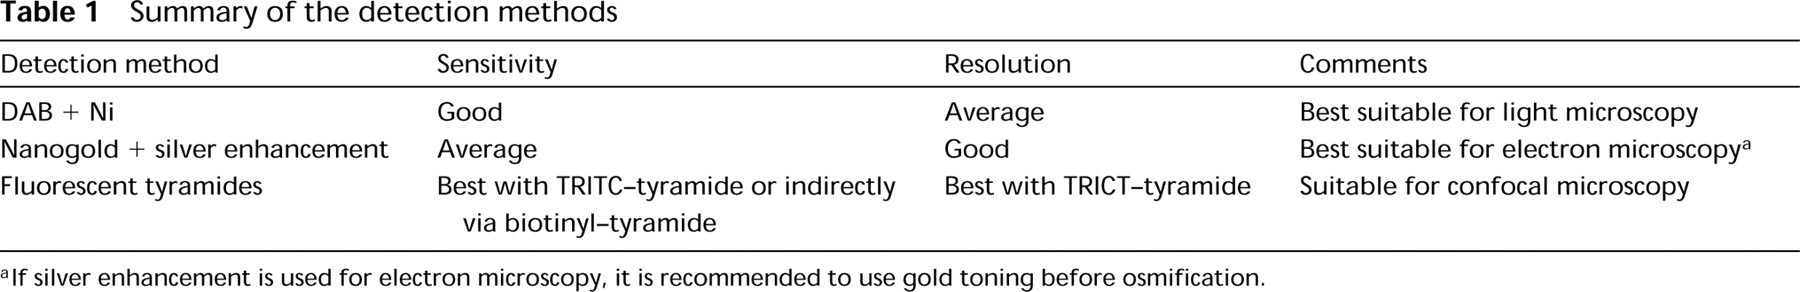
If silver enhancement is used for electron microscopy, it is recommended to use gold toning before osmification.
In the cell body, the mRNA was restricted to certain regions of cytoplasm. Typically, β-actin mRNA was localized in the region rich in cytoplasm surrounding the nucleus, not reaching the thin peripheral area (Figures 5A and 5C). However, the cytoplasm at one side of the nucleus, especially if the nucleus was asymmetrically located, was devoid of label, as was a small area in the perinuclear cytoplasm (Figures 5A and 5C). Electron microscopic images suggested that the Golgi apparatus is located in the area devoid of β-actin mRNA (Figure 3B).
Association of β-Actin mRNA with the Cytoskeleton
To increase the contrast of the cytoskeletal filaments, we extracted the cells with Triton X-100 before fixation to wash out the plasma membrane and soluble cytoplasm. This also enabled the use of colloidal gold particles for double labeling of mRNA and proteins. Labeling for β-actin mRNA was detected in the extracted cells (Figures 6A-6D), suggesting that the mRNA is associated with the insoluble cytoskeleton. The mRNA was associated with characteristic knobbly, filamentous structures that also showed labeling for the proteins of ribosomal 60S subunit (Figure 6A). Some of the ribosomes are known to be associated with the cytoskeleton (Lenk et al. 1977; Hesketh 1996) but, because formamide treatment during the hybridization destroys their ultrastructure (Racca et al. 1997; Bassell et al. 1998), they were not morphologically identifiable in our samples.
Previous studies have shown that many mRNAs, including β-actin mRNA, are associated with the cytoskeleton, especially with actin and/or tubulin filaments (Singer et al. 1989; Taneja et al. 1992; Bassell et al. 1994a,b, 1998). Therefore, we wanted to test whether our in situ hybridization protocol has enough spatial resolution to demonstrate close proximity of β-actin mRNA with tubulin or actin filaments. Confocal microscopy of double labeled cells revealed that the mRNA labeling was present as granules and that many of the granules were aligned on, or present in close proximity to, microtubules (Figures 5A and 5B). Close association of mRNA granules with actin filaments was also observed (Figures 5C and 5D).
Overlap of fluorochromes at the light microscopic level can be caused either by localization in close proximity, or by real colocalization, of the two labels (Griffiths et al. 1993). To distinguish between these alternatives, we performed electron microscopic double labeling of mRNA and the cytoskeletal proteins. Double labeling of β-actin mRNA and tubulin showed that, although the mRNA was frequently found in close proximity to microtubules, it was seldom directly associated with them (Figure 6B). Because only short stretches of microtubules were visible in thin sections, we also looked at semithick (200-nm) sections, with identical results. However, labeling for β-actin mRNA was frequently found associated with actin protein. This was especially prominent in the cortical cytoplasm (Figures 6C and 6D). The double labeling experiments were repeated three times with identical results.
Discussion
Electron microscopic in situ hybridization has earlier been used to localize abundant mRNAs, such as messages for cytoskeletal proteins (Singer et al. 1989), respiratory chain enzymes (Escaig-Haye et al. 1991), tyrosine hydroxylase (Liposits et al. 1991), myosin heavy chain (Pomeroy et al. 1991), elongation factor and immediate early gene products (Macville et al. 1995), EGF receptor (Sibon et al. 1996), and calcium/calmodulin-dependent protein kinase II (Martone et al. 1996).
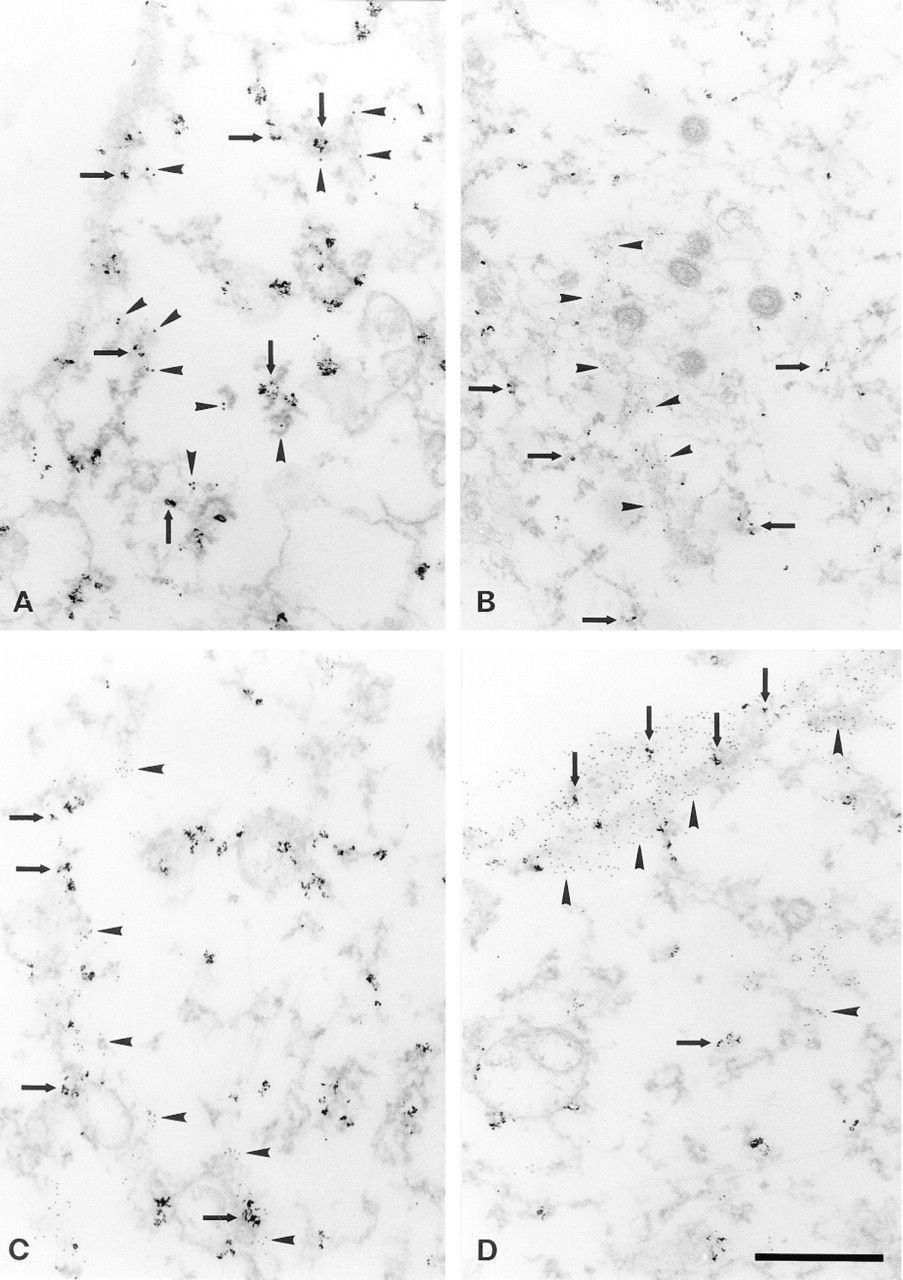
Double labeling of β-actin mRNA and ribosomal 60S subunit proteins (
Messenger RNAs concentrated in the endoplasmic reticulum for translation have also been localized successfully (Lamperth et al. 1990; Le Guellec et al. 1990, 1991; Dirks et al. 1992; Dörries et al. 1993; Mitchell et al. 1993; Trembleau et al. 1994; Matsuno et al., 1995; Yi et al. 1995; Trembleau and Bloom 1996; Chevalier et al. 1997; Racca et al. 1997). Because of the low sensitivity, postembedding protocols have been most successfully used to localize very abundant RNAs, such as viral RNA (Lin et al. 1993; Egger et al. 1994; Bienz and Egger 1995), ribosomal RNA (Binder et al. 1986; Medina et al. 1995; Shaw et al. 1996), and small cytoplasmic RNAs (Farris et al. 1997).
Singer et al. (1989) localized β-actin mRNA in cytoskeletal preparations of cultured cells. Biotin-labeled probes were detected with anti-biotin and a colloidal gold-labeled secondary antibody. This method has the advantage of high spatial resolution. However, the pictures reveal that its sensitivity is relatively low, because the labeling is limited to sparsely located sites. Recently developed fluorescent in situ hybridization protocols (Bassell et al. 1998; Femino et al. 1998; and the present study) have revealed the very abundant occurrence of β-actin mRNA in the cytoplasm of cultured cells. We have demonstrated here that a short amplification with biotinylated tyramide, in combination with ultrasmall gold- or peroxidase-coupled streptavidin, raises the sensitivity of electron microscopic localization to the same level as that of fluorescent in situ hybridization. Using this protocol, we were able to localize both β-actin mRNA and the much less abundant amphoterin mRNA. Furthermore, our protocol is gentle enough to preserve the fine structure of the membrane-bound organelles so that ultrastructural details of mRNA localization could be studied. Table 1 presents a summary of the detection methods used in our study.
Amplification of the signal always decreases the spatial resolution of detection. We used tyramide signal amplification to enhance the sensitivity. In a quantitative study, Schöfer et al. (1997) showed that tyramide amplification for 5 min did not significantly decrease spatial resolution. However, longer tyramide amplification times increased the labeling also at a distance of 100 nm from the target. In the present study, tyramide amplification for 4-5 min was sufficient for β-actin mRNA visualization with Nanogold. Therefore, β-actin mRNA could be localized with good spatial resolution. Detection of amphoterin mRNA was difficult without a longer tyramide amplification. The fine structural resolution of this mRNA localization is therefore not equally reliable.
We observed that β-actin mRNA was restricted to certain areas of the cytoplasm (Figures 3B, 5A, and 5B). The compartmentalization phenomenon was also seen in cells extracted with Triton X-100 before fixation, suggesting that it was not caused by hindered diffusion of the probe. This result may be an indication of compartmentalization of the cytoplasm into structural areas and nonstructural channels, which are used for intracellular transport and protein synthesis (Luby-Phelps 1993).
Both β-actin and amphoterin mRNA localized as separate spots in the cytoplasm. Granular localization of mRNAs encoding proteins synthesized on cytoskeleton-bound polysomes has also been reported in earlier light microscopic studies. (Taneja et al. 1992; Ainger et al. 1993; Knowles et al. 1996; Bassell et al. 1998; Femino et al. 1998). The postulated mRNA granules may contain only one, or several, mRNA molecule(s), in addition to some transport and/or translation factors (Barbarese et al. 1995; Knowles et al. 1996; Bassell and Singer 1997; Bassell et al. 1998). Most β-actin mRNA labeling inside the cortical cytoplasm was associated to knobbly filamentous structures. We also detected immunolabeling for the ribosomal 60S subunit associated with these structures. This suggests that β-actin mRNA and ribosomes are associated, either for translation or for transport. Bassell (1993) has suggested that filament-associated proteins, rather than the cytoskeletal filaments themselves, are the actual molecules associated with mRNA. Recently, the microtubule-associated protein, MAP 1A, was reported to be a component of a general RNA binding protein complex (DeFranco et al. 1998). The nature of the supramolecular RNA binding complex, or putative transport granule, remains a topic of future studies.
Our recent experiments using drugs that disrupt microtubules or microfilaments showed that both μ-actin and amphoterin mRNAs are transported along and anchored to the actin microfilament network (not to microtubules) in neuroblastoma cells (Fages et al. 1997) and in C6 cells (unpublished observations). Actin-dependent localization of mRNA has also been described in fibroblasts (Singer et al. 1989; Sundell and Singer 1991; Bassell et al. 1994a) and yeast cells (Takizawa et al. 1997). These results are in agreement with the present study showing that β-actin mRNA can associate, especially in the cortical cytoplasm, with actin filaments in C6 cells. However, in neurons, microtubules appear to be more involved in the transport and localization of mRNA (Bassell et al. 1994b,1998).
Footnotes
Acknowledgments
We thank Mervi Lindman for excellent technical assistance and Dr John Hesketh for the ribosome antibody.