
Abstract
We developed a confocal morphometric analysis to quantitate the relative plasma membrane (PM) expression of the Na/H exchanger NHE3 in living PS120 fibroblasts. NHE3 is a membrane transport protein that is acutely regulated by changes in the number of molecules expressed at the PM. To quantitate the PM expression of NHE3 under various experimental conditions, we stably expressed a chimera of rabbit NHE3 and green fluorescent protein (NHE3–GFP) in PS120 fibroblasts. A three-dimensional (3D) map of the intracellular distribution of NHE3–GFP was obtained by confocal laser scanning microscopy (CLSM) of cells superfused with a styryl dye, FM 4–64. This fluorophore rapidly and reversibly labeled the outer lipid layer of the PM, which allowed generation of a digital mask of the PM and calculation of the fraction of a total cellular NHE3–GFP expressed at the PM. This analysis was successfully used to quantitate the relative PM expression of NHE3–GFP in control cells (25%) and a decrease in the expression caused by subsequent exposure of cells to wortmannin (5.1%). Reliability of the method was confirmed by cell surface biotinylation, which yielded very similar results. Confocal morphometric analysis is fast and reproducible and could potentially be used for investigations on regulation of expression of other membrane proteins.
T
The steadily growing number of membrane proteins shown to be regulated by changes in their recycling kinetics has stimulated investigations into the mechanisms responsible for controlling intracellular trafficking of the PM proteins. One of the important tasks in these investigations was an accurate quantitation of the protein of interest within various intracellular compartments. Three major approaches have commonly been used to address this problem: cell fractionation, surface biotinylation, and direct or indirect immunolabeling. In conjunction with use of specific markers for various intracellular compartments, these methods have provided a reasonably good characterization of the pathways and kinetics of recycling of several membrane transporters. However, none of these techniques can easily be applied to dynamic quantitation of PM proteins in living cells. This limitation could be at least partially circumvented by using reporter molecules readily detectable in living cells. One such molecule is a recently cloned and characterized green fluorescent protein (GFP) from a jellyfish, Aequorea victoria (Chalfie et al. 1994; Yang et al. 1996a). This protein emits fluorescent light without exogenous co-factors, and it can be relatively easily expressed in eucaryotic cells. Over the past few years, GFP evolved from a reporter molecule used to evaluate the efficiency of cDNA transfection to a powerful tool in investigations on intracellular protein trafficking and a dynamic marker for subcellular organelles in living cells. This is due to the fact that GFP, and especially its recently engineered mutants, can be fused with many cytoplasmic and membrane proteins without significantly impairing their function and regulation (reviewed in Gerdes and Kaether 1996; Cubitt et al. 1999).
In this report we describe a novel morphometric method that we developed to dynamically quantitate expression of NHE3 in PM of living cells. For the purpose of these studies, NHE3 was stably expressed in PS120 fibroblasts as a fusion molecule with a green fluorescent protein (NHE3–GFP). The total cytoplasmic and PM-associated fluorescence intensity of NHE3–GFP was measured in serial optical sections of examined cells obtained by confocal laser scanning microscopy (CLSM), and was subsequently digitally integrated for the entire cell. To accurately map the PM, we labeled the living cells with a lipophilic, membrane-impermeable fluorophore, FM 4–64, which exhibits excellent binding and fluorescent properties. Here we describe details of the procedure itself, and details and rationale for the important control experiments. Although confocal morphometric analysis was used for studies on regulation of PM expression of NHE3, it could potentially be used for similar studies on other membrane transport proteins and receptors.
Materials and Methods
Cell Culture and Transfection
Chinese hamster lung fibroblasts (PS120 cells; a gift from Dr. J. Poussegur) were cultured in DMEM supplemented with 0.1 mM nonessential amino acids, 1 mM pyruvate, penicillin (50 IU/ml), streptomycin (50 μg/ml), and 10% FBS, in a 10% CO2 humidified incubator at 37C. PS120 cells are deficient in endogenous Na/H exchangers and are unable to excrete H+ ion in the absence of external bicarbonates (Pouyssegur et al. 1984). To express NHE3–GFP fusion protein in these cells, we used a cDNA coding for rabbit NHE3–VSVG protein and for the red-shifted variant of green fluorescent protein (eGFP). A vesicular stomatitis virus glycoprotein tag (VSVG) served as a spacer between NHE3 and eGFP molecules and also provided a convenient epitope for immunolocalization. The open reading frame of NHE3–VSVG was amplified by PCR using primers containing Hind III and Sal I restriction sites at the 5′ and 3′ end, respectively. The PCR fragment was gel-purified and subcloned into a pEGFP–N3 vector (Clontech; Palo Alto, CA). The absence of PCR-introduced mutations in the NHE3–GFP construct was confirmed by DNA sequence analysis (310 Genetic Analyzer; PE Applied Biosystems, Foster City, CA). PS120 cells were transfected with NHE3–GFP cDNA (or with pEGFP–N3 vector) using lipofectamine (Life Technologies; Gaithersburg, MD) according to the manufacturer's instructions. The cell population expressing NHE3–GFP was initially enriched using the acid selection technique, as originally described elsewhere (Franchi et al. 1986). Stable clones expressing functional NHE3–GFP (PS120–E3G cells) were then isolated using dilutional cloning, propagated in a largescale culture, and frozen in liquid nitrogen. In all experiments, stably transfected cells were used during the initial three passages after being thawed from the frozen stock.
Examination of Fluorescent Properties of NHE3–GFP
To test the relationship between NHE3–GFP concentration and its fluorescence intensity, we measured the fluorescence intensity of serial dilutions of whole-cell lysates prepared from PS120–E3G cells. Briefly, cells cultured in 100-mm Petri dishes were rinsed with PBS, scraped with a rubber policeman, and sonicated on ice in lysis buffer (150 mM NaCl, 1% Triton X-100, 10 μg/ml aprotinin, 1 mM PMSF, 5 mM iodoacetamide, 10 μg/ml leupeptin, 50 mM Tris, pH 7.4). The lysate was rocked for 30 min at 4C and spun at 14,000 × g for 10 min. The supernatant was collected and serially diluted with lysis buffer. Aliquots of 45 μl were placed between two glass coverslips spaced by 0.2 mm. Images were collected using a Zeiss LSM410 laser confocal microscope equipped with a Zeiss × 40 water immersion lens (NA 1.2). This microscopic setup was used in all experiments described here unless otherwise indicated. Excitation was set at 488 nm and emission was collected using a 510-nm dichroic mirror and a 505–530-nm bandpass barrier filter. Images (8-bit) were recorded at eight-times frame averaging, and each sample was measured in 10 randomly chosen areas of 40 × 40 pixels. For calculation of the emission intensity, images were background-corrected (by subtracting signal from the lysate obtained from wild-type PS120 cells) and the integrated pixel intensity was examined using MetaMorph software (Universal Imaging; West Chester, PA)
To test the degree of photobleaching of NHE3–GFP under the experimental conditions used during confocal morphometric analysis, PS120–EG3 cells cultured on glass coverslips were lightly fixed in paraformaldehyde (2% in PBS, 10 min at 4C). The fixation step was necessary to prevent lateral diffusion of NHE3–GFP molecules in the optical section examined. Images were collected every 3 sec at four-times frame averaging using a confocal microscope, with laser power set at 100 μW. Up to 80 serial images were obtained from the same field (total of 320 single frame scans). For analysis, 30 × 30-pixel regions with an initial average fluorescence intensity of approximately 220 (on a scale of 255) were chosen on a random basis. After background correction, the integrated pixel values in each region (the average pixel value times the number of pixels in the area) were measured in all images in the series using MetaMorph software.
Confocal Morphometric Analysis
Because we were specifically interested in quantitation of NHE3–GFP at the plasma membrane (PM), we developed a method that enabled us to create a mask of the PM in living PS120–E3G, which was subsequently used to precisely map the PM in optical sections of the cells. PS120–E3G cells grown on coverslips were mounted in a superfusion chamber, placed on the confocal microscope stage, and initially superfused with control medium (130 mM NaCl, 5 mM KCl, 2 mM CaCl2, 1 mM MgSO4, 0.8 mM Na2H(PO4), 0.2 mM NaH2(PO4), 25 mM glucose, 20 mM HEPES, pH 7.4). The temperature of the medium was set so that the actual temperature at the cell surface was 4–6C. After a short equilibration period, a styryl dye FM 4–64 (20 μM; Molecular Probes, Eugene, OR) was added to the control medium. Kinetics of binding of FM 4–64 to and dissociation from the PM of PS120–E3G cells were evaluated in a separate set of experiments. Once the binding of FM 4–64 to the PM was saturated (∼60 sec), serial optical sections were obtained along the Z-axis at 0.4-μm steps, and series of images spanning entire cells were stored on the magneto-optical disk. Excitation wavelength was set at 488 nm and emission signals were collected by separate photomultipliers using 505–530-nm and 620–650-nm bandpass filters, respectively. Gain and offset were set manually for each measured cell to ensure that the fluorescence intensities of eGFP and FM 4–64 were contained within the 15–235 intensity range on the 8-bit gray density scale. Correction factor for a distance-related attenuation of fluorescence in the Z-axis was obtained by measuring the fluorescence intensity of 2-μm fluorescent beads (Molecular Probes) placed on the cell surface at various distances from the coverslip. Fluorescent beads were also used to set the optimal pinhole aperture and the optimal value of the Z step. Quantitation of the relative PM content of NHE3–GFP was performed using MetaMorph software, as follows. The overlay images were color-decoded, background subtracted, and thresholded. Next, images of the PM (FM 4–64 signal) were binarized and reversed so that the signal from FM 4–64 was ascribed the value of “0” and the remainder of the image was ascribed the value of “1.” The Boolean logical operation “AND” was then performed on the corresponding images, representing signals from eGFP (distribution of NHE3–GFP) and from FM 4–64 (reversed binary mask). This resulted in generation of a new image in which the eGFP fluorescent signal corresponding to the PM was digitally subtracted from the image. The intensity of eGFP fluorescence corresponding to the PM was calculated by subtracting the value of integrated fluorescence intensity of eGFP within the cytoplasm from the total cellular fluorescence intensity (cytoplasm plus PM). Quantitation of the PM content of NHE3–GFP in the entire cell (expressed as percent of total cellular content) was performed using the formula

in which n stands for the number of optical sections required to scan the entire cell, and IFIt and IFIc stand for integrated fluorescence intensity of the entire cell and of the cytoplasm within a given optical section, respectively.
In some experiments, cells on coverslips were lightly fixed with 2% paraformaldehyde in PBS (10 min at 4C) and processed further as described above for living cells.
In a separate set of experiments, PS120–E3G cells were incubated with a phosphatidylinositol 3-kinase (PI 3-K) inhibitor wortmannin (100 nM; 30 min at 37C), a procedure known to significantly decrease the PM content of NHE3 (Kurashima et al. 1998; Janecki et al. 2000).
Cell Surface Biotinylation
To complement the confocal morphometric analysis, we also evaluated the relative PM content of NHE3–GFP by cell surface biotinylation, as described in details elsewhere (Janecki et al. 1998). Briefly, PS120–E3G cells grown in 10-cm Petri dishes were rinsed extensively with PBS followed by borate buffer (154 mM NaCl, 7.2 mM KCl, 1.8 mM CaCl2, 10 mM H3BO3, pH 9.0). The entire procedure was performed at 4C. Next, cells were incubated for 40 min with 1.5 mg of NHS–SS–biotin in borate buffer (Pierce, Rock-ford, IL; biotinylation solution). Unbound NHS–SS–biotin was quenched with Tris buffer (120 mM NaCl and 20 mM Tris, pH 7.4). Cells were then rinsed with PBS, scraped, solubilized in 1 ml of lysis buffer (150 mM NaCl, 3 mM KCl, 5 mM EDTA trisodium, 3 mM EGTA, 1% Triton X-100, 60 mM HEPES, pH 7.4), and sonicated for 20 sec. The lysates were agitated at 4C for 30 min and spun to remove insoluble cell debris. A portion of the resulting supernatant was retained as the total fraction (T) and the remainder was incubated with avidin–agarose (Pierce). After two consecutive avidin precipitations, the remaining supernatant was retained as the intracellular fraction (I). The avidin–agarose beads were washed in lysis buffer and boiled in Laemmli sample buffer, yielding the surface fraction (S). Western analysis was performed on dilutions of all three fractions run on the same gel. Separated proteins were transferred to nitrocellulose and probed with monoclonal anti-VSVG antibody P5D4 (hybridoma culture medium at 1:5 dilution; kindly provided by Dr. D. Louvard, Curie Institute, Paris, France). Bands were visualized using enhanced chemiluminescence and quantified using densitometric analysis as described in detail elsewhere (Akhter et al. 2000).
Measurement of Na/H Exchange Rate
To evaluate the NHE3 activity, we used a method based on SNARF-1 as an intracellular pH (pHi) indicator and confocal microscopy, as described in detail previously (Janecki et al. 2000). Briefly, PS120–E3G cells cultured on coverslips were serum-starved for 4–6 hours, mounted in perfusion chambers, and acidified by incubation with perfusion medium containing SNARF-1 (5-(and-6)-carboxy SNARF-1, acetoxymethyl ester, acetate; Molecular Probes) and 40 mM NH4Cl. Chambers were then mounted on the confocal microscope stage and superfused with Na+-free medium in which Na+ salts were replaced quantitatively with tetramethylammonium (TMA) salts. Excitation was set at 488 nm and emission was monitored at 580 nm and 640 nm by separate photomultipliers. After a few minutes of perfusion in the absence of Na+, during which time the pHi stabilized at ∼5.9, cells were superfused with medium containing 131 mM Na+. This allowed rapid recovery of pHi, monitored by sequential images taken every 6 sec. The ratio of SNARF-1 emissions at 640 nm and 580 nm was semiautomatically calculated in the serial pairs of respective images using MetaMorph software. Final pHi values were calculated using a calibration curve and a nigericin equilibration method as previously described (Thomas et al. 1979; Janecki et al. 2000). Rates of Na/H exchange (slope of pHi recovery curves) were compared within a linear portion of the curves (pHi 6.2–6.8).
In some experiments, cells were incubated with wortmannin (100 nM; 30 min at 37C) before measurement of pHi recovery.
Statistical Analysis
Numerical data are expressed as means ± SEM, and the significance of difference between experimental groups was analyzed by the two-tailed Student's t-test.
Results
NHE3–GFP Expression and Fluorescent Properties
In cells transiently transfected with NHE3–GFP, approximately 25% of all cells exhibited diffuse cytoplasmic expression of NHE3–GFP, suggesting overexpression and lack of membrane targeting of fusion protein. In contrast, in the stably transfected clonal cells NHE3–GFP was characteristically distributed among three compartments: the PM, a juxtanuclear vesicular compartment, and a population of small particles dispersed throughout the cytoplasm and most probably representing recycling vesicles (Figure 1A). High-magnification images revealed that some of the particles were closely associated with the PM (Figure 1B). Because the diameter of these particles was approximately 0.1–0.4 μm, they might represent recycling vesicles at initial stages of endocytosis and/or during exocytic fusion with PM. Indeed, time-lapse images of living cells revealed that some of the particles initially located within a distance of 0.5–1.0 μm from the PM moved towards the cell surface and then rapidly disappeared, most likely fusing with the PM (not shown). The general pattern of intracellular distribution of NHE3–GFP closely resembled that of NHE3 fused with VSVG but lacking the GFP tag (PS120–E3V cells; Figure 1C).
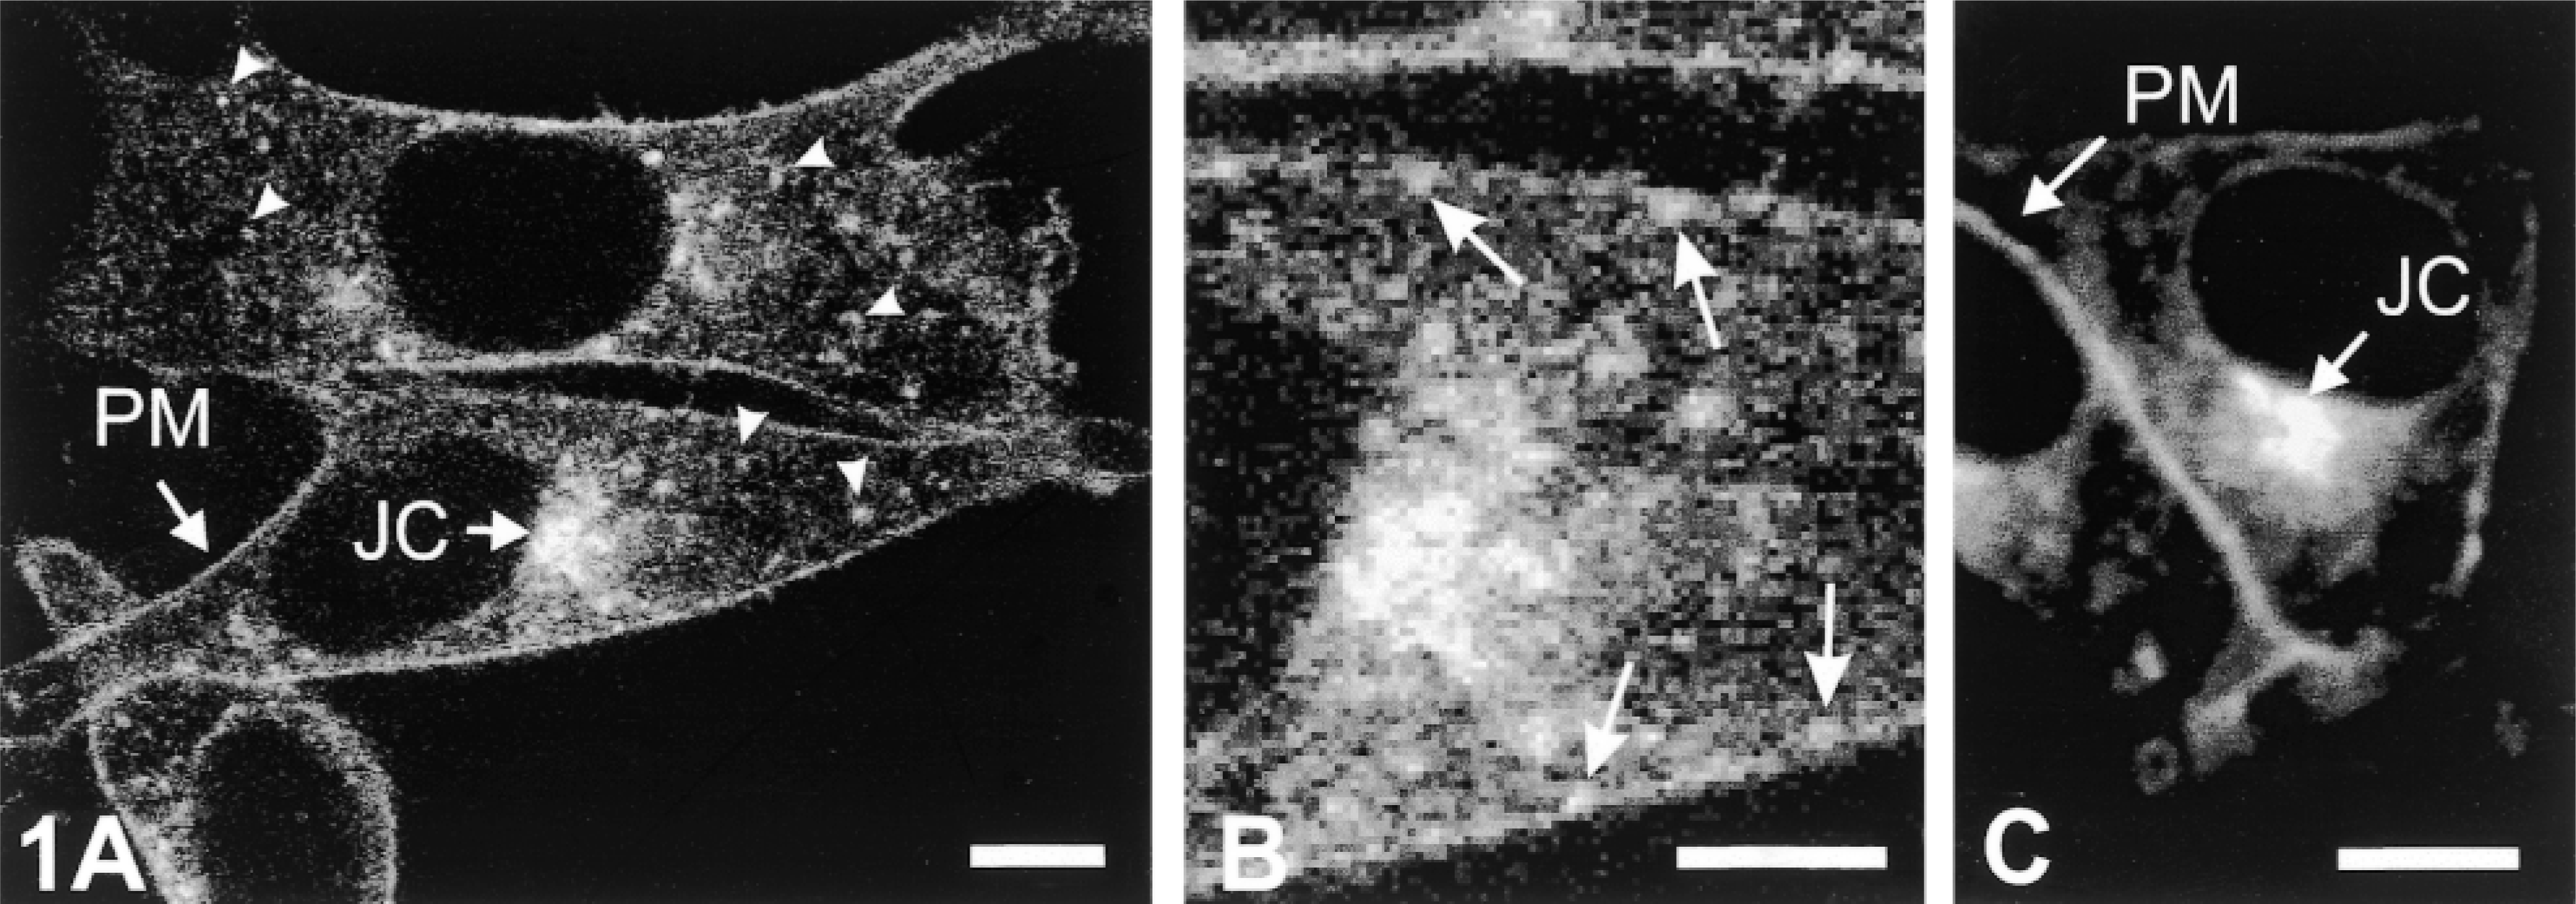
Confocal fluorescent images of PS120–E3G (
The NHE3 moiety of the fusion protein expressed at the PM was functionally active, as revealed by measurement of pHi recovery rate in the presence of 131 mM Na+. The average recovery rate was 0.052 ± 0.004 (ΔpHi/sec; at pHi 6.7; mean ± SEM from 180 cells in 12 experiments), and it was very similar to the average rate of pHi recovery in PS120–E3V cells (0.040 ± 0.006; mean ± SEM from 40 cells in three experiments). These data indicate that fusion of the carboxy terminus of NHE3 with eGFP did not significantly compromise the protein targeting and activity.
Variants of wild-type GFP with the S65T mutation have been reported to be 20–35-fold more resistant to photobleaching (Cormack et al. 1996). However, fusion of eGFP with NHE3 could, in theory, affect several physical properties of eGFP, including the resistance to photobleaching. Because a significant level of photobleaching could result in underestimation of the calculated quantities of NHE3–GFP, we examined the susceptibility to photobleaching of the fusion protein expressed in PS120-E3G cells. As shown in Figure 2, the rate of photobleaching followed an exponential pattern described by the equation R = 85.0 + 14.84 e−-N/184, where R is the fluorescent intensity of NHE3–GFP and N represents the number of scans. This pattern resembled that described for purified recombinant GFP (Patterson et al. 1997). After 80 scans (total of 320 frames), the average fluorescence intensity decreased by only ∼12% of the initial value. These results suggest that the effect of photobleaching on the obtained results was negligible when a cell was examined only once (approximately 20 scans). However, in experiments in which the same cell had to be examined more than once, the degree of photobleaching should be taken into account during quantitative analysis.
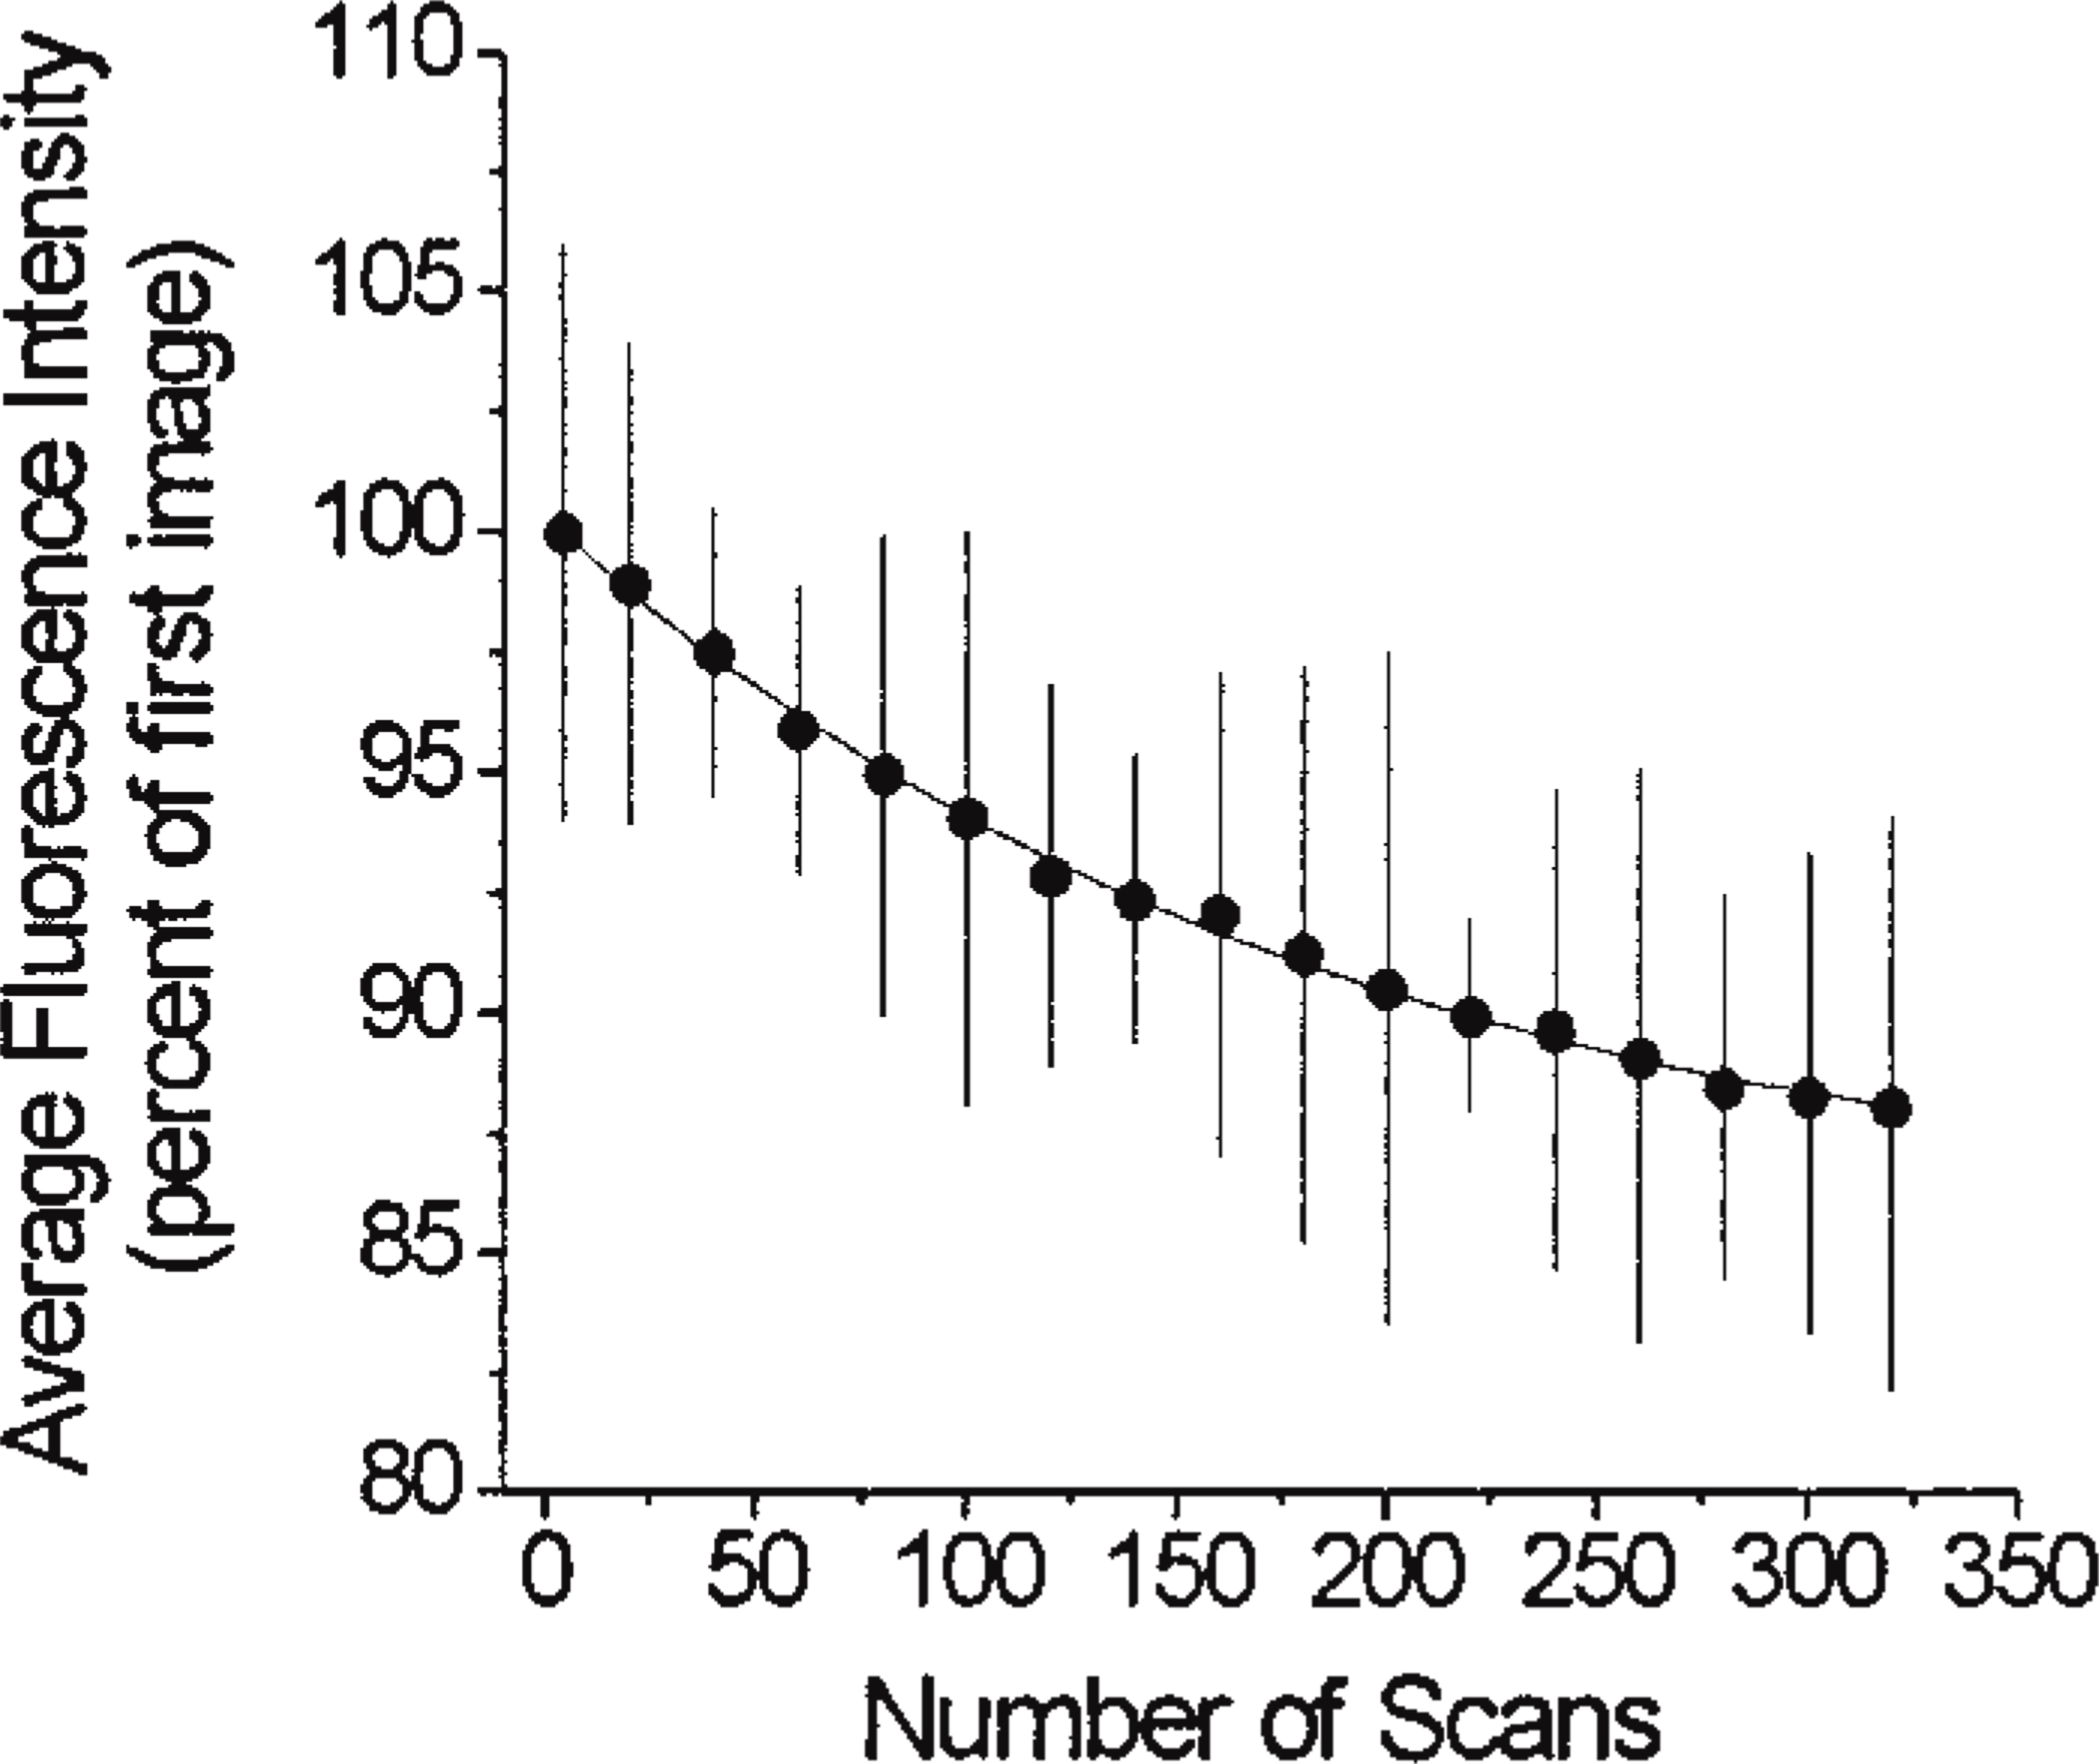
Kinetics of photobleaching of eGFP fused to NHE3 and expressed in PS120 cells. Lightly fixed cells were scanned every 3 sec at four-times averaging using confocal microscopy, and the integrated eGFP fluorescent intensity was calculated in collected images as described in Materials and Methods. Data points are means ± SE from 110 areas in 40 separate cells and are presented as percent of fluorescence intensity in the first image.
Quantitation of any fluorophore critically depends on the linearity of correlation between the fluorophore concentration and its fluorescent intensity. We examined this correlation using serial dilutions of NHE3–GFP in the lysates obtained from PS120–E3G cells. As shown in Figure 3, the intensity of NHE3–GFP fluorescence changed linearly within two logs of magnitude of the protein concentration. This finding supported the rationale for the confocal morphometric analysis, because the actual range of fluorescence intensity of eGFP measured in living PS120–GFP cells (20–230 gray density levels in 8-bit images) was well contained within the range of linear correlation found in the experiments with cell lysates.
We also investigated the possibility that the hypothetical pHi gradient within the narrow zone of cytoplasm immediately adjacent to the PM might result in higher concentrations of H+ ions in that zone and, consequently, in a decrease in fluorescence intensity of the PM-bound NHE3–GFP (Robey et al. 1998). Because calculated quantities of NHE3–GFP are directly derived from the protein's fluorescence intensity, such a gradient would result in underestimation of the PM content of the exchanger. To examine the distribution of pH values in living PS120–E3G cells, we analyzed several 2 × 2-pixel (0.22 μm × 0.22 μm) areas in the SNARF-1-loaded PS120–E3G cells under steady-state conditions (control perfusion at pHi ≈7.4; Figure 4A). Under these conditions, the average pHi in a 0.2-μm zone of cytoplasm adjacent to the PM was not significantly different from that measured randomly in the cell interior (7.38 ± 0.08 vs 7.41 ± 0.06, respectively; means ± SE from 120 areas in 30 cells).
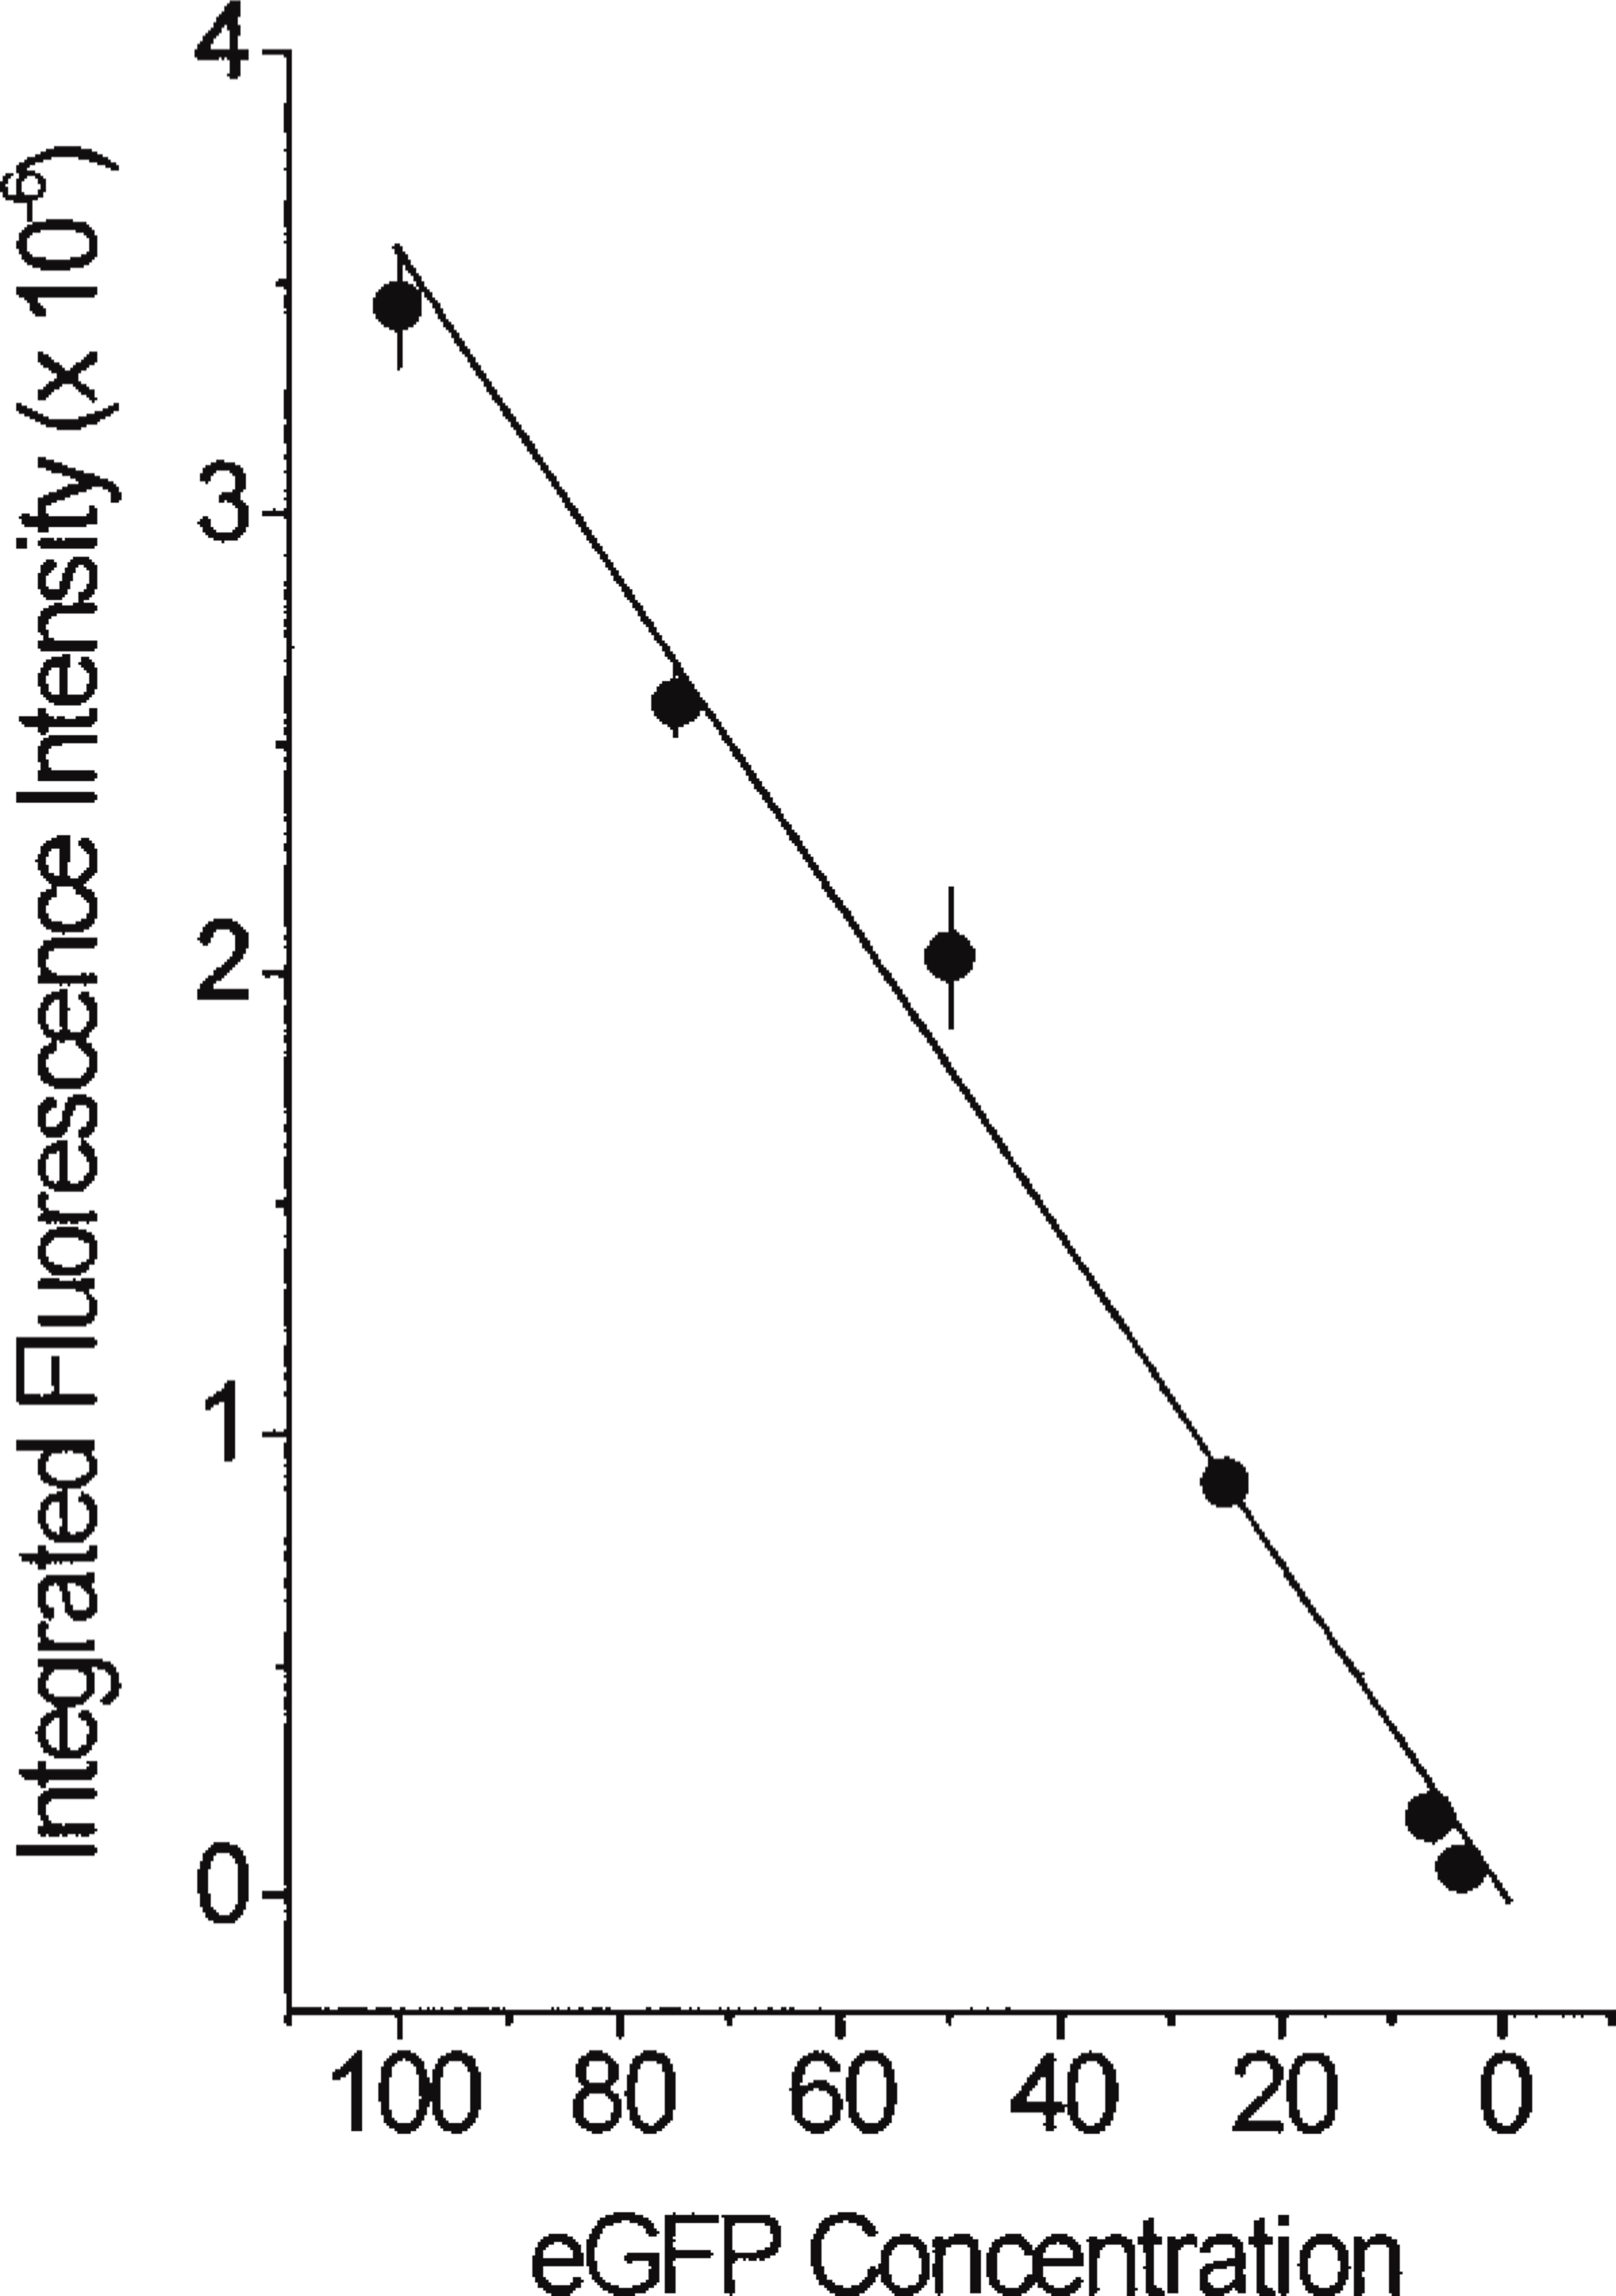
Linear correlation between protein concentration and integrated fluorescent intensity of NHE3–GFP. Serial dilutions of lysates obtained from PS120–E3G cells were analyzed using CLSM as described in Materials and Methods. NHE3–E3G concentration is expressed as percent of the original cell lysates. Data points are means ± SE from three separate experiments.
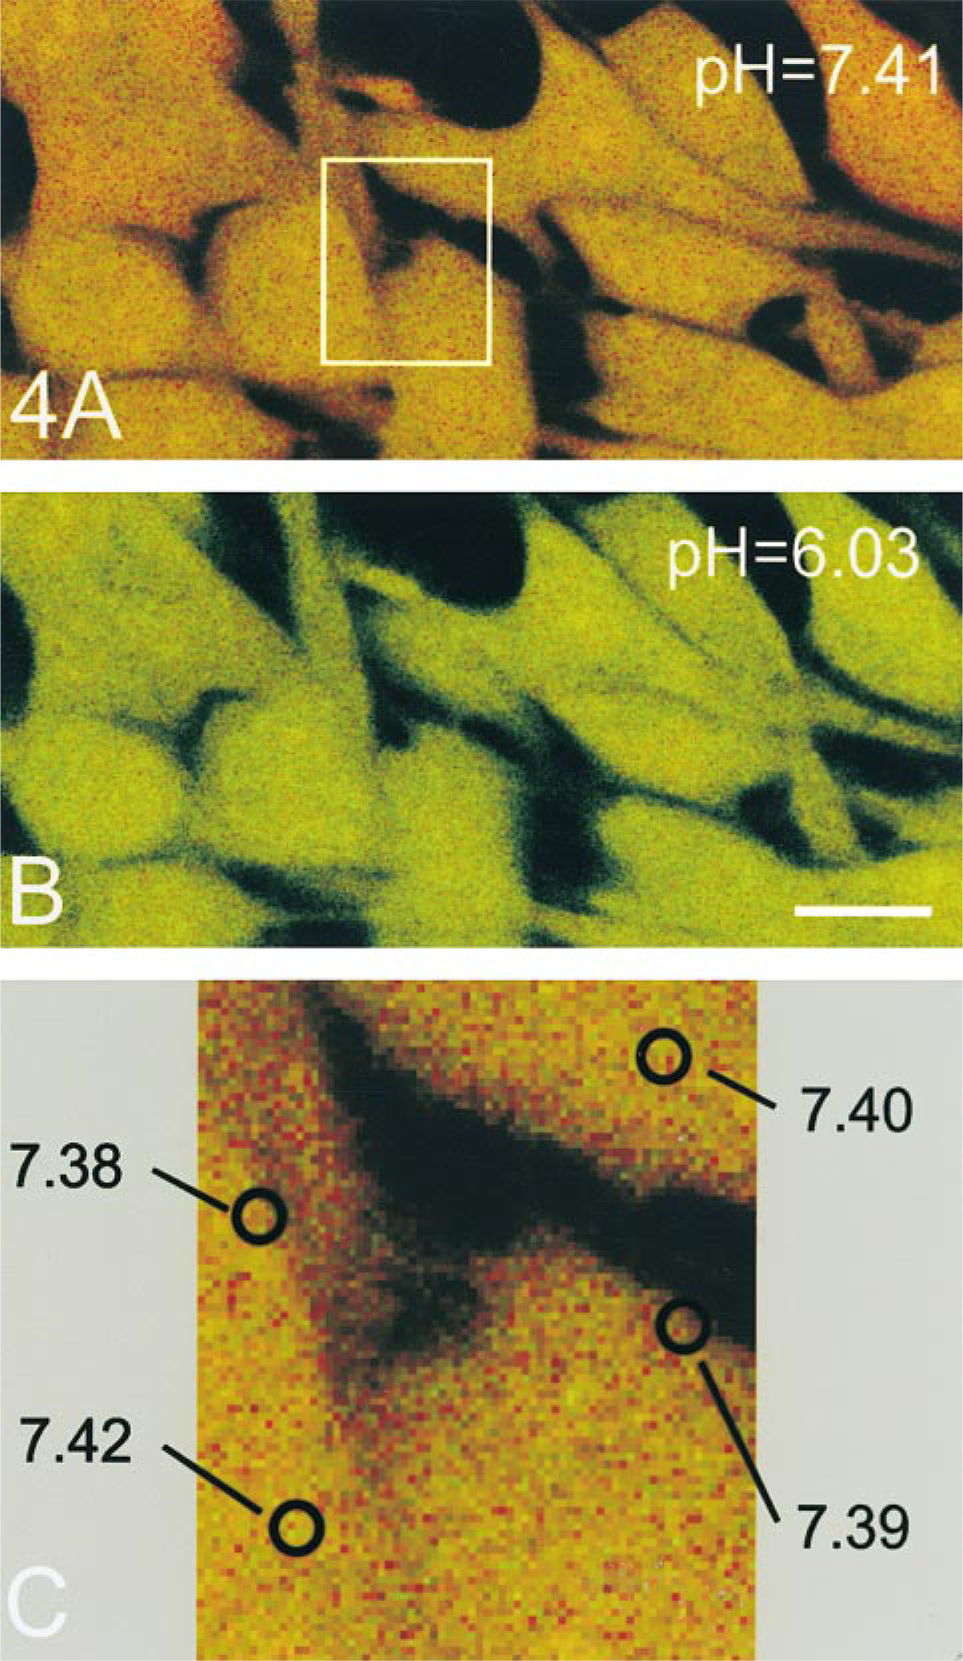
Schematic illustration of the analysis of distribution of intracellular pH (pHi) in PS120–E3G cells using SNARF-1 and confocal microscopy. (
Cellular Distribution of NHE3–GFP
To quantitate the PM expression of NHE3–GFP in living cells, we developed a morphometric analysis based on CLSM. The principle of this method was to create a 3 D digital map of the PM and then to quantitate the relative amount of NHE3–GFP within this area. To accomplish this, we used a styryl fluorescent dye, FM 4–64. Preliminary experiments revealed that FM 4–64 binding to the PM of PS120–E3G cells was saturated at concentrations of 10–15 μM (Figure 5A). Therefore, a 20 μM concentration was used in all subsequent experiments. Kinetics of binding and washout of FM 4–64 to the PM at 4C are shown in Figure 5B. The fluorophore saturated the PM binding sites very rapidly, with t1/2 ≈20 sec and with 95% saturation achieved within ∼60 sec. Once saturation was achieved, the fluorescence intensity of FM 4–64 bound to the PM remained constant, as long as the dye was present in the superfusate at saturating concentration (not shown). The washout phase observed after removal of the dye from solution was also very rapid, with 80% of the fluorescence dissociated from the PM within ∼70 sec (Figure 5B).
An example of a series of images obtained from scanning of a PS120–E3G cell superfused with FM 4–64 is shown in Figure 6. Qualitatively similar images were obtained when cells were lightly fixed with paraformaldehyde (not shown). A graphic representation of principles of the confocal morphometric analysis is shown in Figure 7. Each optical section of the cell (Figure 7A) was color-decoded and the fluorescent signal from FM 4–64 was converted into a binary mask. The image was then reversed (signal from PM was ascribed a value of 0, whereas the rest of image had a value of 1; Figure 7B) and used for mapping eGFP pixels corresponding to PM within the same optical section. As a result of a logical operation “AND” performed on the images of the binary mask and the respective optical section of the cell (Figures 7B and 7C), the intensity of pixels corresponding to the PM in the new image equaled 0, whereas the remainder of the image retained its original intensity pattern (Figure 7D). Most of the steps of confocal analysis were performed semiautomatically on the series (stacks) of 22–25 images spanning the entire cell. However, mapping the portion of PM facing the culture substratum (the “basal” membrane) was complicated by the fact that access of FM 4–64 to this portion of the PM was limited, and therefore the pixel intensity in some areas was below the set threshold level. To solve this problem, we defined the location of the membrane/cytoplasm interface manually. The principle of this procedure is illustrated in Figure 8. First, images of the PM were digitally reconstructed in the XZ plane using a stack of serial images of FM 4–64 obtained from scanning of the examined cell. The PM/cytoplasm interface (Figure 8B, arrow) was ascribed to an optical section (approximately four horizontal pixel rows) in which the average pixel intensity decreased by more than 60% compared to the immediately preceding section. This procedure let us map the interface layer with axial (Z) accuracy of 0.4 μm (thickness of the optical section) and the maximal resolution of 0.1 μm (dimension of a single pixel).
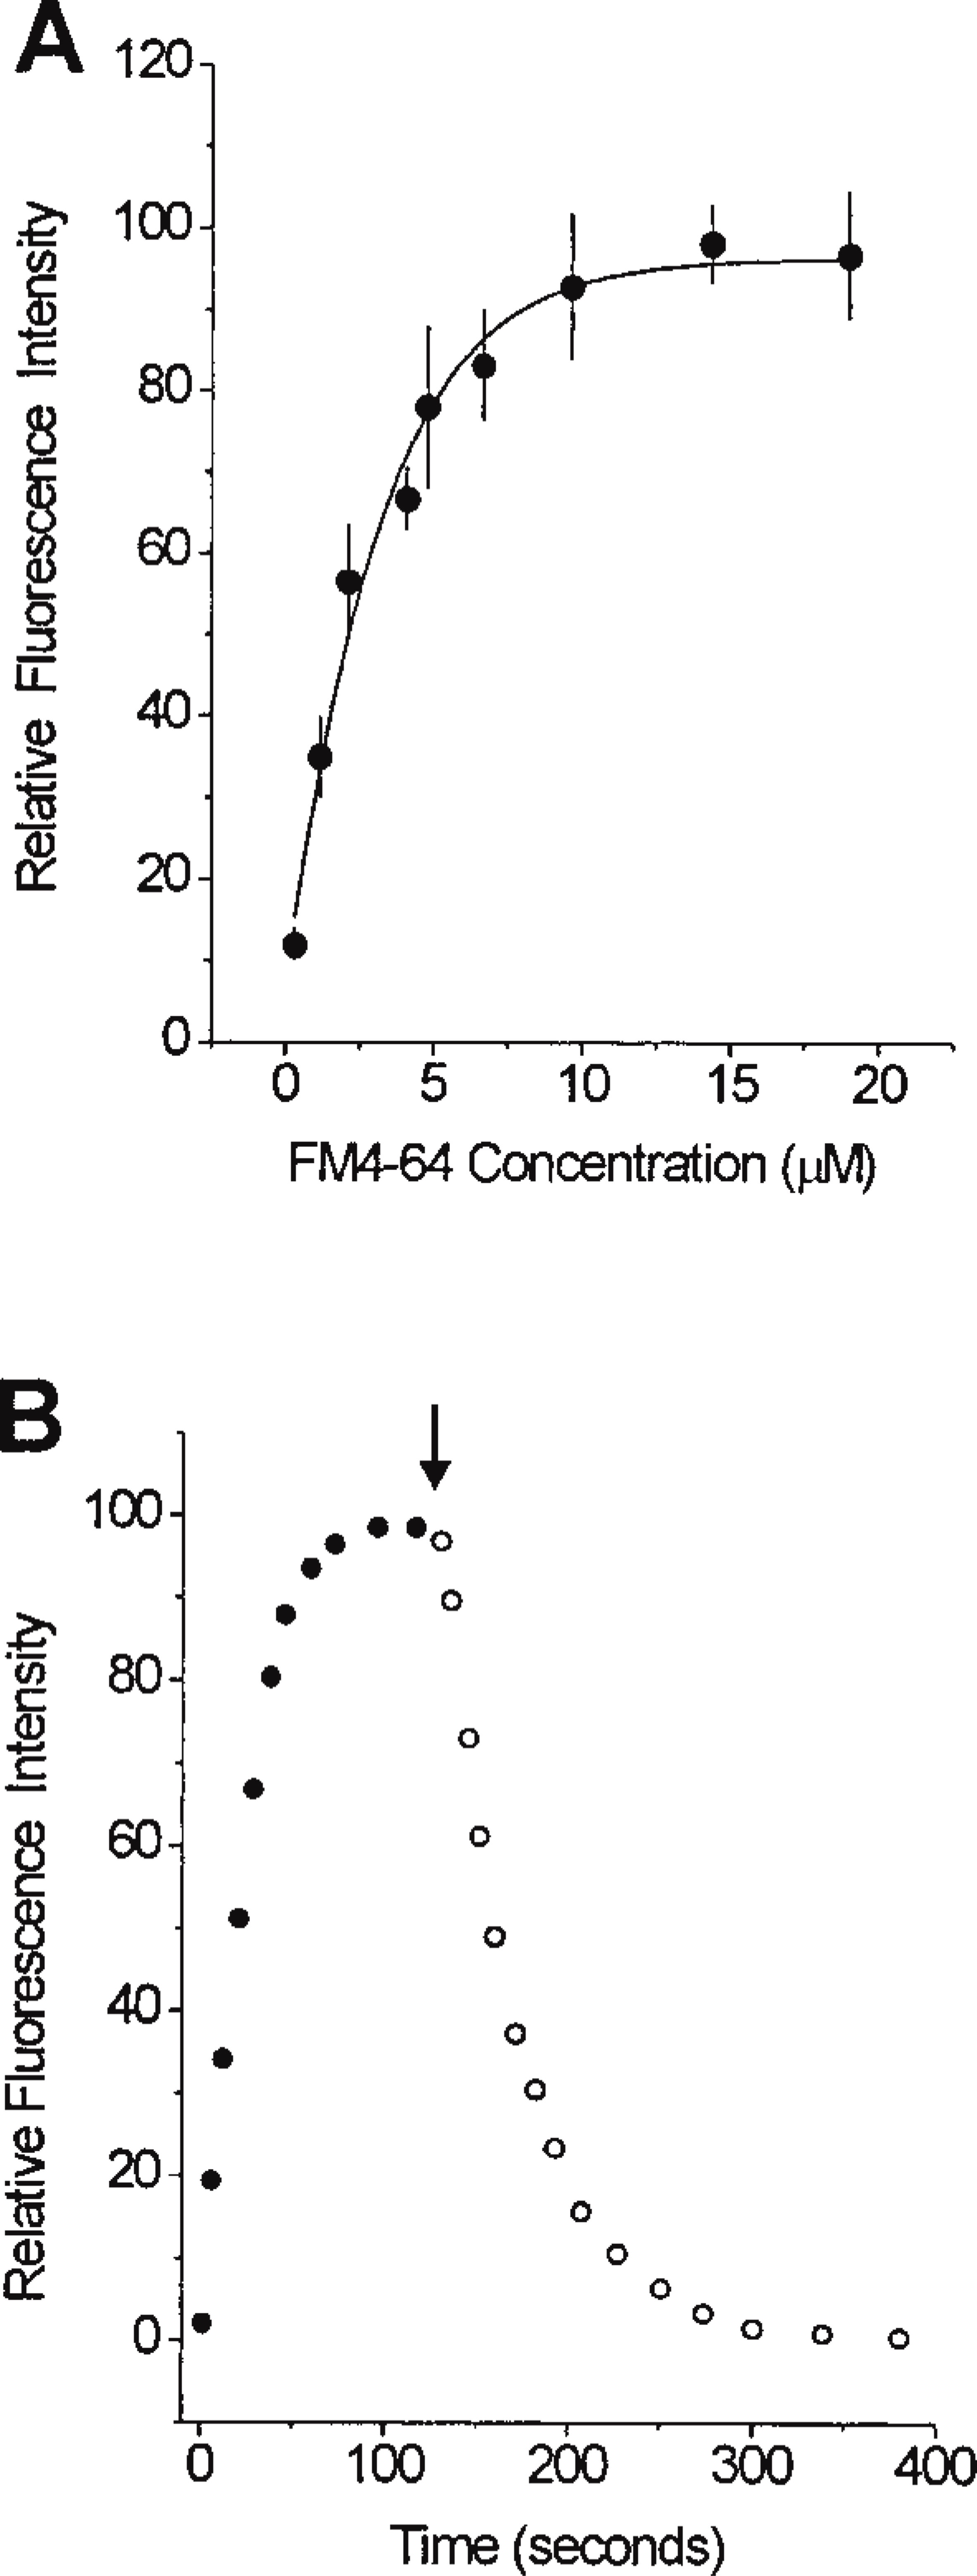
Kinetics of binding and washout of FM 4–64 in living PS120–E3G cells. (
Results of confocal analysis of the intracellular distribution of NHE3–GFP in PS120–E3G cells are shown in Figure 9. Under basal conditions, 25.0 ± 2.5% of the total cellular NHE3–GFP was located at the PM. This value did not change significantly among several batches of PS120–E3G cells, regardless of the variability in cell size and the absolute expression of NHE3–GFP among the cells examined (data not shown). To test the ability of confocal morphometric analysis to detect changes in PM expression of NHE3–GFP in the same living cell, we exposed PS120–E3G cells to a PI 3-K inhibitor, wortmannin. Inhibition of PI 3-K has been previously reported to decrease the PM expression of NHE3 and, consequently, to significantly inhibit NHE3 activity in AP-1 cells (Kurashima et al. 1998). Preincubation of PS120–E3G cells with wortmannin resulted in a rapid, visible change in the pattern of distribution of NHE3–GFP (Figure 10). The magnitude of expression of NHE3–GFP at the PM decreased significantly, and this was associated with compaction of the juxtanuclear accumulation of the fusion protein and disappearance of the intracytoplasmic particles. Confocal morphometric analysis confirmed these subjective conclusions and revealed a significant threefold decrease in the PM fraction of the total cellular NHE3–GFP content in the wortmannin-treated cells (Figure 9). This decrease in the PM content of NHE3 was associated with a significant decrease in the exchanger's activity (from 0.052 ± 0.004 to 0.02 ± 0.004 (ΔpHi/sec); mean ± SE from 56 cells in three separate experiments). The degree of the inhibitory effect of wortmannin on the NHE3–GFP activity roughly corresponded to the degree of decrease of expression of the protein at the PM, which suggested that most if not all regulation of NHE3 activity by wortmannin occurred via removal of NHE3–GFP molecules from the PM.
To verify the results of confocal morphometric analysis, we evaluated the PM expression of NHE3 in PS120–E3G cells using quantitative cell surface biotinylation (Figure 11). This method yielded the values of relative PM content of NHE3–GFP in PS120–E3G cells of 22 ± 1% and 5+1% for control and wortmannin-treated cells, respectively, thus very similar to the results provided by confocal analysis (Figure 9). Under both experimental conditions, values obtained from biotinylation were slightly lower than those provided by confocal analysis. This difference, however, was not statistically significant.
Discussion
In this report we describe details of a novel morphometric method developed to quantitate NHE3–GFP expression at the PM of living PS120 fibroblasts. The method, based on CLSM and digital image processing, is reproducible, fast, and the measurement can be performed in the same cell more than once, thus enabling direct comparison of pre- and post-treatment expression of NHE3–GFP at the PM.
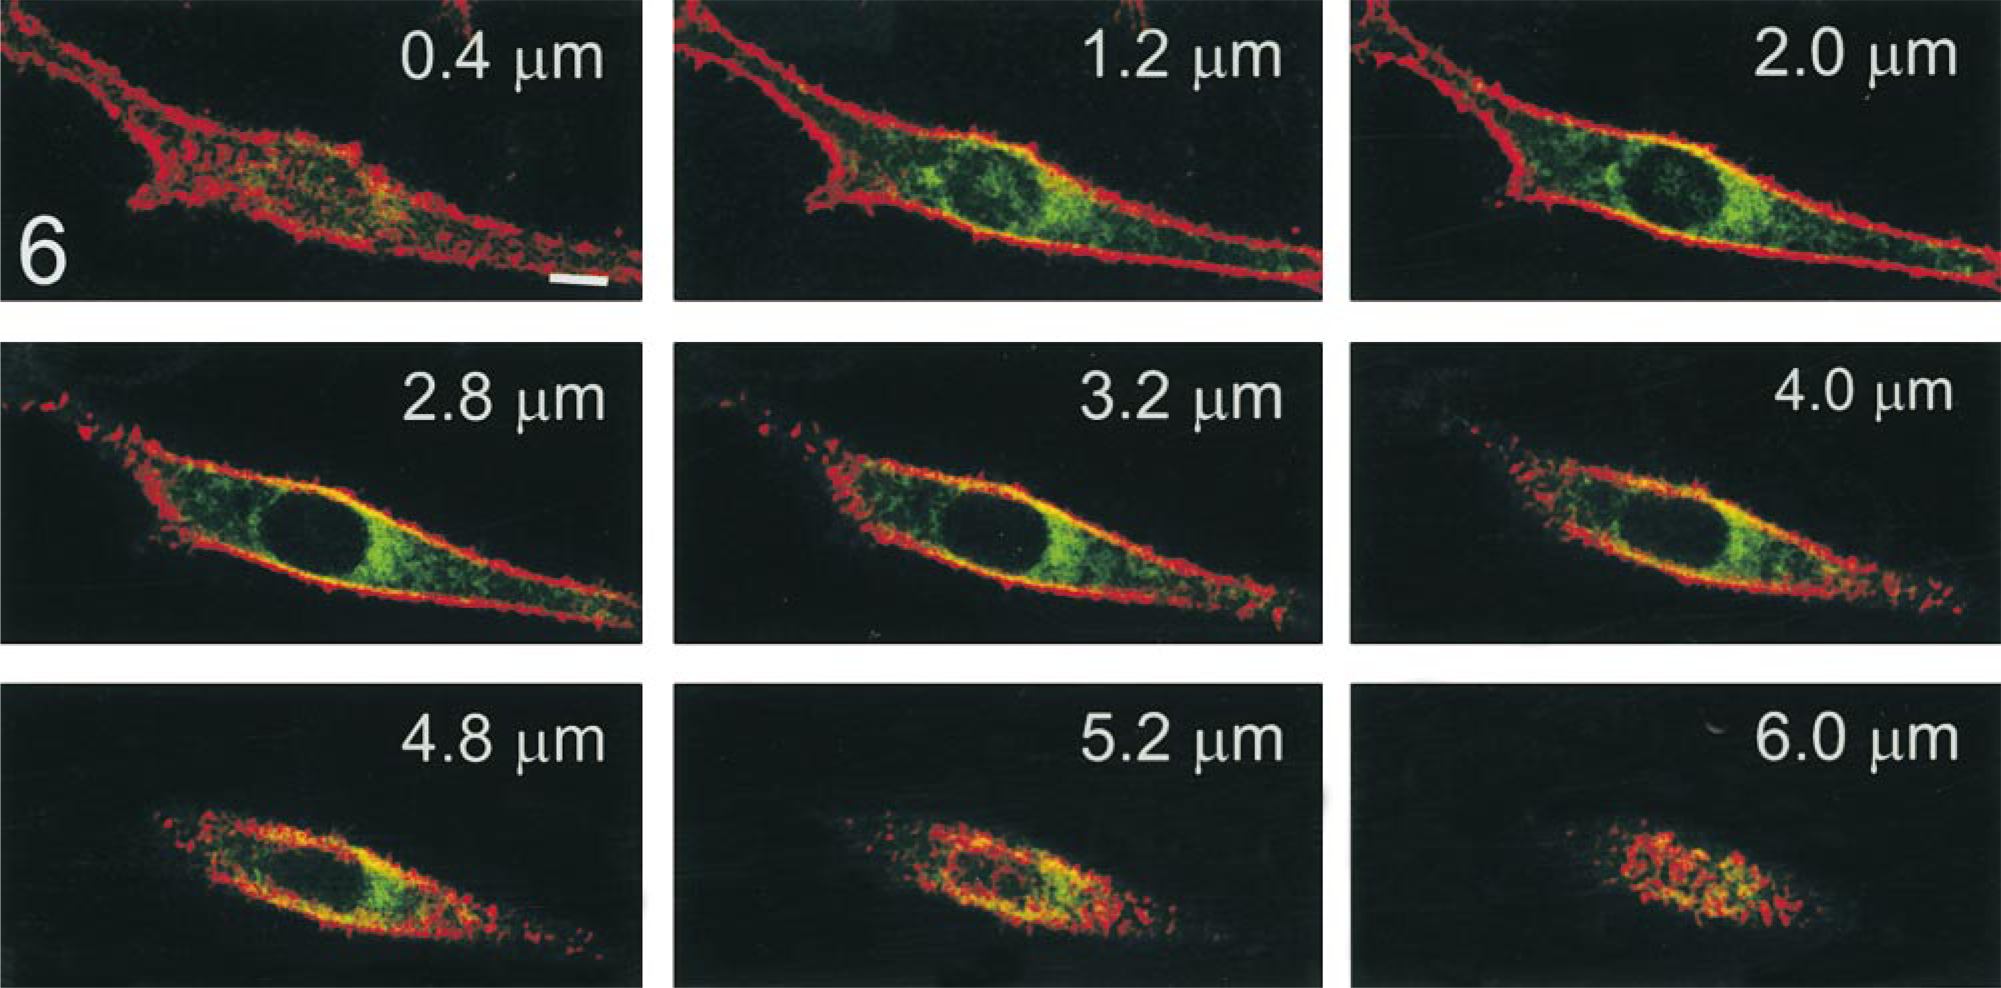
Serial optical sections of living PS120–E3G cells obtained by CLSM. Cells were superfused on a microscopic stage with FM 4–64 at 4C, and signals from FM 4–64 (red) and NHE3–GFP (green) were collected by separate photomultipliers. Sections were collected in steps of 0.4 μm. Note a relatively weak signal from FM 4–64 in plasma membrane planes parallel to culture substratum (e.g., at 0.4 μm and 6.0 μm). Numbers in the right upper corners indicate distance from the coverslip surface. Some images in the stack are not shown. Bar = 10 μm.
In the majority of applications, immunofluorescent or immunohistochemical methods are used primarily as qualitative tools and only rarely have been applied for semiquantitation of the antigen of interest. The reasons for this are the limitations related to the very principles of these methods. These include a difficult to define stoichiometry of antigen–antibody binding, problems with reproducibility and sensitivity, and the interference of out-of-focus fluorescence when epifluorescent illumination is used. The latter problem could be relatively easily solved by using confocal microscopy or digital deconvolution algorithms. The other difficulties are not easy to overcome. A major advance in the area of quantitative fluorescence microscopy was the introduction of GFP as a fluorescent tag for the protein of interest. The initially used wild-type GFP cloned from the jellyfish Aequorea victoria (Prasher et al. 1992) was relatively susceptible to photobleaching and its correct folding (necessary for fluorescent properties) required temperatures of 28–30C, which potentially limited applications in eucariotic cells (Ogawa et al. 1995; Patterson et al. 1997). Moreover, the fluorescence intensity of wild-type GFP was relatively sensitive to variations in environmental conditions such as protein concentration, ionic strength, and pH (Ward et al. 1982; Robart and Ward 1990). Some of these limitations were circumvented by the recent introduction of several mutated variants of GFP that exhibited more convenient emission spectra, increased resistance to photobleaching, and more efficient folding at 37C (Delagrave et al. 1995; Cormack et al. 1996; Heim and Tsien 1996; Ormo et al. 1996). In our studies we used a red-shifted variant of GFP (eGFP), which has two mutations introduced in the α-helix region critical for the fluorophore formation (F64L/S65T) (Cubitt et al. 1999) and which is codon-optimized for improved expression in eucaryotic cells (Yang et al. 1996b). In comparison with the wild-type GFP, eGFP has a higher quantum yield, is 25–30 times more resistant to photobleaching, and folds efficiently at 37C (Patterson et al. 1997). Therefore, this GFP mutant appears to be very well suited for use in quantitative approaches. Moreover, a well-defined stoichiometry of the GFP and the protein of interest molecules (usually 1:1) and the availability of recombinant GFP preparations make quantitation of the GFP-tagged proteins much more reliable than approaches using direct or indirect immunolabeling. Nevertheless, any quantitative method, including the one described here, is based on several assumptions, which must be verified experimentally for any particular experimental design (Piston et al. 1999). The steps taken by us in the process of such verification are discussed below.
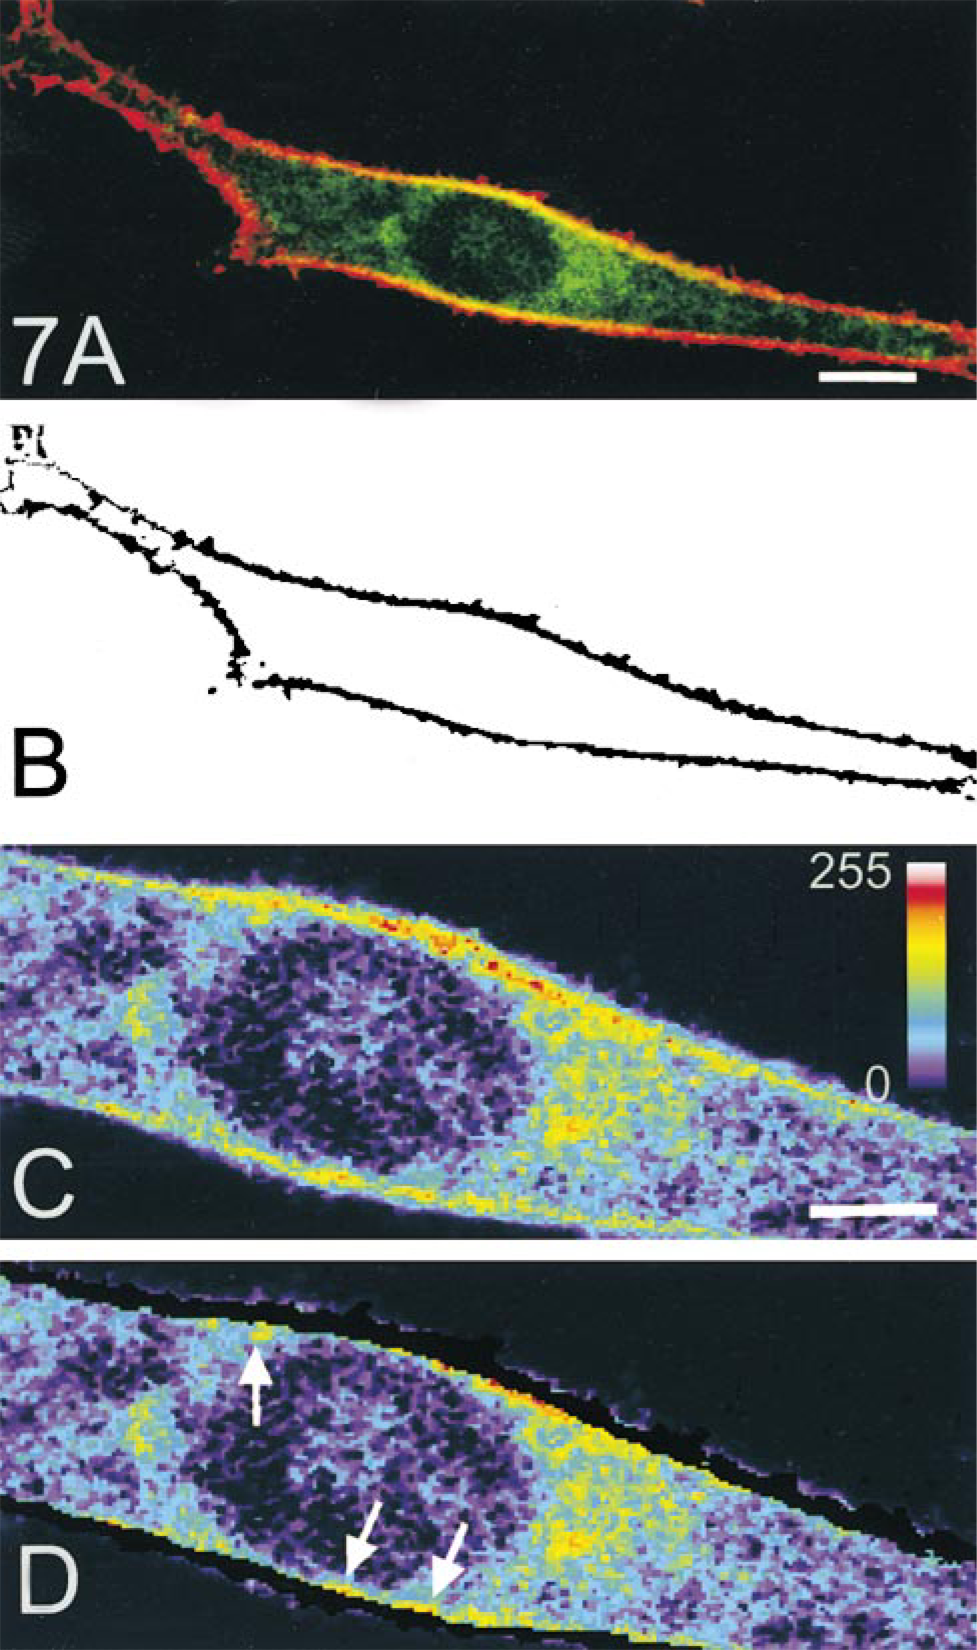
Graphic representation of major steps of the confocal morphometric analysis (
In the first step during development of the confocal morphometric analysis, we evaluated the susceptibility of NHE3–GFP to photobleaching. Although eGFP was reported to be very resistant to photobleaching, photobleaching-related loss of fluorescence might be a problem because of the large number of scans needed to complete the analysis. The bleaching control experiments were performed using PS120–E3G cells that were lightly fixed to prevent lateral diffusion of NHE3–GFP during examination. After approximately 80 single-frame scans (needed to image an entire living cell) performed with the laser power set at the level used in actual experiments, the photobleaching-related loss of fluorescence was only ∼5% of the average initial level. Moreover, the major parameter measured in our experiments (PM expression of NHE3–GFP relative to the total cell content of the fusion protein) was relatively insensitive to the bleaching-related proportional drop of fluorescence intensity within an optical section of the examined cell. Therefore, we did not correct the results for the degree of photobleaching when cells were scanned only once. However, we did correct for photobleaching when the same cell was scanned twice (e.g., in the cell shown in Figure 10).
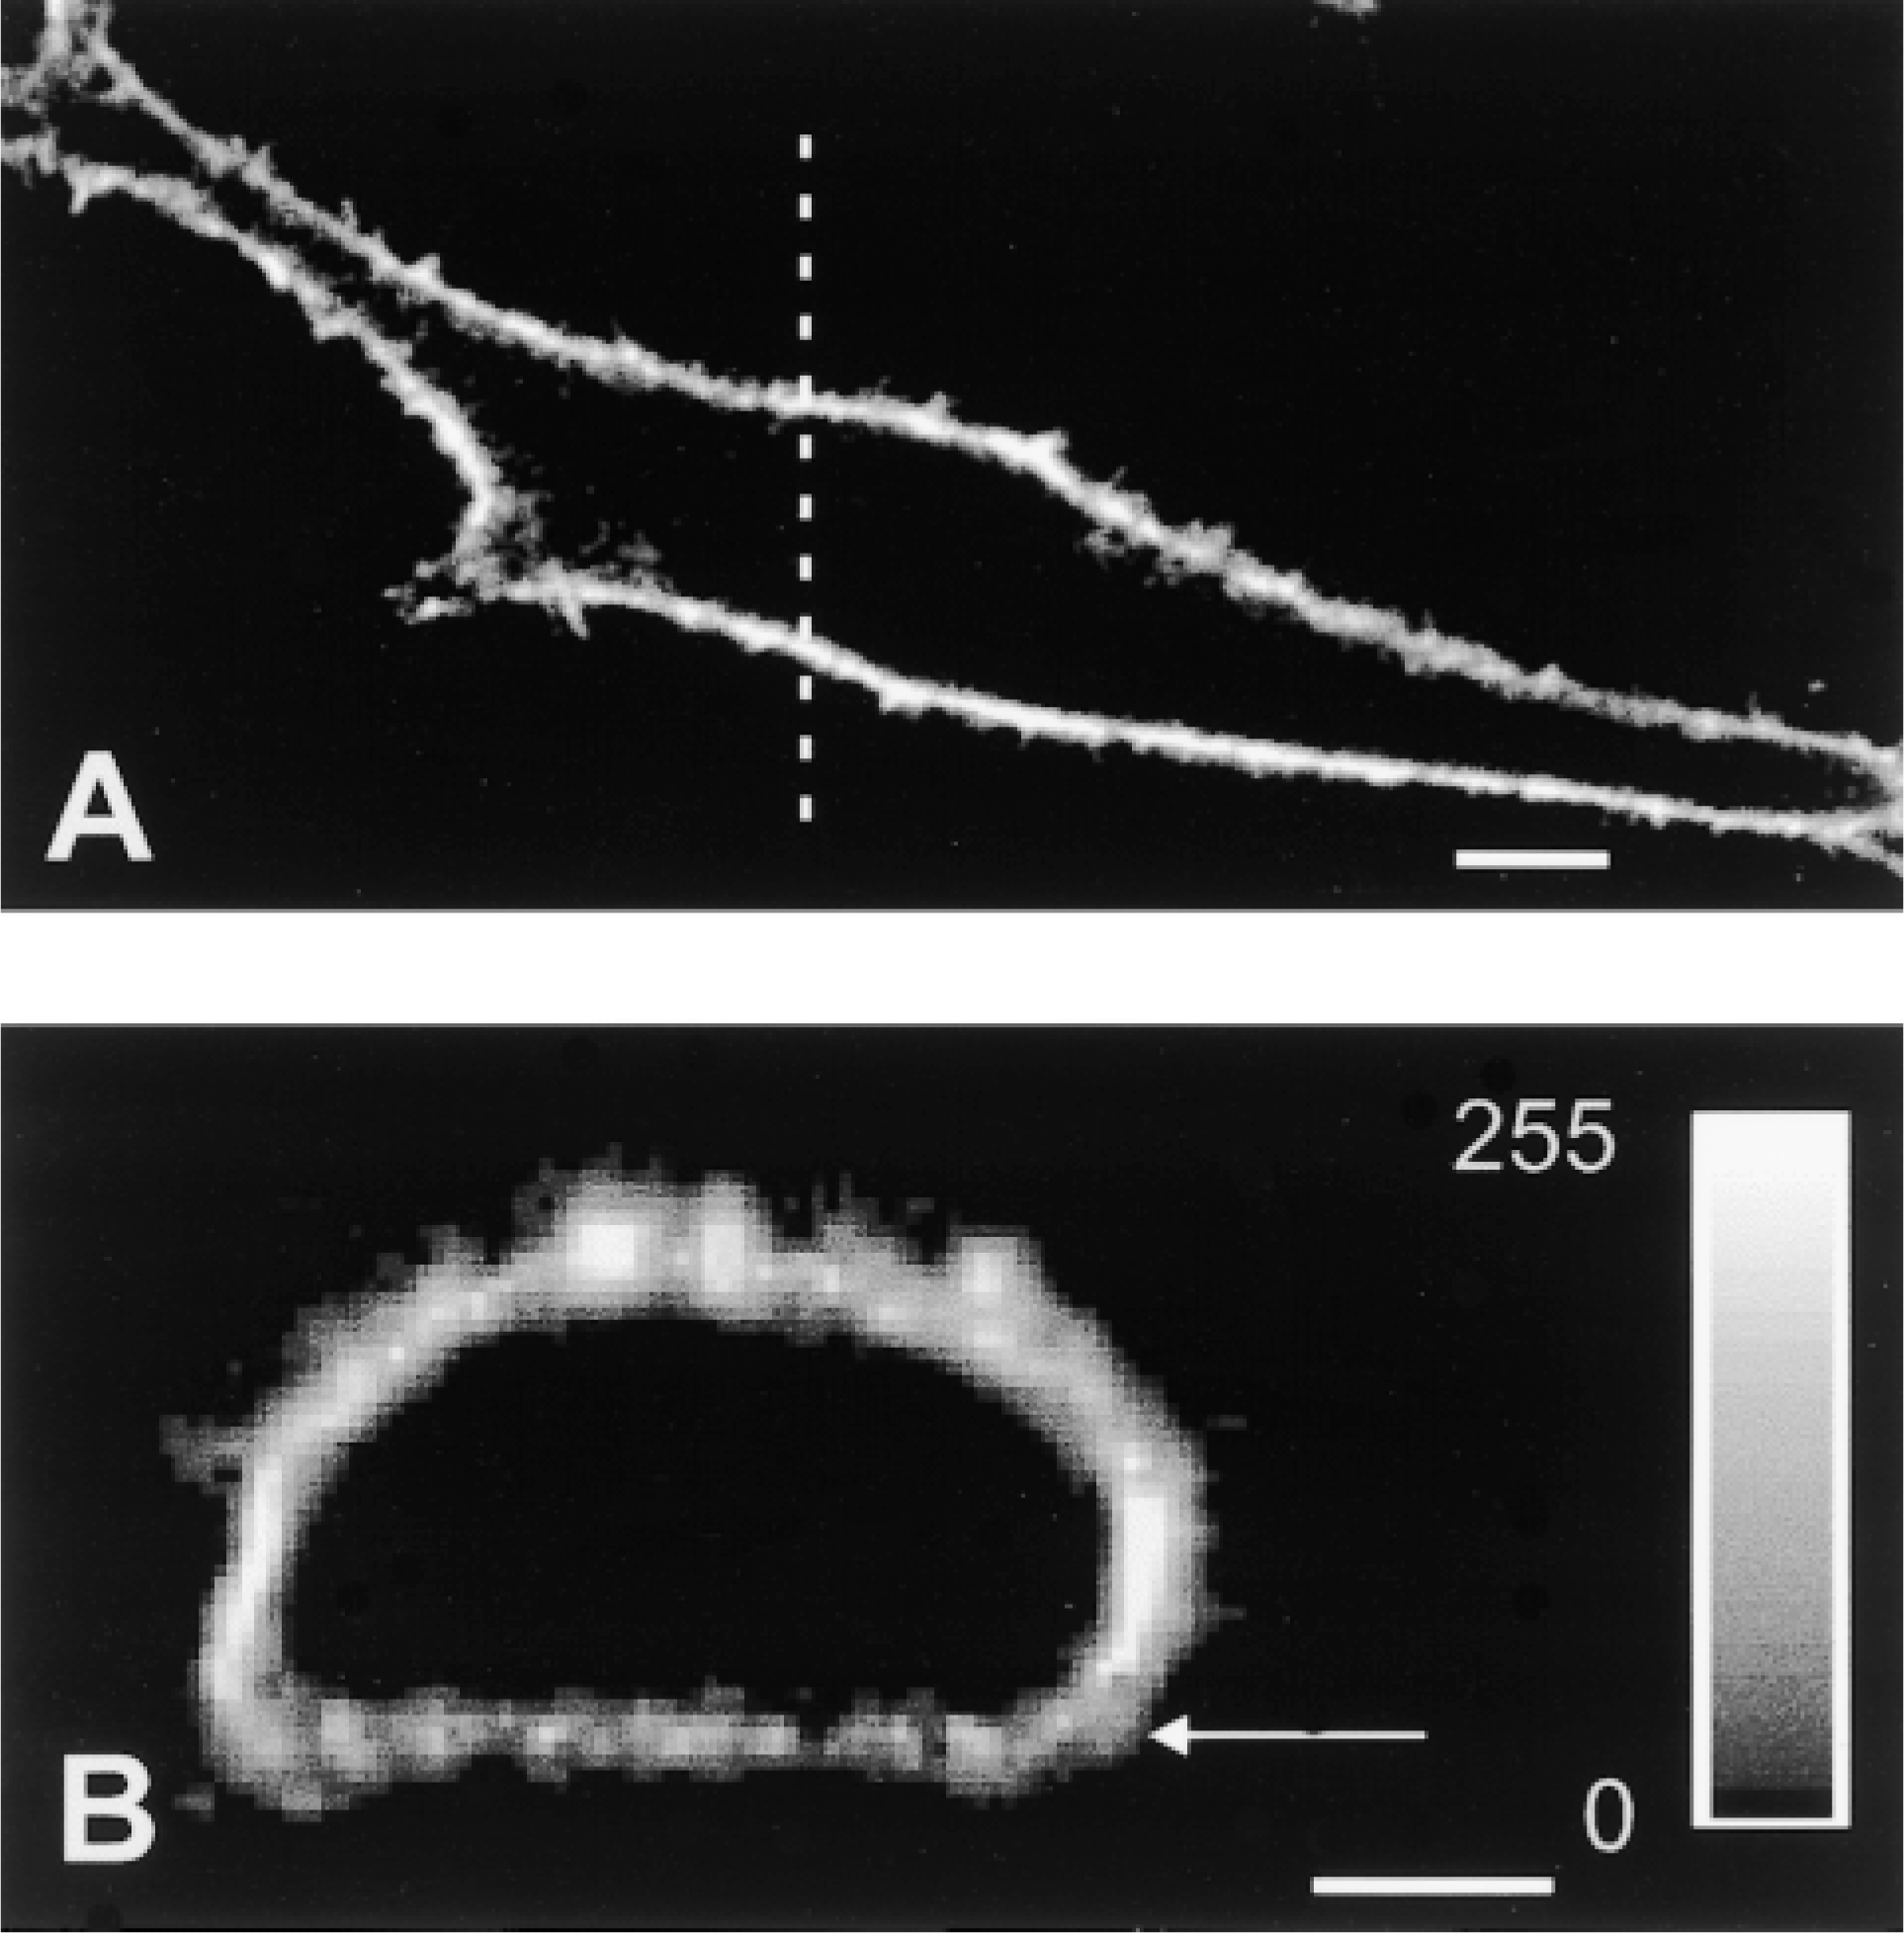
Illustration of the approach used to define the membrane/cytoplasm interface in a portion of the plasma membrane of PS120–E3G cells facing culture support. (
The second parameter of critical importance was the linearity of the protein concentration/fluorescence intensity relationship for NHE3–GFP. We examined this parameter using serial dilutions of NHE3–GFP obtained from lysed PS120–E3G cells. As demonstrated in Figure 3, the dose–response curve was linear over two logs of magnitude, and it became nonlinear only with very low concentrations of NHE3–GFP (not shown on the graph). This high degree of linearity of the dose–response curve provides an important justification for relative quantitation of the proteins of interest fused with GFP, and also for recently described calculations of the absolute amounts of the protein of interest in given intracellular compartments (Hirschberg et al. 1998). Regardless of whether the method is used for an absolute or a relative quantitation, however, the calculated amount of protein is derived from the integrated fluorescence intensity measured in the examined region of the optical section of the cell. Therefore, one of the most important assumptions of the CLSM analysis was that the measured fluorescence intensity directly reflected GFP quantities. This, however, required careful examination of factors that could potentially affect GFP fluorescence intensity. The best-characterized of these factors is the concentration of H+ ions in the protein's environment (Patterson et al. 1997; Kneen et al. 1998; Robey et al. 1998). Wild-type GFP and most GFP mutants become dimmer as the pHi decreases, and this is especially pronounced at pHi values ≤6.8 (Patterson et al. 1997). Because the interior of endosomal vesicles and lysosomes is much more acidic than that of other intracellular compartments (for review see Mellman 1996), GFP moieties positioned within endosomes or lysosomes would appear much dimmer than their counterparts in other less acidic compartments. This phenomenon could potentially be of advantage if one wanted to monitor the intraorganellar pH but would result in significant errors during quantitative analysis. We circumvented this potential problem by fusing eGFP molecules with the carboxy terminal cytoplasmic portion of NHE3. With this strategy, the eGFP moiety of the fusion protein is surrounded by a cytoplasmic environment regardless of whether NHE3–GFP molecules are expressed at the PM or at the membranes limiting recycling or lysosomal vesicles. Even with this approach, however, the intensity of GFP fluorescence could still be affected by the local pH gradient which could, in theory, be generated by the activity of NHE3 in the narrow zone of cytoplasm adjacent to the PM. We examined this possibility using a SNARF-1 fluorescent pHi indicator and high-resolution confocal microscopy. Using this approach, no significant differences in pHi were observed within ∼100 nm (linear dimension of a single pixel) cytoplasmic zone adjacent to the PM in the resting cells, in which NHE3 operated at the very low steady-state level. In theory, such a gradient might still exist in a zone smaller than the resolution of the system. It should still be detectable at the level of a single pixel, however, considering that the SNARF-1 method detects pHi differences as low as 0.02 pH units (Janecki et al. 2000).
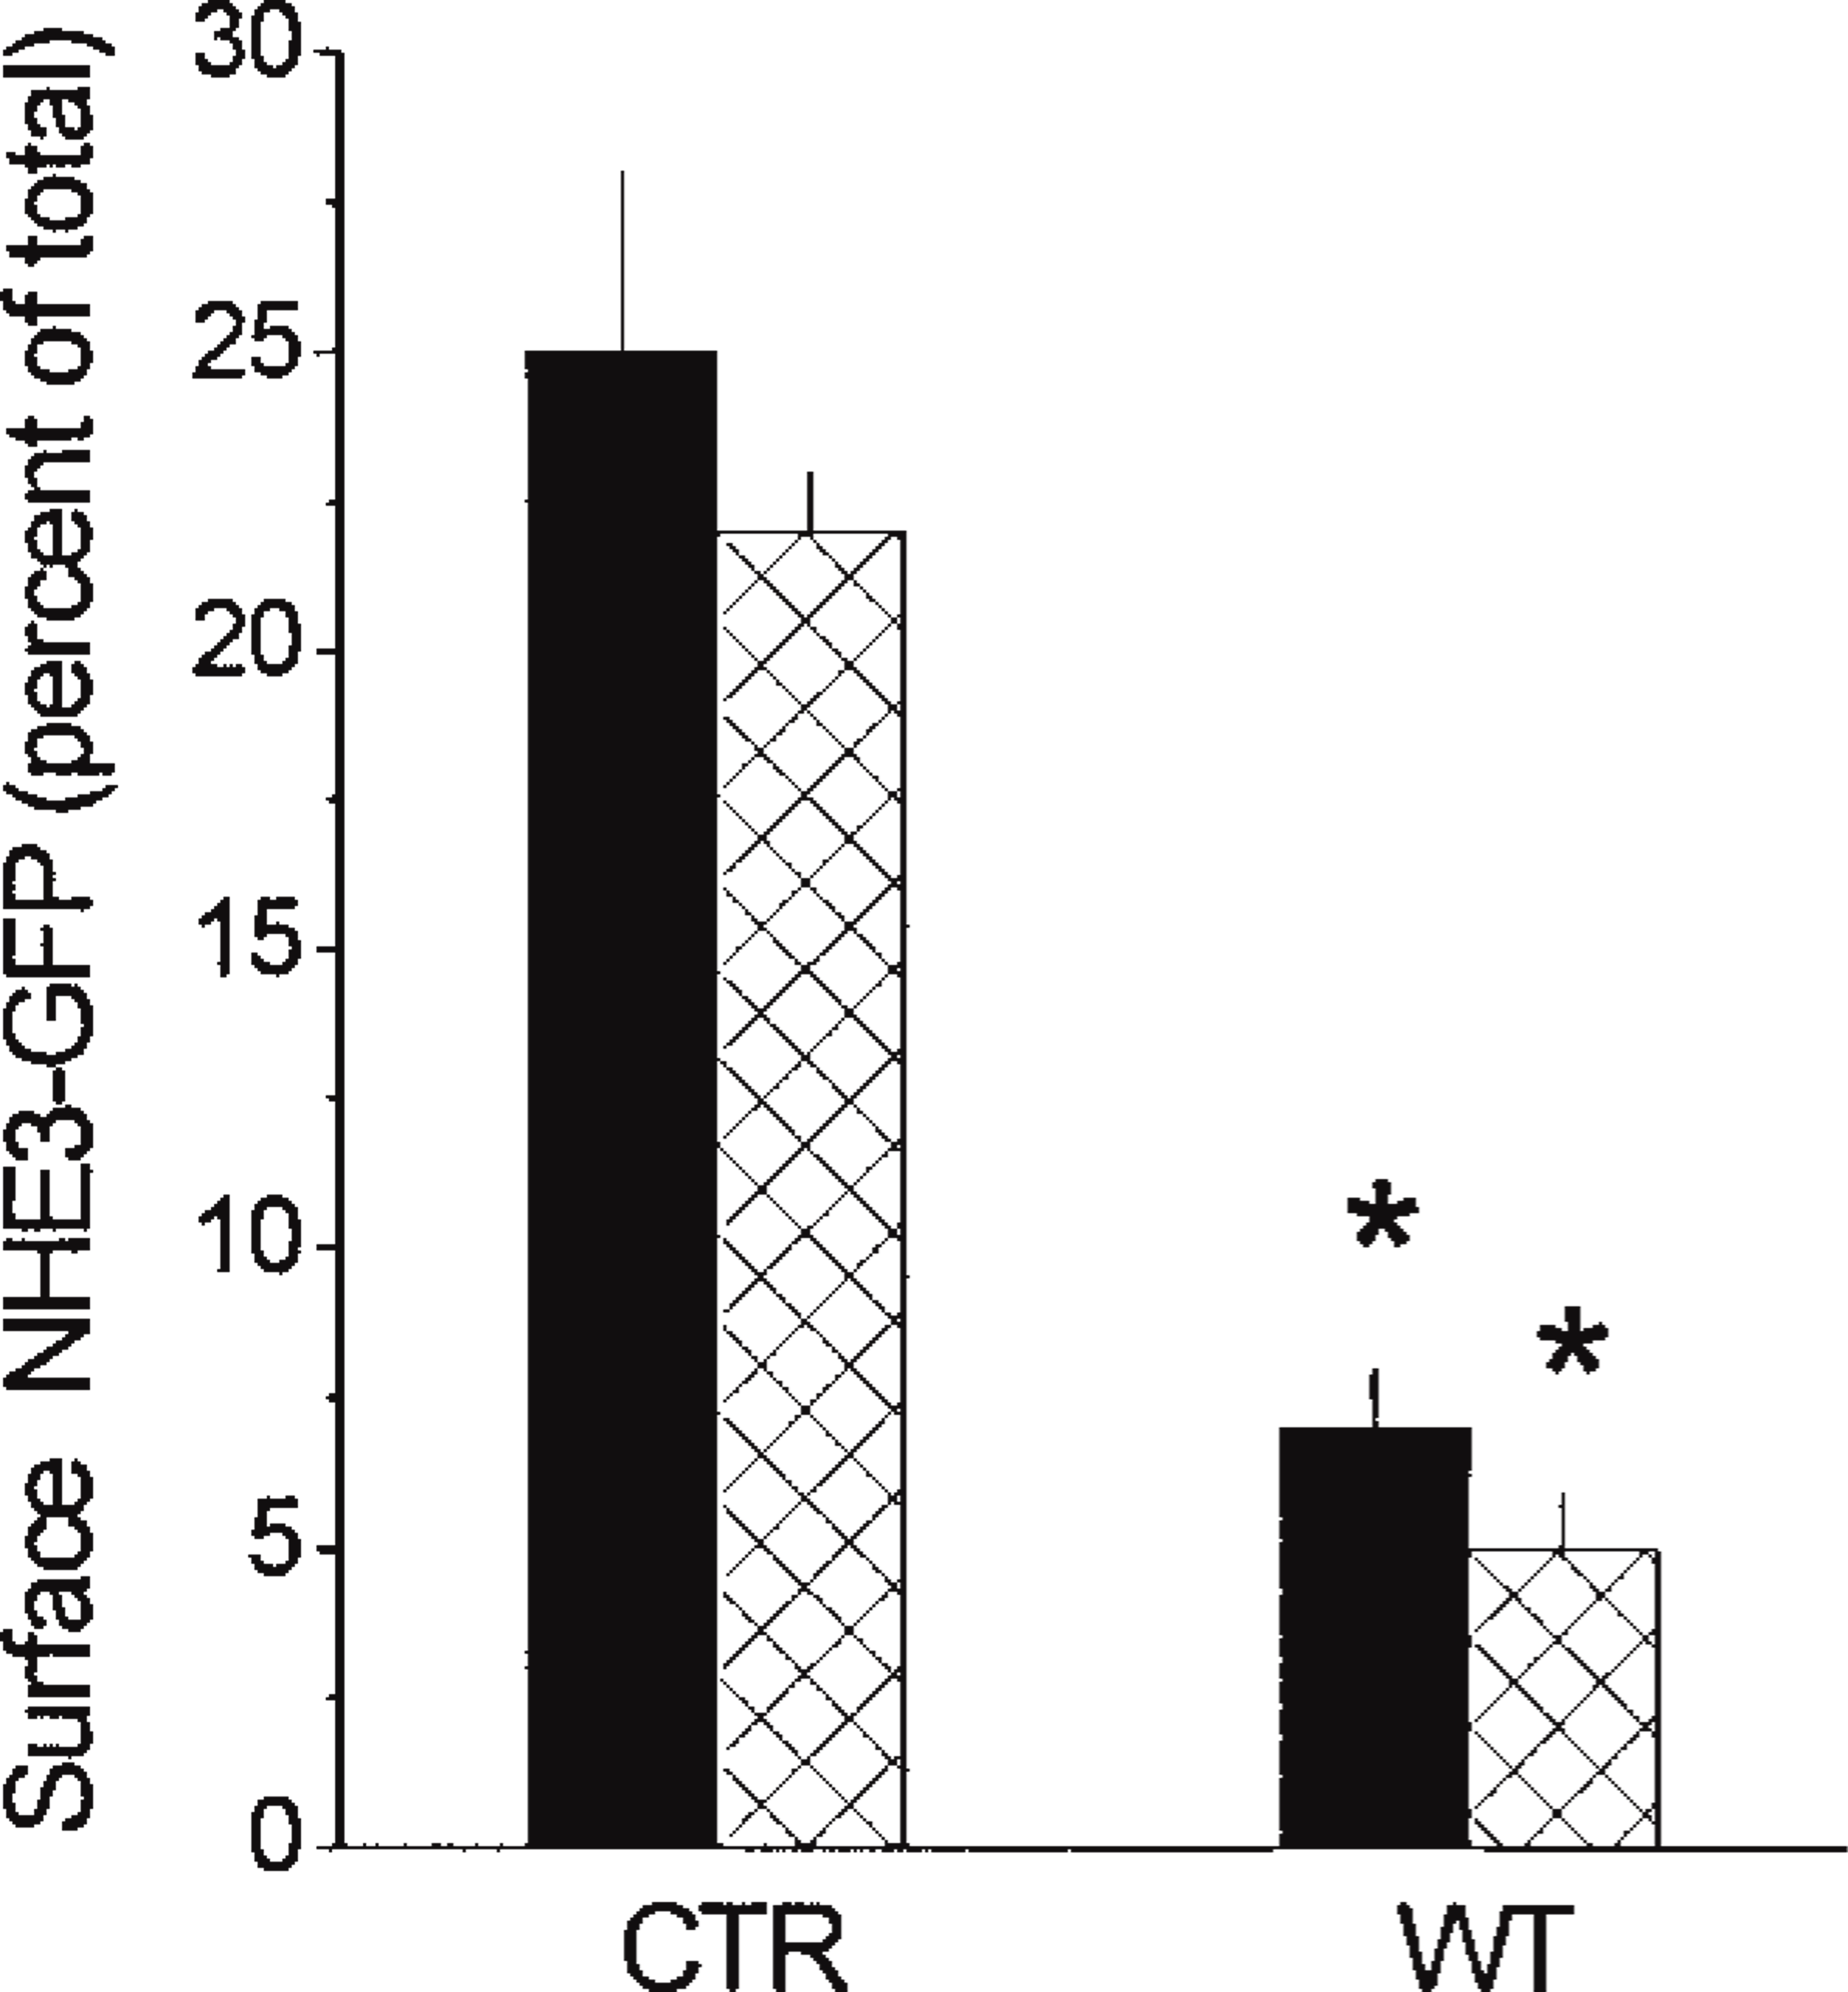
Relative plasma membrane content of NHE3–GFP in control (CTR) and wortmannin-treated (WT) PS120–E3G cells evaluated by confocal morphometric analysis (solid bars) or by surface biotinylation (cross-hatched bars). Data are means ± SE from 48 cells in two experiments, and are presented as percent of total cellular content of NHE3-GFP. ∗ Significantly different from respective CTR value (p < 0.001).
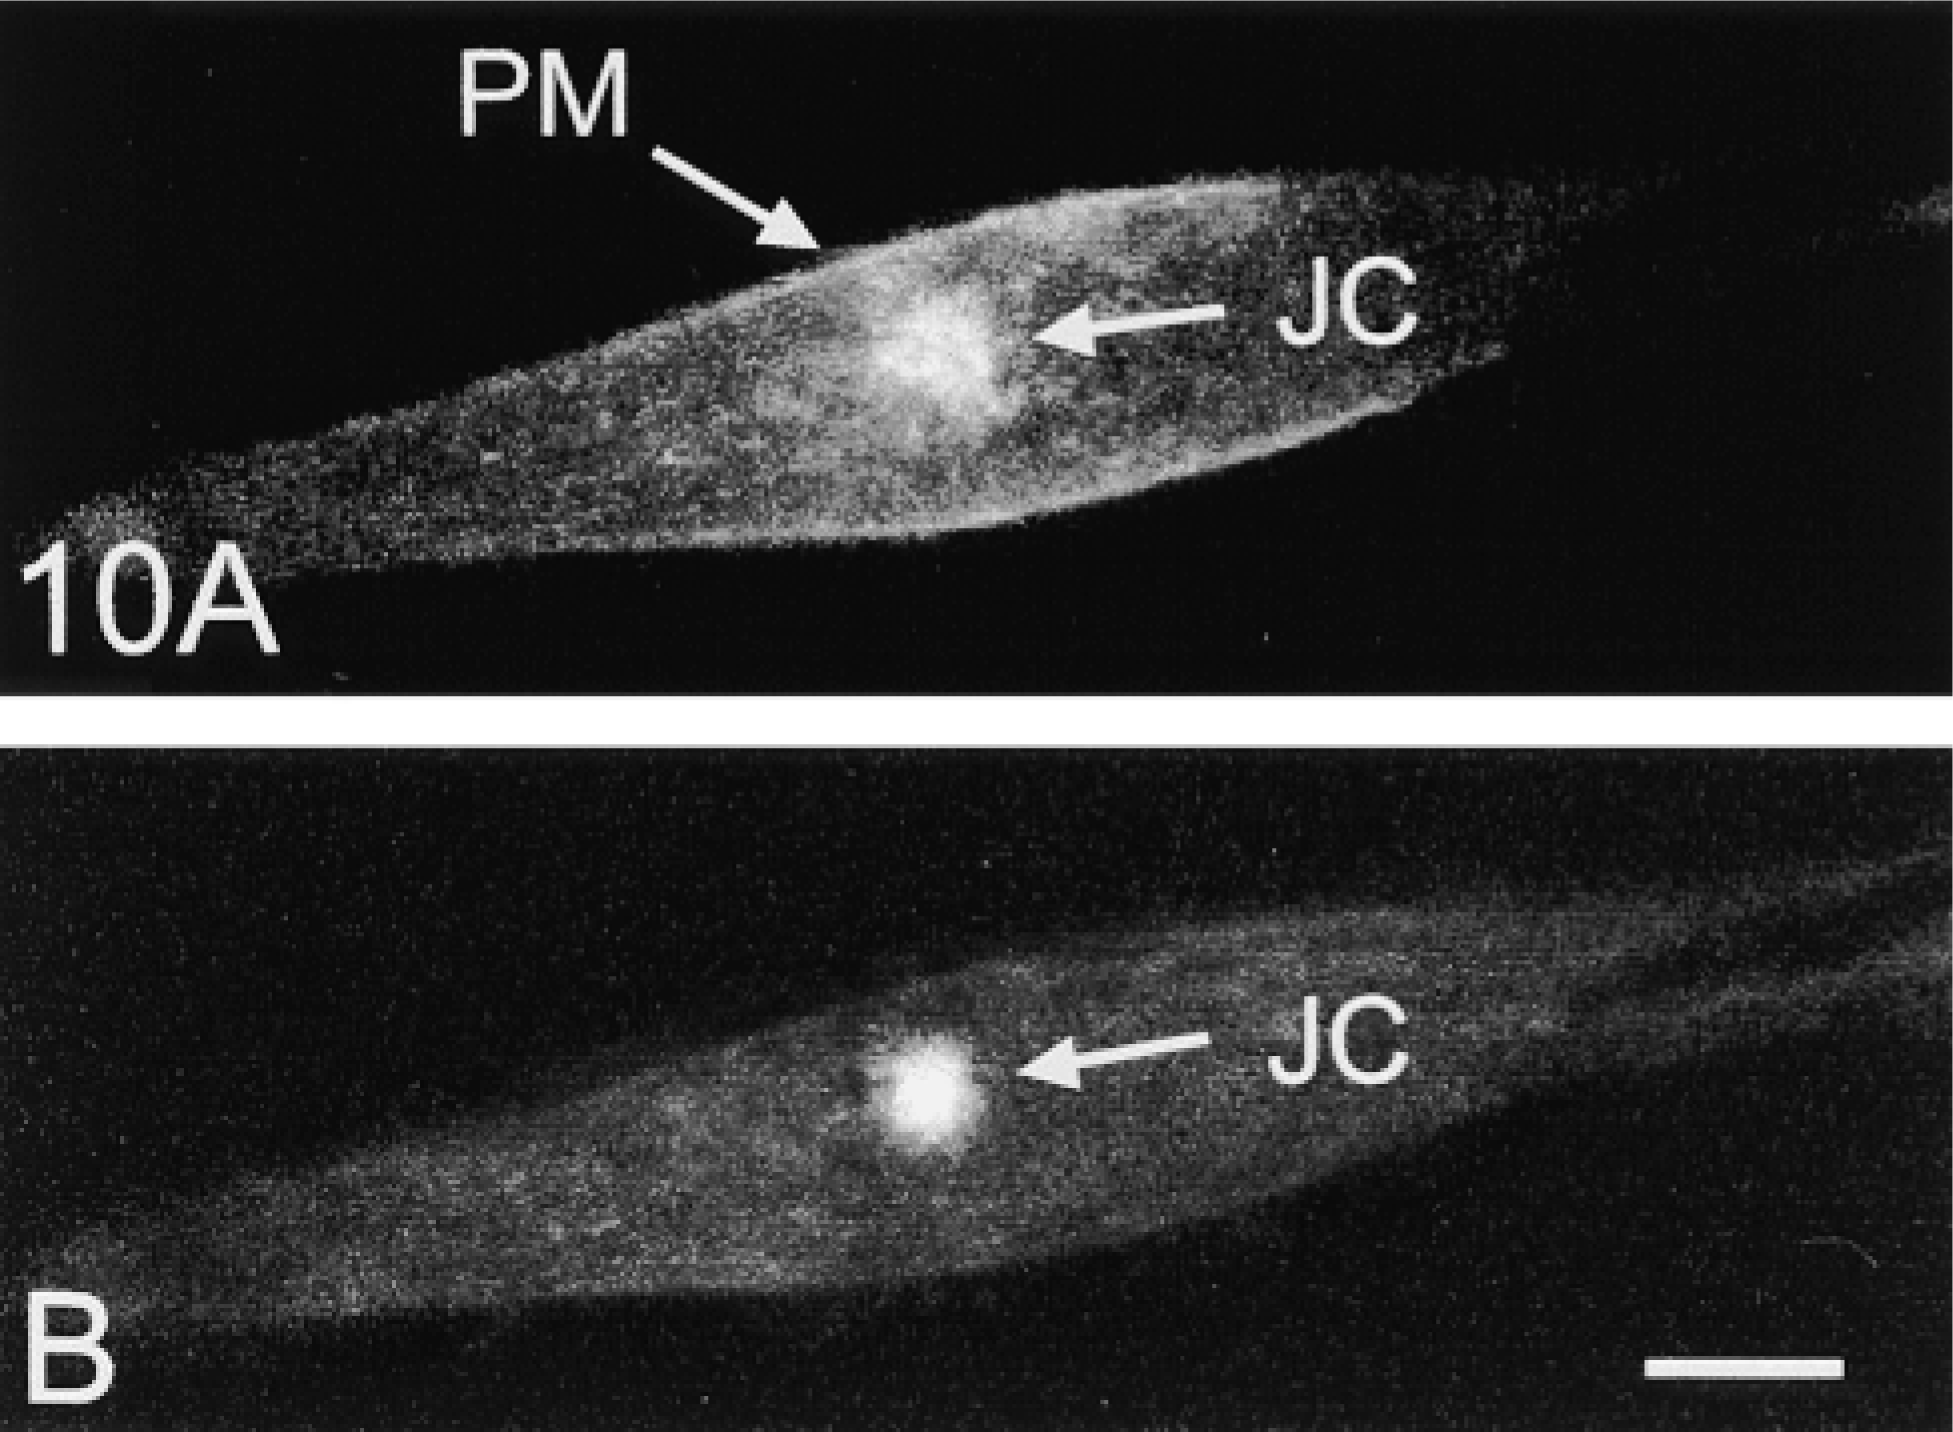
Confocal microscopic images of a PS120–E3G cell before (
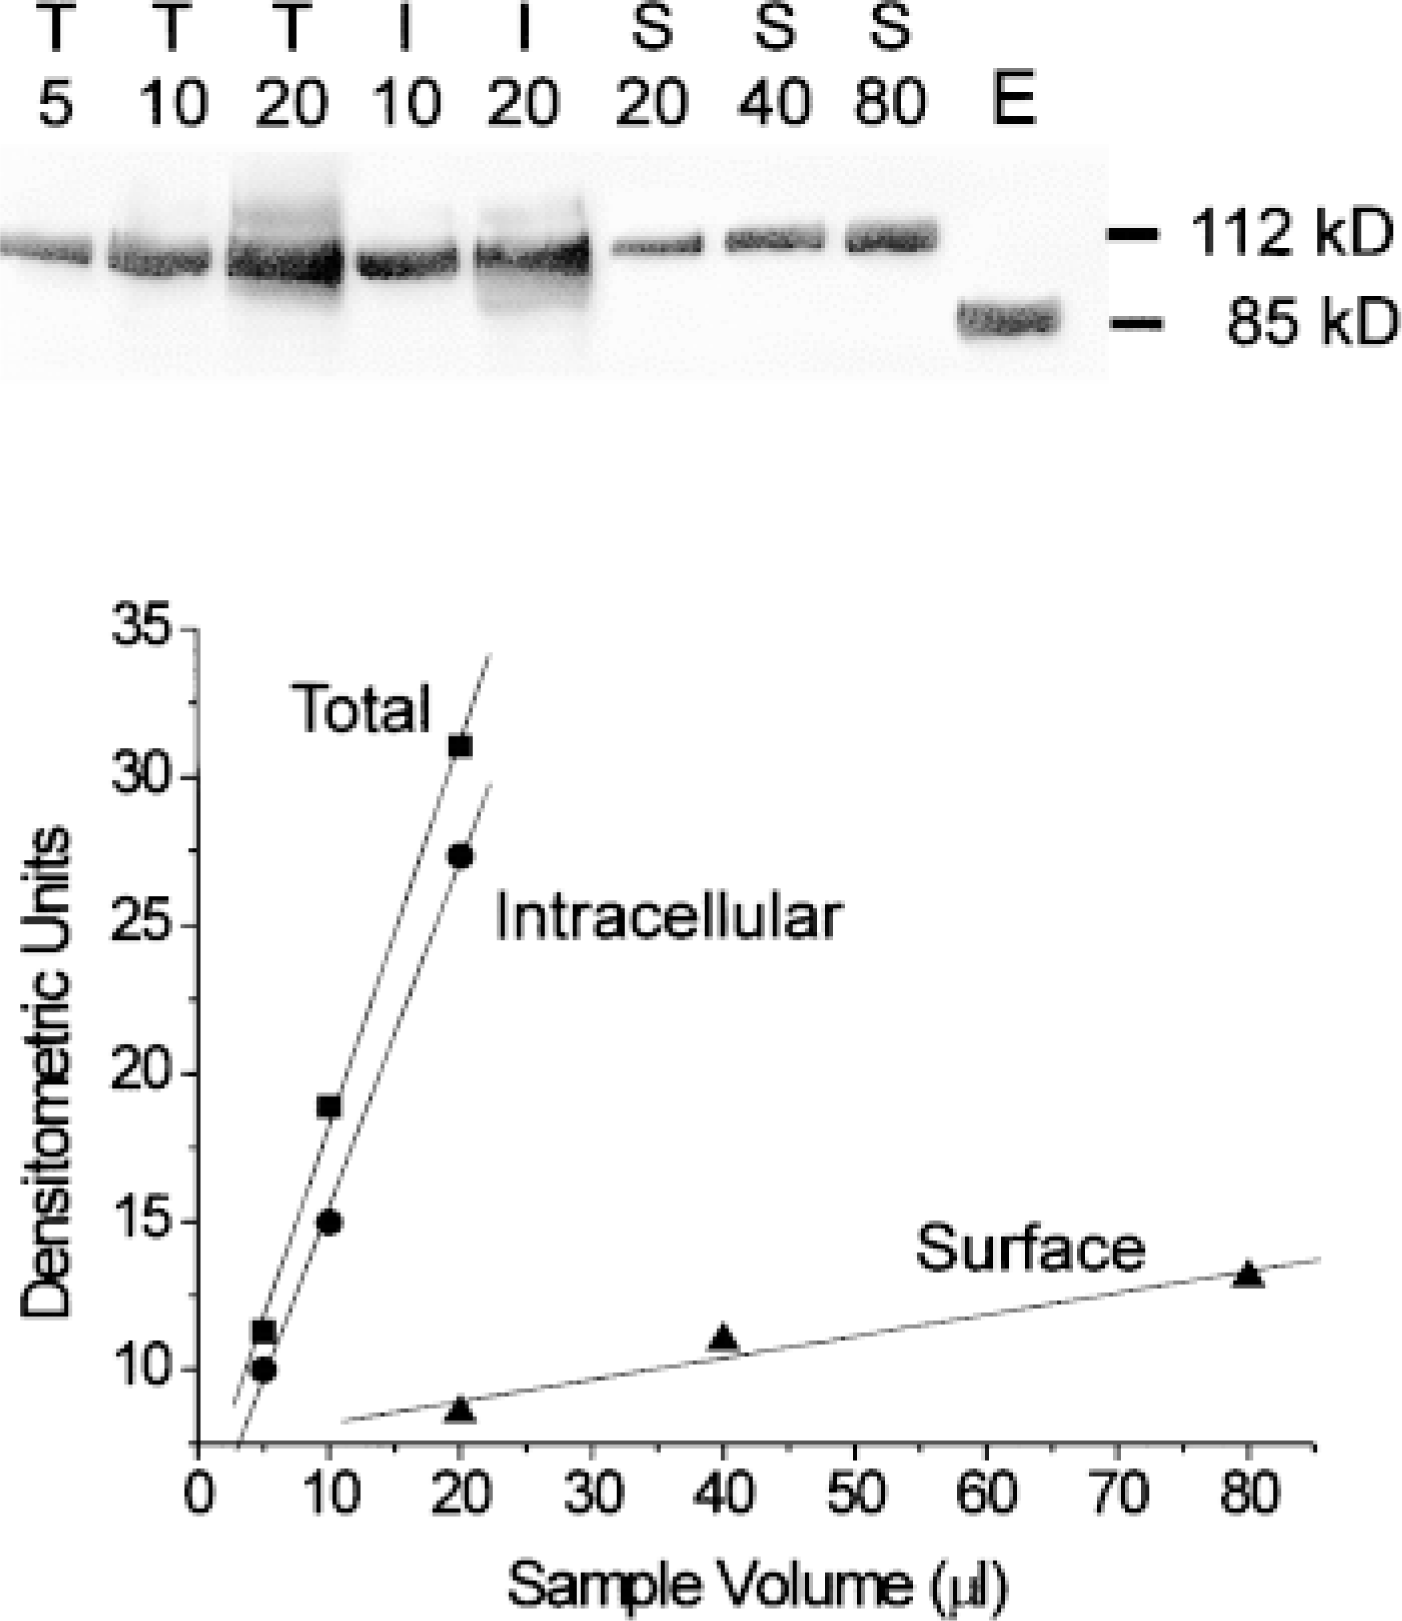
Quantitation of relative PM content of NHE3–GFP in PS120–E3G cells by surface biotinylation. Plasma membrane proteins were biotinylated, followed by cell lysis and incubation of lysates with avidin-agarose to recover biotinylated proteins. Total (T), intracellular (I), and surface (S) fractions were loaded at indicated volumes (in μl) on a polyacrylamide gel, separated by electrophoresis, electroblotted on nitrocellulose, and probed with an anti-VSVG monoclonal antibody (upper panel). A standard membrane preparation obtained from PS120 cells expressing NHE3–VSVG protein was run in Lane E. Note the presence of a dominant band with MW ≈ 112 kD (approximate MW of NHE3–GFP fusion protein) in all preparations obtained from PS120–E3G cells. Also note an absence of proteins of MW ≈ 85 kD (the MW of the NHE3–VSVG moiety), which confirms lack of expression of NHE3–VSVG free of GFP tag. Quantitation of NHE3–GFP in the three preparations was performed using densitometric analysis (lower panel). Densitometric values of three dilutions of each preparation are plotted against respective sample volume. For quantitation, the preparations were compared at a similar range of densitometric values
The major goal during development of confocal morphometric analysis was a reproducible quantitation of distribution of the total cellular pool of NHE3 between the PM and the cell interior under various experimental conditions. To achieve this goal, we had to be able to reliably distinguish between NHE3 molecules located at the PM and those associated with intracellular structures adjacent to the PM, including particles most likely representing recycling vesicles (Figure 1B). In one recent report, a GFP fluorescence associated with PM was quantitated using a visual subjective definition of the PM boundaries (Powell et al. 1999). Such an approach may provide only a rough estimate of the PM content. Moreover, its accuracy depends on the dynamics of intracellular trafficking of the protein of interest: the more recycling vesicles located adjacent to the PM at steady-state, the less accurate such a subjective quantitation will be. To precisely map the area corresponding to the PM, we used a styryl dye, FM 4–64. This lipophilic fluorophore exhibits several characteristics ideally suited for our studies. FM 4–64 binds to the outer lipid layer of the PM, is membrane-impermeable, and is not cytotoxic (Betz et al. 1996). Moreover, the fluorophore has a high partition coefficient between water and lipid environments, which results in a very low fluorescence of the bathing solution, and a well-demarcated PM/bathing solution interface. FM 4–64 saturated the PM-binding sites of PS120–E3G cells rapidly and it stayed saturated as long as it was present in the bathing solution at concentrations above 15 μM. Emission of FM 4–64 in a lipid environment peaks at approximately 670 nm, and its intensity decreases to below detectable level at wavelengths shorter than 580 nm (data from Molecular Probes). These spectral properties virtually eliminated the potentially serious problem of a crossover of the FM 4–64 signal into the GFP channel. In preliminary experiments on wild-type PS120 cells, we found that no detectable signal was leaking from the FM 4–64 channel into the GFP channel, even with the gain of the photomultiplier in the GFP channel increased twofold over the level set for actual experiments (data not shown).
Once FM 4–64 was removed from the perfusate, it dissociated from the PM very rapidly, a property important in experiments in which the PM content of NHE3 was evaluated twice, i.e., before and after experimental treatment that affected the PM expression of the exchanger. An example of such an experiment is shown in Figure 10. A PI 3-K inhibitor, wortmannin, significantly inhibited the Na/H exchange rate in PS120–E3G cells, which was accompanied by a visible decrease in the PM expression of NHE3–GFP. Confocal morphometric analysis performed in the same living cell before and after wortmannin treatment provided evidence that the decrease in the Na/H exchange rate resulted from wortmannin-induced translocation of NHE3 molecules from the PM into the juxtanuclear cytoplasmic compartment. To prevent endocytosis of PM-bound FM 4–64 during optical scanning, superfusion with the fluorophore was performed at 4–6C. At these temperatures, the vesicle trafficking in eucariotic cells is, for all practical purposes, arrested (Kuismanen and Saraste 1989). Alternatively, in experiments not requiring studies on living cells, perfusion with FM 4–64 can be performed in cells lightly fixed with paraformaldehyde. Fixation must be done carefully, however, because overfixation may result in increased PM permeability and subsequent labeling of intracellular lipids with FM 4–64.
One important aspect of the confocal morphometric analysis requires additional comments. Although FM 4–64 maximally saturated the PM during measurements, the measured fluorescence intensity depended on the local concentration of the fluorophore within the thickness of the optical section. This concentration was highest in optical sections in which the PM was oriented perpendicularly to the XY plane, and was decreasing sharply with the angle between the PM plane and the section plane approaching 0°. Binary transformation of the FM 4–64 images eliminated the problem of varying fluorescence intensity, because any pixel value above the set threshold was ascribed the constant value of 1. This approach also facilitated automation of the analysis in areas of the PM directly contacting the perfusate, where the fluorescence intensity of FM 4–64 was significantly higher than threshold level. However, an automatic algorithm could not be applied to the PM facing the culture substrate, where the fluorescence intensity of FM 4–64 was often below the threshold level, because of impaired access of the fluorophore. In these areas, the PM/cytoplasm interface was defined manually using orthogonal sections of the cells digitally reconstructed in the XZ plane. In this approach, scattered pixels of intensity higher than threshold level were used to define the PM/cytoplasm interface (Figure 8). To verify the results obtained we calculated the relative PM content of PS120–E3G cells cultured on a permeable support, which significantly improved basal penetration of FM 4–64. The results of these experiments were not significantly different from those obtained from cells cultured on glass coverslips (data not shown).
Results of confocal morphometric analysis were confirmed by experiments in which the relative PM expression of NHE3–GFP was evaluated by cell surface biotinylation. The latter method, however, may suffer from its own set of potential pitfalls. These include a difficult-to-estimate efficiency of biotinylation, a possible contamination of the “surface” fraction with biotinylated intracellular proteins, and impaired penetration of biotin to the PM facing the culture substratum (Gottardi et al. 1995). The modification used in our experiments has been optimized to provide almost 100% efficiency, and to minimize contamination with the intracellular pool of NHE3–GFP (Akhter et al. 2000). However, impaired binding of biotin to the PM facing the impermeable culture substratum might potentially have resulted in underestimation of the PM content of NHE3-GFP in the cells examined. This could explain the slightly lower values of PM content of fusion protein obtained from surface biotinylation compared with confocal morphometric analysis (Figure 9).
In conclusion, we describe a novel morphometric method to reliably and reproducibly estimate the relative PM content of NHE3 in living cells under various experimental conditions. The method is fast, and all major calculations are performed automatically by the computer software, thus minimizing the effect of investigator bias. Use of FM 4–64 as a intravital marker for PM resulted in a precise definition of the PM/cytoplasm interface and, consequently, in exclusion from calculations of the sub-membrane particles containing NHE3–GFP. We believe that this method has potential applicability in experiments on expression and regulation of a growing number of transport proteins and receptors shown to be regulated by rapid changes in the expression level at the PM.
Footnotes
Acknowledgements
Supported by NIDDK grants K08DK02557, RO1DK26523, PO1DK44484, R29DK43778, T32DK0763205, and by the Meyerhoff Digestive Diseases Center for Epithelial Disorders.
We thank Dr Shaoyou Chu and Mr Greg Martin for expert advice and help with the confocal microscopy and immunostaining. We also express our thanks to Mr David Szent-Gyorgyi and Dr Neal R. Glicksman from Universal Imaging Corp. for invaluable advice with MetaMorph software.