
Abstract
We used immunogold staining and stereology to examine the ultrastructural localization and to estimate the relative content of CD44 in different strata and cell types of normal human epidermis. We found that CD44 existed almost exclusively on the plasma membranes; only rare labeling occurred on vesicular structures within the cytoplasm. Quantitation of the immunogold particles indicated that the labeling density of melanocytes corresponded to that of basal keratinocytes, and Langerhans cells displayed a labeling density of ∼10% that of the surrounding spinous cells. Among keratinocyte strata, the highest labeling density occurred on spinous cells, suggesting upregulation of CD44 after detachment from the basement membrane. The plasma membrane distribution of CD44 was compartmentalized, with little signal on cell–cell and cell-substratum contact sites such as desmosomes, the plasma membrane domain facing the basement membrane, and the close apposition of terminally differentiating granular cells. In contrast, CD44 was abundant on plasma membrane domains facing an open intercellular space, rich in hyaluronan. This distribution is in line with a role of CD44 as a hyaluronan receptor, important in the maintenance of the intercellular space for nutritional and cell motility functions in stratified epithelia.
CD44 (H-CAM)
Materials and Methods
Skin Samples and CD44 Immunostaining
Approval for obtaining skin samples for the study was obtained from the Ethical Committee of Kuopio University Hospital. Skin samples were obtained either from mastectomy surgery or from the volar surface of the arm in volunteers. The specimens were fixed with 4% paraformaldehyde in 0.1 M phosphate buffer, pH 7.4, for 4 hr at 4C and were washed with the buffer. The samples were immersed in 2.3 M sucrose for 30 min and then frozen in liquid propane using a Reichert Jung KF 80 freezing instrument (Vienna, Austria). Thin sections with pale gold interference were cut using a Reichert Jung Ultracut E microtome equipped with a cryoset (FC4E) and were collected on Formvar-coated 200-mesh copper grids. Thick sections (1 μm) for light microscopy were cut and mounted on Organosilane-coated slides.
Immunostaining for CD44 of the thick sections, using the monoclonal antibody (Mab) Hermes-3 (a generous gift from Dr. Sirpa Jalkanen; University of Turku, Turku, Finland) was done as previously described (Wang et al. 1992). Immunolabeling of the thin cryosections was done according to a method described previously (Griffiths et al. 1984). Grids were first floated (sections downward) on a drop of 0.01 M PBS (pH 7.4) containing 0.02 M glycine for 10 min, then changed onto a drop containing 10% fetal bovine serum in the same buffer for 10 min. The grids were then transferred to 5% fetal bovine serum containing MAb Hermes-3 (dilution 1:40) for 30 min. After washing four times for 4 min in PBS, the grids were transferred into a solution containing rabbit anti-mouse IgG antibody (Dako Z 456; Dako, Copenhagen, Denmark; dilution 1:200) in 5% fetal bovine serum for 1 hr. After six changes in PBS the grids were incubated with protein A–gold (10-nm gold particles, prepared by Varpu Marjamäki; Department of Biology, University of Jyväskylä, Finland). The grids were washed (six changes in PBS) and briefly fixed with 2.5% glutaraldehyde in PBS. After three changes in PBS and five changes in distilled water, the sections were embedded in 2% methyl cellulose containing 0.3% uranyl acetate. All incubations were done at room temperature (RT). The specificity of the staining was confirmed by omitting the primary antibody or by replacing it with a nonrelated MAb IB 2 (a gift from Dr. Sirpa Jalkanen).
Hyaluronan Staining
Skin samples were fixed in 2% paraformaldehyde and 2% glutaraldehyde in phosphate buffer and were embedded in paraffin (Wang et al. 1992). Affinity staining of the paraffin sections for hyaluronan, using bHABC (biotinylated hyaluronan binding complex of bovine aggrecan and link protein) was done as described previously (Wang et al. 1992). The bHABC probe, diluted to 5 μg/ml in 3% BSA, was applied to the sections and incubated overnight at 4C. The bHABC bound to tissue hyaluronan was visualized by 1-hr incubation in avidin–biotin–peroxidase (ABC standard kit; Vector Laboratories, Burlingame, CA) and 5-min incubation in 0.05% DAB (3,3′diaminobenzidine; Sigma, St Louis, MO) containing 0.03% H2O2. The specificity of the staining was controlled by predigesting some of the sections with Streptomyces hyaluronidase (Seikagaku Kogyo, Tokyo, Japan; 100 TRU/ml in Na-acetate buffer, pH 5.0, 3 hr at 37C) in the presence of protease inhibitors (Tammi et al. 1989a,b) and also by blocking the binding site on the bHABC probe with HA oligosaccharides (length 12–14 monosaccharides, 1 μg/ 3 μg bHABC) to reveal possible nonspecific binding of the probe to the sections (Tammi et al. 1989a,b).
For electron microscopic demonstration of hyaluronan, a pre-embedding staining protocol was used. The epidermis was separated from the dermal connective tissue using a 30-min incubation in 0.02 % EDTA in PBS (Sigma) at 37C (Tammi and Tammi 1986) and fixed in 2% paraformaldehyde and 0.5% glutaraldehyde in 0.1 M phosphate buffer for 1 hr. After washing with the buffer, the sheets were incubated for 30 min in 3% BSA containing 0.3% Triton X-100 to block the unspecific binding and to permeabilize the tissue, and then overnight at 4C with bHABC (5 μg/ml), washed with phosphate buffer, and incubated with streptavidin–gold (LM grade, 1:40; Amersham International, Little Chalfont, UK) for 2 hr at RT. After washing, the sheets were postfixed in 1% glutaraldehyde for 20 min and washed five times for 1 min with distilled water. The silver enhancement was done according to the manufacturer's instructions (IntenSe M silver enhancement kit; Amersham). The sheets were dehydrated in graded ethanol and embedded in Epon. Thin sections were cut onto Formvar-coated copper grids, stained with uranyl acetate, and viewed with a JEOL 1200 EX microscope. Control samples were incubated with a bHABC-probe pretreated with hyaluronan oligosaccharides (Tammi et al. 1989a,b).
Morphometry and CD44 Distribution
The sections were viewed and photographed with a JEOL 1200 EX electron microscope. Three photographs (original magnification × 12,000) were systematically taken from each of the following strata of the epidermis: basal cells (basal surface and lateral surface), lower spinous cell layer, upper spinous cell layer, and granular cell layer (Klein–Szanto 1977). One photograph was taken for each melanocyte and Langerhans cell encountered in the sections. The number of skin donors in the morphometric study was four.
The boundary length of the plasma membrane (Bp1) was estimated as described by White and co-workers (1982). The Bp1 can be estimated from intersections through feature profiles (I) made by the test lines of spacing (h). The appropriate relation with the parallel line set is:

In addition to estimating the total boundary length of the plasma membrane, we estimated the boundary length of the plasma membrane belonging to villous processes and the planar cell surface and that in the desmosomes. Villous processes were defined as projections of plasma membrane clearly extending from the cell body (at least 40 nm).
The distribution of CD44 was determined by counting the number of gold particles (n) associated with the plasma membrane and distributing the counts to the different categories. The numbers of gold particles were expressed per boundary length of the plasma membrane (Bp1).
Statistics
The values given are means ± SE. The statistical significances of the differences between epidermal strata were tested using two-way analysis of variance and those between n/desmosomes and n/plasma membrane using three-way analysis of variance of the random effects of patients and fixed effects of epidermal strata and plasma membrane compartments. The means were compared using the simultaneous confidence limits test procedure of Newman–Keuls (Winer 1971).
Results
Light Microscopy
Epidermal cell surfaces were intensely stained with MAb Hermes 3 against an epitope close to the N-terminus of CD44 and common to all splice variants (Figure 1A). Immunoreactivity for CD44 was present on the lateral and apical surfaces of the basal cells, whereas the basal surface was negative (Figure 1A). The spinous cells displayed CD44 on all surfaces. The staining pattern typically had a somewhat punctate appearance (Figure 1A). The positive reaction continued up to the lower granular cell layer (Figure 1A), whereas the upper granular cells and cornified cells were always negative (Figure 1A).
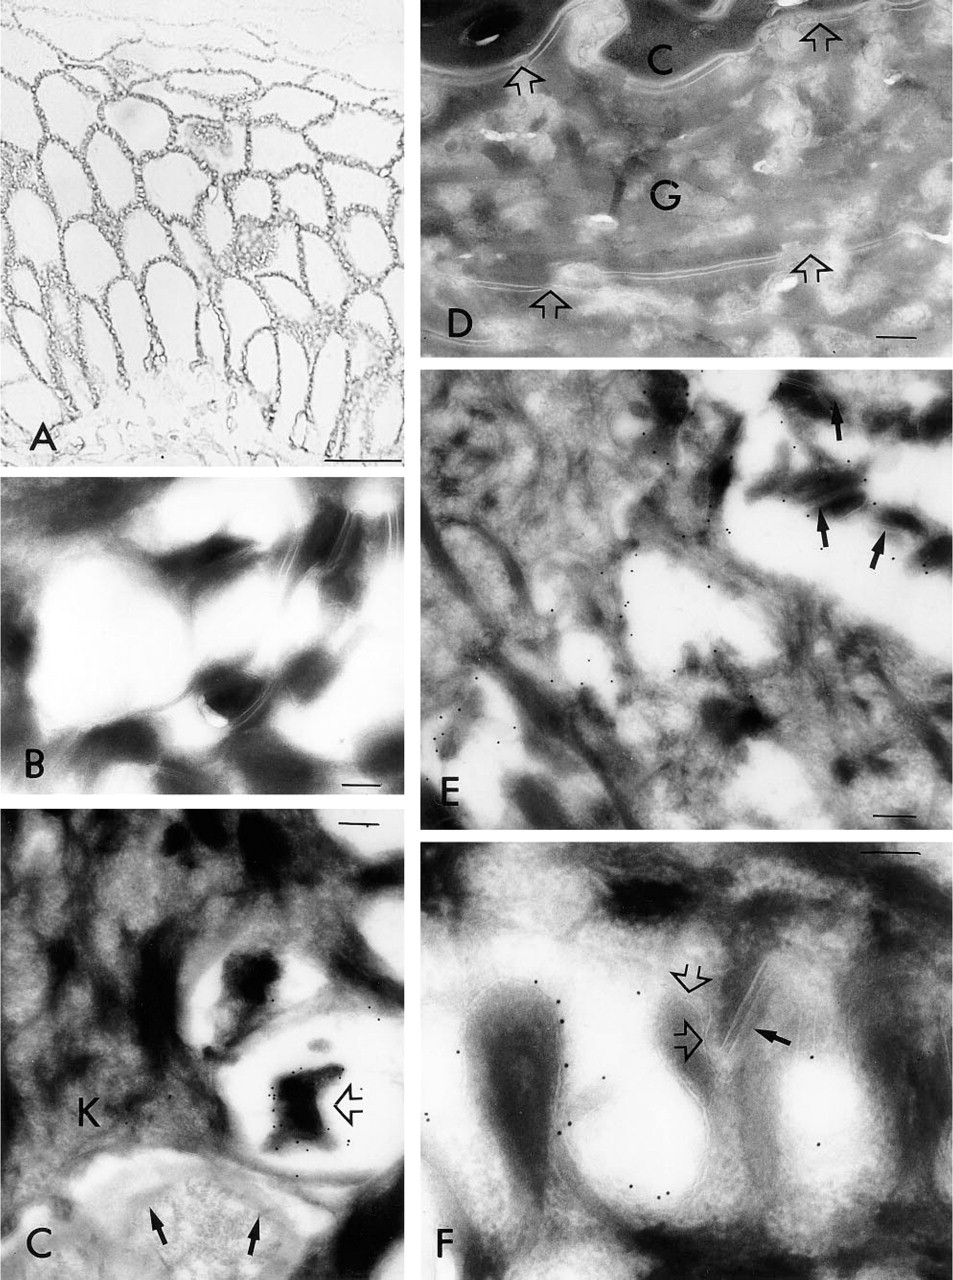
Distribution of CD44 in human epidermis. (
Electron Microscopy
Ultracryosections of human skin were immunogoldstained using the same antibody as for light microscopy, resulting in a general tissue distribution corresponding to that observed in light microscopy (Figures 1 and 2). As suggested by light microscopy, most of the gold particles were detected in close vicinity to the plasma membranes (Figures 1 and 2). Very few particles were present on structures such as mitochondria or nuclei, confirming the specificity of the staining (Figures 1 and 2). Rarely, positive labeling was found in association with vesicular structures within the cells (Figure 2B). Although most gold particles were associated with the microvilli, some label was also found on the actual keratinocyte cell body (Figures 1C, 1E, 1F, 2A, and 2B). Desmosomes were almost devoid of CD44 (Figures 1E, 1F, 2A, and 2B), probably explaining the punctate staining pattern seen in light microscopy (Figure 1A). In many cases the opposing villi were closely apposed to each other on one surface while the other side faced an open space (Figures 1E, 1F, and 2B). The signal for CD44 was then preferentially found on the side facing the open space (Figures 1E, 1F, and 2B). The basal surface of the basal cells and the hemidesmosomes were almost negative (Figure 1C).
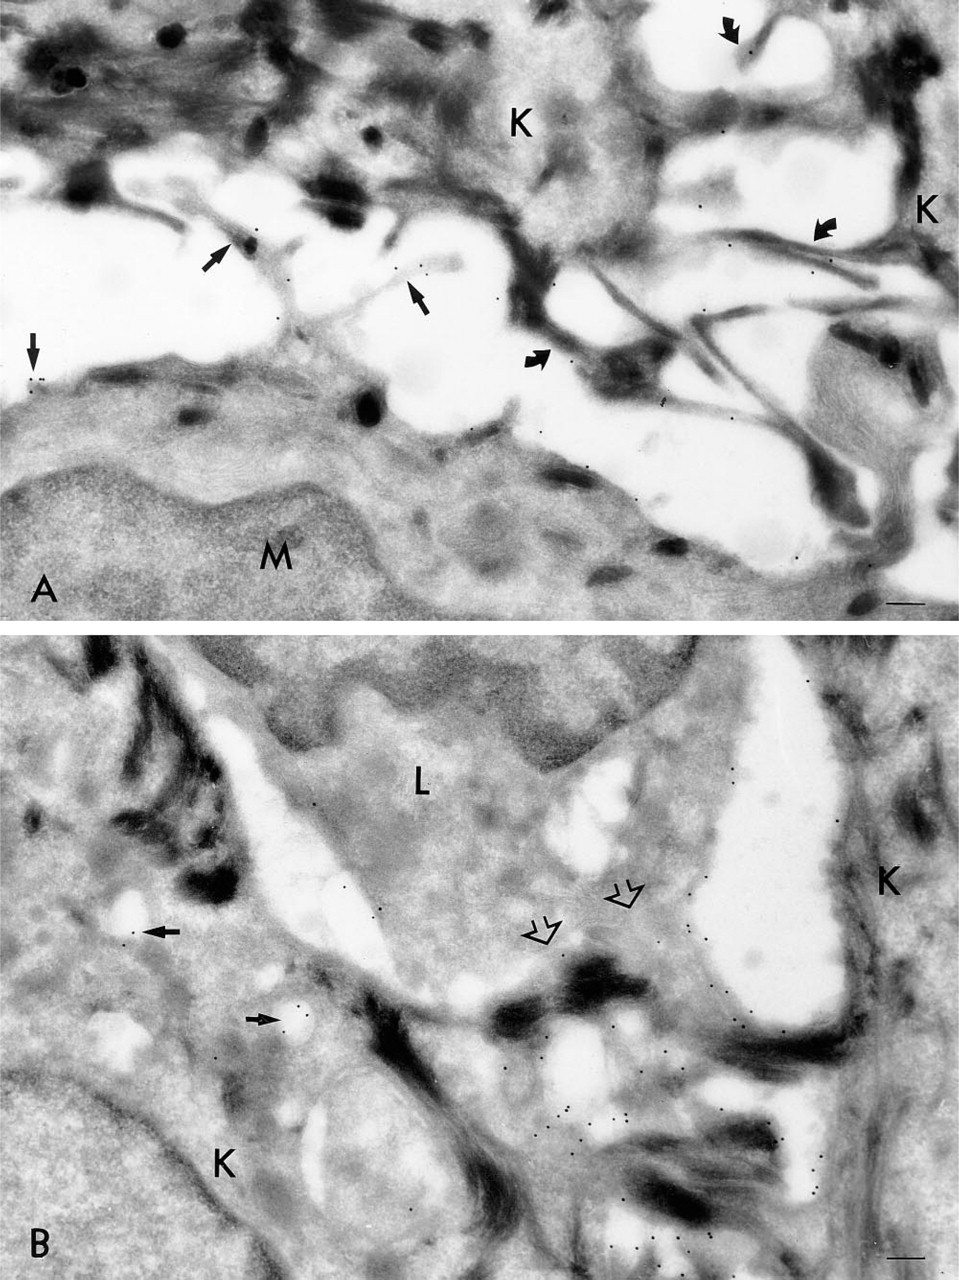
CD44 on epidermal nonkeratinocytes. Cryosections of human skin were stained with the Hermes 3-immunogold technique, as described in Materials and Methods. (
Epidermal melanocytes showed intense staining with MAb Hermes 3 (Figure 2A). In particular, the processes of the melanocytes were heavily labeled (Figures 1C and 2A). The melanosomes inside the epidermal cells were negative (Figure 2A). The basal surface of the melanocytes (towards the basal lamina) was negative, like that of the keratinocytes (not shown). The plasma membrane of Langerhans cells was generally less intensely stained than that of keratinocytes (Figure 2B).
The control specimens, stained either without a primary antibody (not shown) or using a nonrelated MAb (Figure 1B), exhibited very low labeling.
Morphometric Analysis of the Immunogold Labeling
Table 1 summarizes the numbers of gold particles per plasma membrane boundary length (Ng/pl) in nonkeratinocytes and keratinocytes in different epidermal strata. The Ng/pl was highest in the lower spinous cell layer. The values in the upper spinous cell layer and lateral surfaces of the basal layer were slightly lower than that of the lower spinous cells, whereas the Ng/pl on granular cells and basal surface of the basal cells was low. ANOVA showed that there was a statistically significant difference in the number of gold particles among the different strata (p<0.05). The differences between the lateral surfaces of the basal layer, the lower spinous cell layer, and the upper spinous cell layer were not statistically significant, whereas they all differed significantly from those of the basal surface of the basal cells and the granular cell layer.
CD44 density in different epidermal cell types and keratinocyte layers a
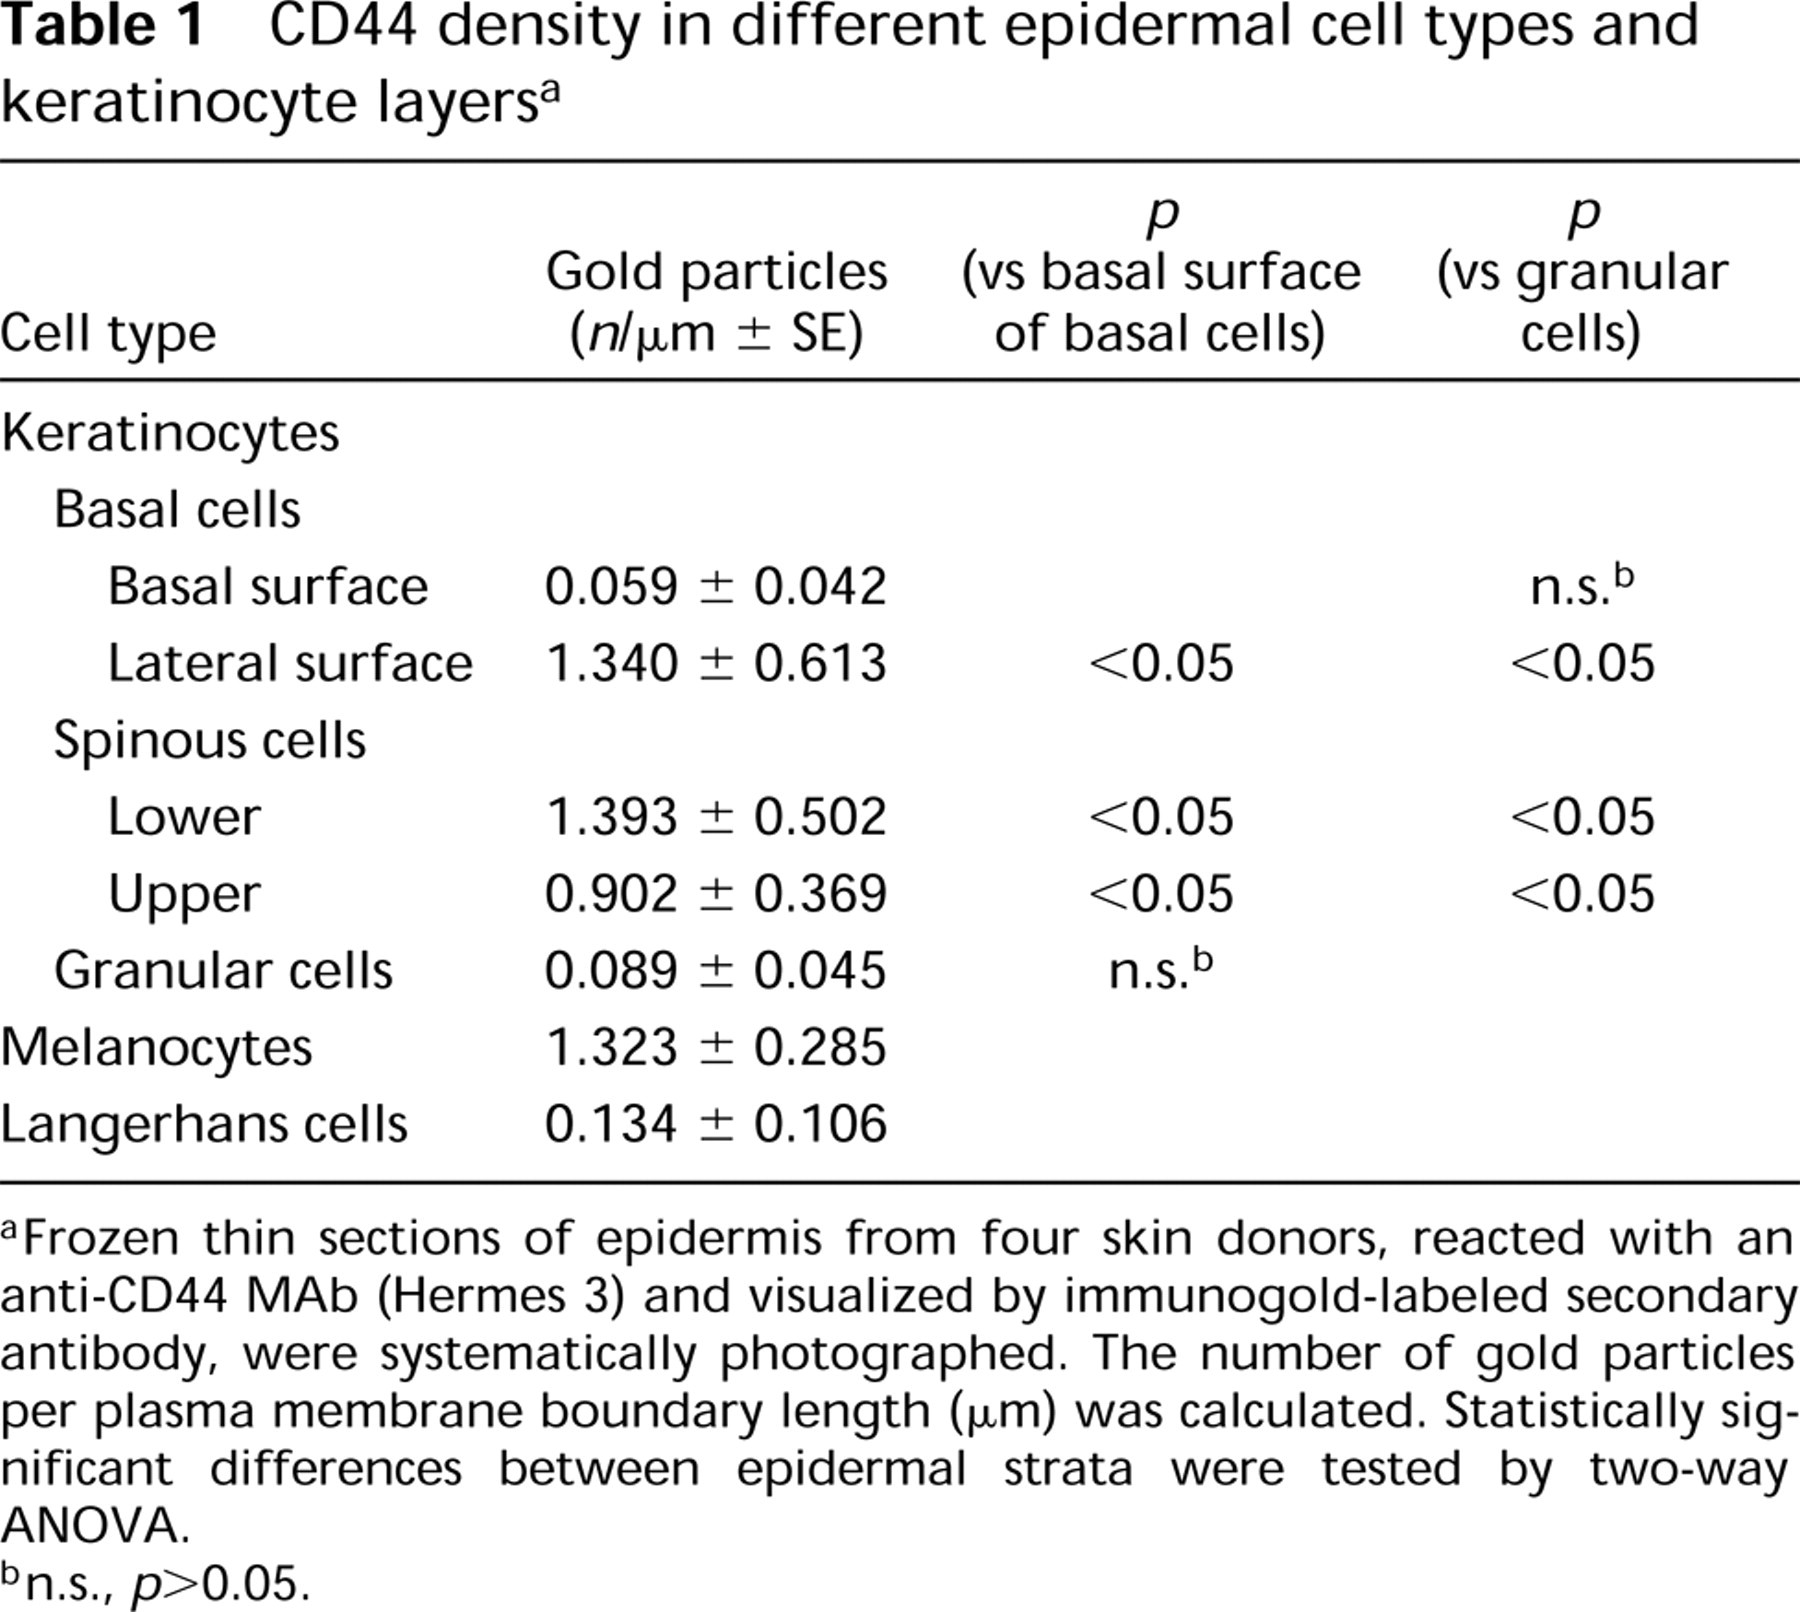
Frozen thin sections of epidermis from four skin donors, reacted with an anti-CD44 MAb (Hermes 3) and visualized by immunogold-labeled secondary antibody, were systematically photographed. The number of gold particles per plasma membrane boundary length (μm) was calculated. Statistically significant differences between epidermal strata were tested by two-way ANOVA.
n.s., p > 0.05.
Approximately 72% of all gold particles were located on the villous processes. However, when the numbers of gold particles were calculated per plasma membrane boundary length, there was no difference in the labeling density between the villi and cell body (data not shown). The labeling density of the desmosomes was, however, significantly lower than the rest of the plasma membrane in all epidermal layers.
Melanocytes showed about the same Ng/pl as the lateral side of basal keratinocytes, whereas Langerhans cells had an Ng/pl level about 10% of that in the surrounding spinous cells (Table 1).
Hyaluronan Affinity Staining
The biotinylated high-affinity probe for hyaluronan produced a strong extracellular signal thoughout the vital layers of the epidermis in paraffin-embedded sections (Figure 3A). Hyaluronan was present up to the granular layer, like CD44, whereas the stratum corneum was negative. A similar pattern was obtained with the pre-embedding protocol for EM. Figure 3B, from the spinous cell layer, shows the coalescence of multiple 1-nm gold particles by silver enhancement, demonstrating the presence of hyaluronan in the pouches lined with CD44-rich membrane areas. Control samples stained with a probe pretreated with hyaluronan oligosaccharides showed no signal (data not shown).
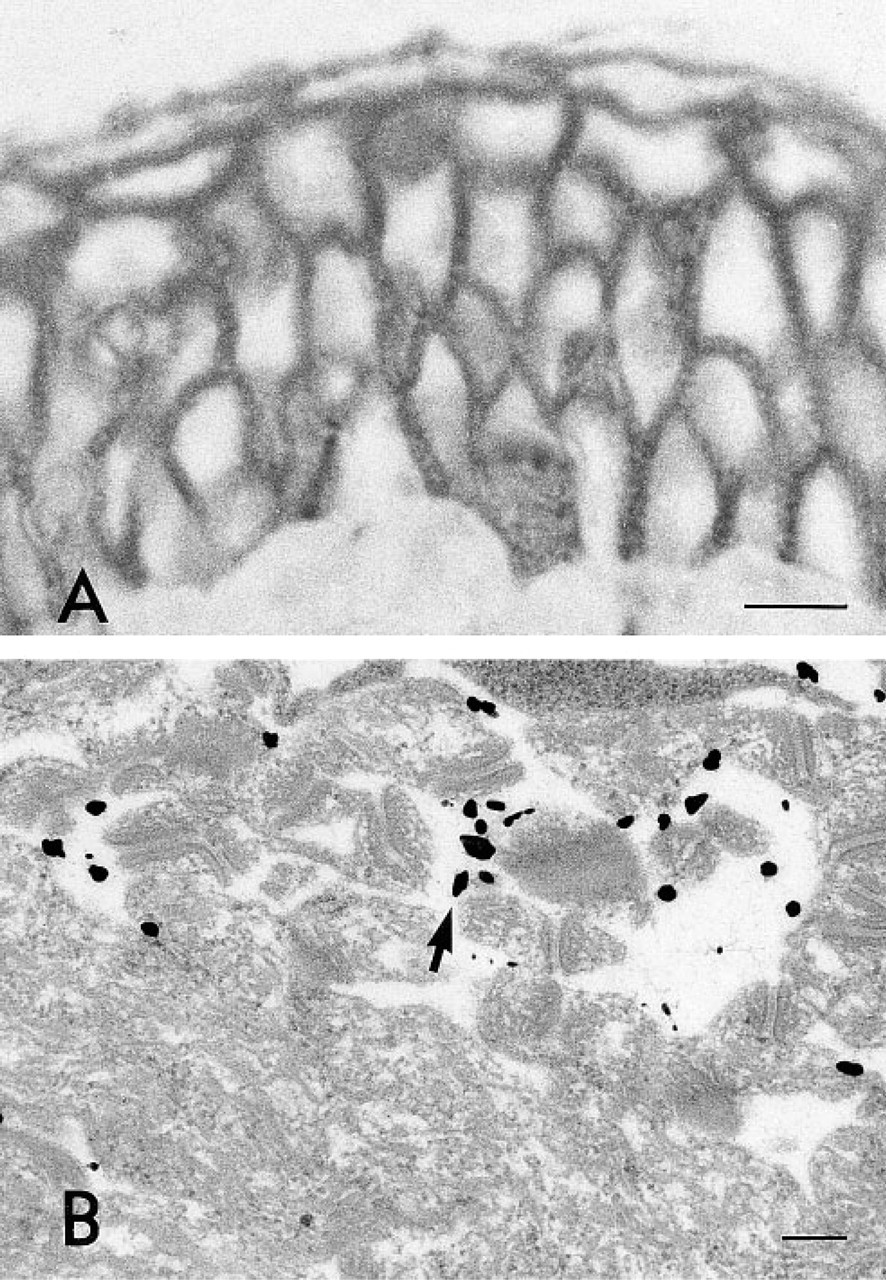
Distribution of hyaluronan in human epidermis. (
Discussion
Ultrastructural localization of CD44 has previously been performed on synovial (Asari et al. 1995) and bone cells (Nakamura et al. 1995) but not in epithelia. The present work introduced a method to quantitatively assess the staining distribution of CD44 in epidermis. Although the data obtained probably underestimate the true numbers of the molecules per tissue volume or area (because every epitope does not become labeled), it is possible to compare the relative signal densities among various cell types, cell layers, and plasma membrane domains.
The volume of a keratinocyte increases by 50% when it moves from the basal to the spinous layer (Tammi and Santti 1989), and plasma membrane surface area per cell volume increases by about 40% (Klein–Szanto 1977). Therefore, considering the absence of CD44 from the basal surface of basal cells, the total number of CD44 molecules per cell should be at least doubled in spinous cells, indicating upregulation of CD44 expression at detachment from the basal lamina. Decreased and eventually discontinued CD44 transcription (Hudson et al. 1995), coupled with cellular uptake and catabolism, probably accounts for the CD44 downregulation observed in the superficial spinous cells and granular cells. The number of CD44 receptors (and associated hyaluronan) therefore correlates with the activity of keratinocyte migration up from the basal layer and with subsequent changes in shape and size. The disappearance of CD44 occurs when the keratinocyte loses its mobility and begins to be incorporated into the fixed and tightly adherent layer of corneocytes.
The heavy labeling of melanocyte cell processes, also found in melanocyte cultures (Herbold et al. 1996), is in accord with the view that a CD44-anchored hyaluronan coat enhances the extension of melanocyte processes between keratinocytes. In a similar view, the low density of CD44 in the quiescent Langerhans cells can be explained by their lack of active movement. Interestingly, upregulation of CD44 occurs on Langerhans cell activation when the cells migrate out of the epidermis (Osada et al. 1995).
The enrichment of CD44 on the plasma membranes of microvilli lining the hyaluronan-stuffed pouches conforms well with the concept that CD44 acts as an anchor for hyaluronan (Tammi et al. 1989a,b,1994a). Most CD44 reportedly associates with filopodia and microvilli (Keeble and Watt 1990; Brown et al. 1991; Tsukita et al. 1994), but the present data indicate that this reflects the high proportion of total plasma membrane in these structures rather than a specific enrichment of CD44 in the microvilli. In general, CD44 density was low whenever plasma membranes of adjacent cells were closely apposed, a finding that does not favor the idea of CD44 as a homotypic adhesion molecule (Dougherty et al. 1995). Rather, CD44 with bound hyaluronan could maintain the open space between adjacent keratinocytes and enable cell movement and nutrient exchange. Whereas the ectodomain of CD44 binds to a number of matrix molecules (reviewed in Lesley et al. 1993), only hyaluronan, of the known extracellular ligands, is present in normal epidermis (Tammi et al. 1994b). The sparse CD44 labeling of desmosomes is in line with the fact that actin and ankyrin, the suggested intracellular counterparts of CD44 (Lacy and Underhill 1987; Bourguignon et al. 1993; Tsukita et al. 1994), are not present in desmosomes.
CD44 acts as an endocytosis receptor for lysosomal degradation of hyaluronan in macrophages and chondrocytes (Culty et al. 1992; Hua et al. 1993). A recent report showed that inhibition of CD44 expression in the basal cells of mouse epidermis suppresses hyaluronan catabolism (Kaya et al. 1997). A CD44 antibody (Hermes 1) also inhibits binding and internalization of FITC-labeled hyaluronan in human keratinocytes (unpublished observations). These findings strongly suggest that CD44 is involved in keratinocyte hyaluronan uptake. The abundance of CD44 in epidermis could explain the exceptionally rapid hyaluronan turnover in this tissue (Tammi and Tammi 1991). The mechanisms and kinetics of keratinocyte hyaluronan uptake remain enigmatic, however, because the present study revealed very few CD44 epitopes within keratinocytes and the average half-life of the large epidermal CD44 is twice as long as that of hyaluronan (unpublished data). In addition, the suggested pivotal role of CD44 in both the maintenance of the hyaluronan matrix and its catabolism (Kaya et al. 1997) requires complex regulatory systems.
Footnotes
Acknowledgements
The skillful technical assistance of Ms Eija Voutilainen, Mr Kari Kotikumpu, Ms Raija Pitkänen, and Ms Eija Anti-kainen is gratefully acknowledged.