
Abstract
The subcellular events responsible for release of mediators by mast cells may help to clarify roles for mast cells in health and disease. In this study we show that the granule-associated protease chymase is also within cytoplasmic vesicles in appropriately stimulated rat peritoneal mast cells. Rat peritoneal mast cells were recovered before or 1–10 sec after exposure to the secretogogue compound 48/80 (10 μg/ml) and then were examined by radioimmunoassay to quantify histamine release or were processed, using routine methods for postembedding immunoelectron microscopy, to identify the subcellular localization of chymase. In comparison to unstimulated cells, compound 48/80 stimulated cells in two independent experiments showed an increase (15%, 28%) in the surface area of the cell and a decrease (12%, 6%) in the surface area of the total granule compartment before degranulation channel formation. These global cellular changes occurred in a background of transient but significant (p<0.01) increases in the area and number of chymase-immunoreactive vesicles per μ2 cytoplasm. These changes were detectable at 5 or 7 sec after stimulation with compound 48/80 but returned to near prestimulation levels by 9 or 10 sec after addition of compound 48/80 (total cumulative histamine release was 28% by 8 sec and 47% by 14 sec). These observations suggest that vesicles participate in the early stages of regulated secretion of chymase from rat peritoneal mast cells.
Keywords
M
Most biochemical and morphological analyses of mast cell mediator release have focused on the process of anaphylactic degranulation, also designated compound exocytosis. This process is characterized morphologically by granule swelling followed by the relatively rapid fusion of the membranes surrounding individual cytoplasmic granules with each other and with the plasma membrane (Bloom and Haegermark 1965; Bloom and Chakravarty 1970; Röhlich et al. 1971; Lagunoff 1972; Röhlich and Csaba 1972; Dvorak et al. 1983; Galli et al. 1984; Dvorak 1991). Although these features of the secretory response have been well described (Bloom and Chakravarty 1970; Röhlich et al. 1971; Lagunoff 1973; Kagayama and Douglas 1974; Lawson et al. 1977; Chandler and Heuser 1980; Kraeuter Kops, et al. 1990), no studies have systematically analyzed vesicle events in the 0–10 sec time period preceding exocytosis.
Ultrastructural analyses of both basophils (Dvorak et al. 1981) and mast cells (Burwen and Satir 1977; Chandler and Heuser 1980) have suggested that cyto-plasmic vesicles participate in anaphylactic degranulation in these cells by facilitating the fusion of granule membranes with each other and with the plasma membrane. In addition to their role in facilitating the fusion of cytoplasmic granule membranes, it has been proposed that cytoplasmic vesicles also may serve to transport mast cell or basophil cytoplasmic granule-associated mediators (Dvorak et al. 1981; Galli, et al. 1984; Dvorak 1991).
Certain aspects of this hypothesis have been supported by morphological studies in basophils (Dvorak et al. 1972, 1976, 1980, 1981; Dvorak 1991). For example, guinea pig basophils undergoing anaphylactic degranulation in response to the lectin concanavalin A (ConA), a stimulus known to induce degranulation with relatively slow kinetics, exhibited a significant (twofold) increase in the number of small cytoplasmic vesicles within 1 min of stimulation, a finding that represented the first detectable ultrastructural alteration in these cells (Dvorak 1981). Recently, it has been shown in human basophils that a stimulus of degranulation can also induce an increase in the numbers of vesicles that contain immunogold for granule-associated mediators (Dvorak 1994, 1996a, b, 1997a, b; Dvorak 1997), but similar studies for mast cells from any species have not been done.
In this study, we analyzed the subcellular localization of the cytoplasmic granule-associated protease chymase in compound 48/80-stimulated rat peritoneal mast cells, using postembedding immunocytochemical methods. We found that cytoplasmic vesicles that exhibit immunoreactivity for chymase increased in number and area fraction during a brief period of time (5 or 7 sec) after stimulation of the cells with compound 48/80. These chymase-immunoreactive vesicles then decreased in number, in concert with the formation of degranulation channels. Although published reports have examined chymase localization in storage granules (Login et al. 1987) in unstimulated cells and on the plasma membrane (Kido et al. 1988) in stimulated cells, our findings are the first to show that chymase is also within cytoplasmic vesicles in appropriately stimulated rat peritoneal mast cells.
Materials and Methods
Animals
Male Sprague–Dawley rats (virus-free) (Taconic Laboratories; Germantown, NY) weighing 250–350 g were used. These experiments were approved by the Beth Israel-Deaconess' Institutional Animal Care and Use Committee. The animal care program at the Beth Israel Hospital is accredited by the American Association for the Accreditation of Laboratory Animal Care and meets National Institutes of Health standards as set forth in the “Guide for the care and use of laboratory animals” [DHHS publication (NIH) 86–25, revised 1985]. The animals were housed in the Beth Israel Hospital's animal care facility, where they were provided with rat chow and water ad libitum and were allowed to acclimate for approximately 2 days before mast cell harvest.
Preparation and Stimulation of Peritoneal Mast Cell Suspensions
Rat peritoneal mast cells were washed from the peritoneal cavities of rats with Hank's Balanced Salt Solution (HBSS) (Enerbαck and Svensson 1980; Login et al. 1987). Cell viability was 90% according to Trypan blue exclusion. The mast cells were diluted in HBSS to a final concentration of 1 × 10⁶ cells/ml and were maintained at 4C (for up to 60 min) until stimulation. Cells were stimulated with compound 48/80 (Sigma Chemical; St Louis, MO) (10 μg/ml in HBSS, 20C) (Bloom and Haegermark 1965; Bloom and Chakravarty 1970; Röhlich et al. 1971; Uvnαs 1974; Chandler and Heuser 1980; Login et al. 1992; Takayama et al. 1994). Aliquots (100 μl) of mast cells in suspension were added to 200-μl aliquots of HBSS containing compound 48/80 at room temperature (RT) in a polystyrene cuvette (0.1 cm2 × 4.5 cm; Fisher Scientific, Pittsburgh, PA) and incubated at RT for 1, 5, 6, 7, 8, 9, or 10 sec. Rapid cell handling for each experiment was done by the same two experienced investigators using a four-handed approach to coordinate pipetting of cells, compound 48/80, and fixative into the reaction vial. All mast cell aliquots were fixed for the same time and at the same temperature. [Note: In preliminary experiments we found that we were unable to stop the reaction sufficiently rapidly to perform immunocytochemical analysis of vesicles when we used immersion in a mixture of aldehydes to fix cells that had been incubated with compound 48/80 at 37C (unpublished results).] Stimulation of mast cells by compound 48/80 at RT (Röhlich and Csaba 1972; Uvnαs 1974) or at 30C (Gomperts and Tatham 1992) are established methods for slowing mast cell degranulation.
In our standard experiment, cells at 4C [note: reaction temperatures below 17C inhibit exocytosis (Takayama et al. 1994)] were stimulated with compound 48/80 by placing them in a solution containing that agent at 20C. As a control for the possible effects of the change in temperature (from 4 to 20C) on the ultrastructure of mast cells, we performed an experiment that compared the ultrastructural findings in unstimulated cells that were handled in the same manner as the compound 48/80-stimulated mast cells and that were fixed either immediately (0 sec) or 7 sec after the change from 4C to 20C.
Rapid Collection and Determination of Released Histamine
Mast cells (from an aliquot distinct from that used for the immunocytochemical studies) were stimulated at RT by injecting a 0.3-ml cell aliquot (1.4 × 10⁵ cells) into a 2.7-ml volume of HBSS containing compound 48/80 through a port in a 12-ml syringe (Monoject; St Louis, MO) that was connected to a 0.5-μ Millipore filter (Millipore; Bedford, MA). Aliquots of supernatant (0.37 ml) were collected at intervals of 2 sec by pushing the syringe plunger. Histamine was measured using a radioimmunoassay kit (Immunotech; Westbrook, ME). The normalized histamine release (i.e., the pg/ml released during a specific 2-sec interval minus the spontaneous release at 0 sec) and the percent total (cumulative) histamine release at each time point were computed by taking into account the changes in supernatant volume that occurred over the course of the experiment. In this experiment, mast cells contained 30 pg of histamine/cell.
Fixation, Processing, and Embedding for Light and Electron Microscopy
Mast cells in HBSS (total volume 1 ml) were added to 14 ml of Karnovsky's fixative (2% formaldehyde, freshly prepared from paraformaldehyde, 2.5% glutaraldehyde, 0.025% CaCl2, 0.1 M sodium cacodylate buffer, pH 7.4) for 1 hr at 20°C. After fixation in suspension, cells were pelleted at 800 × g for 10 min, resuspended in 10 ml of 0.1 M sodium cacodylate buffer, pH 7.4, 4C, and washed in sodium cacodylate buffer two times at 800 × g for 5 min at 4C.
Cell suspensions were pelleted through molten agar (Login and Dvorak 1985), postfixed by immersion in 2% 0.2 M symcollidine-buffered osmium tetroxide, pH 7.4, for 2 hr at 20C, stained en bloc with 2% uranyl acetate for 2 hr at 20C, and processed for transmission electron microscopy as previously described (Login et al. 1987). Epon 812 (Biorad Microsciences; Cambridge, MA) blocks were cured for 16 hr at 60C. One-μ sections were stained with filtered 10% alkaline Giemsa and examined by light microscopy. Seventy- to 90-nanometer sections were cut on diamond knives (DuPont Instruments; Wilmington, DE), placed on nickel grids (Pelco; Redding, CA) prepared for immunogold labeling, and examined in a Philips 300 electron microscope (North American Philips; Mahwah, NJ) at 60 kV.
Immunocytochemistry of Chymase
Postembedding immunogold labeling of chymase on Epon sections was done as follows (Login et al. 1987). Teflon-coated glass slides containing 14 wells (Roboz Surgical Instruments; Washington, DC) were placed on moistened filter paper in 9-cm2 covered Petri dishes (Fisher Scientific) to prevent desiccation of reagents, and 70–90-nm plastic thin sections on nickel grids were floated section side down on 50-μl drops of reagents at 20C in the wells of the glass slides. The following reagents were used in sequence at 20C: (a) 10% sodium metaperiodate for 10 min (Bendayan and Zollinger 1983); (b) 20 mM Tris buffer containing 0.9% saline, 0.2% nonimmune rabbit IgG, pH 7.6 (TBS–Ig) for three 10-min washes; (c) 5% nonimmune rabbit IgG (Sigma) for 20 min; (d) primary goat IgG anti-rat chymase (5 mg/ml in PBS) (Wintroub et al. 1984) further diluted 1:80 in TBS–Ig, 0.1% Tween 20, 1 hr, 20C; (e) TBS–Ig for three 10-min washes; (f) secondary 10-nm gold-conjugated rabbit anti-goat IgG (Energy Beam Sciences; Agawam, MA) 1:80 in TBS–Ig, 0.1% Tween 20, 1 hr, 20C; (g) washed twice in TBS–Ig and twice in distilled water, 10 min for each wash; and (h) stained with 0.25% lead citrate for 3 min at 20C.
Controls included substitution of normal goat serum from a nonimmunized animal to evaluate the specificity of the primary antibody and omission of the primary antibody to evaluate nonspecific binding of the secondary gold-labeled antibody. Appropriate absorption controls for the primary antibody for rat mast cell granule chymase have been reported (Login et al. 1987).
Quantitative Analysis of Mast Cell Stimulation
Cell blocks from each experimental condition, in experiments performed with cells from three different groups of animals, were selected at random. Sampling procedures were done in accordance with procedures of stratified random sampling (Williams 1977). One-μ plastic sections were prepared for light microscopy. All cells in five to ten high-power fields were examined with a light microscope equipped with a 10 × 10 reticle in the eyepiece. The first 10 cells were counted, beginning at the top left corner of the reticle. Cells were assigned to three groups on the basis of morphological appearance: unstimulated (i.e., dark blue granules that densely packed the cytoplasm), minimally to moderately stimulated (“partially degranulated”) (>5 pink-stained, swollen cytoplasmic granules per cell; 5 granules represent ∼5% of the granules per 1-μ-thick mast cell section), and extensively stimulated (“extensively degranulated”) (i.e., <10 blue-stained granules remaining in the cytoplasm per 1-μ-thick mast cell section). The mean and SD of the number of unstimulated, minimally to moderately stimulated, and extensively stimulated cells were calculated for each time point.
Quantitative Analysis of Gold-labeled Vesicles (GLVs) (Indicating Chymase Immunoreactivity)
Thin sections were examined systematically in the electron microscope in the same order, beginning at the top left corner of the grid and proceeding to the lower right corner of the grid, until at least five mast cells were photographed. Electron micrographs of complete cell profiles were printed at × 13,750 (21.5 × 25.5 cm). Electron micrographs of immunogold-labeled sections were printed at x41,250 and five prints containing a combined minimum of 50 granules from each experimental and control group were used for stereo-logical analysis. Cell images included the nucleus, plasma membrane, multiple cytoplasmic granules, and mitochondria. Cytoplasmic vesicles were identified according to the following criteria (Kraeuter Kops et al. 1990): (a) all vesicles had a discernible membrane around their perimeter, and vesicles ranged in diameter between 50 and 200 nm.
Area determinations were done by a point-counting method using a square lattice overlay (Williams 1977) with a density of 1 point per 4 cm2 on each print to measure the area of the nucleus and the cytoplasm (i.e., area of the cell excluding the nucleus) and with a density of 1 point per 1 cm2 to measure the area of mitochondria and granules (Login and Dvorak 1985). A 0.25-cm2 lattice was used to measure the total area of vesicles on each print. The area fraction of the vesicle compartment (Weibel et al. 1976) was calculated as the ratio of the chymase-labeled vesicle compartment or the total vesicle compartment to the area of the cytoplasm. The numbers of chymase-labeled vesicles (defined as a vesicle with 1 or more gold particles within 10 nm of its membrane) and of total vesicles were counted per μ2 of cytoplasmic area for each time point. Nonspecific chymase labeling densities for nuclear, mitochondrial, and cytoplasmic compartments were calculated as the number of gold particles/μ2. Gold particles were counted as independent particles when they were separated from one another at least one gold particle diameter (i.e., 10 nm).
Quantitative Analysis of the Surface Areas of Granule and Cytoplasmic Membranes in Unstimulated and Compound 48/80-stimulated Mast Cells
Established point-counting methods were used (Weibel et al. 1976) to determine the volume and the surface area to volume ratios of the cell and the total granule compartment of mast cells. Selection of compound 48/80-stimulated mast cells was based on the time point at which the maximal number of gold-labeled, chymase-immunoreactive vesicles occurred.
The volume fraction (Vv) of granules (g) was determined from their areas (A). The numerical granule density (Nvg) per μ3 of cytoplasmic volume was determined by

(Loud et al. 1965) where the mean granule volume was calculated by using the formula:

as modified for use with mean particle volumes (Weibel 1979). The value β', 1.6 for mast cell granules (Hammel et al. 1983), was based on estimates of the granules' true axial ratios and shapes (Williams 1977). For both Nvg and Vvg the reference was the individual cell cytoplasm (cell profile area – nuclear profile area), determined by point counting. For determination of cell volume, the nucleus (n) was used as a reference organelle. Individual nuclear profile areas (An) were determined by point counting and the mean nuclear volume (V¯) was derived according to:

For determination of granule number and volume per cell, we first determined the nuclear volume fraction (V¯) by using profiles of whole cells as the reference. The cell volume was calculated according to V¯. We then calculated the total number of granules/cell (Ng) according to:

Surface area to volume ratio of the cell (Svcell), μ2 of plasma membrane per μ3 of cell volume, was determined by counting the number of horizontal and vertical test lines on a screen crossing the cell perimeter and by dividing by the number of intersections falling on the cell. This ratio was multiplied by a correction factor for screen size, microscope magnification, and print magnification. Surface area to volume ratio of the granule, Svg, μ2 of granule membrane per μ3 of granule volume, was calculated by the same procedure using a screen size appropriate for granules. The surface area (SA) of the cell was determined by the product of Svcell and Svcell. The surface area of the total granule compartment was determined by the product of Svg, Vg, and Ng.
Graphs of mast cell histamine release (
Statistical Analysis for Light Microscopy and Immunocytochemical Studies
Differences among conditions were examined for statistical significance using one-way, unblocked ANOVA. Pair-wise differences were evaluated by the Newman–Keuls multiple sample comparisons test. p<0.05 was considered a significant difference. Data organization and analysis were performed on the PROPHET system, a national computer resource sponsored by The National Center For Research Resources, National Institutes of Health.
Results
Rat Peritoneal Mast Cells Exhibit a Time-Dependent Degranulation Response to Stimulation by Compound 48/80
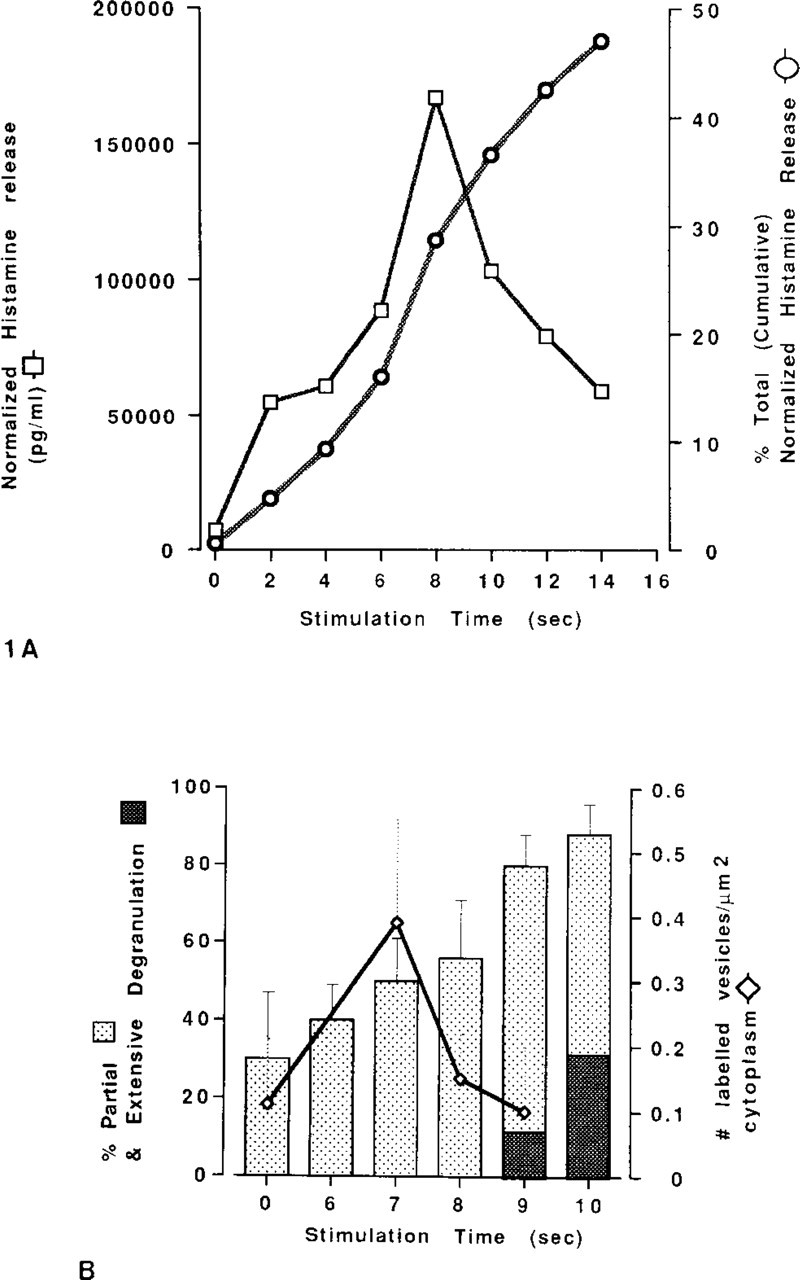
Measurements of the percent of total (cumulative) normalized histamine release showed that unstimulated mast cells (Figure 1A, 0 time) exhibited only 1% spontaneous histamine release, whereas stimulation of the mast cells with 10 μg/ml compound 48/80 at 20C for 14 sec induced the release of 47% of the cells' histamine (Figure 1A). This latter finding is consistent with the literature (Bloom and Chakravarty 1970). The largest histamine release, in a 2-sec interval after stimulation, occurred between 6 and 8 sec (Figure 1A).
A progressive increase in the mean percentage of mast cells that exhibited light microscopic evidence of activation (defined as cells whose cross-section contained 5 pink-stained, swollen cytoplasmic granules) occurred between 6 sec (40 ± 10%) and 10 sec (88 ± 8%) after stimulation with compound 48/80 (Figure 1B). The percentage of cells showing morphological evidence of extensive degranulation (i.e., <10 blue-stained granules remaining in the cytoplasm per 1-μ-thick mast cell section) was 12% by 9 sec and 33% by 10 sec (Figure 1B). There was no significant difference between the mean percentage of cells showing features of partial degranulation between 1 and 5 sec after addition of compound 48/80 (data not shown).
By light microscopy of alkaline Giemsa-stained, Epon-embedded 1-μ sections, most of the cytoplasmic granules in unstimulated mast cells stained dark blue and were densely packed in the cytoplasm. However, a few granules appeared somewhat larger than these typical blue-stained granules, and stained pink. We chose five as the maximal number of such pink granules that could be exhibited in a single 1-μ-thick section of a “non-degranulated” mast cell. We designated those mast cells with six or more such granules (but with ≥10 dense, blue-stained granules) as “partially degranulated.” However, low content of histamine in the medium of unstimulated mast cells (Figure 1A, 0 time) suggests that the presence of small numbers of altered, pink-staining cytoplasmic granules in the mast cells that had not been stimulated with compound 48/80 represents a “baseline” finding of changes occurring either in vivo or during the purification of the cells.
Electron micrographs of portions of rat peritoneal mast cells that either were not stimulated (
At 6 sec after mast cells were incubated with compound 48/80, there was a progressive increase in the number and size of pink-stained granules. By 9 sec after addition of compound 48/80, large pink-staining, irregularly shaped areas dominated the cytoplasm; cells also retained individual dark blue- or pink-stained granules. Consistent with published reports (Bloom and Chakravarty 1970), granules adjacent to the plasma membrane generally exhibited altered staining before the more interior granules.
Ultrastructural Features of Mast Cells During the First 10 Seconds After Exposure to Compound 48/80
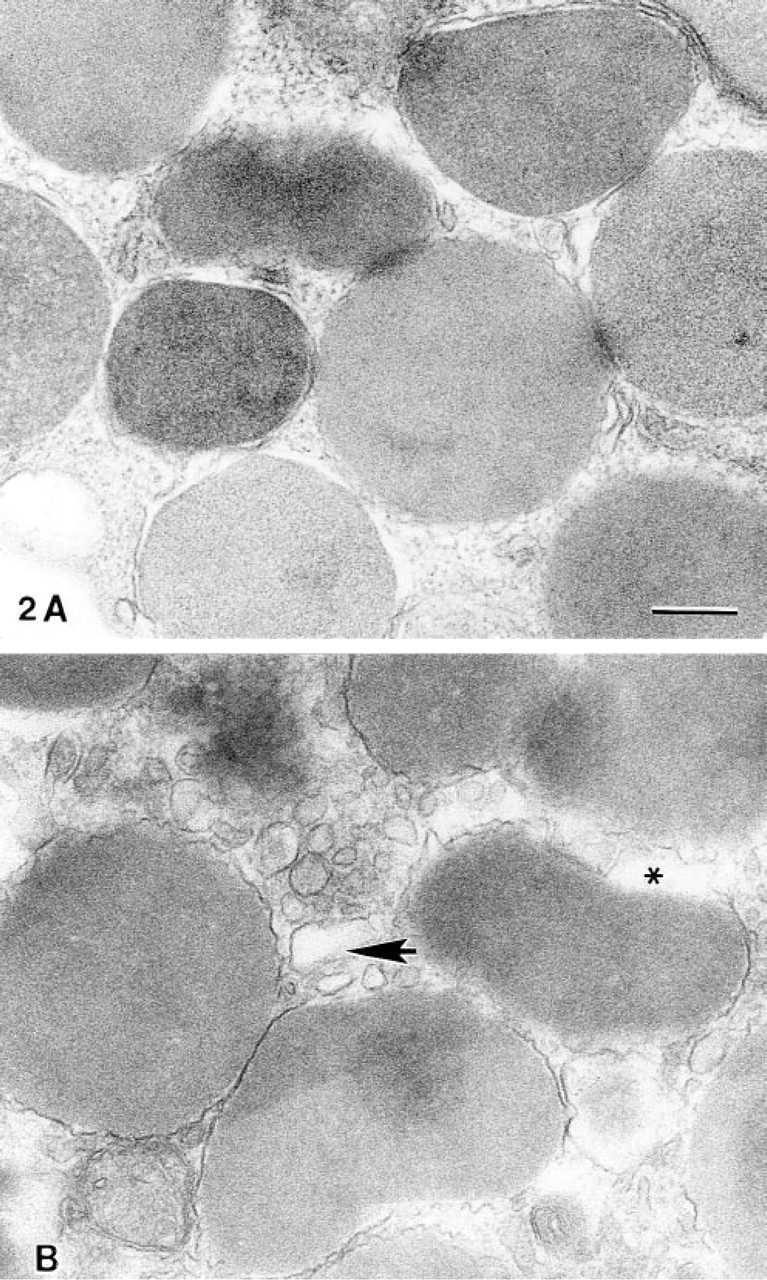
Many of the ultrastructural features of anaphylactic-type degranulation in rat peritoneal mast cells have been described in detail (Bloom and Haegermark 1965; Singleton and Clark 1965; Bloom and Chakravarty 1970; Röhlich et al 1971; Röhlich and Csaba 1972; Lagunoff 1972, 1973; Dvorak 1991). Therefore, in this study, we focused on the ultrastructural findings that preceded the formation of cytoplasmic degranulation channels and the exteriorization of granule contents. Mast cells that had not been exposed to compound 48/80 exhibited electron-dense granules that typically occurred close to, but did not appear to touch, one another. At higher magnifications, granule membranes appeared smoothly contoured and closely surrounded the granule matrix (Figure 2A). Vesicles were infrequently seen in the cytoplasm (Figure 2A).
Stimulated cells that were observed 7–8 sec after the addition of compound 48/80 exhibited some altered granules (Bloom and Haegermark 1965; Uvnαs 1974), but contained no degranulation channels. These granules appeared less electron-dense compared to the dense granules of unstimulated cells, contained altered matrices, and often were seen in apparent contact with one another. At higher magnifications, the membranes of many of these altered granules appeared irregularly contoured (Figure 2B) and were sometimes separated from the granule matrix by an electron-lucent space (Lawson et al. 1977).
By 7–8 sec after addition of compound 48/80, vesicles with smoothly contoured, circular, or elliptical profiles, often with electron-dense contents, and diameters between 50 and 200 nm were a dominant feature in the cytoplasm and often occurred close to or in contact with the granule membrane (Figure 2B). Vesicles were observed around mature cytoplasmic granules regardless of the proximity of the granules to the plasma membrane. Cells that had been stimulated with compound 48/80 for 9 sec exhibited degranulation channels containing extruded, swollen, membrane-free altered granule matrices. Extrusion of membrane-free, nonmembrane-bound granules to the exterior of the cell was also apparent. Few electron-dense granules remained in the stimulated cells, and these granules typically were clustered around the nucleus.
Immunolocalization of Chymase to Cytoplasmic Granules in Mast Cells After Stimulation with Compound 48/80
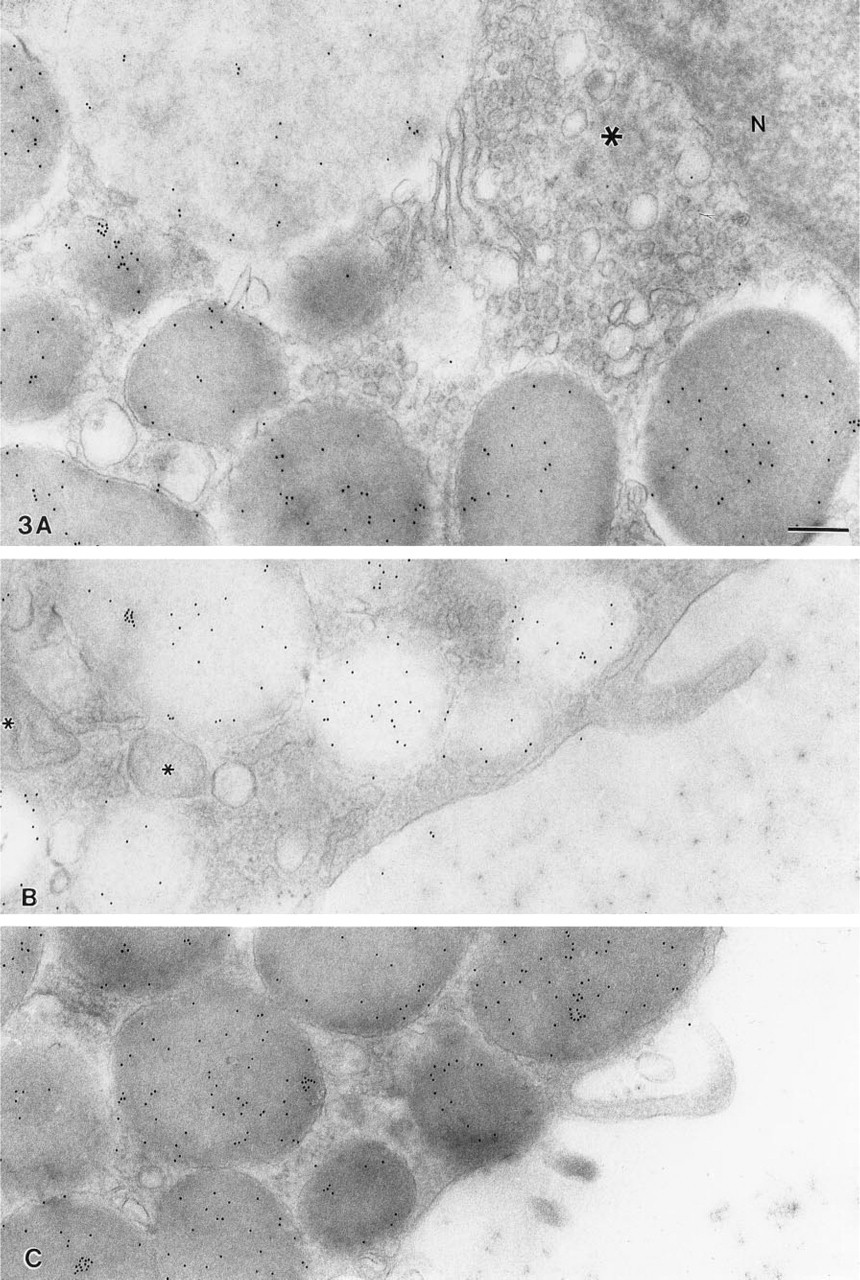
Immunolocalization of chymase, a major constituent of the granules of rat peritoneal mast cells (Schwartz et al. 1981; Login, et al. 1987), revealed specific labeling of the granule matrix in both unstimulated and stimulated cells (Figure 3; Table 1). Moreover, immunogold labeling density in dense granules was not significantly different in unstimulated cells (34 ±10 particles/μ2; Exp. 3, Table 1) or in cells that had been stimulated with compound 48/80 for 7 sec (45 ±15 particles/μ2), 8 sec (39 ±10 particles/μ2), or 9 sec (47 ± 7 particles/μ2) (Figure 4; Table 1). By contrast, immunogold labeling density in altered granules at 7, 8, or 9 sec was significantly less (p>0.002) than that in dense granules at 7, 8, or 9 sec, respectively (Table 1; Figure 4), a finding consistent with the hypothesis that such granules have already lost some of their content of this protease. Gold particles were rare in the nucleus (3 ± 1 particles/μ2) (Figure 3A), in the mitochondria (2 ± 1 particles/μ2) (Figure 3B), in the Golgi (Figure 3A), and over the resin background surrounding cells (Figures 3B and 3C). Importantly, low nonspecific chymase labeling density in the cytoplasm (Exp. 2, 0 sec, 15 ± 9 particles/μ2; Exp. 3, 0 sec 11 ± 6 particles/μ2) showed no significant increase with compound 48/80 stimulation (Exp. 2, 5 sec, 15 ± 14 particles/μ2; Exp. 3, 7 sec, 16 ± 6 particles/μ2) (Table 1). Moreover, chymase labeling was not seen in association with the plasma membrane either in stimulated mast cells (Figure 3B) or in unstimulated mast cells (Figure 3C).
Stimulation of Mast Cells with Compound 48/80 Is Associated with a Rapid but Transient Increase in Chymase-immunoreactive Cytoplasmic Vesicles
Electron micrographs of portions of rat peritoneal mast cells that were either stimulated for 9 sec with compound 48/80 (10 μg/ml) (
We determined the area (μ2) and number of chymase-immunoreactive vesicles and total vesicles per μ2 cytoplasm (area fraction and number fraction, respectively), as well as the gold labeling density in all vesicles, in unstimulated or compound 48/80-stimulated mast cells (Table 1). In Exp. 1 we established that changing unstimulated mast cells from 4C to RT for 7 sec (without also adding compound 48/80) resulted in no statistically significant differences in the numbers of cytoplasmic vesicles. However, compared to the values in unstimulated cells, mast cells stimulated with compound 48/80 for 5 sec exhibited a 271% increase in the area fraction of gold-labeled vesicles (5 sec, 0.0052 μ2 GLVs/μ2 cytoplasm vs 0 sec, 0.0014 μ2 GLVs/μ2 cytoplasm; p>0.01), a 450% increase in the number of gold-labeled vesicles (5 sec, 0.77 GLVs/μ2 cytoplasm vs 0 sec, 0.14 GLVs/μ2 cytoplasm; p>0.01), and a 110% increase in the gold label density in the entire vesicle compartment (5 sec, 78 gold particles/μ2 total vesicles vs 0 sec, 37 gold particles/μ2 total vesicles; p>0.01), as well as a small (43%) but not significant decrease in the average size of the gold-labeled vesicles (Exp. 2, Table 1). By contrast, cells stimulated for 10 sec, in which well-developed degranulation channels were evident, showed no significant differences in any of these values compared to those in unstimulated cells or in cells that had been stimulated for only 1 second (Table 1). Similar to the compartment of gold-labeled vesicles but less dramatic were changes in the total vesicle compartment with respect to measurements of the area fraction and number of vesicles/μ2. However, there were no significant differences with respect to the average vesicle size (μ2) (Table 1).
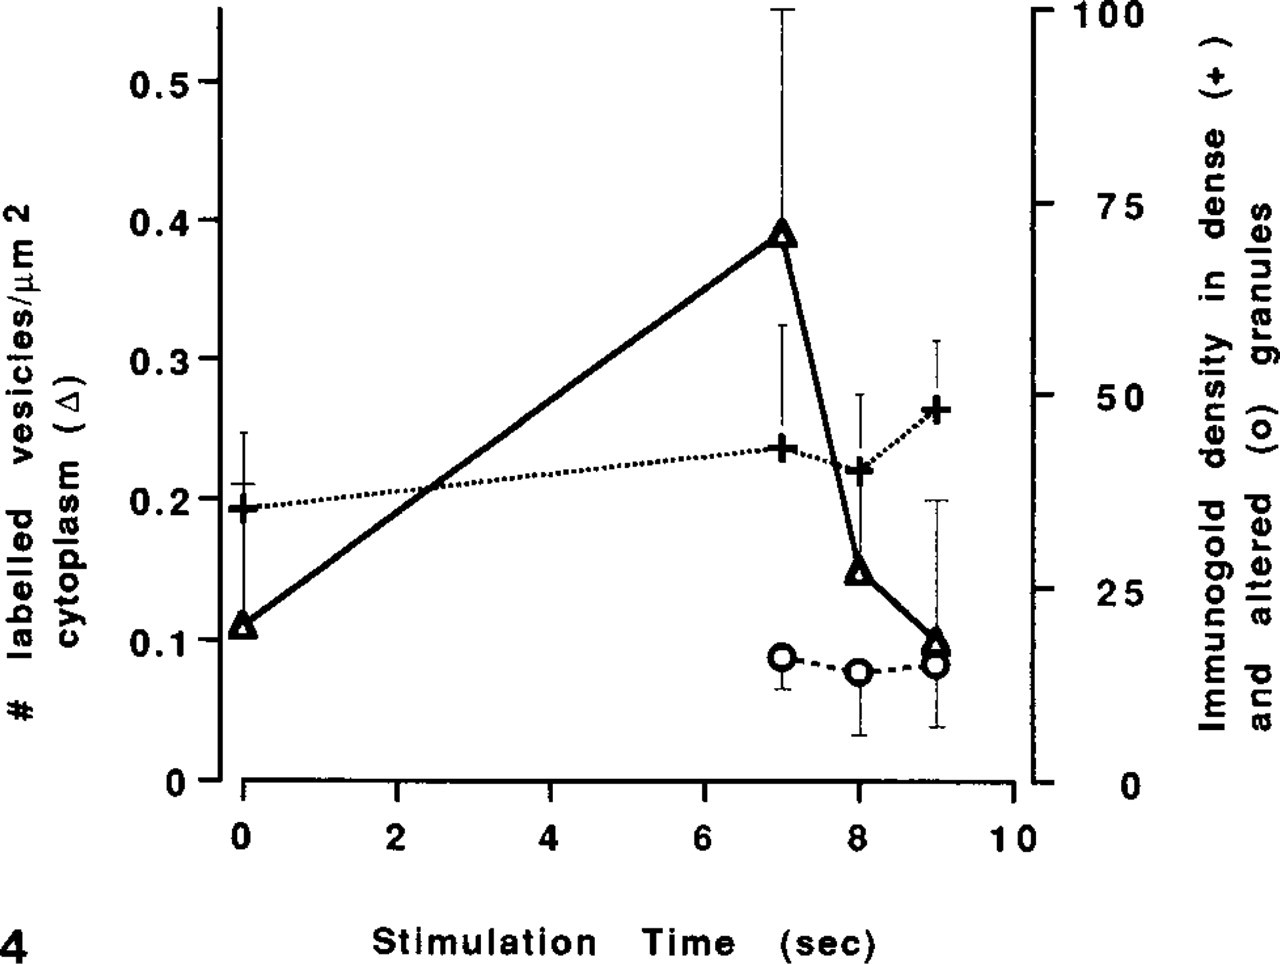
The numbers of gold-labeled, chymase-immunoreactive vesicles/μ2 of perigranular cytoplasm (±SD) (λ—λ) and the immunogold density (±SD) in electron-dense (+—+) or altered granules in unstimulated cells (0 time) and at 2-sec intervals vs time after addition of compound 48/80. The electron-dense granules contained a significantly higher density of chymase than did the altered granules (p>0.002). The increase in the numbers of chymase-immunoreactive vesicles coincided with the appearance of altered granules with decreased chymase immunoreactivity.
In Exp. 3, the changes in the gold-labeled vesicle compartment, as assessed by comparing results from unstimulated mast cells and cells examined 7 sec after exposure to compound 48/80, were similar to those in the Exp. 2. There were significant (p>0.01) increases of 237% in the area of GLVs/μ2 cytoplasm, of 280% in the number of GLVs/μ2 cytoplasm, and of 277% in the gold density in all vesicles (Table 1; Figures 1, 4, and 5). By 9 sec after stimulation with compound 48/80, each of these values had returned to levels that were not significantly different from the corresponding values in unstimulated cells (Table 1; Figure 1). Although there were no significant differences in the area fraction for the total vesicle compartment between unstimulated cells and cells stimulated with compound 48/80, the average size of individual vesicles in the total vesicle compartment by 9 sec after stimulation showed a small (40%) but significant (p<0.01) increase and the number of vesicles by 9 sec showed a small (60%) but significant decrease (p<0.01) compared to unstimulated cells (Table 1).
Quantitative analysis of gold-labeled, chymase-immunoreactive vesicles and granules of unstimulated and compound 40/80-stimulated rat peritoneal mast cells
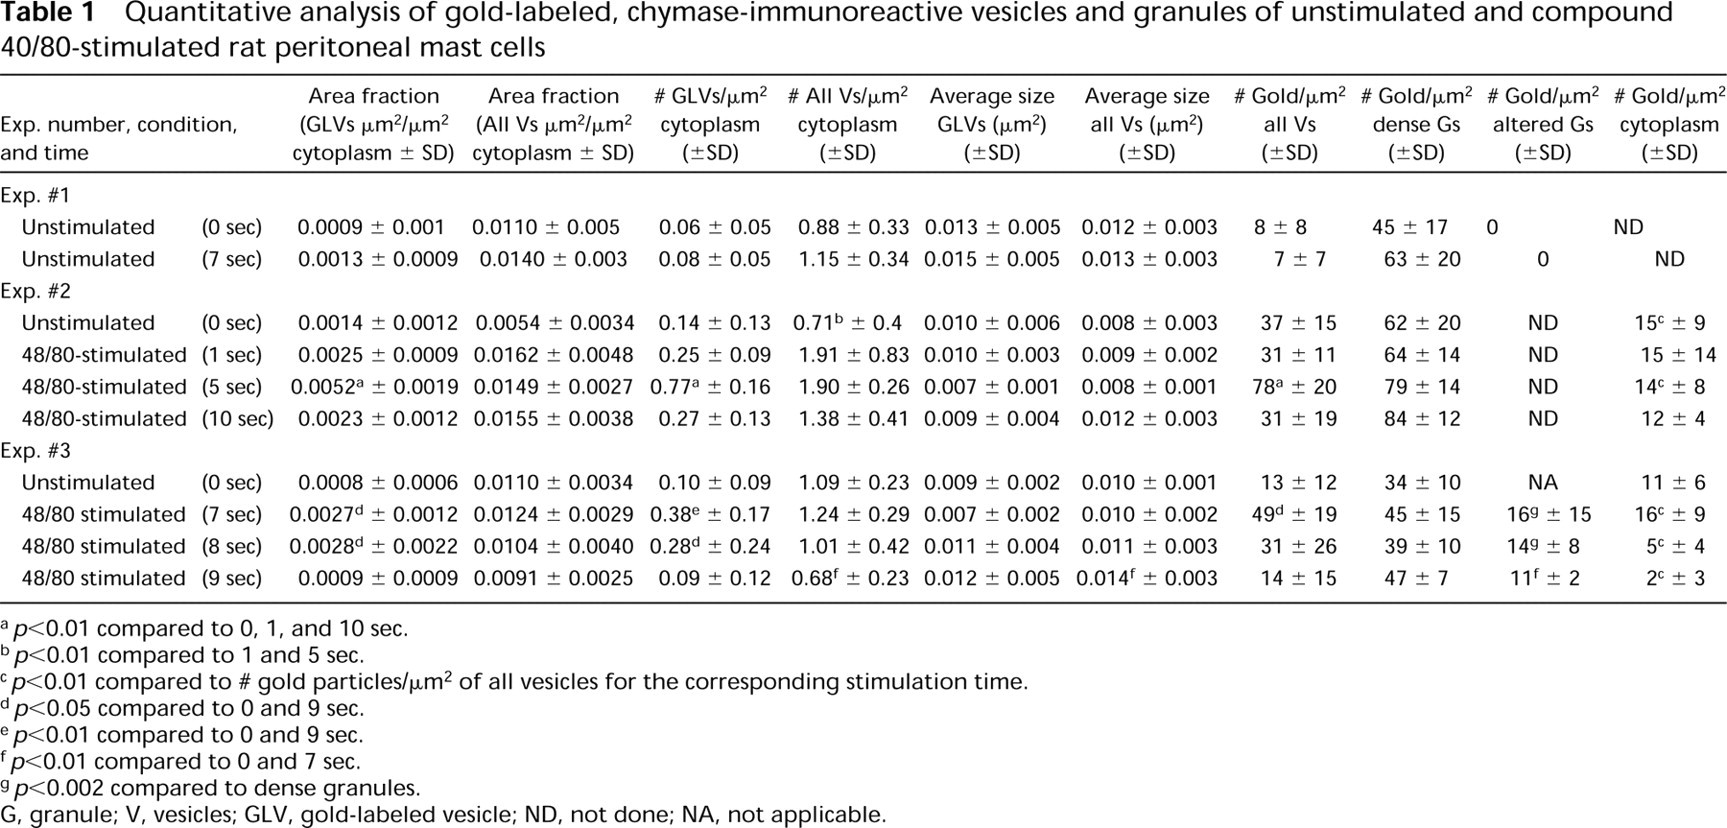
a p<0.01 compared to 0, 1, and 10 sec.
b p<0.01 compared to 1 and 5 sec.
c p<0.01 compared to # gold particles/μ2 of all vesicles for the corresponding stimulation time.
d p<0.05 compared to 0 and 9 sec.
e p<0.01 compared to 0 and 9 sec.
f p<0.01 compared to 0 and 7 sec.
g p<0.002 compared to dense granules.
G, granule; V, vesicles; GLV, gold-labeled vesicle; ND, not done; NA, not applicable.
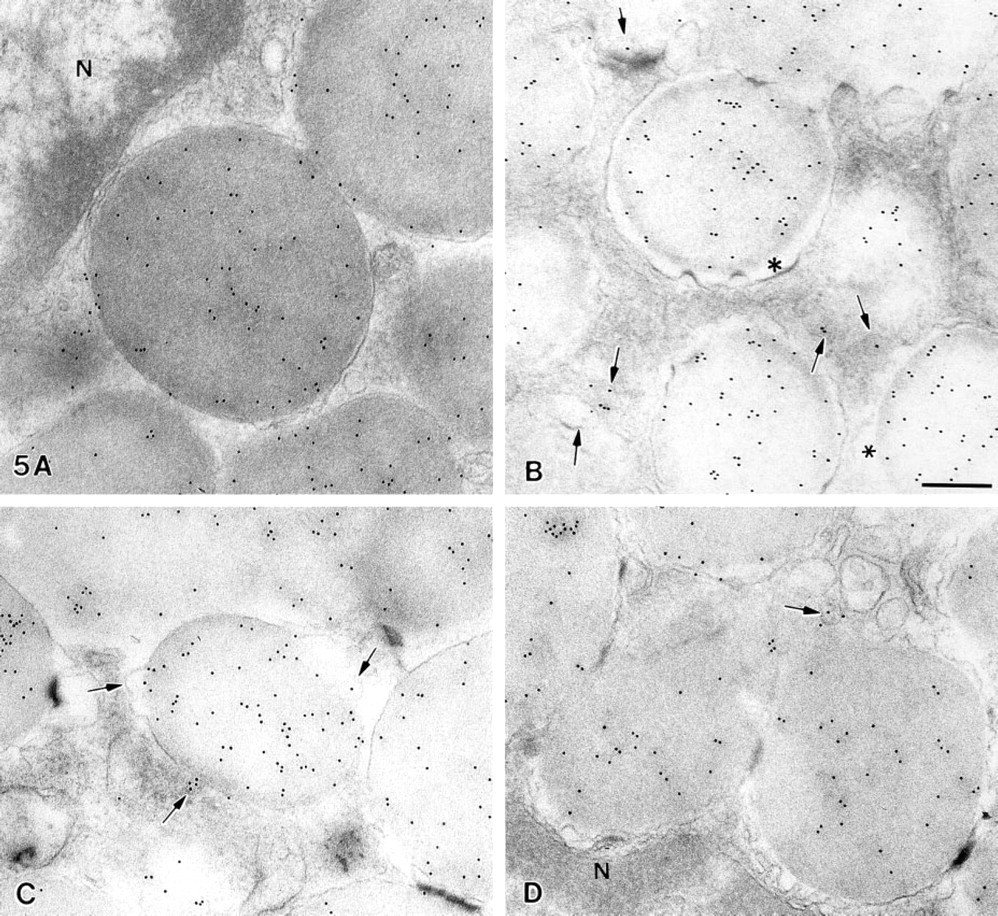
Immunogold localization of chymase in an unstimulated rat peritoneal mast cell (
Our data indicate that GLVs did not differ significantly from unlabeled vesicles in average size (Table 1), nor was the dramatic increase in area fraction or number of GLVs in these cells reflected in changes in these values for the total vesicle compartment. Indeed, the area and number of GLVs/μ2 cytoplasm never accounted for more than 35% and 41%, respectively, of the total vesicle compartment in Exp. 2, or for more than 27% and 31%, respectively, of the total vesicle compartment in Exp. 3. We also found that the density of gold label in the total vesicle compartment was highest when the number of gold-labeled vesicles peaked in both Exp. 2 (at 5 sec) and Exp. 3 (at 7 sec), and the differences between these values and those in unstimulated cells were statistically significant (p<0.01, p<0.05, respectively).
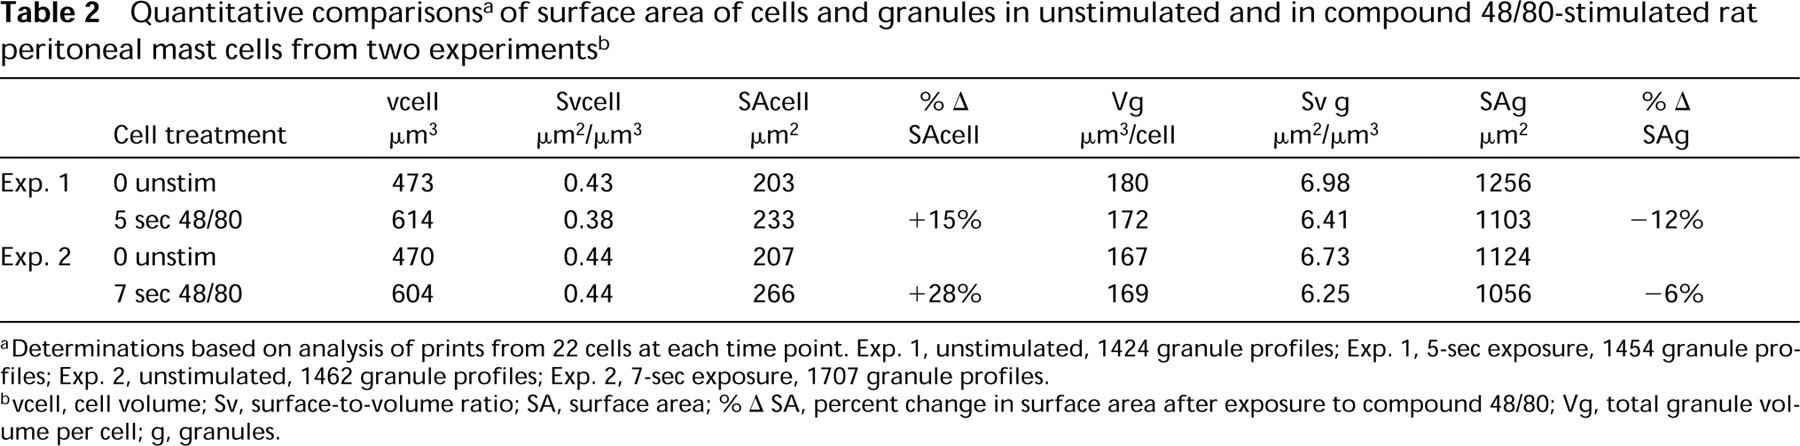
aDeterminations based on analysis of prints from 22 cells at each time point. Exp. 1, unstimulated, 1424 granule profiles; Exp. 1, 5-sec exposure, 1454 granule profiles; Exp. 2, unstimulated, 1462 granule profiles; Exp. 2, 7-sec exposure, 1707 granule profiles.
bvcell, cell volume; Sv, surface-to-volume ratio; SA, surface area; % Δ SA, percent change in surface area after exposure to compound 48/80; Vg, total granule volume per cell; g, granules.
Compound 48/80-stimulated Mast Cells Show an Increase in the Surface Area of the Cell and a Decrease in the Surface Area of the Total Granule Compartment in the Time Preceding Exocytosis
We determined the surface area of the cell and of the total granule compartment in unstimulated or compound 48/80-stimulated mast cells (Table 2). The surface area of mast cells increased by 15% and the surface area of the total granule compartment decreased by 12% after stimulation for 5 sec. In a second experiment, the surface area of mast cells increased by 28% and the surface area of the total granule compartment decreased by 6% after stimulation by compound 48/80 for 7 sec.
A Model Illustrating the Possible Fates of Chymase-immunoreactive Vesicles During Mast Cell Degranulation
Most unstimulated mast cells (Figures 2A, 5A, and 6) contained granules with closely approximated, smoothly contoured membranes. As reported by Lawson et al. (1977), we found that mast cells stimulated with compound 48/80 consistently showed the following changes in sequence: progressive widening of the space between the granule membrane and the granule matrix (Figures 5B and 6) and alterations in the smooth contour of the granule membrane (Figures 2B, 5B, and 6); those cells also exhibited an increase in the number of chymase-immunoreactive 50–200-nm cytoplasmic vesicles after exposure to compound 48/80, and some of these were in close proximity or attached to the granule membrane (Figures 5C and 5D), or were near the plasma membrane. By 9 sec after exposure to compound 48/80, degranulation channel formation was the dominant cytoplasmic feature (Figure 6). The presence of vesicles attached to granule membranes suggests that cytoplasmic vesicles may play a role in joining together the membranes of adjacent granules as granule fusion and degranulation channel formation occur (Figure 6). The presence of labeled vesicles near or in continuity with the plasma membrane is consistent with the hypothesis that such vesicles can also mediate transport of chymase to the cell surface (Figure 6).
Discussion
In this study, we present the first immunocytochemical evidence that vesicles that contain granule-associated chymase increase in number and area fraction at very early intervals (5–7 sec) after exposure of rat mast cells to compound 48/80. By using a rapid cell handling approach with 1-sec resolution, we show that chymase-labeled vesicle activity precedes degranulation channel formation in these cells and is associated with a significant reduction in the density of chymase-immunoreactivity in altered cytoplasmic granules that formed during the secretory process. Our approach further shows the feasibility of studying exocytotic processes in intact mast cells, with a time resolution comparable to those reported in recent studies for permeabilized mast cells (Gomperts and Tatham 1992).
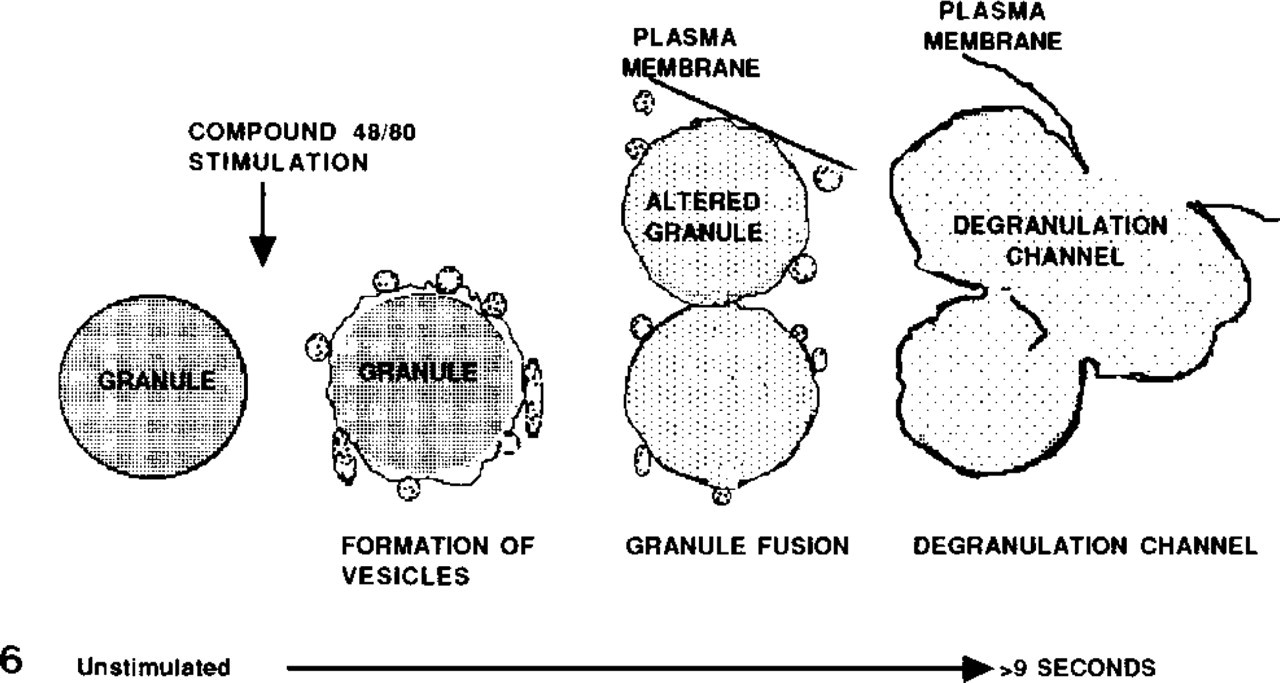
Diagram of rat peritoneal mast cell morphological changes occurring in the first 10 sec after stimulation with compound 48/80. Chymase-immunoreactive vesicles adjacent to and/or in contact with perigranular membranes of granules can be seen within sec of addition of compound 48/80. Vesicles contacting the plasma membrane and granule-to-granule fusions occur next. Degranulation channel formation is apparent by 10 sec. The model proposes that vesicles promote both granule–granule fusions and the transport of granule chymase.
We also used morphological, morphometric, and biochemical methods on replicate samples of similarly rapidly handled cells and supernatants to establish the time-line between pre-exocytotic morphological changes in granules and vesicles and the parallel release of the granule mediator histamine. Importantly, in rat peritoneal mast cells compound 48/80-induced secretion of histamine and activation of chymase are initiated by the same serine protease reaction (Vassimon and Rothschild 1990) suggesting that release of histamine and chymase occurs in parallel.
Our findings show that compound 48/80 stimulation is associated with a rapid, transient increase in the chymase-immunoreactive vesicle compartment and, to a lesser extent, in the total vesicle compartment in the post-stimulus interval up to 10 sec. This change coincided with the appearance in these cells of altered granules with diminished chymase immunoreactivity and immediately preceded the formation of degranulation channels. In addition, this change coincided with a decrease in the surface area of the granule compartment and an increase in the surface area of the cell membrane. Interestingly, Kraeuter Kops et al. (1990) report a similar increase in the number of total vesicles in compound 48/80-stimulated rat peritoneal mast cells (0.9 vesicles/μ2 cytoplasm in unstimulated cells and 1.9 vesicles/μ2 cytoplasm in stimulated cells; stimulation time not reported).
The findings of vesicle-like structures in continuity with the membranes of mature cytoplasmic granules (Lagunoff 1973; Kraeuter Kops et al. 1990) suggest that granule membranes represent a likely source of chymase-labeled vesicles in compound 48/80-stimulated cells. We believe it is unlikely that the labeled vesicles are constitutively released from the Golgi, because Golgi vesicles did not show gold label above background in either stimulated or unstimulated cells. It also appears unlikely that the source of chymase-labeled vesicles in the 5–7 sec after the beginning of stimulation is from the re-uptake of released chymase in endocytotic vesicles, because we did not observe chymase associated with the plasma membrane at any times examined, even after degranulation channels had formed in those cells. Moreover, the peak in gold-labeled vesicles developed before degranulation channel formation.
What is the specific fate of the chymase-immunoreactive vesicles in compound 48/80-stimulated mast cells? As proposed by us (Dvorak et al. 1981; Galli et al. 1984; Dvorak 1991) and others (Burwen and Satir 1977; Chandler and Heuser 1980), one function of such vesicles may be to enhance the fusion of individual granule membranes with each other and with the plasma membrane. In fact, membrane fusion events are known to precede secretory granule swelling in mast cells (Zimmerberg et al. 1987; Breckenridge and Almers 1987; Monck et al. 1991). Our morphologic and morphometric observations support this possibility.
It is also possible, as proposed in our general model of basophil or mast cell secretion (Dvorak and Dvorak 1975; Galli et al. 1984; Dvorak 1991) and as suggested by autoradiographic studies (Kraeuter Kops et al. 1990) of other mediators in mast cells stimulated by compound 48/80, that such vesicles can themselves transport granule contents to the plasma membrane (in the absence of degranulation). Our finding of chymase-immunoreactive vesicles in close proximity to the plasma membrane is consistent with this possibility. In addition, indirect support of a vesicle transport model for histamine release has been proposed on the basis of quantitative analyses of histamine/heparin ratios in compound 48/80-stimulated rat peritoneal mast cells (Slorach 1971). Therefore, vesicle transport of granule contents in the absence of exocytosis may provide a sensitive mechanism to upregulate secretion at the cell surface.
Yet another role of a vesicle-mediated secretory pathway in mast cells may be the selective transport of granule mediators. Rat peritoneal mast cells stimulated by the combination of compound 48/80 and the tricyclic antidepressant amitriptyline have been shown by an autoradiographic method to differentially release serotonin without histamine and without degranulation (Kraeuter Kops et al. 1990). Unfortunately, the similarity in size of the vesicles and the autoradiographic grains precluded any definitive statement as to whether the grains were localized over vesicular structures (Kraeuter Kops et al. 1990). It will be of interest to use the rapid cell handling and the high-resolution imaging methods we describe to investigate the role(s) of secretory vesicles in mast cells, and to determine which stimulating agents regulate the extent to which cytoplasmic vesicles are formed.
Footnotes
Acknowledgements
Supported by NIH grants DE-10059 (GRL), AI-33372 (AMD), and AI-20487 (LBS); the Brazilian Council of Research, Grant #200902/91 from CNPq (LOL); and the Department of Dermatology, Nippon Medical School, Tokyo, Japan (MA).
We thank Dr Koji Yano, Department of Pathology, for doing the histamine assays, Ms Patricia Fox for assistance in thin sectioning for electron microscopy, and Dr Ilan Hammel, Sackler School of Medicine, Tel Aviv, Israel, for his advice in the morphometric analysis.