
Abstract
Intestinal M-cells are specialized epithelial cells located in the domes of the gut-associated lymphoid tissues, which transport antigens from the lumen to the underlying lymphoid tissue, thereby initiating immune reactions. It is assumed that M-cells arise from stem cells in the crypts, from which they migrate to the top of the domes. To study the differentiation pathway of M-cells, we used the rabbit cecal lymphoid patch in which the M-cells express high levels of α1–2-linked fucose and N-acetyl-galactosamine residues in their apical membrane. Dome areas were labeled with fluorescein- and rhodamine-conjugated lectins specific for α1–2-linked fucose and N-acetyl-galactosamine in vivo and in vitro, and were observed with confocal laser scanning microscopy. Ultrathin sections were double labeled with lectin–gold conjugates and the labeling density was quantified by computer-based image analysis. All cecal patch M-cells expressed α1–2-linked fucose and N-acetyl-galactosamine, but the amount of the two saccharides varied considerably depending on the position of the M-cells at the base, flank, or top of the dome. In eight of 18 rabbits studied, radial strips of M-cells with common glycosylation patterns were observed, each strip associated with an individual crypt. Confocal microscopy revealed that lectin-labeled M-cells were not restricted to the dome epithelium but were also detected in the upper third of crypts surrounding the domes. The results show that M-cells are heterogeneous concerning the glycosylation pattern of membrane glycoconjugates. This pattern is modified as the M-cells differentiate and migrate from the base to the top of the dome. Radial strips of M-cells with a common proclivity of glycoconjugate expression suggest that those M-cells that derive from the same crypt have a clonal origin. The presence of (pre-) M-cells in the crypts surrounding the domes indicates that M-cells derive directly from undifferentiated crypt cells and do not develop from differentiated enterocytes.
Keywords
Materials and Methods
Adult male rabbits (n = 18, weight 2.0–3.3 kg, strains Chinchilla and New Zealand) were fed standard laboratory diet and had free access to water. The rabbits were kept under pathogen-free conditions (SPF) for at least 4 weeks before the experiments. After anesthetizing the animals with Ketanest and Nembutal (WDT; Garbsen, Germany), the abdominal cavity was opened and the cecal lymphoid patch removed. The rabbits were sacrificed by an intracardial or intravenous injection of T61 (Hoechst; Frankfurt, Germany). The excised samples were rinsed for 5–10 sec in Ringer's solution and immediately minced with razor blades. Small pieces were immersed in pure ethanol, Bouins's fluid, or in a solution of 2% formaldehyde and 0.1% glutaraldehyde in PBS, pH 7.3, for 4–16 hr.
Confocal Microscopy
Small pieces of ethanol- or Bouin-fixed tissue, each containing a single dome and adjacent nondome mucosa, were rinsed overnight in PBS and incubated in a solution containing 50 μg/ml Ulex europaeus agglutinin conjugated to rhodamine isothiocyanate (UEA-I–TRITC; Sigma, Deisenhofen, Germany) and 50 μg/ml Vicia villosa agglutinin conjugated to fluorescein isothiocyanate (VVA–FITC; Sigma) in PBS for 2 or 24 hr. After rinsing in PBS for at least 4 hr, the domes were observed with a BioRad MRC600 confocal laser scanning microscope equipped with an argon-krypton mixed gas laser using Comos software (version 6.0; BioRad, Munich, Germany). Maximal projections of serial optical sections were calculated and viewed using Lasersharp software (version 1.02; BioRad) and Photoshop software (version 3.05; Adobe Systems, Edinburgh, UK). In each rabbit, at least three domes were examined; a total of 117 confocal images taken from 76 domes were studied. Controls were carried out by omitting one of the lectins or both, and by preincubation of the lectin mixture with 0.06 M
Lectin–Gold Labelings
Single domes, fixed in formaldehyde/glutaraldehyde for 4 hr (see above), were rinsed in PBS containing 1%
The lectin–gold labeling procedure was performed with PBS containing 0.15% bovine serum albumin-c (BSA-c; Biotrend, Cologne, Germany) and 0.1% sodium azide. Free aldehyde groups were blocked in a drop of this buffer (PBS–BSA) containing 0.7%
Lectin Labeling of Living Tissue
To exclude possible alterations of the carbohydrate structure due to chemical fixation and to determine the accessibility of M-cell glycoconjugates in living tissue, the cecal patch of an additional rabbit was excised and immediately incubated in a solution containing 12.5 μg/ml UEA-I–TRITC and 12.5 μg/ml VVA–FITC in PBS for 15 min. After rinsing in PBS for 1 min and fixation in formaldehyde/glutaraldehyde (see above), single domes were dissected. Without further lectin labeling, some of the domes were examined by confocal microscopy and some were embedded in LR White resin. Unstained 1-μ sections were examined by conventional fluorescence microscopy using the appropriate filter sets for FITC and TRITC. Ultrathin sections were pretreated as described above and incubated with a monoclonal anti-FITC antibody (clone B13–DE1; Micheel et al. 1988). After rinsing, this antibody was detected by an anti-mouse IgG anti-body conjugated to 20-nm gold (BioCell). The grids were stained and examined as described above.
Image Analysis of Lectin–Gold Labeling
Photomicrographic negatives of the apical cell poles of M-cells taken at an electron optical magnification of 20,000:1 were digitalized with a scanner (PS2400X; Umax Data Systems, Taipei, Taiwan, ROC), and gray scale data sets were transferred to an IBAS image analysis system (version 2.0; Zeiss–Kontron, Munich, Germany). Regions of interest, including the brush border of M-cells, were selected interactively and the numbers of 10-nm and 20-nm gold particles per area were determined using algorithms supplied with the IBAS system. To exclude variation in the labeling procedure, photomicrographs of M-cells taken from single ultrathin sections were analyzed. A representative data set that includes 101 regions of interest is shown in the Results.
Results
Confocal Microscopy
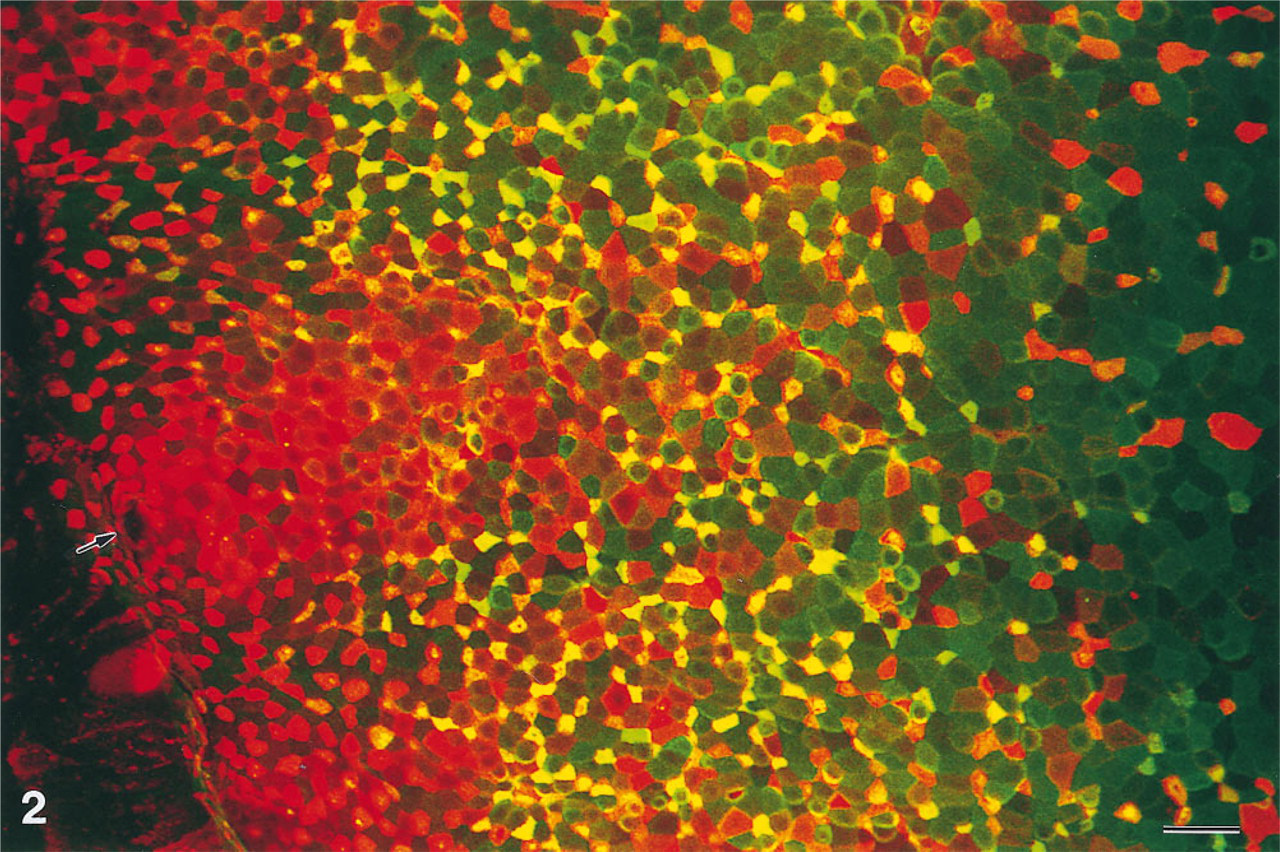
Maximal projections of serial optical sections showed that lectin-labeled cells, representing the M-cells, were most numerous at the flanks of the domes (Figure 1A). The M-cells were interspersed among the enterocytes and at the flanks comprised about 30% of all dome epithelial cells (Figures 1B and 2). Corresponding pairs of single-channel black-and-white images of domes double labeled with UEA-I–TRITC and VVA–FITC revealed that the vast majority of M-cells were reactive for both lectins. However, the ratio of the two labeling intensities varied widely (Figures 1B and 2). The prevailing specificity was visualized by two-channel color images. Cells located at the outer periphery of the domes were labeled in different shades of red, with only a small portion of green fluorescence (Figure 2), indicating that these cells predominantly bound UEA-I. Both the number of VVA-labeled cells and the VVA labeling intensity increased towards the middle of the flanks, whereas those of UEA-I-labeled cells decreased. At the transition from the flanks to the top of the domes, the labeling intensity for both lectins decreased and only a few mostly UEA-I-positive M-cells were present (Figures 1A and 2).
In eight of 18 rabbits studied, the dome areas were characterized by radial strips differing in the prevailing fluorescent color (Figure 3). Although each strip was composed of M-cells with both saccharide specificities, one of the colors-red, green, or yellow-predominated. The strips varied in width between 30 μ and 200 μ and were irregularly arranged on the domes. Some of the strips, most of them UEA-I-positive, were tapered and reached the center of the dome (Figure 3). High-power views showed that each strip was associated with a single crypt opening into the cleft between the dome and the opposite nondome region. When radial strips were seen, all domes of the individual rabbit possessed such strips. The presence or absence of radial strips apparently did not correlate with the strain (New Zealand or Chinchilla), litter, or age of the rabbits, or with the fixation method.
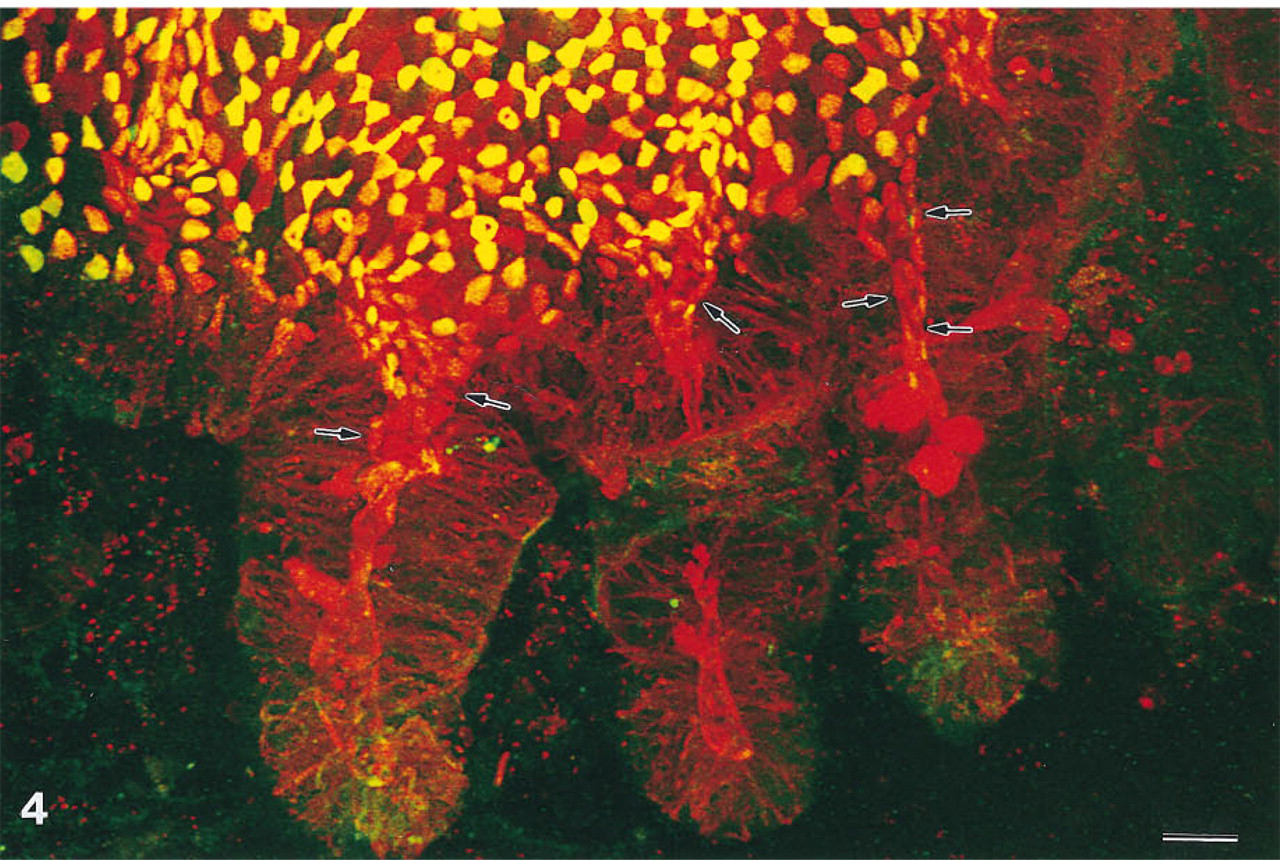
To investigate the region of the dome-associated crypts, lectin-labeled domes were viewed from the side using high-power oil immersion lenses. At the base of the domes near the mouths of these crypts, an irregular pattern of mostly fucose-bearing M-cells and unlabeled enterocytes was seen. Image stacks that contained complete crypts showed that this pattern was also present in the upper third of the dome-associated crypts (Figure 4). Within each of these crypts and at their mouths, the labeled cells were oriented to all sides, i.e., dome and nondome. The proportion of labeled cells remained constant in the adjacent epithelium at the base of the dome. However, in the nondome epithelium opposite, the pattern of fucose-labeled and unlabeled cells disappeared within a distance of 30–70 μ from the crypt mouths. No patterns of labeled and unlabeled cells were found in crypts that were not associated with domes.
Controls omitting one of the lectin conjugates resulted in a drastically reduced signal in the corresponding channel, i.e., background noise in the red channel and some autofluorescence in the green channel. Preincubation of UEA-I–TRITC with fucose drastically reduced the binding to very few, weakly labeled cells per dome. Preincubation of VVA–FITC with GalNAc prevented any binding at all. Preincubation with GalNAc and with fucose did not influence the binding of UEA-I and of VVA, respectively. Controls with lectins not specific for cecal patch M-cells, e.g., ConA, showed a weak but uniform labeling of all dome epithelial cells.
Lectin–Gold Labelings
Results obtained with confocal microscopy gave the impression that the M-cells of the rabbit cecal patch could be divided into three distinct subtypes, defined by red, yellow, or green fluorescence. To prove this hypothesis, lectin–gold labelings were performed and quantified. On ultrathin sections, lectin–gold labeling was almost restricted to the apical membranes of M-cells and to the membranes of vesicles lying in the apical cytoplasm of the M-cells (Figure 5A). The labeling of enterocyte and lymphocyte membranes was negligible. The overall labeling density of UEA-I by far exceeded that of VVA because the 20-nm gold particles used for GalNAc labeling bind less efficiently than the 10-nm particles used for UEA-I. The labeling density of 10-nm particles, representing UEA-I binding sites, and 20-nm particles, representing VVA binding sites, varied considerably from cell to cell (Figure 5B-5D). Image analysis revealed that both lectins showed a broad but continuous spectrum of labeling intensities, which did not allow the definition of three distinct subtypes at the electron microscopic level (Figure 6). Preincubation of the lectins with their corresponding saccharides drastically reduced or prevented the labeling.
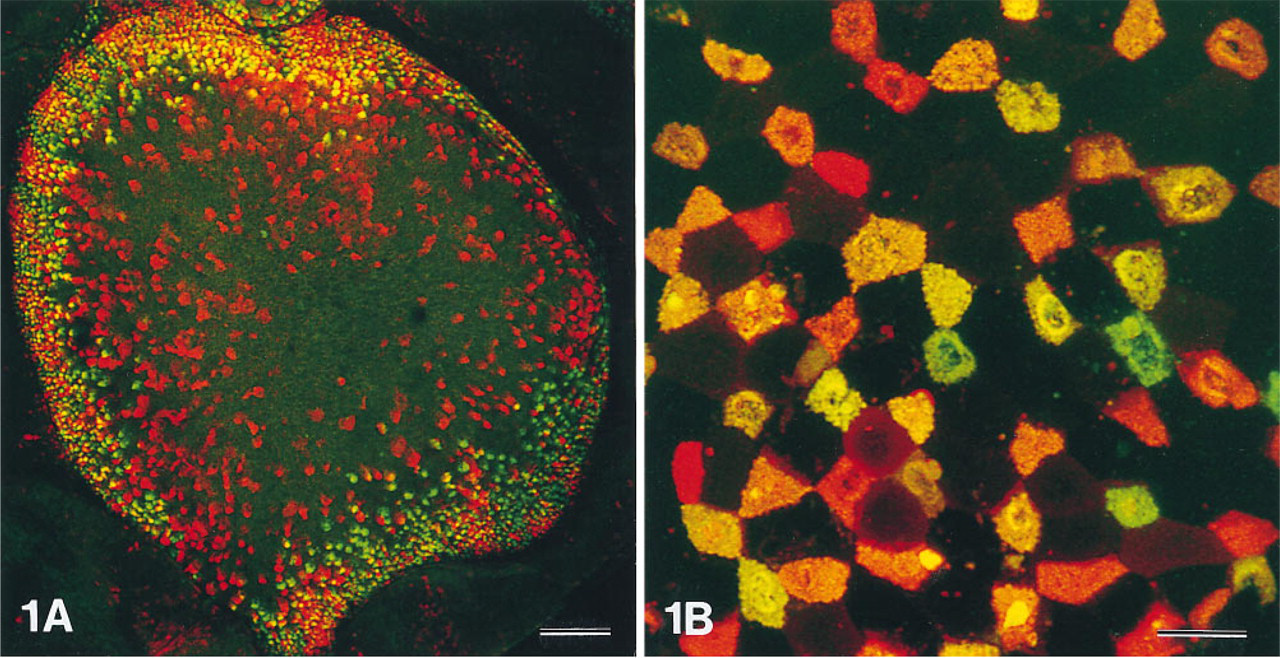
Confocal view of a rabbit cecal patch dome as a whole mount. α1–2-linked fucose residues are detected by the Ulex europaeus agglutinin (UEA-I–TRITC) and shown in the red channel; N-acetyl-galactosamine (GalNAc) residues are detected by the Vicia villosa agglutinin (VVA–FITC) and shown in the green channel. Whereas the enterocytes of the dome remain almost unlabeled, the vast majority of the M-cells express both terminal saccharides. The relative labeling intensity for the two specificities, however, varies among the M-cell population with some cells predominantly expressing α1–2-linked fucose and some predominantly expressing GalNAc. The M-cells are restricted to the dome epithelium and are most numerous at the flanks of the dome (
Lectin Labeling of Living Tissue
Cecal patch domes that had been lectin-labeled in vivo showed a relatively low labeling intensity compared to fixed tissue. This is probably due to the reduced incubation time (15 min vs several hours) and the higher dilution of the lectins (12.5 μg/ml vs 50 μg/ml). Despite this low intensity, the labeling patterns found with confocal microscopy in in vivo lectin-labeled domes closely resembled those found in fixed tissue. Immunogold labelings on ultrathin sections, detecting the FITC label of VVA bound to cell surfaces, showed some binding of gold particles to the brush border of M-cells but no binding to the remaining cytoplasm of the M-cells nor to enterocytes and other cells. The labeling intensity of M-cell membranes varied from cell to cell in a similar manner to that described for on-section lectin labelings.
Discussion
Previous lectin histochemical studies on the rabbit gut-associated lymphoid tissue demonstrated that M-cells of the rabbit cecal lymphoid patch express high levels of α1–2-linked fucose and GalNAc residues in their apical membrane (Gebert and Hach 1993; Jepson et al. 1993a). Although the biological significance of these membrane-bound glycoconjugates is not completely understood (Clark et al. 1993; Gebert and Hach 1993; Jepson et al. 1993a; Giannasca et al. 1994), the rabbit cecal patch represents an appropriate model for studying the origin, differentiation, and migration of M-cells.
Confocal light and lectin–gold electron microscopy reveal that the M-cells of an individual dome of the cecal patch are heterogeneous with respect to the expression of α1–2-linked fucose and GalNAc residues in the glycocalyx of their apical membrane, and that the M-cells form an irregular patchwork with various amounts of the two terminal saccharides. Both techniques applied in this study detected these variations and are necessary to give the full picture. Confocal laser scanning microscopy easily exhibits the distribution of labeled cells on the domes and in the crypts, but quantitations of the labeling intensities are unreliable because of bleaching effects and summation effects due to the maximal projection of the image stack performed during digital processing. Lectin–gold electron microscopy overcomes these problems because it allows the labeling densities to be quantified, the lectin binding sites in the glycocalyx to be localized, and the ultrastructural morphology of the labeled cells to be determined. Although some of the confocal images gave the impression that three subtypes of M-cells could exist according to the expression of α1–2-linked fucose or GalNAc, at the electron microscopic level no distinct subtypes were found, but rather a continuous spectrum of labeling intensities. Heterogeneity among the M-cells of individual domes has likewise been reported for the binding of the lectins UEA-I, AAA, and EEA to M-cells of murine Peyer's and cecal patches (Giannasca et al. 1994; Clark et al. 1995) and for the binding of UEA-I and Lotus lectin to M-cells in the palatine tonsil of rabbits (Gebert 1996). The lectin labeling of living tissue performed in the present study demonstrates that variations in the saccharide composition of the apical membrane of M-cells indeed exist in the living system, which probably play a role in the differential adherence to and uptake of antigens by M-cells. This hypothesis is supported by the observation that Salmonella typhimurium adheres in a nonuniform manner to the M-cells in murine Peyer's patches (Clark et al. 1994). Such variations in the expression of terminal saccharides could likewise allow the uptake of a larger number of different antigens by the M-cell population.
In addition to local variations of glycosylation among the M-cells, the base, flank, and top of the domes largely differ in the prevailing terminal saccharides on M-cell surfaces. These variations correlate with the crypt–villous axis of epithelial differentiation in general and the crypt-dome axis in the gut-associated lymphoid tissue. The M-cells and enterocytes of the dome epithelium are generated in the dome-associated crypts, subsequently migrate to the flanks, and are finally sloughed off near the center of the dome (Bhalla and Owen 1982; Bye et al. 1984). The two-color confocal views show that the glycosylation of membrane glycoconjugates is modified during this migration. Similar changes have been reported for the filamentous brush border glycocalyx of rabbit villous enterocytes (Maury et al. 1995). In the enterocytes of normal villi, changes in the composition of membrane-bound glycoconjugates are accompanied by changes in the ultrastructure (Cheng and Leblond 1974; Leblond 1981), the pattern of gene expression (Rubin et al. 1989; Cheng and Bjerknes 1996), and the activity of brush border enzymes (Nordström et al. 1967; Leblond 1981). Ultrastructural differences have been described between so-called immature M-cells at the base of the domes and mature M-cells at the top (Bye et al. 1984; Sicinski et al. 1986). The present findings suggest that membrane-bound glycoproteins likewise reflect the changes during the differentiation and migration of M-cells. These findings could further imply that M-cells, depending on their position on the dome, differ in the expression of surface receptors, which could result in the adherence and uptake of different antigens at different stages of M-cell development. In addition, changes in glycosylation could parallel functional activity (i.e., antigen uptake capacity), because experiments with ferritin showed a reduced uptake of this tracer by immature M-cells at the base of the dome (Bye et al. 1984). In addition to glycosylation changes along the crypt–dome axis, the results show that in the domes of more than 40% of the rabbits studied radial strips are seen, each corresponding with a single dome-associated crypt. This observation indicates that M-cells that derive from the same crypt have a common but individual proclivity of their glycosylation pattern. Similar strips of lectin-positive or -negative cells have been described for normal villi in a mouse chimeric system using the GalNAc-specific Dolichos biflorus agglutinin as marker (Ponder et al. 1985; Schmidt et al. 1985; Winton et al. 1988). Because these reports suggest that the villous epithelial cells have a clonal origin with a single progenitor cell per crypt (Ponder et al. 1985), the present results imply that an analogous situation exists for M-cells with a single progenitor (M) cell per dome-associated crypt. Local variations among the cells deriving from the same crypt, as described in the present study, are in accordance with this view, because a similar mosaic of cells with a common clonal origin has been reported for the expression of blood group A antigen and lactase in human villous enterocytes (Maiuri et al. 1991, 1993).
High-power confocal view of the base (lower left corner), the flank (center), and the top (upper right corner) of a lectin double-labeled dome of a rabbit cecal patch. Immature M-cells that leave the openings of the dome-associated crypts (arrow) predominantly express α1–2-linked fucose residues in their apical membrane (red fluorescence). When the M-cells migrate to the flank they increasingly express GalNAc (yellow and green fluorescence). At the top of the dome, only a few M cells are left and they predominantly express α1–2-linked fucose. Maximal projection of 53 confocal sections, × 510. Bar = 20 μ.
The radial strips of M-cells with similar lectin binding patterns were relatively clearly separated from each other and met at the center of the dome with tapered ends. Therefore, the population of M-cells deriving from an individual crypt migrates directly to the center of the dome and only a small portion blends with the M-cells from neighboring crypts. The tapering of the radial strips to the center of the domes suggests that a number of dome epithelial cells are sloughed off before reaching the center of the dome. This view is supported by findings in a mouse chimeric system of similar tapered and disrupted strips of enterocytes at the endings of duodenal villi (Schmidt et al. 1985). In addition, on the top of the domes the proportion of lectin-labeled cells was reduced compared to the flanks, suggesting that the M-cells have a reduced lifespan and are possibly sloughed off earlier compared to dome epithelial enterocytes. This assumption is in agreement with the observation that, in most species and locations of gut-associated lymphoid tissue, the M-cells are most numerous at the flanks (Schmedtje 1980; Gebert and Hach 1993; Jepson et al. 1993b). The presence or absence of radial strips was constantly found in all domes of an individual rabbit but apparently did not correlate with lineage or age. Therefore, we speculate that the progenitor (M) cells in the crypts normally have an invariant glycosylation pattern but, in some cases, produce random variations from crypt to crypt, similar to those described for enterocytes in mouse chimeras (Ponder et al. 1985; Schmidt et al. 1985; Winton et al. 1988). M-cells and enterocytes formed an irregular mosaic-like pattern that was detected by confocal laser scanning microscopy, not only on the dome epithelium but also in the upper third of the dome-associated crypts. In contrast to the situation described for Epon sections of murine Peyer's patches (Giannasca et al. 1994), the lectin-labeled cells were oriented to all sides of these crypts (see lower left corner of Figure 2). According to the generally accepted theory of crypt cell origin, differentiation, and renewal (Cheng and Leblond 1974), the different types of gut epithelial cells develop from un-differentiated crypt stem cells. The presence of lectin-labeled (pre-) M-cells in the dome-associated crypts indicates that M-cells are directly derived from undifferentiated crypt cells and do not develop from differentiated enterocytes as previously hypothesized (Smith and Peacock 1980, 1982; Bhalla and Owen 1982) and recently questioned (Borghesi et al. 1996; Savidge 1996). Although (pre-) M-cells primarily occurred at all sides of the dome-associated crypts, further differentiation was seen when the labeled epithelial cells entered the dome, but not when they entered the non-dome epithelium opposite. It is therefore speculated that the presence of M-cells in the domes of gut-associated lymphoid tissues is determined by two mechanisms: (a) specialized crypts produce a separate cell line, which (b) differentiates to mature M-cells in the unique microenvironment of the dome epithelium. This two-step hypothesis of M-cell development could further unify the two contradictory theories of M-cell development currently under discussion (Borghesi et al. 1996; Savidge 1996). An experimental “induction” of M-cells within only a few hours due to antigenic challenge and/or lymphocyte invasion (Smith and Peacock 1982; Savidge et al. 1991; Borghesi et al. 1996) could be explained as a short-term differentiation of predetermined M-cells that had not been detected before by ultrastructural characteristics or less sensitive histochemical markers. The factors that sustain such a differentiation under normal, experimental, or pathological conditions (antigens, lymphocytes, basal lamina, or soluble factors?) are still poorly understood and require further investigation.
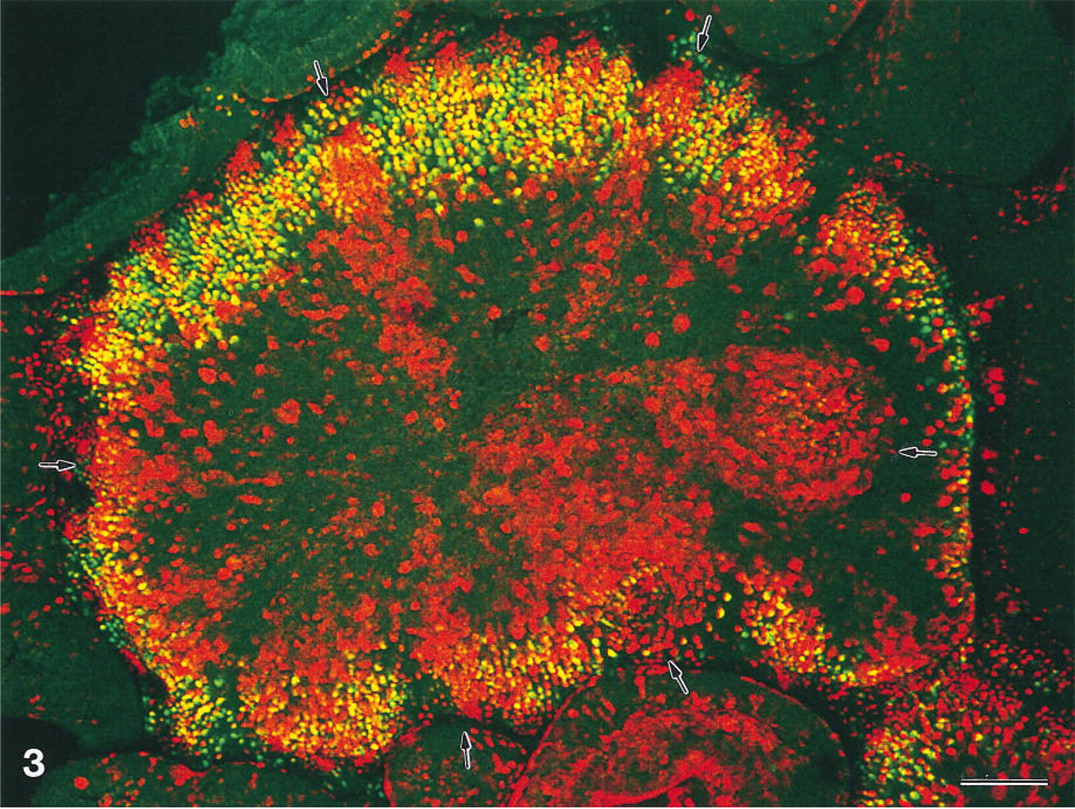
Top view of a lectin double-labeled dome which shows radial strips of M-cells with a common glycosylation pattern. Arrows point to radial strips which predominantly express α1–2-linked fucose (red fluorescence). Each strip is associated with an individual crypt at the base of the dome. Tapered ends of some of the radial strips reach the center of the dome. Maximal projection of 42 confocal sections, × 140. Bar = 100 μ.
Base of a cecal patch dome with three dome-associated crypts that open to the dome epithelium. At the base and flank of the dome, M-cells and enterocytes form an irregular patchwork of lectin-labeled M-cells (red, yellow, or green) and unlabeled enterocytes. Because the mosaic of labeled and unlabeled cells is also present in the upper third of the dome-associated crypts (arrows), epithelial cells at this position are probably determined as M-cells or enterocytes. Normal crypts, not opening to domes, lack such mosaic patterns. Maximal projection of 31 confocal sections, × 510. Bar = 20 μ.
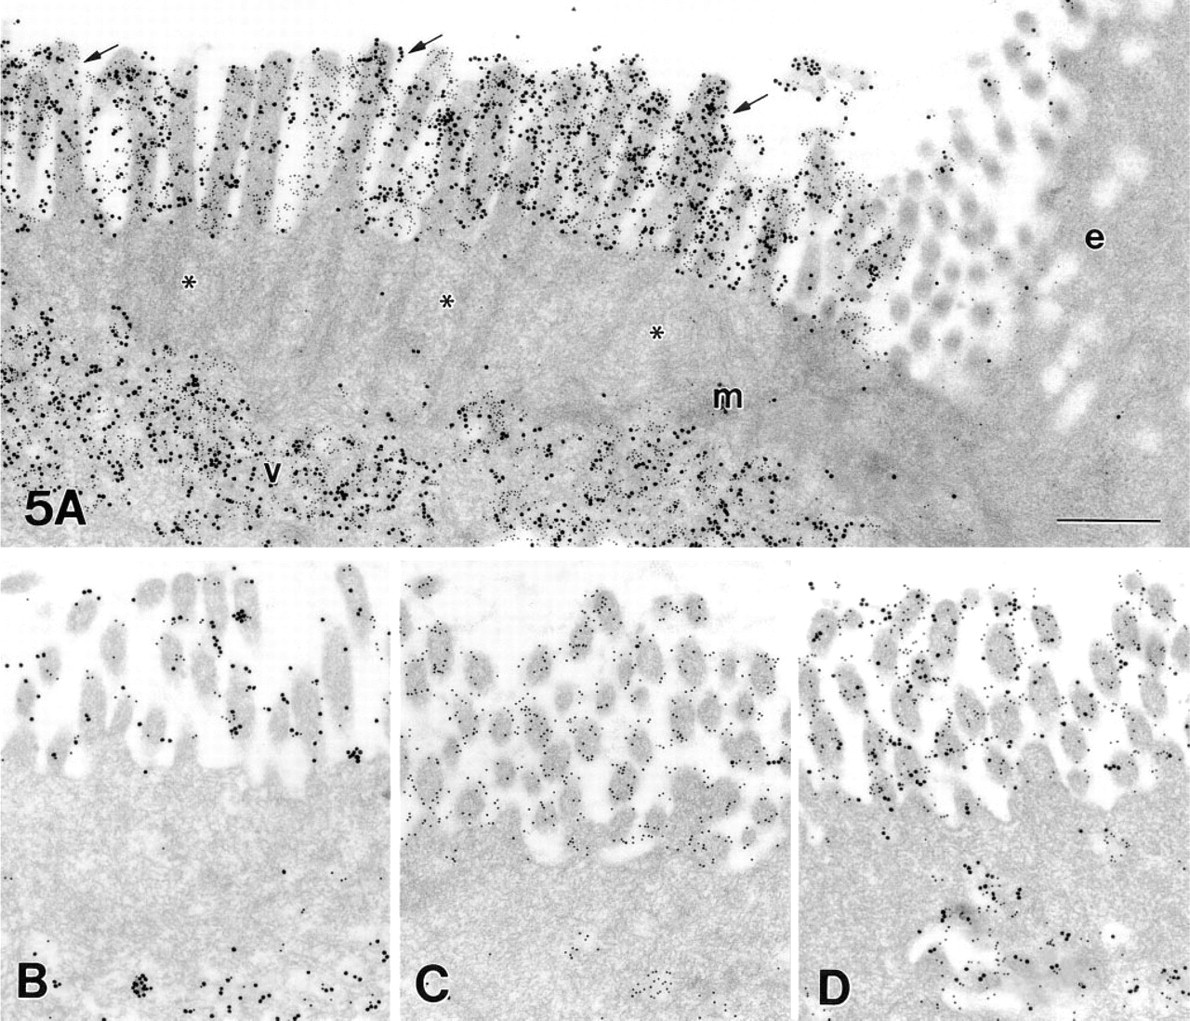
Epithelium at the flanks of the cecal patch dome. α1–2-linked fucose residues are detected by the Ulex europaeus agglutinin (UEA-I) and visualized by 10-nm gold particles. GalNAc residues are detected by the Vicia villosa agglutinin (VVA) and visualized by 20-nm gold particles. Intense labeling is seen in the apical membrane (arrows in
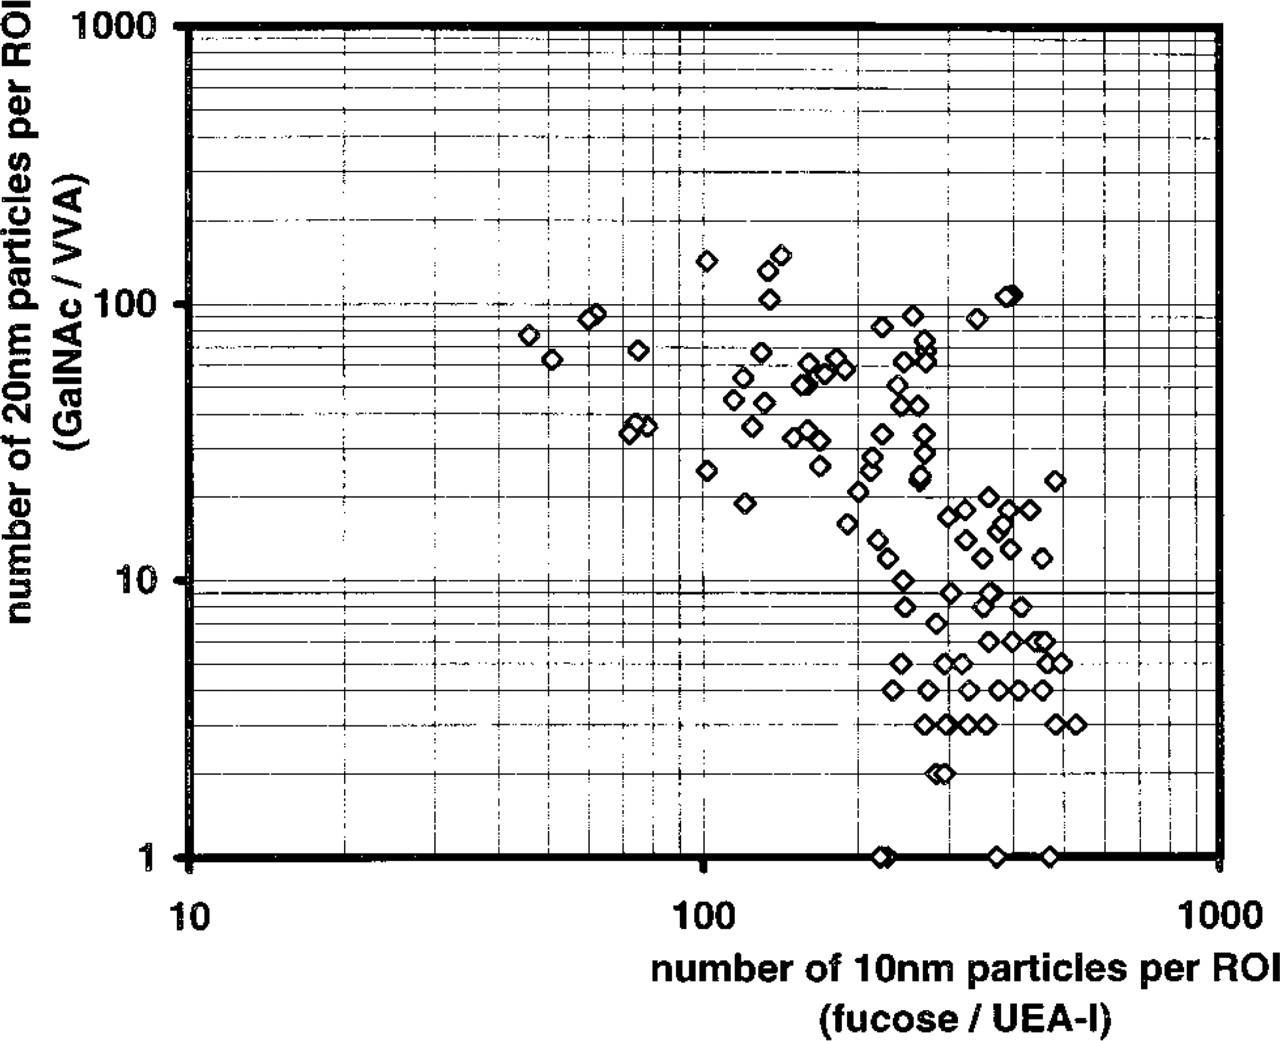
Quantitation of the lectin labeling density in the apical membrane of cecal patch M-cells. Each symbol represents the corresponding UEA-I and VVA labeling density of an individual M-cell. The data set comprises 101 regions of interest (ROI) taken from a single ultrathin section. Both labeling densities vary considerably from cell to cell and show a continuous spectrum, which does not allow definition of distinct subtypes of M-cells. The data rather imply that α1–2-linked fucose residues, detected by UEA-I, and GalNAc residues, detected by VVA, are expressed in a reciprocal manner.
In conclusion, this model implies that intestinal M-cells are derived from a single or only a few progenitor cells per crypt and are determined as M-cells even before they reach the dome epithelium. The heterogeneity of glycosylation patterns suggests that M-cells have a clonal origin in the dome-associated crypts and modify their glycosylation pattern as they migrate up the dome.
Footnotes
Acknowledgements
Supported by the Deutsche Forschungsgemeinschaft (SFB-280/C14).
We are grateful to Prof E. Reale, Department of Cell Biology and Electron Microscopy, for providing the EM facilities, Prof W.G. Forssmann, Lower Saxony Institute for Peptide Research, for providing the CLSM facilities, Prof D. Grube and Dr G. Bargsten for providing the image analysis system, and Prof B. Micheel for providing the anti-FITC antibody. We gratefully acknowledge the critical and helpful discussions with Prof H. Bartels, Prof R. Pabst, and Prof J. Westermann. The technical assistance of A. Beck, S. Fassbender, G. Preiss, and K. Werner, and the correction of the English text by S. Fryk, are gratefully acknowledged.