
Abstract
In situ hybridization analysis of tissue mRNA concentrations remains to be accepted as a quantitative technique, even though exposure of tissue sections to photographic emulsion is equivalent to Northern blot analysis. Because of the biological importance of in situ quantification of RNA sequences within a morphological context, we evaluated the quantitative aspects of this technique. In calibrated microscopic samples, autoradiographic signal (density of silver grains) was proportionate to the radioactivity present, to the exposure time, and to time of development of the photographic emulsion. Similar results were obtained with tissue sections, showing that all steps of the in situ hybridization protocol, before and including the detection of the signal, can be reproducibly performed. Furthermore, the integrated density of silver grains produced in liver and intestinal sections by the in situ hybridization procedure using 35S-labeled riboprobes is directly proportionate to the signal obtained by quantitative Northern blot analysis. The significance of this finding is that in situ quantification of RNA can be realized with high sensitivity and with the additional advantage of the possibility of localizing mRNA within the cells of interest. Application of this procedure on fetal and adult intestinal tissue showed that the carbamoylphosphate synthetase (CPS)-expressing epithelial cells of both tissues accumulated CPS mRNA to the same level but that whole-organ CPS mRNA levels decreased four- to fivefold in the same period, owing to a comparable decrease in the number of CPS-expressing cells in total intestinal tissue.
Keywords
QUANTIFICATION of mRNA plays a crucial role in study of the regulation of gene expression. Quantification, however, is hardly meaningful when the localization of the mRNA is not simultaneously achieved. Not unexpectedly, in situ hybridization, which allows the detection of mRNA sequences within the topographical context of a tissue, has revolutionalized the field (Wilcox 1993). literally hundreds of in situ hybridizations can be carried out with a manifold of different probes on a single surgical biopsy specimen. Nevertheless, it is an ever-recurring theme that a quantitative appreciation of the changing patterns of expression (e.g., by Northern, dot-blot, or RNAse protection assay) is fundamental to a proper understanding of changes in cell function in developing, adult experimental, or pathological tissue. However, the amounts of RNA extracted from embryos or surgical biopsies are usually, at best, sufficient for a few quantitative Northern analyses. Moreover, inevitably, all cellular relations are lost. Although quantitative nonradioactive in situ hybridization methods are emerging and are very promising owing to their high resolving power, this far they are mostly limited to the detection of relatively abundant mRNAs, such as those encoding proinsulin (Guiot and Rahier 1995), myosin heavy chain (Leeuw and Pette 1994), and pro-opiomelanocortin (Larsson et al. 1991; Larsson and Hougaard 1990). In tissue sections, many mRNAs that belong to the intermediate- and low abundance classes of mRNAs can be detected only with radioactive probes (Wilcox 1993), leaving autoradiography as the only possible detection method. Because 35S-labeled (ribo)probes emit electrons of intermediate energy, they combine high sensitivity with reasonable resolution.
The reliability of radioactive in situ hybridization measurements is affected by four categories of requirements. They comprise demands imposed by (a) the histological procedure, (b) the method of hybridization proper, (c) the autoradiographic process, including development of the latent image, and (d) the method of detection of the signal. Both the histological requirements (e.g., Moorman et al. 1993; Jilbert et al. 1986; Singer et al. 1986; Lawrence and Singer 1995) and the hybridization proper (e.g., Wilcox 1993; Wilkinson 1992; Haffner and Willison 1987; Holland 1986) have been optimized extensively. However, preset in situ hybridization protocols have seriously underexposed the quantitative aspects of the autoradiographic procedure and of the measurement of the signals. Although at first glance surprising, one should realize that the autoradiographic procedure did become a settled technique long before RNA in situ hybridization came in sight [see Rogers (1979a) a meticulous overview]. The spatial resolution of emulsion autoradiography is far superior to that of X-ray film apposed to microscopic slides. Paradoxically, the latter method is often preferred for quantitative purposes, while simultaneously accepting its poor resolution (Burbach et al. 1987; Fremeau et al. 1986; Isseroff and Lancet 1985). That density values recorded on X-ray film are considered to be quantitative and those obtained from an autoradiographic emulsion are not appears illogical. This may be based on some tenacious misconceptions regarding the quantitative character of the autoradiographic-microscopic process, the most important being that quantitative results require laborious grain counting and darkfield illumination. In general, both notions are not true at low and intermediate objective magnifications, which are essential in many embryological studies. The darkfield and brightfield methods are almost equally sensitive, as shown in this study, whereas brightfield illumination has a higher resolving power because the light is not scattered. At present, density values can be conveniently measured by computer-aided image acquisition and analysis, as is demonstrated in this study. Data are further corroborated by validation to Northern blot standard.
Materials and Methods
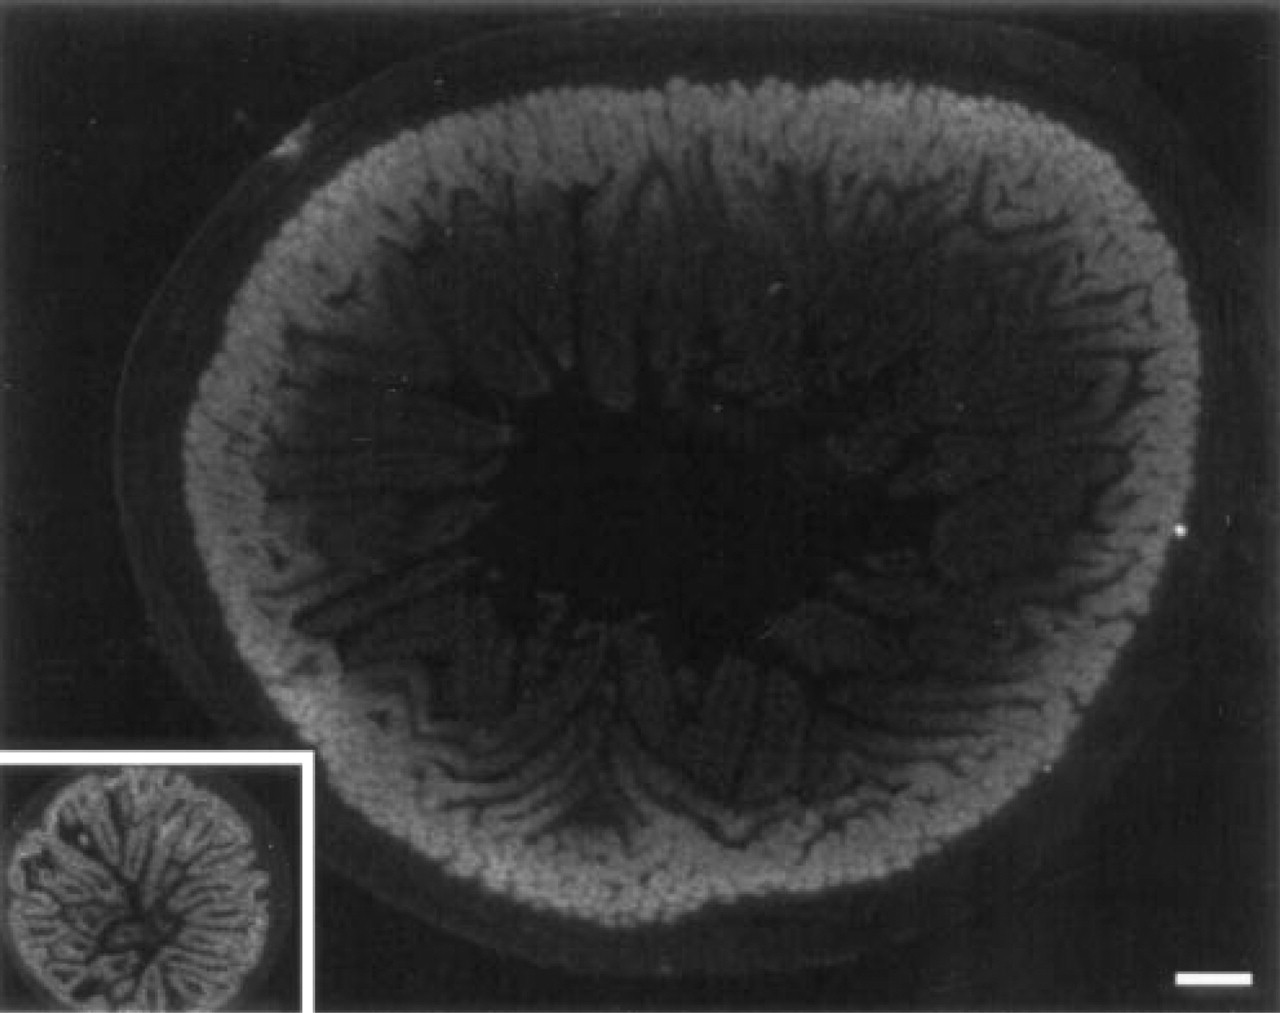
Several reasons underlie the choice of in situ hybridization to carbamoylphosphate synthetase (CPS) MRNA in tissue sections of adult and fetal intestines as a model system (Figure 1). (a) Our primary research interest involves the analysis of gene expression in derivatives of the embryonic foregut (Moorman et al. 1990,1994; Rings et al. 1992). (b) The tissue processing requires no specific protocol, and many similar serial sections can be made easily. (c) Many mRNAs, including CPS, are specifically expressed in the intestinal epithelium, which is particularly well distinguishable from the mesenchymal lining, thereby providing a convenient tissue blank. (d) CPS mRNA, like a number of other mRNAs, is expressed in a concentration gradient along the longitudinal axis of the intestine (Rings et al. 1992; Gaasbeek Janzen et al. 1988). Owing to the intestinal folding, sections contain intestinal loops with various amounts of mRNA (see Figure 1). Changes in the procedure should yield proportionate changes in the hybridization signals in the distinct loops. This allows the reliability of the method to be tested.
Tissues
Intestines and livers were isolated from adult Wistar rats and from fetuses from 20 and 21 embryonic days (ED). Animals were sacrificed by decapitation. To obtain enough RNA for Northern analysis, the organs of the fetuses were pooled per litter, except for one fetus that was used separately for in situ hybridization. The dam was used to obtain adult material. Tissues for RNA analysis were quickly frozen in liquid nitrogen and stored at −70C. Intestines of adult rats were removed from the animal and rinsed with PBS buffer. The colon was then separated from the small intestine and the proximal part of the remaining small intestine (jejunum) was cut into two equal pieces. Fetal intestines were rinsed with PBS and cut into two pieces of equal length. Pieces of ∼1 cm of the proximal ends of each intestinal part were cut off and processed for in situ hybridization. The remainder of the tissue was used for Northern blot analysis.
Northern Blot Analysis
Total RNA was isolated according to Chirgwin et al. (1979). Equal amounts of mRNA were loaded on a 0.8% glyoxal agarose gel and blotted to Hybond N membrane. These blots were hybridized with a 32P-labeled, random-primed CPS cDNA probe (1.9
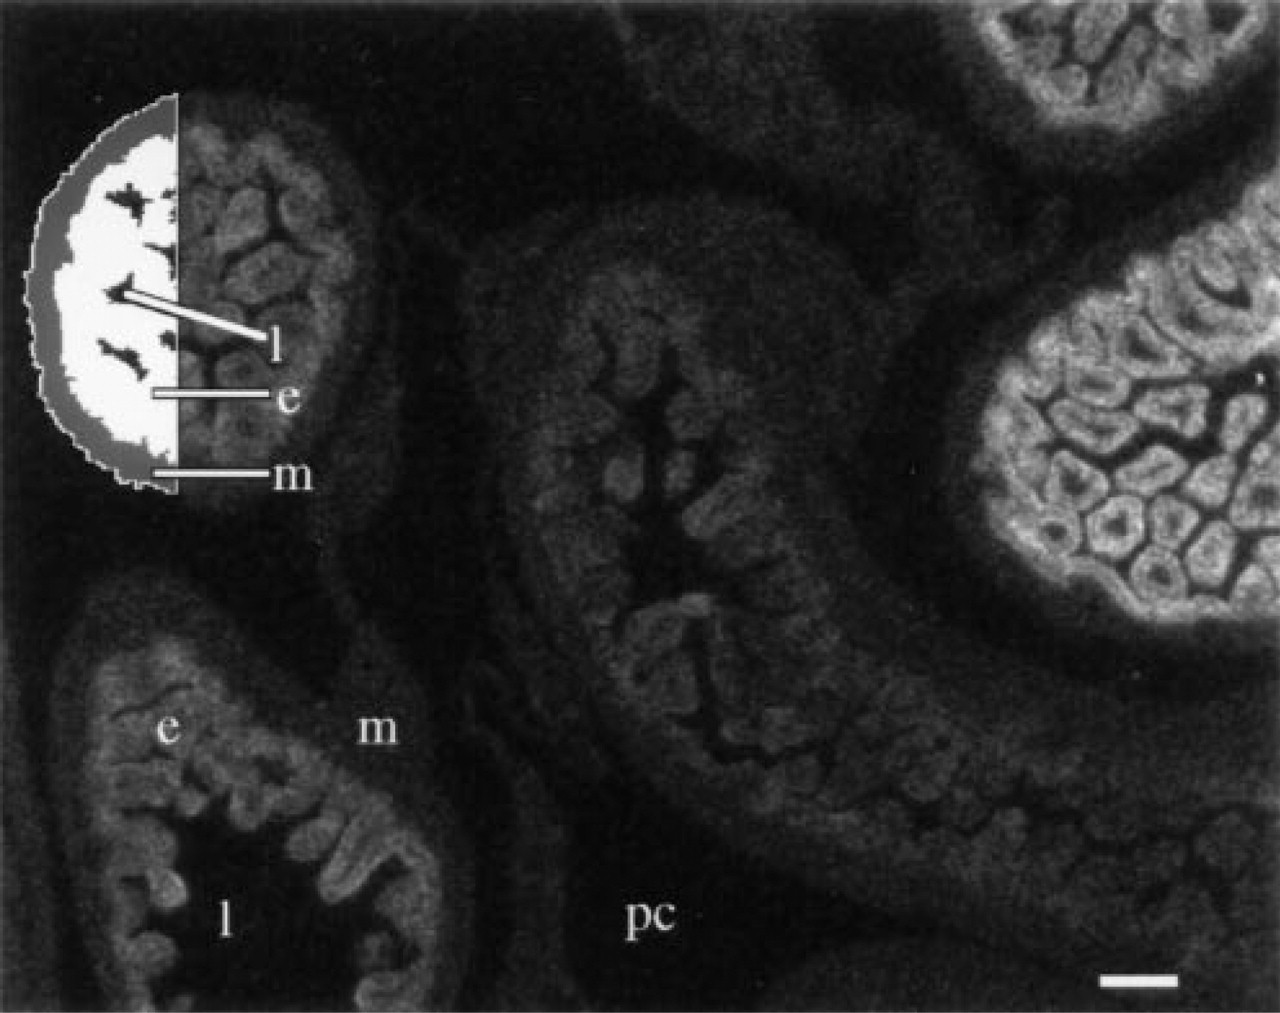
Density image representing an overview of a transverse section in the abdominal area of a 20-day-old rat fetus, hybridized to 5000 cpm/μl of a probe for CPS mRNA, exposed for 3 days, and developed for 4 min. The image was recorded electronically using a X 1.25 objective. Several intestinal loops expressing different amounts of CPS mRNA are shown. In the upper left intestinal loop, the distinct compartments are demarcated using interactively determined density slices in which the measurements were carried out. l, intestinal lumen; e, epithelium; m, mesothelium; pc, peritoneal cavity. Bar = 100 μm.
To compare signals of hybridization of tissue sections to signals obtained by Northern blot analysis, the signal of the whole tissue section was compared with that in the entire Northern blot lane.
In Situ Hybridization
Tissues were fixed overnight in 4% formaldehyde in PBS (pH 7.4), dehydrated in a graded ethanol series, and embedded in paraplast according to standard histological procedures (Moorman et al. 1993). Sections of 7 μm were made and mounted on 3-aminopropyltriethoxysilane-coated microscope slides and stored at room temperature until use. Pretreatment of the sections, hybridization, and washes have been described in detail (Moorman et al. 1993). 35S-labeled transcripts were made by in vitro transcription of linearized pBluescript in which the 564-
Controls of the specificity of hybridization included hybridization to sense CPS probe (negative control) and to albumin cRNA probe (tissue-intrinsic control), which provides both a positive (liver) and a negative (other tissues, including intestinal epithelium) control in the same section. Preincubation with RNAse was used to assess the nonspecific binding of the probes to the section.
Autoradiographic Procedures
The autoradiographic procedure applied is as described previously (Moorman et al. 1993). In short, the microscope slides were dipped into Nuclear Research Emulsion G5 (Ilford; Cheshire, UK), 1.5-fold diluted in a 2.0% glycerol solution at 42C. Slides were dried and exposed at 4C for 3–24 days, as indicated in the figure legends. They were developed in Amidol developer (0.45 g 4-hydroxy-1,3-phenylene-diammoniumdichloride, 1.8 g Na2SO3, 0.08 g KBr per 100 ml bi-distilled water), which is comparable to Kodak D-170 developer, at 18C for times of between 2–32 min, as indicated in the legends. Slide development was stopped in bi-distilled water for 1 min, fixed for 20 min in 30% Na2S2O3 in bi-distilled water, and washed for at least 60 min in running tapwater. Sections were then dehydrated in a graded ethanol series and mounted under a coverglass in Malinol (Schmid; Kongen, Germany).
Because Kodak D-19 (developing agent hydroquinone) is a widely used developer, initial experiments were carried out with this developer also, yielding comparable results (data not shown). We preferred to use an Amidol-based developer, similar to Kodak D-170 developer, because it is reported to yield more reproducible results in quantitative autoradiography than D-19 developer (Dörmer and Brinkmann 1972).
Gelatin Calibration Spots
Known amounts of [35S]-dCTP random-primed labeled cDNA were mixed with 5% high gel-strength gelatin (48724; Fluka, Buchs, Switzerland) in 10 mM Tris, (pH 8.0), at ∼45C, to obtain calibration spots. Two rows of five circles (5-mm diameter) were drawn with a felt pen on the back of 3-aminopropyltriethoxysilane-coated microscope slides. Over each circle on a microscope slide a 3-μl drop of th 35S-containing gelatin calibration solution containing a distinct amount of radioactivity was evenly deposited. The slide was immediately placed on ice to let the gelatin congeal, and the procedure was repeated for the preparation of the next calibration slide. For each concentration, three 3-μl samples were also scintillation-counted to estimate the amount of radioactivity applied on the slides. After application of the drops on the slides, they were dried in an air stream for ∼20 min and further affixed to the microscope slides overnight at 50C. To prevent swelling of the spots later in the procedure, fixation was performed in 4 ml fixative per slide, containing 4% formaldehyde and 1% glutaraldehyde made in PBS (pH 7.4). To assess the loss of radioactivity during the fixation procedure, 1 ml of the fixation solution was counted in the liquid scintillation counter. This loss was found to be 3% on average, for which the values were corrected. The fixed gelatin drops were then dehydrated for 10 min in 96% ethanol and dried in a filtered air stream. The slides were dipped into photographic emulsion and exposed and developed for a range of times as indicated.
Quantification of In Situ Hybridization Signals
In photography, density values are used rather than absorbance values because silver grains do not absorb but just do not transmit the light. Hence, density values are calculated values based on the light that is transmitted through a pixel area, using the formula

in which the Transparency is defined as the ratio between the light transmitted by the film (emulsion) and the light incident on the film (emulsion). The resulting density values are proportionate to the mass of silver developed in the film, according to Hurter and Driffield 1890; and Rogers 1979b) and hence, knowing the specific activity of the probe, the number of molecules of probe bound to a certain area of the section can be calculated. The use of a CCD camera and image analysis has extended the use of density measurements considerably.
Images wee recorded with a Photometrics cooled CCD camera attached to a Zeiss Axiophot microscope, provided with a stabilized power supply. A monochromatic and an infrared block filter were used to rule out spectral response dependencies of the camera. Linearity of the camera was checked (Chieco et al. 1994). Resolution of the image was 1317 × 1035 pixels with 4096 gray levels. The camera pixel size is 6.8 × 6.8 μm, corresponding to 2.7 × 2.7 μm in the object plane at X 2.5 magnification, as checked using a micrometer. Images wee analyzed on a Macintosh II computer, using the public domain program NIH-Image (v1.59) (W. Rasband, National Institutes of Health, Bethesda, MD; electronically available via Internet by anonymous ftp from zippy.nimh.nih.gov). The areas to be measured were marked by a density slice, which identifies these areas on the basis of a selected lower and upper density value. The selected areas were then separated from other highlighted pixels by use of the magic wand tool. The latter device essentially produces a closed contour, comprising the area of interest only and eliminating interior parts, e.g., intestinal lumen. Measurements in the selected areas were repeated by three independent researchers and yielded comparable results. Default, technical background (signal in the peritoneal cavity), was subtracted from the signals. Specific signal due to hybridization (in this model, study signal in the positive intestinal epithelium) was obtained by subtraction of the tissue background (e.g., mesenchymal lining of the intestine) from the signal measured in the epithelium. Counterstaining was not used, to avoid an absorbance signal that could be mistaken for “tissue” background. Because darkfield illumination is widely used in the field of in situ hybridization, the density signals of brightfield recordings are portrayed as white signals and therefore look similar to darkfield pictures. Similar procedures were followed for density measurements of the gelatin calibration spot. The average density of the entire spot was calculated and the density found in the emulsion that did not cover a gelatin spot was used as background signal. A hyperbolic tangent cure was then fitted to the plot of the average density readings of the calibration spots against the radioactivity levels in the spots, using MacCurveFit 1.2.1, shareware by Kevin Raner (krs@iaccess.com.au). Densities measured in tissue sections were converted to counts per minute (cpm) using the known relation between density and cpm/mm2 of the calibration spots.
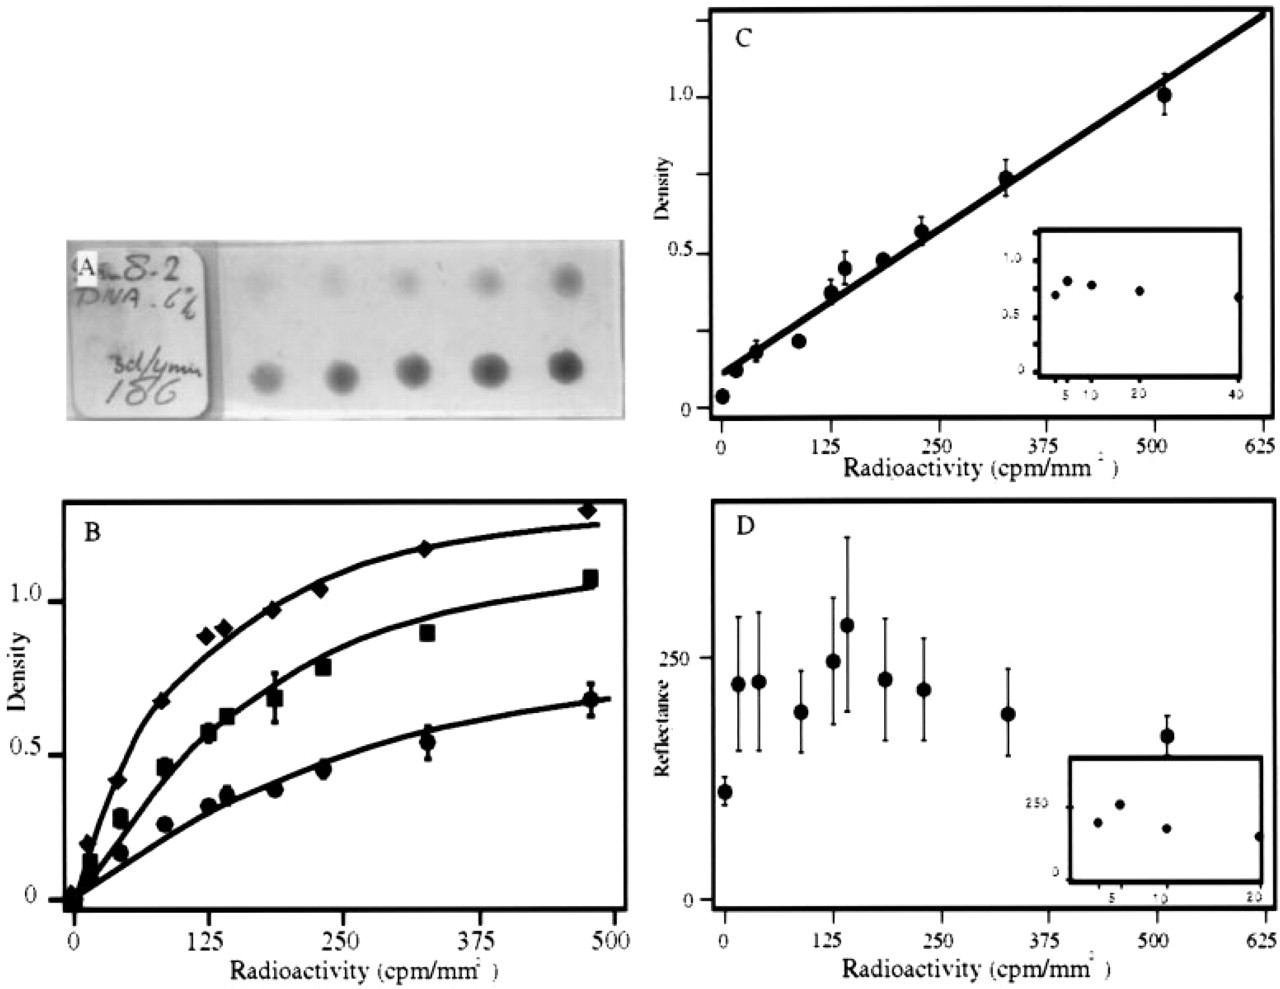
Density measurements in gelatin calibration spots. (
Results
Signal Measurements in Gelatin Calibration Spots
Autoradiography is considered to be quantitative when amounts of radioactivity in a tissue section are proportionate to the density of grains (signal) (Perry 1964). To explore the possibilities of what can be achieved under the conditions normally used in in situ hybridization experiments, calibration microscope slide were prepared onto which gelatin spots were applied containing known amounts of radioactivity (Figure 2 A). The slides were dipped into photographic emulsion and exposed and developed for the times indicated in the legend.
Reliability of the Autoradiographic Procedure
Figure 2 B shows a unique relationship between the level of the signal and the amount of radioactivity present in the spots. Values could be reliably obtained, as is apparent from the minor spreading of the data from independently made and measured calibration slides. The inaccuracies that can be observed can be solely accounted for by errors in pipetting 3 μl of a viscous gelatin solution of 40C, as assessed by liquid scintillation counting of various 3-μl samples.
Magnification
To be meaningful, density measurements should be independent of the magnification of the objective used (Chieco et al. 1994). To verify this issue in our set-up, the gray levels in the different gelatin calibration spots were each measured at magnifications ranging from X 2.5 to X 20. The results are shown in Figure 2 C, in which the error bars represent the standard deviation calculated from the different gray levels measured in a distinct gelatin spot at the various objective magnifications. The minor spreading of the data indicates that magnification does not significantly influence the density within the magnification range used.
Illumination
Reliable measurements of darkfield signals by counting or reflectance measurements require that individual grains are visible (Rogers 1979b). This is not the case at low magnifications. In agreement, at the low (overview) magnifications that are often preferred in in situ hybridization studies, we were also unable to perform reliable reflectance measurements (Figure 2 D), whereas density measurements could be reliably performed (Figure 2 B and 2C). An additional disadvantage of darkfield illumination is the intrinsic lower resolution caused by scattering of the light (see Figure 7 and corresponding text).
Autoradiography of Tissue Sections
In Situ Hybridization. The in situ hybridization procedure used is in essence a standard widely applied and approved protocol. It is fundamental to reliable measurements that the extent of hybridization be dependent of the amount of probe (Cox et al. 1984) and that the signal be proportionate to the specific activity of the probe. Figure 3 shows that both requirements are met, within certain limits. Signal increases up to about 10 pg probe per μl hybridization mix, after which plateau levels are being reached, and increases with increasing specific activity of the probe. Standard 20,000 cpm/μl (about 15 pg/μl) is used, as higher concentrations result in higher background signal.
Time of Exposure and Development. Figure 4 shows the relationship between specific signal due to hybridization to 35S-labeled CPS probe and time of development of the emulsion after 3, 12, and 24 days of exposure. It is apparent from this experiment that the signals can be increased approximately fourfold, going from the normally used developing time (2–4 min) to a developing time of 16–32 min. The high correlation coefficients of more than 0.98 are more relevant and indicate that all steps before the measurement are reproducibly performed. Each data point in Figure 4 is derived from separate sections, individually hybridized and independently processed for autoradiography.
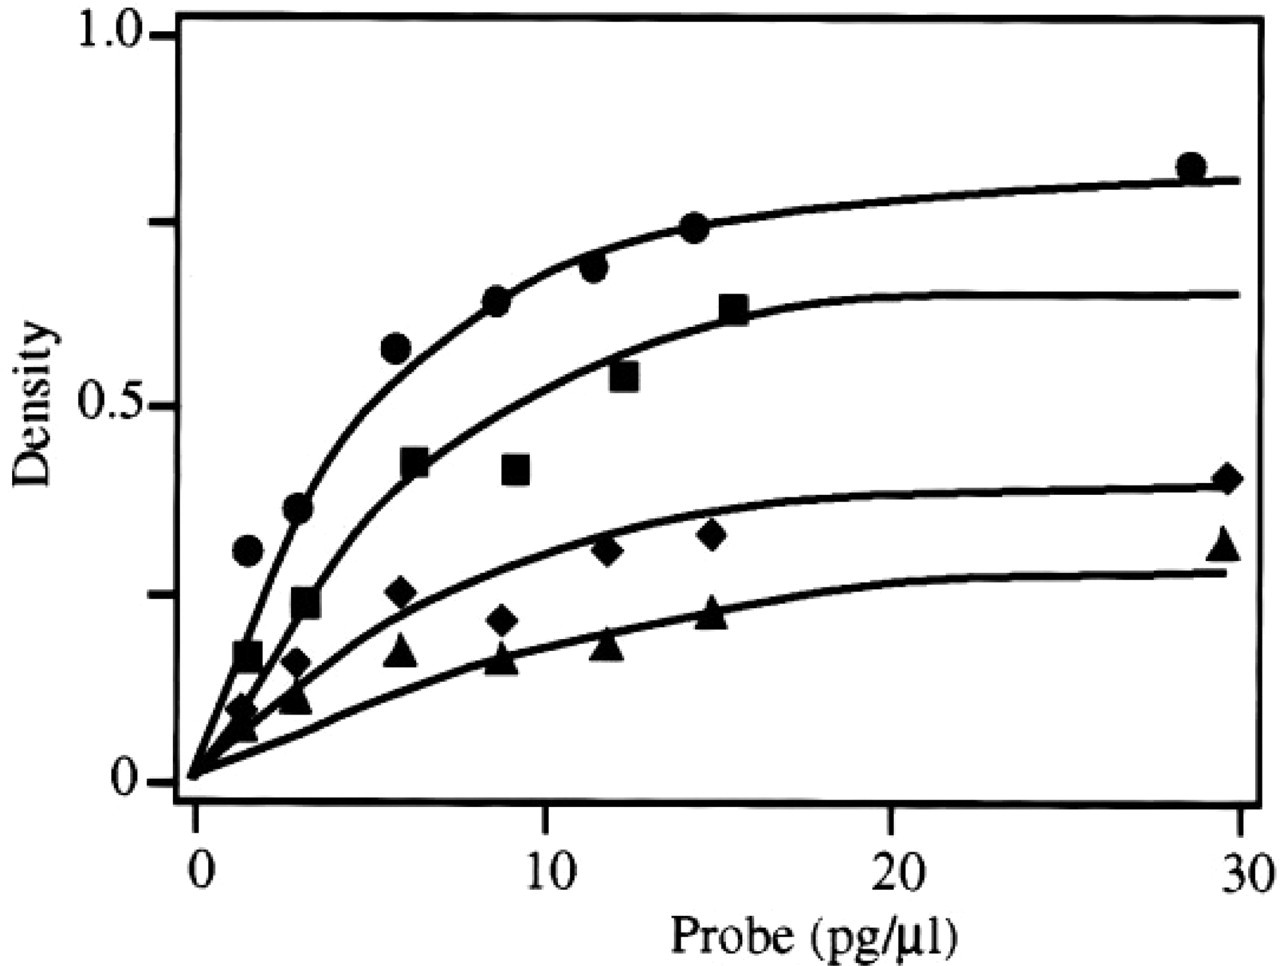
Relationship between probe concentration and density due to specific hybridization to CPS mRNA in tissue sections. Densities given have been corrected for nonspecific hybridization in the mesenchymal lining of the gut. The specific activity of the probe was 1500 cpm/pg (•), 750 cpm/pg (▪), 375 cpm/pg (♦), and 187 cpm/pg (◂).
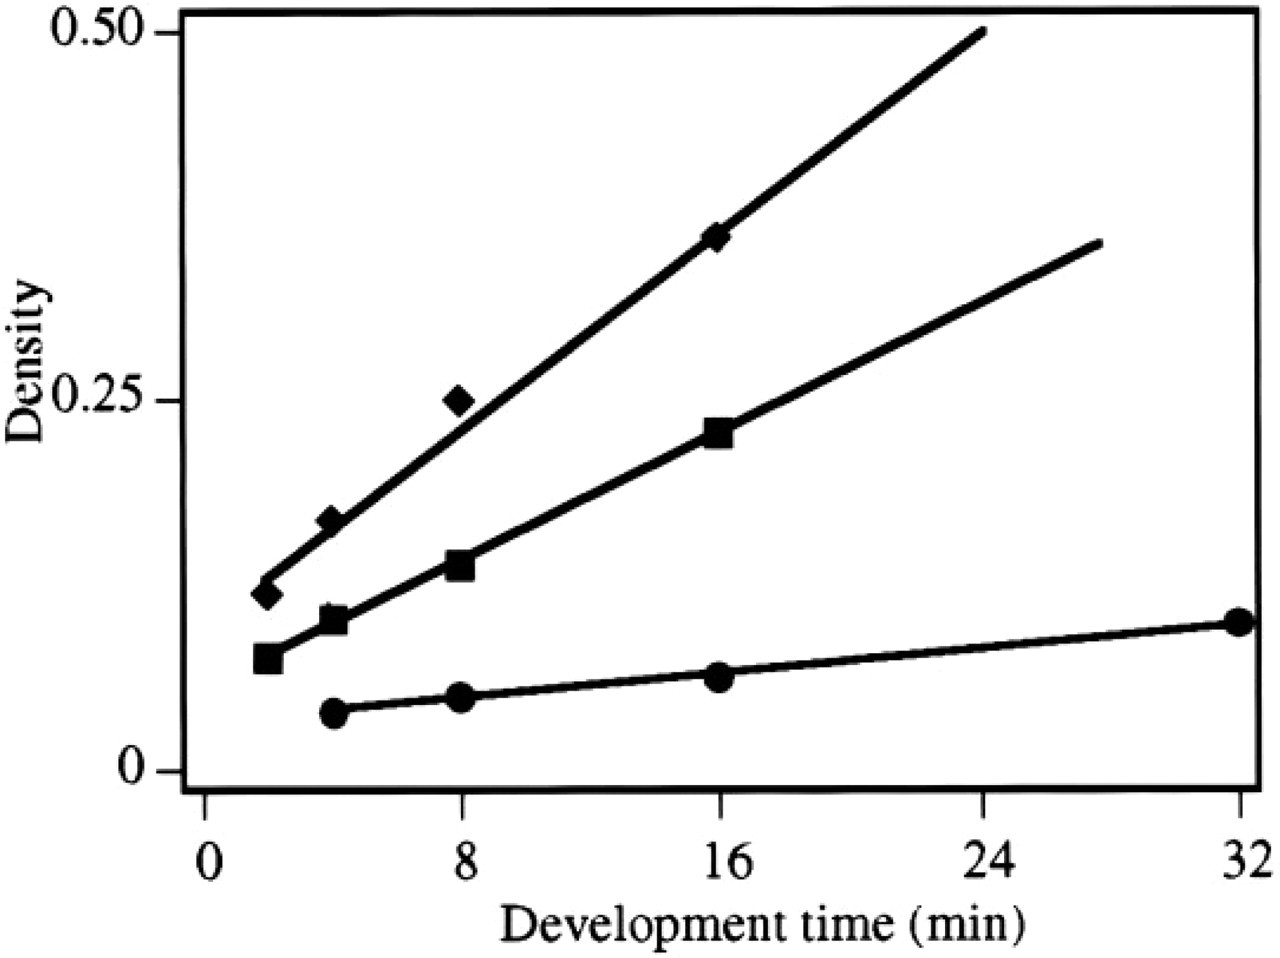
Quantitative analysis of the density due to specific hybridization as a function of the time of development of the photographic emulsion. Sections were allowed to hybridize to 1000 cpm/μl 35S-labeled probe for CPS mRNA and were exposed for 3 (•), 12 (▪), or 24 (♦) days. An almost linear relationship between density values and development time can be observed (r 2 <0.98).
Proportionate Signal Amplification. For quantitative in situ measurements of mRNA levels, it is fundamental to assess whether the signals from two areas in which a particular mRNA is present at a distinctly different concentration would be proportionally amplified on prolonged developing and/or exposure times. An example is shown in Figure 5, which shows two closely adjacent sections, each displaying two intestinal loops, of which one has a low and the other an abundant expression of CPS mRNA. They are developed for 4 (Figure 5 A) and 16 min (Figure 5 B), respectively. In the low CPS mRNA-expressing intestinal loop, CPS mRNA can hardly be detected in the section developed for 4 min, whereas expression can be unmistakably demonstrated in the section developed for 16 min. The signals in both loops are proportionally amplified upon prolonged development (Figure 5 C).
Signal Amplification and Resolving Power. Longer developing times may negatively influence the resolution of the images owing to the development of larger silver grains.
We have tried to objectify the quality of the images by calculation of the signal-to-noise ratios. To assess the resolving power, we took advantage of the fact that the intestinal epithelial cells are polarized and that the intracellular accumulation of CPS mRNA is also polarized. CPS mRNA co-localizes with the mitochondria apical and basal to the nuclei. This localization appears as a double line over the intestinal villus (Figure 6) (Rings et al. 1992). One should realize that the intracellular location of an mRNA is at the limit of the resolution of the technique using 35S-labeled probes. In this particular example it is possible only to a very limited degree because of the polarization and the large size of the cells. If one measures the density across a villus, as shown in Figure 6, four density peaks (Figure 6, insets) should appear. The product of time of exposure and time of development was kept constant. In all conditions the four peaks could be detected, indicating that a reasonable resolving power had still been achieved. It should be recognized that the quality of the images is better at longer exposures because of the smaller size of the silver grains (cf. Figure 6 A vs 6B).
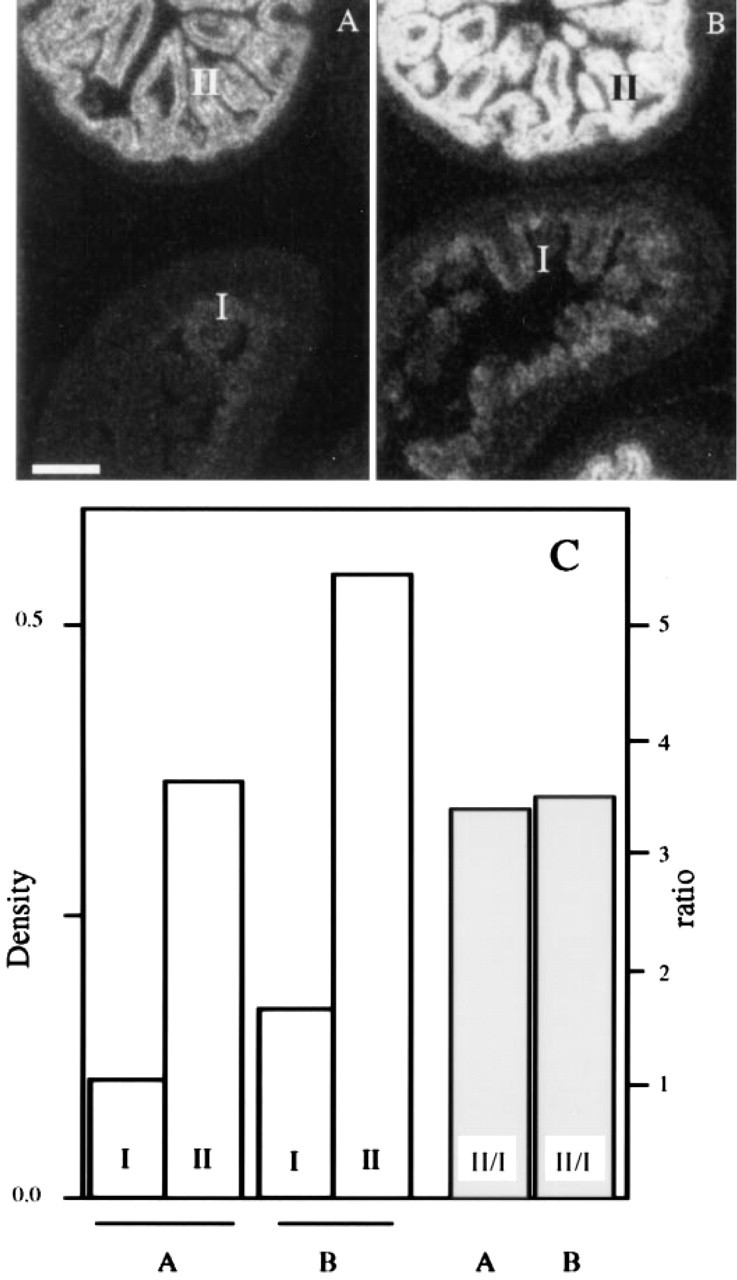
Amplification of the hybridization signal in low and high CPS-expressing intestinal loops by prolonged development times. Two closely adjacent sections were allowed to hybridise to CPS probe (5000 cpm/μl), exposed for 3 days, and developed for 4 min (
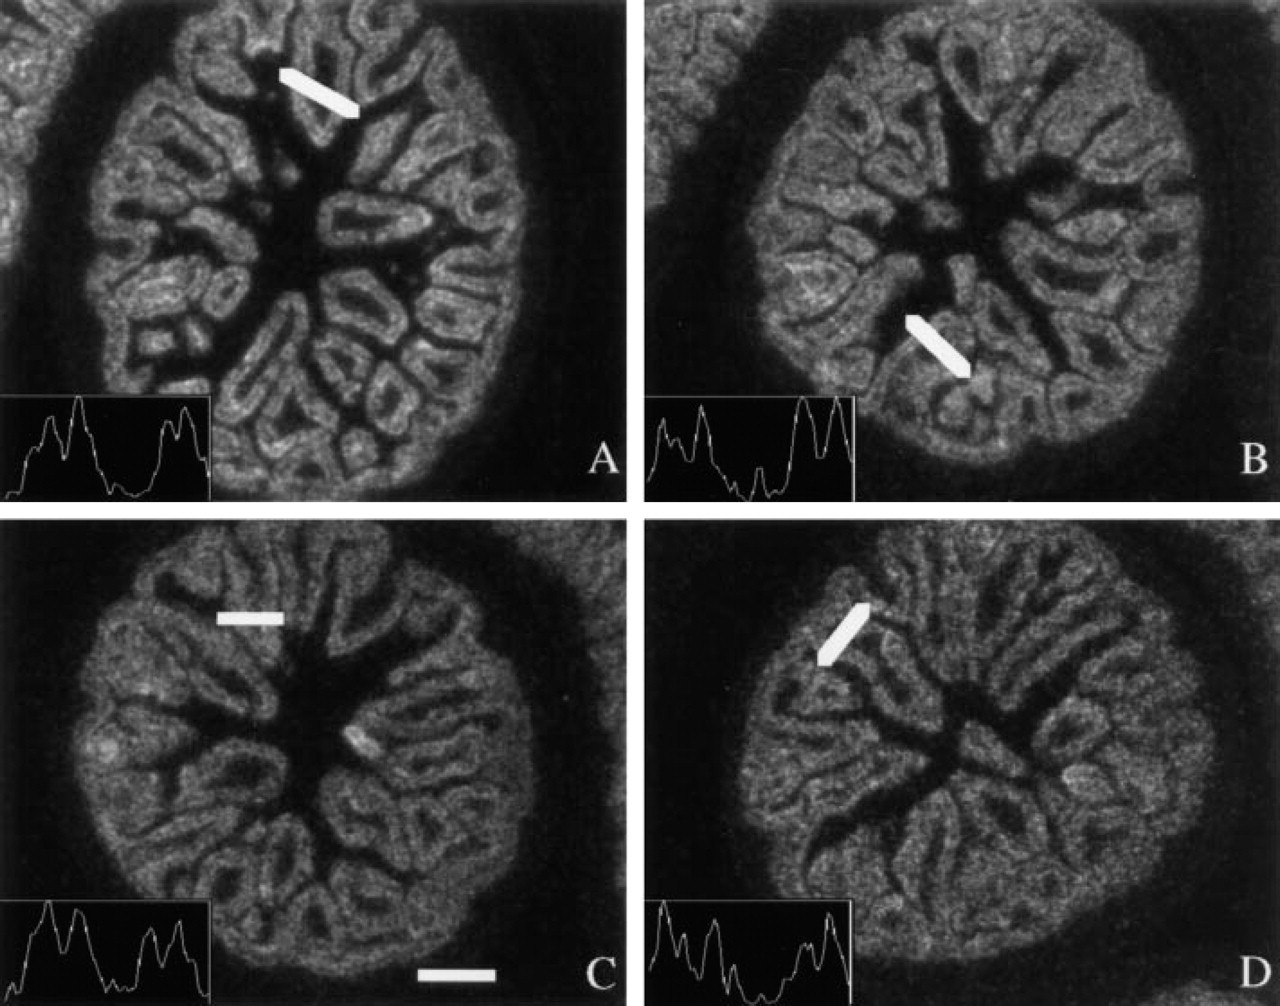
Evaluation of unmodified digital images obtained at prolonged development times. Images were electronically recorded using a X 10 objective. Four closely adjacent sections were allowed to hybridize to CPS probe (1000 cpm/μl) and processed as follows: (
Illumination and Resolving Power. The polarized localization of CPS mRNA facilitates the appreciation of the quality of the images obtained by brightfield and darkfield illumination. By image analysis, both types of images can be portrayed similarly, allowing easy comparison of both images. Figure 7 shows such a comparison of intestinal sections hybridized to decreasing amounts of radioactivity (50,000–500 cpm/μl). Both illumination method yield comparable signal-to-noise ratios, with the important difference that the dynamic range of density measurements is greater.
Validation to Northern Blot Standards
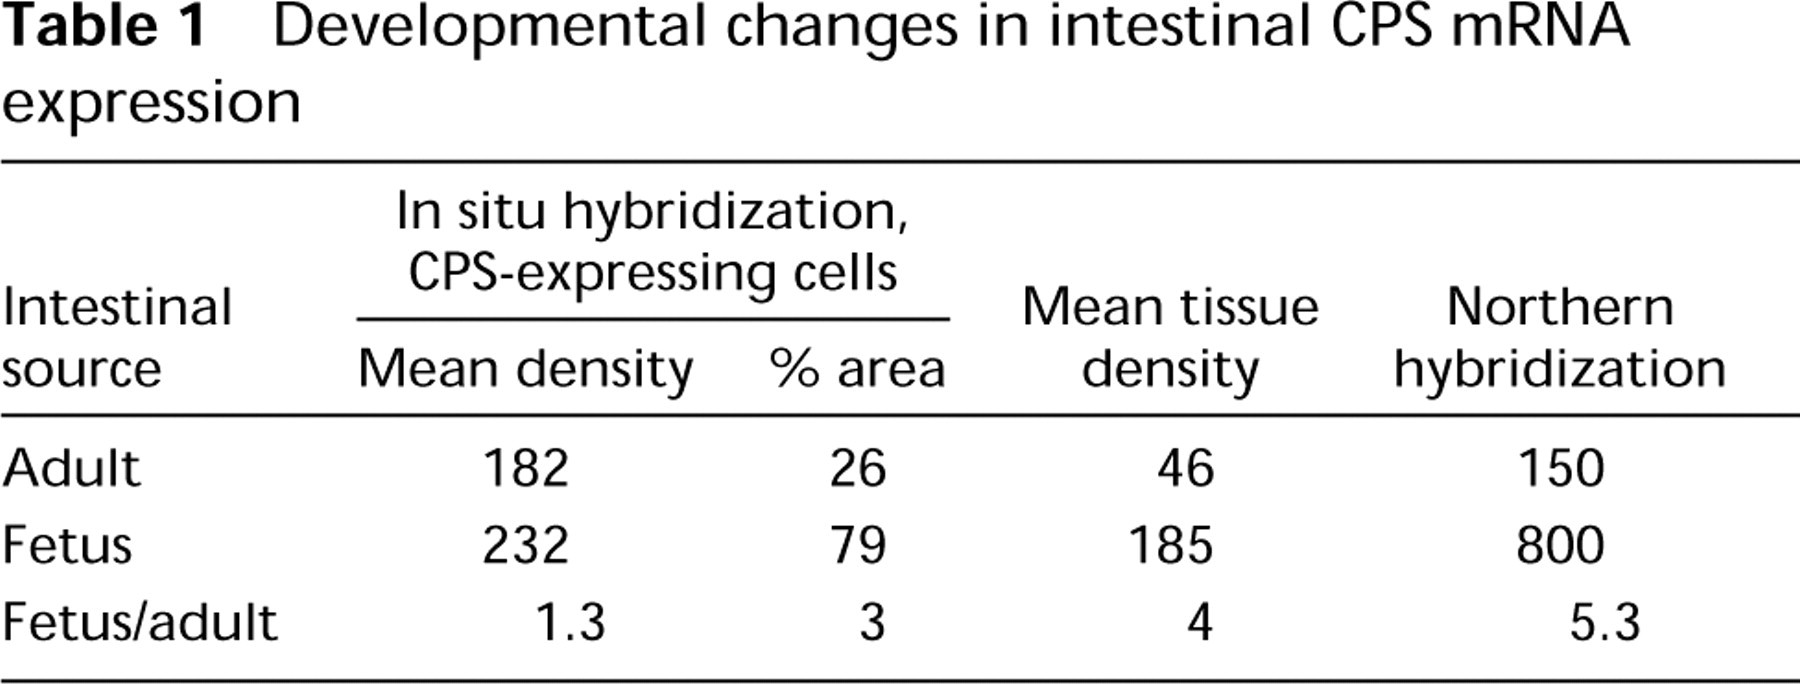
The data presented thus strongly suggest that relative mRNA levels can be measured accurately and relatively simply in tissue sections. Because in situ quantification of mRNA by emulsion autoradiography is generally perceived as a complicated issue, the in situ measurements have been validated to the generally accepted standard of Northern blot analysis. If the in situ measurements are reliable, a linear relationship can be expected between the corresponding data sets obtained from both independent techniques. To this end, tissue samples displaying different levels of CPS mRNA expression were collected. A small part of each sample was processed for in situ analysis and the larger part of the same sample was processed for Northern analysis. The results are summarized in Figure 8. Using the least-squares error method, a straight line was fitted through the data points that displayed a correlation coefficient r 2 of 0.83, again underscoring the reliability of the in situ mRNA measurements. The Northern data are, of necessity, expressed per total intestinal RNA rather than per intestinal epithelial RNA. Hence, it was essential to compare the Northern data with in situ signals expressed per total intestinal area to compose Figure 8. Importantly, the in situ measurements enable one to express the signals per CPS-expressing epithelium. It will immediately be clear from Figure 9 that this figure is not significantly different in fetal and adult intestine. However, area measurements of CPS mRNA-positive and -negative tissue of fetal and adult intestinal sections show that the contribution of the CPS mRNA-expressing epithelium decreases about threefold during development (Table 1). From these data, it can be concluded that CPS mRNA accumulation in the CPS mRNA-expressing cells remains relatively constant during development, which is certainly interesting from a regulatory point of view and which would not have been anticipated on the basis of Northern blot analyses alone.
Discussion
Quantification of changes in mRNA levels is fundamental to the understanding of the mechanisms underlying regulation of gene expression in developing, adult, experimental, or pathological tissue. We now report that (changes in) mRNA levels can be simply and reliably measured in tissue sections, using a routine radioactive in situ hybridization protocol and a freely available image analysis program. The procedure is, in fact, not more laborious than the quantification of Northern blots using a Phospho Imager. Because in situ hybridization is a histological technique, it is possible to precisely distinguish the cells that contribute to the production of a distinct message. In this way we now show that the CPS mRNA-expressing intestinal epithelial cells accumulate this mRNA to comparable levels in fetal and adult tissue, the fetal intestine displaying the highest CPS mRNA levels. In particular, the data show that in the embryo all enterocytes still contain the mRNA but that CPS expression is delimited to the relative young enterocytes in and near the crypts in the adult (see Table 1). The ensuing threefold reduction in the relative contribution of CPS-expressing cells to total intestinal tissue leads to an apparent strong decrease of this mRNA during development, as determined by Northern blot analyses. We have chosen this example because it perfectly demonstrates the added value of the quantitative in situ detection of mRNA above mRNA measurements in tissue homogenates.
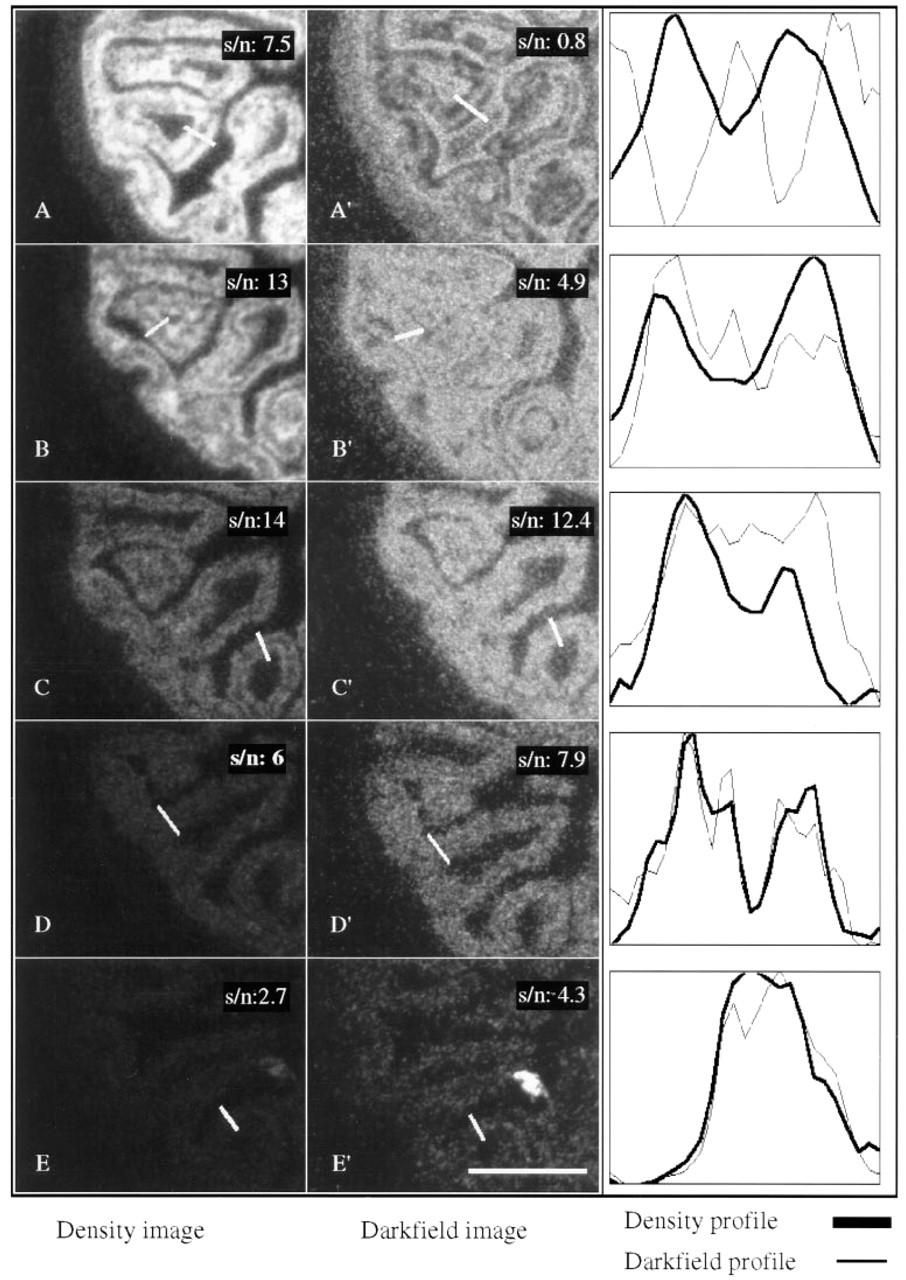
Comparison of brightfield (density measurements) and darkfield (reflectance measurements) illumination with respect to resolving power and signal-to-noise ratios. Serial fetal intestinal sections were allowed to hybridize to 50,000 (
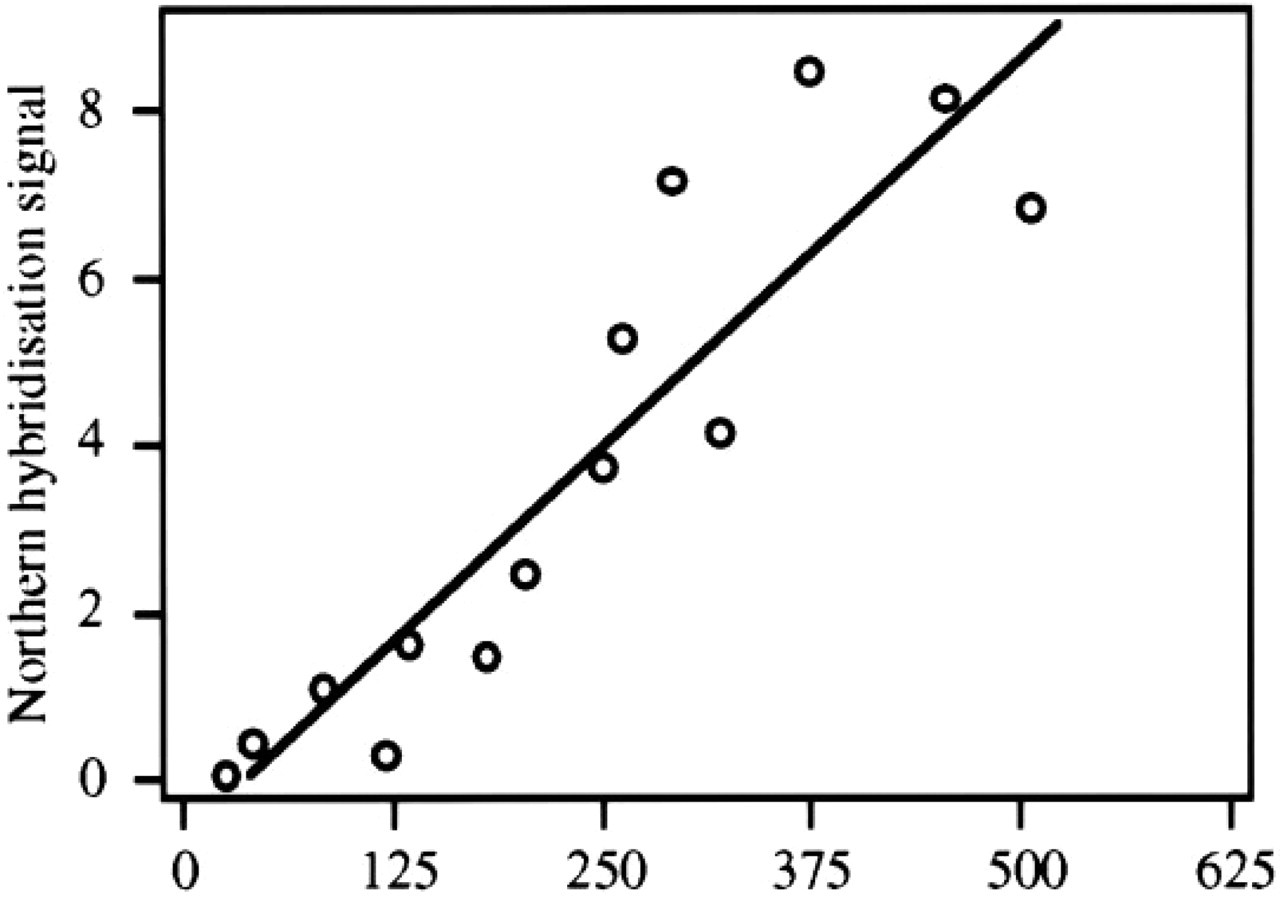
Relationship between relative mRNA concentrations as assessed by Northern and in situ hybridization analysis. Adult and fetal samples comprising liver, proximal and distal small intestine, and colon were analyzed with both techniques as indicated in Materials and Methods. A regression line was fitted using least-squares error fitting, resulting in a correlation coefficient r 2 = 0.83.
Reliability of the Quantitative In Situ Hybridization and Autoradiography
Quantitative in situ hybridization is not as well accepted as quantitative Northern blot hybridization. Various reasons underlie this bias. It is often implicitly assumed that the application of photographic emulsion to tissue sections would be highly variable and hence would prevent quantitative analyses. X-ray film is even used to quantitate in situ hybridization signals (Wright et al. 1995; Burbach et al. 1987; Fremeau et al. 1986; Isseroff and Lancet 1985), rather than using photographic emulsion. Our data clearly demonstrate that this concern is unjustified and that photographic emulsion can be reliably applied (see Figure 2). Even more important, these data indicate that variations in signal due to the autoradiographic process (e.g., variations in emulsion thickness, temperature, time of development) are negligible, at least at this level of analysis. Taken together, these results show that the autoradiographic procedure as applied can be designated as quantitative, because density of grains was proportionate to the amount of radioactivity present in the section (Perry 1964). Our routine protocol (Moorman et al. 1993) is in essence that described by Rogers (1979c), and no special requirements are necessary.
CPS mRNA expression in adult and fetal (inset) jejunum. The inset has the same magnification. Conditions for hybridization and autoradiography were similar for both sections. CPS mRNA is expressed in the entire fetal intestinal epithelium, whereas it is confined to the epithelium in and near the crypts in the adult. Bar = 100 μm.
Developmental changes in intestinal CPS mRNA expression
A potential pitfall of absorbance measurements is the so-called “distributional error” (Ornstein 1952). Although the calculation of absorbance and density is similar, this pitfall fortunately does not apply to density measurements. Absorbance is based on the transmission in the field of view of a single detector element (in this case a pixel). Inhomogeneous distribution of absorbing product within that field leads to different transmission values within the field. Absorbance is then incorrectly calculated as the logarithm of the weighted average of these different transmissions, whereas it should be the weighted sum of different absorbance values i.e., the sum of the logarithm of their individual transmission values weighted for their relative areas. These individual absorbances cannot be measured within the field of view of a single detector element (pixel). In the case of density measurements, transmission is 100% (= absorbance or density 0) when no silver grains are present. In that special situation, the average absorbance is proportionate to the area in the field of view of the detector covered by the silver grains.
Another point of widespread concern is related to the supposed complexity of the entire protocol, including fixation, section thickness, and all the different steps of the hybridization proper, that would unavoidably lead to unreliable estimations of mRNA levels. In fact, the entire procedure turns out to be amazingly stable, as unambiguously demonstrated by the high correlation coefficients obtained in the experiments that demonstrate the linear relationship between signal and exposure time or between signal and time of development of the photographic emulsion (see Figure 4). This conclusion does not imply that no loss of RNA would occur, or that all the RNA in a section would be accessible to probe. It simply means that the procedure is reproducible. Similar conclusions have been drawn previously when the separate steps were evaluated (e.g., Guiot and Rahier 1995; Wilkinson 1992; Jilbert et al. 1986; Singer et al. 1986).
In view of the general skepticism about the possibility of reliably quantifying in situ hybridization signals, we have compared the in situ signals to mRNA measurements based on Northern blots. Such a validation was not performed in other studies, and the result again supports the reliability of the in situ measurements.
Reliability of the Measurements
Three types of measurements can be envisioned to assess autoradiographic signals: (a) grain counting, usually with darkfield illumination; (b) reflectance measurements using darkfield illumination; and (c) density measurements using brightfield illumination. Both grain counting and reflectance measurements require high objective magnification (Rogers 1979b), which is not particularly suitable for most in situ hybridization studies in the developing embryo. Such studies require low overview or intermediate magnifications and, hence, density measurements are indicated.
Density measurements, in turn, require brightfield illumination, which is usually not preferred in in situ hybridization studies because darkfield illumination yields signal as bright specks against a black background. We have shown that there is no reason for this preference. Darkfield illumination has a lower resolving power because the image is the result of reflected and scattered light from the silver grains. This explains why we met difficulties in correctly visualizing the polarized expression of CPS mRNA in the intestinal epithelium, whereas this could easily be seen at brightfield illumination. The sensitivity by which signals can be detected is not significantly different for both illumination methods, provided that similar times of exposure and/or times of development of the photographic emulsion are used. Prolonged exposure and/or development times do, however, improve the density signal to a greater extent than the darkfield signal (see below).
Amplification of the Signals
With prolonged development times of the photographic emulsion, an almost linear increase of specific signal above background was observed. It obviously is an enormous advantage when exposure times can be reduced by four- or fivefold, particularly for molecular biologists who prefer to work on tighter time schedules than do histologists. Despite this undeniable advantage, development times have always been considered to be an invariable parameter that is solely dependent on the type of developer and the photographic emulsion used. This conclusion may go back to the early 1960s, when autoradiogrpahy became a well-established technique. In a much-cited publication (Caro et al. 1962), it was shown that the autoradiographic signal measured with darkfield illumination no longer increased after 1 min of development time and that after 10 min of development the background had increased to signal levels. This may have led later to the implicit but erroneous conclusion that prolonged developing times were of no use. The crucial difference with our examinations is that 30 years ago individual grains were counted rather than densities being measured. Density measurements comprise the total area of grains, i.e., both the number of size of the grains. Hurter and Driffield (1890) have demonstrated that this figure is proportional to the mass of developed silver per unit area. Longer development of the photographic emulsion will yield larger-sized silver grains and hence will increase the (density) signal. Nowadays, density values can be conveniently obtained using computer-based image analysis systems.
General Applicability
In the current study we have shown this technique to work for two different tissues, liver and intestine, and for two different stages, adult and embryonic rat. Preliminary results of 13 further independent experiments using probes against atrial natriuretic factor (ANF) and β-myosin heavy chain (β-MHC) in fetal rat heart tissue, with lung and thymus tissue as tissue blank, indicate that this quantification can also be done for other probes. The ratio between expression in heart and expression in lung of the same animal remained about constant for ANF (5.3 ± 2; n = 7) and β-MHC (7.7 ± 4.1; n = 6). Linear curves were fitted with r2 values better than 0.93.
These results imply an applicability of the principle of the method much wider than the probe and tissues extensively tested in the present study.