
Abstract
We report five novel monoclonal antibodies (Ki-S1, Ki-S4, Ki-S6, Ki-S7, and Ki-S8) reactive with a proliferation-related nuclear antigen. In immunoprecipitation and Western blot experiments using crude nuclear extracts, they recognized a protein of 170 kD that, after proteolytic digestion of the immunoprecipitate and sequencing of the resulting peptides, was identified as the α-isoform of human topoisomerase II. This was confirmed by testing the antibodies on a highly purified enzyme preparation. Crossreactivity with topoisomerase IIβ was ruled out by testing the antibodies on crude extracts from yeast cells expressing the β-isoform exclusively. The antibodies bind the antigen with different affinities and at different epitopes, apparently located within the carboxyl third of the enzyme. All five antibodies are suitable for archival material after adequate antigen retrieval, thereby enabling retrospective studies. This report illustrates the tissue and subcellular distribution of the antigen through the cell cycle by immunohistochemistry and confocal fluorescence microscopy. The antibodies will be useful tools in further analysis of morphological and functional aspects of topoisomerase II and may serve diagnostic purposes, as well as providing prognostic information in tumor pathology.
Keywords
D
Topoisomerases are highly conserved nuclear enzymes that control and modify the topological states of DNA (reviewed in Drolet et al. 1994; Nitiss 1994). Because of their vital functions in cell physiology, they have become targets of a vast number of anti-tumor drugs (for recent reviews see Chen and Liu 1994; Wang 1994). Two major classes of topoisomerases exist in all eukaryotic cells. Whereas Type I topoisomerases are mainly involved in transcription, Type II topoisomerases play an important role in DNA replication and mitotic events. For the latter, two isoforms encoded by different genes were identified (Jenkins et al. 1992; Tan et al. 1992; Chung et al. 1989; Drake et al. 1987, 1989). They not only differ in their biophysical and biochemical properties (Drake et al. 1989) but are also differentially regulated during the cell cycle (Capranico et al. 1992; Woessner et al. 1991) (also reviewed by Hwang and Hwong 1994). The 180-kD β-isozyme is mainly localized in the nucleolus, and it has been suggested that it may represent a structural element for the spatial organization and the transcriptional regulation of ribosomal genes (Zini et al. 1992). Its expression level appears to be constitutional and cell cycle-independent (Negri et al. 1993). By contrast, the 170-kD isoform, topoisomerase IIα, exhibits strong fluctuations in its activity and the amount of enzyme as detected by polyclonal antibodies (Woessner et al. 1991), with a marked increase during the logarithmic phase of growth. In other words, the function of topoisomerase IIα is tightly linked to cell proliferation (Woessner et al. 1991), and it has been postulated that this isoform is expressed exclusively in cycling cells (Watanabe et al. 1994; Tsutsui et al. 1993; Woessner et al. 1991). Mutations of the gene encoding for this isozyme may influence the proliferative behavior, differentiation, or drug sensitivity in tumor cell lines (Ishida et al. 1994; Danks et al. 1993; Bugg et al. 1991; Gieseler et al. 1990, 1991). In this way, topoisomerase IIα emerges not only as a marker for cell proliferation (Heck and Earnshaw 1986) but also as a possible indicator of chemosensitivity and prognosis in neoplastic diseases.
Materials and Methods
Cell Preparations and Cultures
All cells were grown in liquid culture under standard conditions at 37C in a humidified atmosphere containing 5% CO2. Peripheral blood lymphocytes (PBLs) were isolated as described before and stimulated with phytohemagglutinin A (PHA) for 12, 24, 36, 48, 72 hr (Dougherty and Hogg 1987). L428 (Diehl et al. 1981) and HL-60 cells (American Tissue Culture Collection, no. CCL240; Rockville, MD) were maintained in RPMI 1640 medium buffered with 25 mM HEPES and supplemented with 10% fetal calf serum (FCS), 100 U/ml penicillin, and 0.1 mg/ml streptomycin. MCF7 cells (American Tissue Culture Collection no. HTB22) were grown in Eagle's minimum essential medium (MEM) enriched with non-essential amino acids and supplemented with 1 mM sodium pyruvate, 10 μg/ml bovine insulin (95% purity), and 10% (v/v) FCS. All cells were subcultured in fresh medium two times per week.
Generation of Monoclonal Antibodies
L428 cells were lysed in hypotonic KCl solution and disrupted by pottering. The nuclei were washed and harvested by centrifugation. Subsequently, with incomplete Freund's adjuvant added, they were used for immunization of female Balb/c mice by three
Antibody Purification
Separation of the MAbs from cell culture supernatants was carried out in a single step using protein G-Sepharose 4 Fast Flow (Pharmacia LKB; Freiburg, Germany).
A 1 M Tris buffer titrated with HCl to pH 8.0 was used as a starting buffer. Antibody containing supernatant was incubated overnight with protein G-Sepharose at 4C, sedimented, washed with 10 mM Tris buffer, pH 8, and redis-solved in this buffer before application to a column. Bound proteins were eluted using 0.2 M glycine-HCl at pH 3. The purified antibodies were adjusted immediately to pH 8 by titration with 10% starting buffer.
Isotyping
Supernatants of all six antibody-producing clones were tested in an enzyme-linked immunoadsorbent assay (ELISA) with isotype-specific goat anti-mouse antibodies (Sigma; München, Germany).
Immunocytochemistry and Immunohistochemistry
PBLs were harvested and processed as described below, immediately or on Day 1, 2, or 3 after PHA stimulation. Cytospin preparations were fixed in acetone at room temperature (RT) for 10 min and incubated with the primary antibodies (Ki-S1, Ki-S4, Ki-S6, Ki-S7, and Ki-S8, as well as affinity-purified polyclonal anti-topoisomerase IIα rabbit antibody) for 30 min. The immunoreaction was enhanced by the APAAP method and the slides were briefly counterstained with Mayer's hematoxylin. Freshly isolated peripheral blood monocytes (Kreipe et al. 1988) (Mϕ) served as negative controls. Frozen sections of an exhaustive spectrum of normal human tissues were immunohistochemically examined with all six MAbs to survey their distribution patterns and possible crossreactivities. Their tissue reaction sites were detected as described elsewhere (Stein et al. 1985; Cordell et al. 1984). Immunostaining was further performed on archival material, which required antigen retrieval as described by Shi et al. (1991). Briefly, 3-5-μm-thick sections from paraffin-embedded tissues were mounted on APES-coated slides and dried overnight at RT. Subsequently, they were dewaxed in xylene and rehydrated in graded ethanol. After rinsing with PBS, they were immersed in 0.01 M citric acid titrated to pH 6.0 with 0.1 M NaOH and heated twice for 10 min in a microwave oven (Toshiba) at the highest power setting (750 W). Visualization of the immunoreaction and counterstaining were performed as described above.
Immunoprecipitation
A total of 107 L428 cells were labeled with [35S]-methionine overnight; all further steps were carried at 4C. After intensive rinses with ice-cold PBS, the cells were lysed for 5 min with 2% Triton X-100, 1 mM EDTA, 1 μM PMSF, in PBS at pH 7.4. Nuclei were separated by centrifugation through 50% sucrose. The nuclei were then disintegrated by resuspension in extraction buffer and dropwise addition of 5 M NaCl to a final concentration of 0.35 M. After lysis for 30 min at 4C, nuclear membranes and DNA were sedimented (15,000 x g for 10 min) and discarded. The supernatant was used for immunoprecipitation with the MAbs Ki-S1, Ki-S4, and Ki-S8 coupled to rabbit anti-mouse IgG-conjugated protein A-Sepharose (Biochrom; Berlin, Germany). After brief sedimentation, the precipitate was washed with low salt (4% Triton X-100 in PBS) and with high salt buffer (PBS/4% Triton X-100/500 mM NaCl) in alternate steps. Finally, the pellet was dissolved in 50 μl low salt buffer admixed with 50 μl loading buffer (Laemmli 1970) and heated to 95C under reducing conditions for 5 min. The immunoprecipitate was further analyzed by SDS-PAGE, 7.5-15% and autoradiography of the gels. A molecular weight standard (Sigma) served as reference.
Antibodies and Western Blot Experiments
In addition to the MAbs described above, we used a rabbit polyclonal antiserum against topoisomerase IIα purchased from ICI (Cambridge, UK), and a polyclonal antibody from BioTrend (Köln, Germany) raised against the C-terminal peptide EEDDVDFAMFN of the β-enzyme (Boege et al. 1995) as well as antibody A10, kindly provided by S. Kaufmann and L. Liu, John Hopkins University, Baltimore (Kaufmann et al. 1991). Western blotting was performed with all five antibodies. In these experiments, nuclear lysates of L428 or HL-60 cells and lysates of yeast cells (Biersack et al. 1996) were separated by SDS-PAGE (mainly 7.5% gels) and transferred to nitrocellulose or PVDF membranes (Millipore; Eschborn, Germany) by semi-dry blotting (50 min). The membranes were blocked with 5% low-fat milk/PBS and incubated with the MAbs (affinity-purified as described above) as well as rabbit polyclonal anti-topoisomerase II antibodies for 2 hr. The immunoreaction was enhanced after incubation with biotinylated streptavidin-alkaline phosphatase complex-conjugated rabbit anti-mouse or goat anti-rabbit IgG (Boehringer; Mannheim, Germany). Alternatively, the reaction was enhanced by chemoluminescence (Amersham; Poole, UK) according to the supplier's instructions. The experiment was repeated using the HeLa 170-kD form of homogeneously purified topoisomerase IIα (Topo-GEN; Columbus, OH) as an antigen. The purity of the preparation (>90%) was verified by India Ink staining (Sasse and Gallagher 1996). Reference was the molecular weight standard mentioned above.
Expression of Human Topoisomerase II in Yeast Cells
Strains, plasmids and the experimental procedure were as previously described (Biersack et al. 1996). In brief, the Saccharomyces cerevisiae topoisomerase II null strain BJ201 was used for transformation with C-terminally tagged human topoisomerase IIα plasmid pHT212 and untagged human topoisomerase IIβ pHT400. The expression of the enzyme is under the control of the moderate constitutive triose phosphate isomerase promoter. For Western blot experiments we used crude extracts prepared by vortexing at 4C for 30 min in the presence of 2 vol of extraction buffer [50 mM Tris (pH 7.8), 1 M NaCl, 1 mM phenylmethylsulfonylfluoride], and 1 vol of acid-washed glass beads (425-600 μm; Sigma). After centifugation at 4000 x g for 10 min and at 15,000 x g for 30 min, the supernatant was filtered (0.65-μm pore size filters). Samples of the extract were mixed with 10 x Laemmli buffer before submission to 6% SDS-PAGE. Electrophoresis and staining were performed as described before, except that gold-labled secondary antibodies were used (Amersham). Bands were finally visualized by silver enhancement (Amersham).
Protein Sequencing
A total of 109 unlabeled L428 cells were immunoprecipitated asdescribed above. After SDS-PAGE, the proteins were blotted to PVDF membranes (Millipore) and stained with Coomassie Brilliant Blue R 250 (Biorad; München, Germany). After destaining with 50% methanol, the antigen was excised and further processed for sequencing. The proteins were digested with trypsin and the proteolytic fragments separated by narrow-pore HPLC (130 Å; Applied Bio-systems) on a reverse-phase column (Vydac C4, 300 Å pore size, 5 μm particle size; 2.1 × 125 mm). Peptides were eluted with a linear gradient (0-80% b over 50 min; Solvent A, 0.1% TFA/H2O; Solvent B, 0.09% TFA/70% acetoneitrile) at a flow rate of 200 μl/min. Peptide-containing fractions detected at 214 nm were collected manually into siliconized Eppendorf tubes and frozen immediately. Protein sequences were determined by Standard Edman degradation on an automatic sequenator (473 A; Applied Biosystems).
Binding Site Determination
An approximately 60-kD fusion peptide of the carboxyl terminus of human topoisomerase IIα expressed in E. coli (DH5α) using the p Flag expression system (IBI, Zürich, Switzerland; the vector and the integrated cDNA were a generous gift from S. Gasser, ISREC, Lausanne, Switzerland) was electrophoretically run in a 5-15% polyacrylamide gel and stained with all five MAbs. Cambridge polyclonal antibody served as a positive control.
To map the antibody binding sites, 60 μg of nuclear extracts from H1-60 cells was submitted to proteolytic fragmentation using 0.6 μg (≈ 30 μU) S. aureus V8 endoproteinase (EC 3.4.21.19; Boehringer) for 5, 15, 30, and 480 min at 25C, pH 7.8. The proteolytic fragments were separated by SDS-PAGE (5-20% gels) as described above and analyzed by Western blotting with the antibodies Ki-S1, Ki-S4, Ki-S6, Ki-S7, and Ki-S8, as well as the rabbit polyclonal antiserum (ICI). The latter is directed against the utmost C-terminal KPIKYLEESDEDDLF sequence of the molecule.
Binding Affinity of Monoclonal Antibodies
Aliquots (3000 mU to 46.9 mU) of purified human topoisomerase IIα (TopoGEN) were transferred onto PVDF membranes and incubated with 1 μg/ml of each antibody (purified as described above) and with 1 μg/ml rabbit polyclonal antibody. Visualization of immunoreactive peptides was obtained by peroxidase-coupled secondary antibodies and a chemiluminescence kit (Amersham) used according to the supplier's instructions. Densitometry was performed with a Vilber Lourmat densitometer. The intensities of different dilutions were plotted and the regression was estimated. The antigen concentration at a medium staining intensity was estimated in three independent experiments, and the standard deviation and mean standard error were calculated.
Confocal Fluorescence Microscopy
Cells growing on slides were fixed in ice-cold acetone for 10 min and incubated at RT with Ki-S1 or Ki-S4 as the primary antibody (ascites) at a dilution of 1:30,000 for 1 hr. After three rinses in PBS, DATF-conjugated anti-mouse Ig from goat (Dako; Hamburg, Germany) was applied as a second antibody at a concentration of 1:100 for 1 hr. After washing in PBS slides were mounted with Histogel (Camon; Wiesbaden, Germany) and sealed with Eukitt. Control samples were treated identically except that the primary antibody was omitted.
Optical sections of 0.6 μm thickness were examined on a Zeiss LSM 10 confocal microscope equipped with an argon/krypton laser and filters for FITC detection. Images were recorded with a Zeiss Apoplan 63 x/1.4 or a 100 x/1.3 lens using zoom factors up to 4. They were stored on an optical disc (Mitsubishi MW-5U1) and photographed from a high-resolution flat screen (FVM 1702; Lucius & Baer, München, Germany). Grading of the antigen expression was done by two independent observers.
Results
Immunoreactivity and Antigen Distribution
Ki-S1 was found to be IgG2a, whereas all other antibodies were of the IgG1 isotype.
The distribution of the antigen in normal human tissues was restricted to sites known to harbor actively dividing cells, e.g., the basal and suprabasal cell layers of stratified epithelium, the bottoms of crypts in the gastrointestinal mucosa, proliferating endometrium, the dark zone of the germinal centers in lymphoid tissue (Figure 1A), and the immature precursor cells of granulopoiesis and erythropoiesis in the bone marrow. A particularly intense immunoreaction was observed in normal fertile testicular tissue. The majority of spermatogonia and spermatocytes were strongly stained, but neither spermatids nor spermatozoa expressed the antigen (Figure 1B). Occasional positive cells could be observed in the myometrium and the smooth muscle layer of gastrointestinal organs. Connective tissue displayed occasional immunoreactivity in widely scattered fibroblasts or capillary endothelial cells. Quiescent tissues, notably skeletal and cardiac muscle and neuronal tissue, showed no nuclear antigen expression. Nonspecific crossreactivities with cytoplasmic or matrical antigens were not observed, except for staining of splenic sinusoidal fibers with Ki-S4. Immuno-histochemical analysis of a wide variety of malignant tumors revealed labeling indices ranging from 10% to >90%. Numeric differences were not observed with different antibodies, but marked differences in the staining intensity were occasionally apparent. Immunostaining of frozen material and paraffin sections yielded identical results.
On immunocytochemical examination, only the nuclei of proliferating cells were reactive with our antibodies. Cytospin preparations of unstimulated PBLs, which represent G0 cells, did not show any reactivity. After stimulation with PHA, a constant increase in the number of stained cells could be observed. After 72 hr about 80-90% of the nuclei were stained (Figures 1C-1H). The intensity of nuclear labeling increased slightly through S-phase and was maximal in G2/M. Identical results were obtained with all six antibodies.
Whereas preparations of quiescent cells (unstimulated PBLs and Mϕ) yielded no immunoreaction, up to 90% of the cells of permanent lines (L428 and HL-60) were labeled (not shown). The staining was essentially confined to the nucleoplasm; only on rare occasions was weak cytoplasmic staining observed. Nucleoli were particularly highlighted by Ki-S1 and Ki-S4, whereas they were unconspicuous in the immunoreaction with the other antibodies. Serum deprivation considerably reduced the number of positive cells in permanent cell lines. On refeeding with 10% FCS, antigen expression gradually increased and reached control levels after 48 hr. Both myeloid and monocytic differentiation of HL-60 cells induced with DMSO or TPA led to a virtual disappearance of the antigen. Whereas in exponentially growing cells the percentage of labeled cells was practically invariable with all five antibodies, variations in staining intensity were occasionally noted (data not shown).
Molecular Mass of the Antigen and Specificity of the Antibodies
Immunoprecipitation of radiolabeled nuclear lysates of L428 cells with Ki-S1 and subsequent SDS-PAGE evaluated by autoradiography yielded a strong protein band at 170 kD. Weak bands at 180 and 133 kD (less than 4% of the signal intensity of the main band at 170 kD) were co-precipitated in this experiment (Figure 2). By contrast, in Western blot experiments using crude nuclear extracts, all five MAbs exclusively stained the 170-kD protein detected by rabbit polyclonal antibody to topoisomerase IIα, whereas A10 antiserum raised against both topoisomerase II isoforms recognized a double band at 170 and 180 kD (Figure 3). L-428 cells growing at different densities expressed 40-60% of topoisomerase IIβ compared to the α-form (Figure 3). Because Ki-S1 precipitated a 180-kD band, the specificity of the five MAbs was further tested on human topoisomerase IIα and β differentially expressed in yeast cells. In Western blot experiments using extracts from these cells, the 180-kD protein was visualized only by an antibody specific for topoisomerase IIβ, whereas all five of our antibodies exclusively recognized the α-isoform (Figure 4). Immunoreactive antigens were enriched by immunoprecipitation with Ki-S1, separated by SDS-PAGE, and transferred by Western blot to PVDF membranes. The Coomassie Brilliant Blue-labeled protein was excised and used for protein sequencing. Because sequencing of the intact protein was unsuccessful due to blocking of the N-terminus, the antigen was digested by trypsin. From the obtained proteolytic fragments, the sequence of eight peptides of 10 to 26 amino acids could be determined. All of these eight peptides exhibited complete identity (100%) with the protein predicted by the cDNA sequence of human topoisomerase II (Figure 5). Six of them shared 68-84% sequence similarity with topoisomerase IIβ, and two differed only by one amino acid from topoisomerase IIβ (90-92% identity; first two sequences).
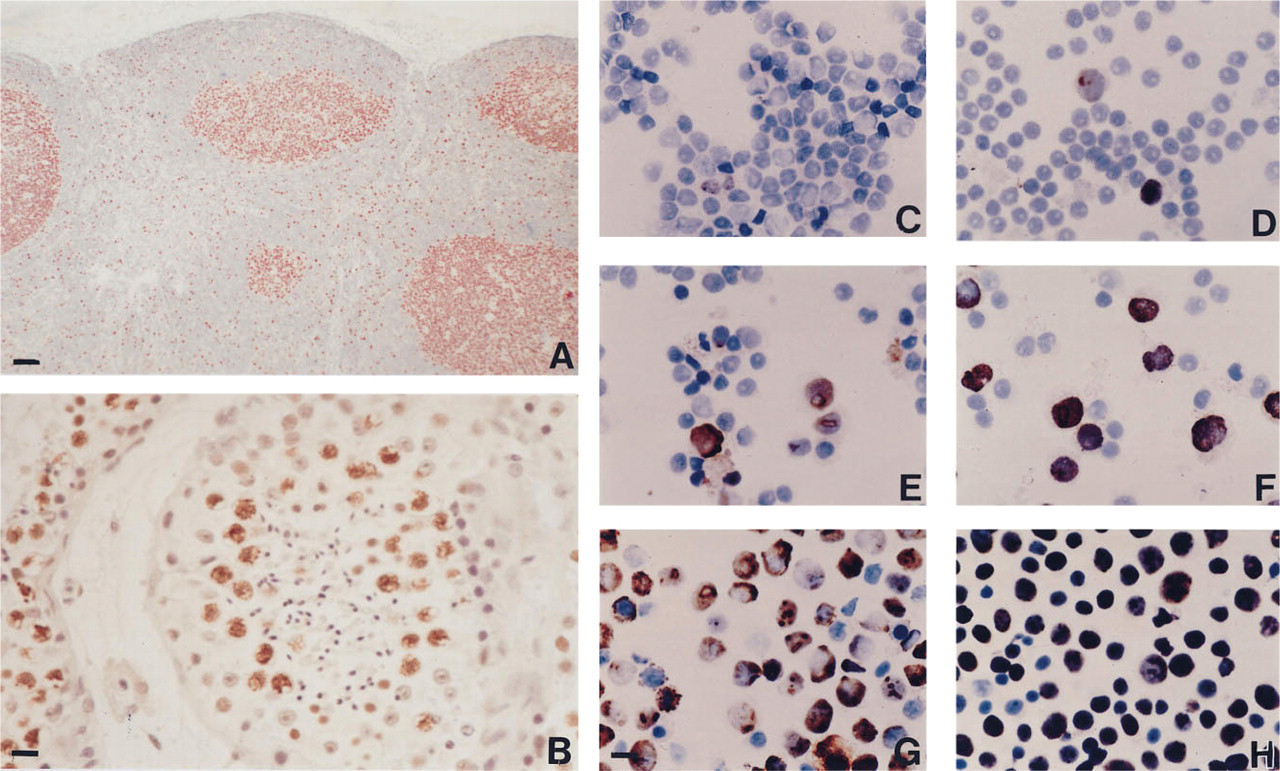
(A) Cortex of human lymph node with follicular hyperplasia. Note the intense Ki-S1 immunoreactivity in the dark zone of the germinal centers. Tingible-body macrophages appear as blank spots. In the mantle zone and the perifollicular pulp, scattered cells are labeled. APAAP-stain. Bar = 100 μm. (B) In the fertile adult testis, virtually all spermatogenic cells up to the first meiotic division are strongly reactive with Ki-S4. APAAP stain. Bar = 20 μm. (C-H) Increasing Ki-S1 positivity of peripheral blood lymphocytes. (C) 0, (D) 12, (E) 24, (F) 48, (G) 60, and (H) 72 hr after PHA stimulation. Peroxidase stain. Bar = 10 μm for C-H.
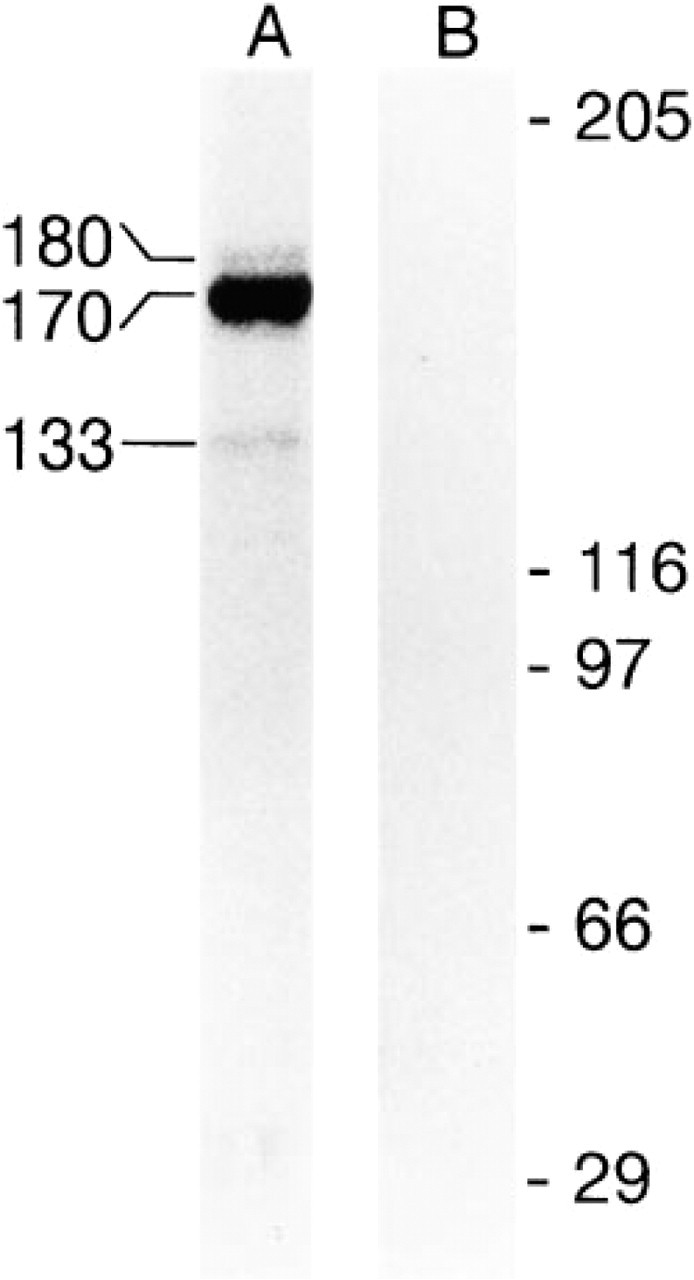
Immunoprecipitation of nuclear extracts from radioactively prelabeled L428 cells with Ki-S1 (Lane A). A strong signal is seen at 170 kD, and a weak signal at 180 and 133 kD. Lane B, control without antibody. Molecular weight reference in kD is indicated at right.
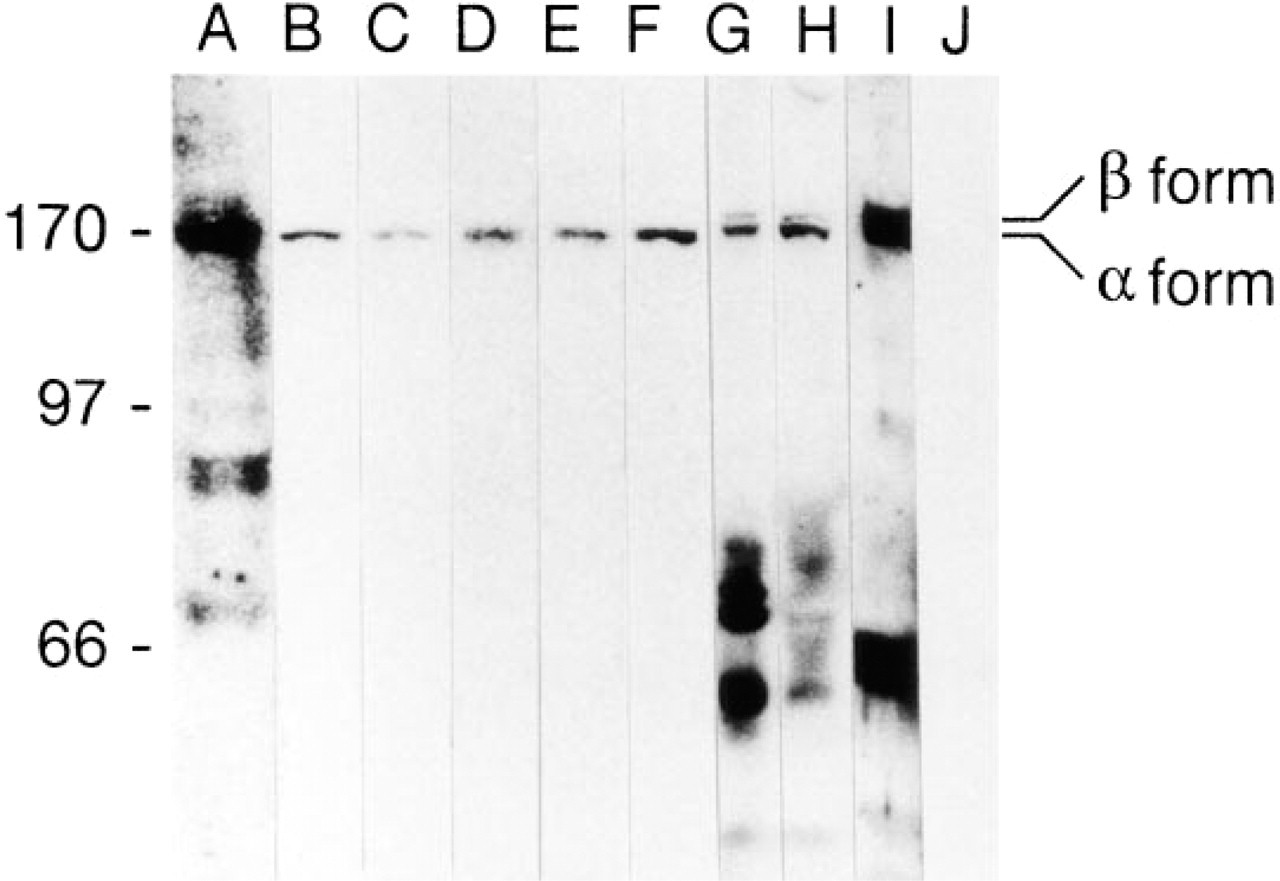
Western blot analysis using crude nuclear extracts from HL-60 and L-428 cells. All five antibodies detect a protein at 170 kD, which is also recognized by ICI rabbit polyclonal antiserum and antibody A10 (Lane A, Ki-S1; Lane B, Ki-S4; Lane C, Ki-S6; Lane D, Ki-S7; Lane E, Ki-S8; Lane F, ICI; Lanes G-I, A10 (extracts of HL-60 (G) and L-428 (H,I) cells at different densities); Lane J, control without primary antibody. The A10 antibody additionally recognizes a 180-kD band, which represents topoisomerase IIβ. The positions of the topoisomerase IIα and β bands are indicated at right.
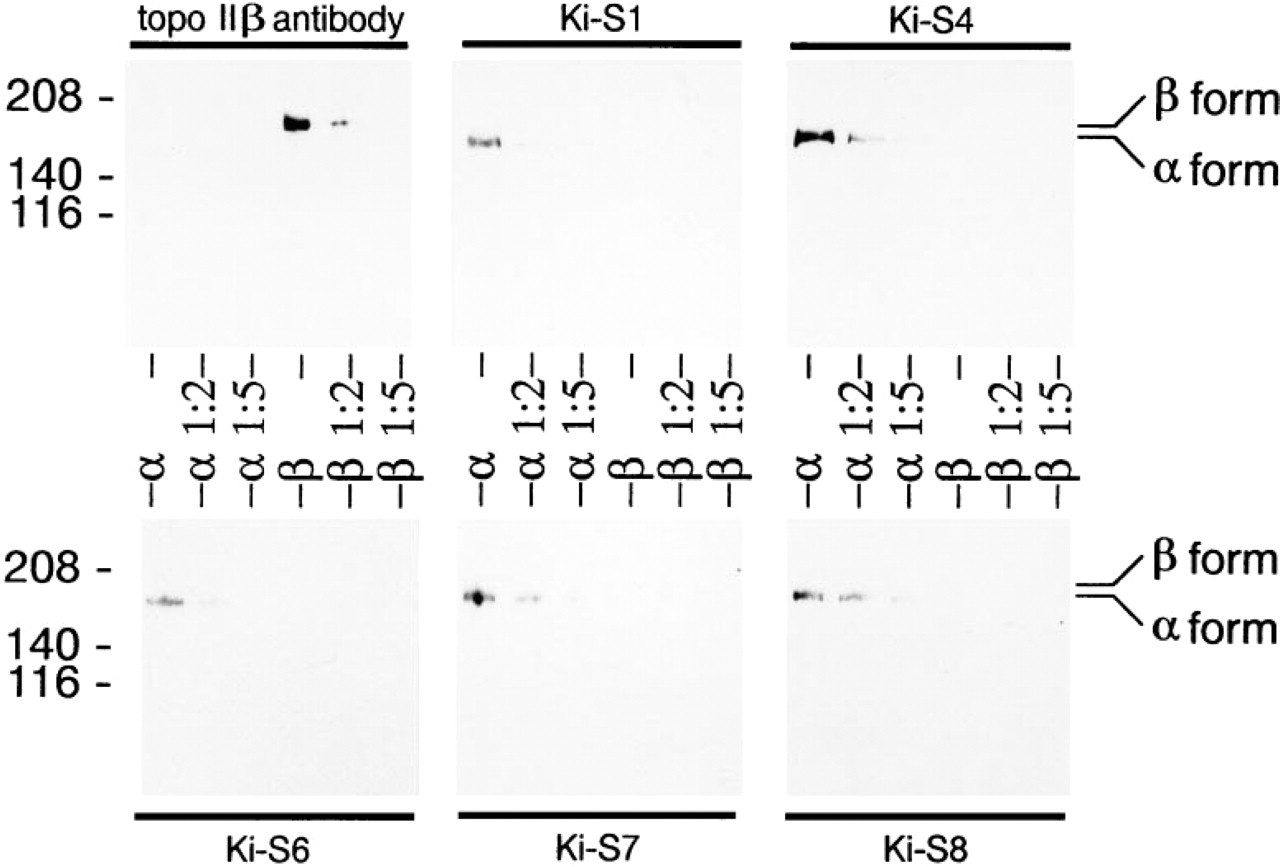
Western blot analysis using crude extracts from yeast cells expressing human topoisomerase IIα (α ≈ 60 μg; a 1:2 ≈ 30 μg; α 1:5 ≈ 12 μg) or human topoisomerase IIβ (β ≈ 60 μg; β 1:2 ≈ 30 μg; β 1:5 ≈ 12 μg). All five Ki-S antibodies detect human topoisomerase IIα at 170 kD but not topoisomerase IIβ, whereas the anti-topo IIβ antibody (BioTrend) recognizes only topoisomerase IIβ.
These results were further confirmed for all MAbs by Western blot experiments using homogeneously purified human topoisomerase IIα. The purity of the enzyme preparation was verified by India ink staining, yielding a neat single band at 170 kD. Affinity-purified preparations of the five MAbs antibodies stained this protein (Figure 6), which demonstrates that the antigen recognized by the antibodies actually represents topoisomerase IIα. Weak bands of a lower molecular weight were also stained.
Proteolytic digestion of crude nuclear extracts with V8-protease for 5-15 min yielded a neat set of proteolytic fragments as visualized by Coomassie Brilliant Blue staining. Western blot analysis with the antibodies Ki-S1, Ki-S4, Ki-S6, and Ki-S8 displayed four different staining patterns, whereas no signal was obtained with the ICI antiserum and Ki-S7 (Figure 7). All of these antibodies reacted with the 60-kD C-terminal fusion peptide (Figure 8). However, the binding affinity of Ki-S1 was weak, so that a threefold protein loading was necessary to obtain a signal intensity comparable to that of the other antibodies.
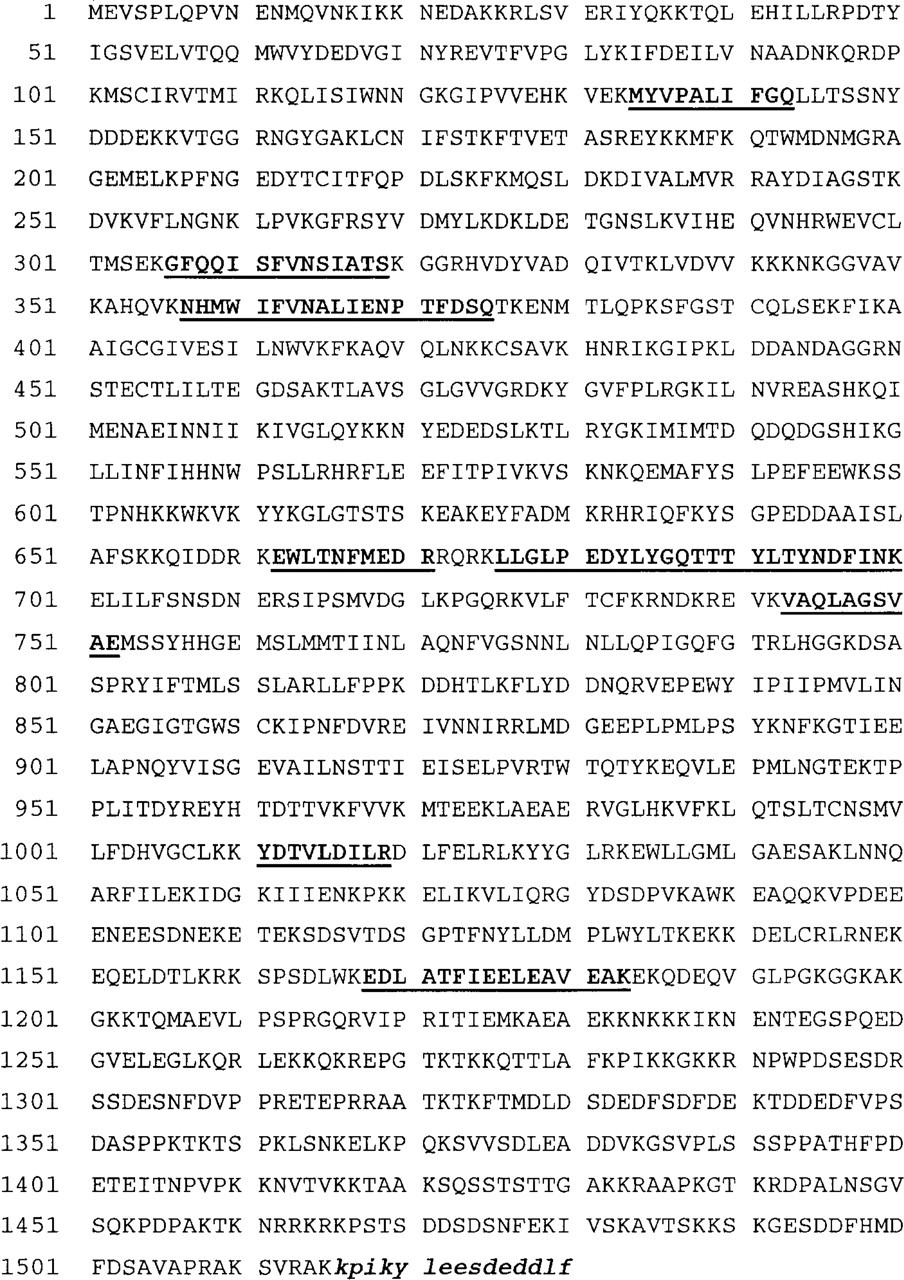
Sequence identity between the Ki-S1-immunoprecipitated protein and human topoisomerase IIα (one-letter code). Amino acid sequences of peptides obtained by Edman analysis are underlined. Italic small letters at the C-terminal end correspond to the sequence used to raise the ICI polyclonal antibody.
Binding Affinity of Monoclonal Antibodies to Topoisomerase IIα
Evaluation of the antigen-antibody complex formation with various concentrations of purified human topoisomerase IIα demonstrated that all five antibodies bound to the enzyme with different affinities. The strongest reaction was observed with Ki-S1 (set to 100%), of which even 1 μg/ml antibody yielded a detectable signal with 93.8 mU/20 mm2 (4.7 mU/mm2). Compared with Ki-S1, decreasing affinities were observed (in that order) with the antibodies: ICI antiserum, 17.7%; Ki-S4, 8%; Ki-S7, 7.5%; Ki-S8, 5.4%; and Ki-S6, 1.7% (Figure 9).
Confocal Immunofluorescence Microscopy
In both MCF7 and HeLa cells, the immunoreactivity of the MAbs was restricted to the nucleus of interphase cells (Figure 10). Serial sections of individual nuclei showed that fluorescence was concentrated in discrete dots throughout the nucleoplasm. In cells with high antigen expression, fluorescence was distributed more or less homogeneously in the nucleus. In low-proliferating MCF7 cells, immunoreactivity was less intense, leaving many nuclei completely unstained. Only about 15% of the cells were strongly positive, whereas in HeLa cells 90% were strongly labeled. In control samples, omission of the first antibody reduced fluorescence below the limits of detection (data not shown).
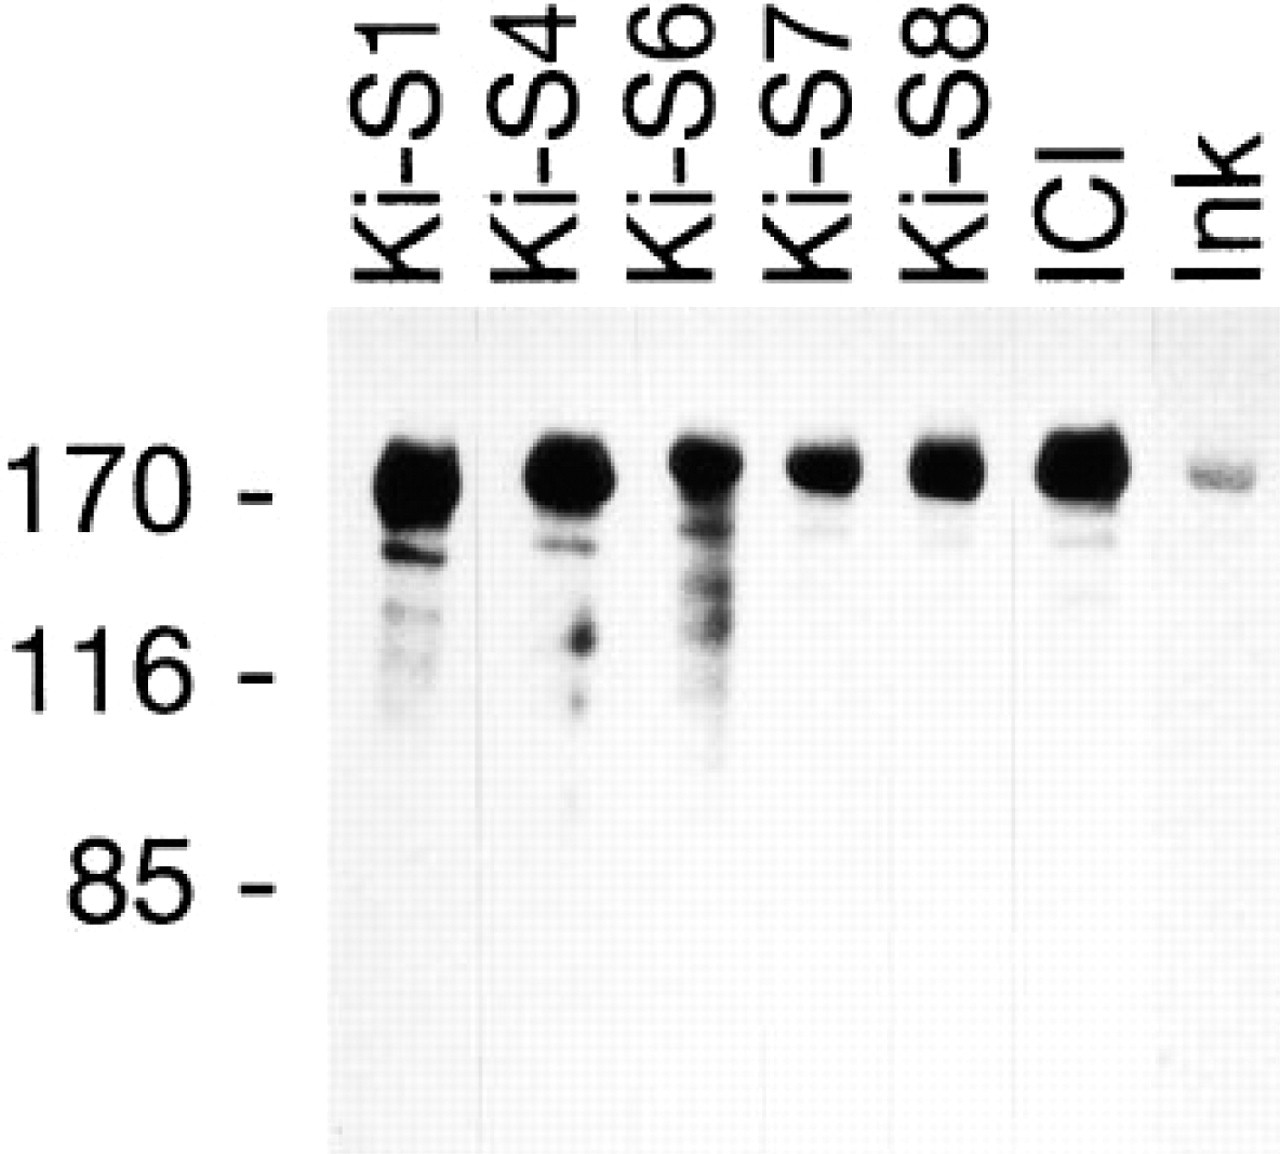
Western blot analysis using purified human topoisomerase IIα (TopoGEN): a neat single band at 170 kD and some weak degradation products are recognized by all five antibodies (Ki-S1, Ki-S4, Ki-S6, Ki-S7, Ki-S8); the same band is stained by ICI antiserum (ICI) and India ink (Ink). Molecular weight reference (kD) is at left.
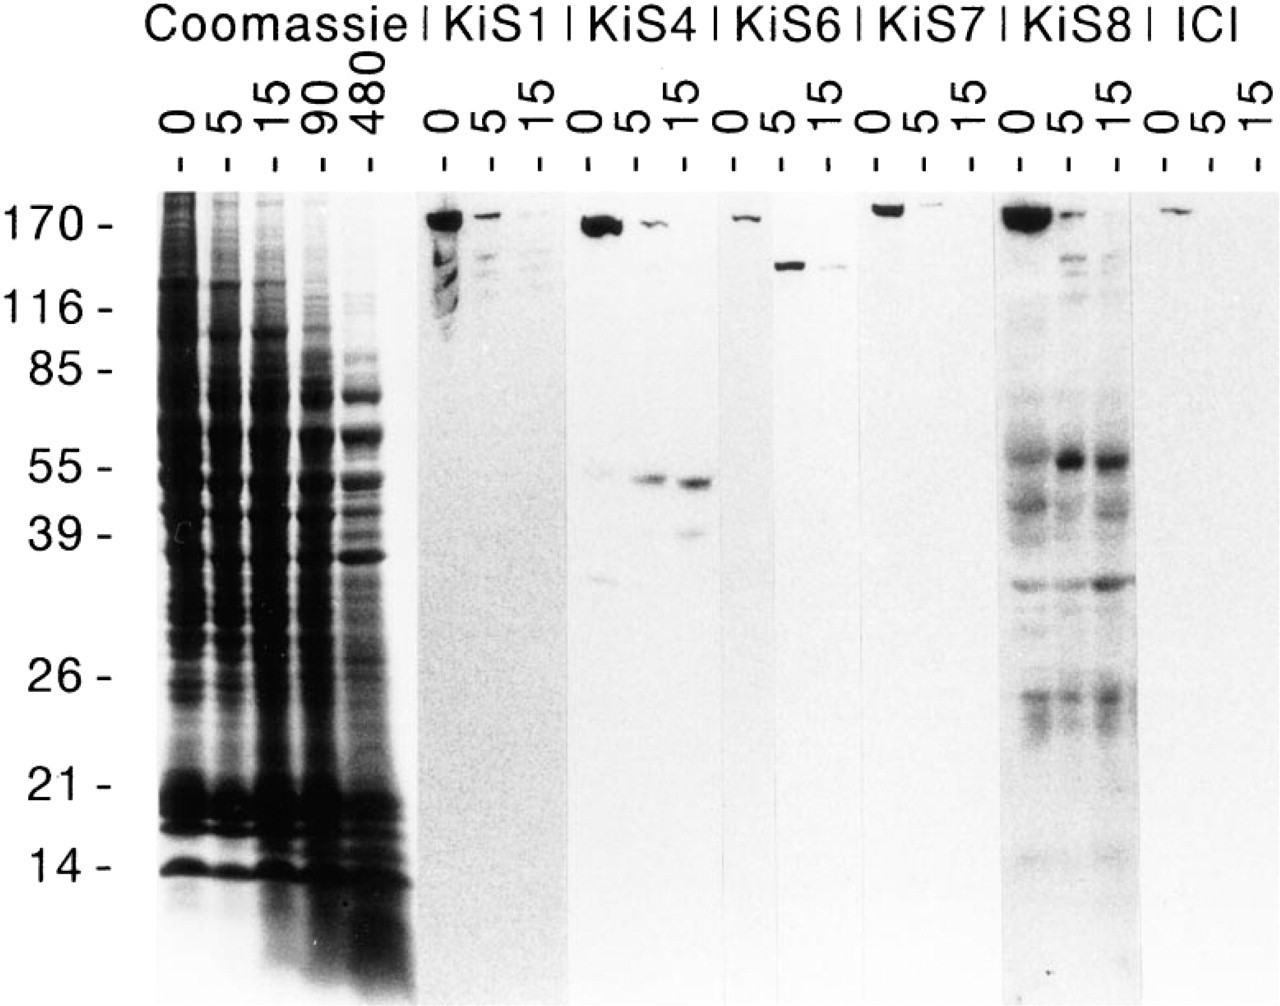
Proteolytic digestion of crude nuclear extracts with V8-protease reveals distinctive staining patterns for each of the antibodies Ki-S1, Ki-S4, Ki-S6, Ki-S7, and Ki-S8, whereas no signal is obtained with ICI polyclonal antiserum. Proteolysis is dependent on the reaction time, as illustrated by Coomassie Brilliant Blue staining (left).
During chromosome organization at the beginning of mitosis, HeLa cells displayed a finely punctate fluorescence pattern. In L428 cells, Ki-S1 and Ki-S7 distinctly stained the centromere of mitotic chromosomes and weakly marked the chromosomal scaffold. In many cells, the immunoreactive protein appeared to be condensed along the nuclear membrane in a rimlike pattern. In addition, in both interphase cells and at the onset of mitosis, one or two clusters with strong reactivity were found in the majority of cells. These more intensely staining regions were particularly highlighted by the antibody Ki-S4.
Discussion
The five MAbs described here were selected for their reactivity with a nuclear antigen expressed by proliferating cells. This antigen could be identified as the α-isoform of human topoisomerase II by the following criteria. (a) Determination of the molecular mass revealed a 170-kD protein recognized by all five antibodies. This is also the molecular weight of the α isoform of human topoisomerase II (Chung et al. 1989). (b) Sequencing of peptides obtained by immunoprecipitation of this protein with the antibody Ki-S1 yielded eight amino acid sequences presenting complete identity with the sequence of human 170-kD topoisomerase, whereas no peptide sequence was 100% identical to human topoisomerase IIβ (Austin et al. 1993; Tsai-Pflugfelder et al. 1988). (c) Accordingly, all five antibodies suitable for Western blot analysis reacted with a highly purified enzyme preparation, for which the absence of contamination by nonspecific proteins could be verified. (d)All five antibodies bind to the C-terminal third of topoisomerase II, which is the region with the highest dissimilarity between the two isoenzymes (Austin et al. 1993). (e) Because the cDNAs encoding for the two isoforms of human topoisomerase II share extensive nucleotide and predicted peptide sequence similarities (Austin et al. 1993; Jenkins et al. 1992; Chung et al. 1989), crossreactivity with the β-isozyme could be expected. However, none of the antibodies stained a 180-kD band in Western blot experiments using extracts from yeast cells expressing human topoisomerase IIβ (Biersack et al. 1996). In these extracts, detectable amounts of topoisomerase IIβ were regularly demonstrated by positive staining with a polyclonal antibody from BioTrend. In Western blot experiments using nuclear extracts from L-428 cells, none of the five antibodies detected a band at 180 kD, which was always stained with A10 polyclonal antiserum. Moreover, non-proliferating cells, which are known to express topoisomerase IIβ, were never stained by any of our antibodies (Figure 2).
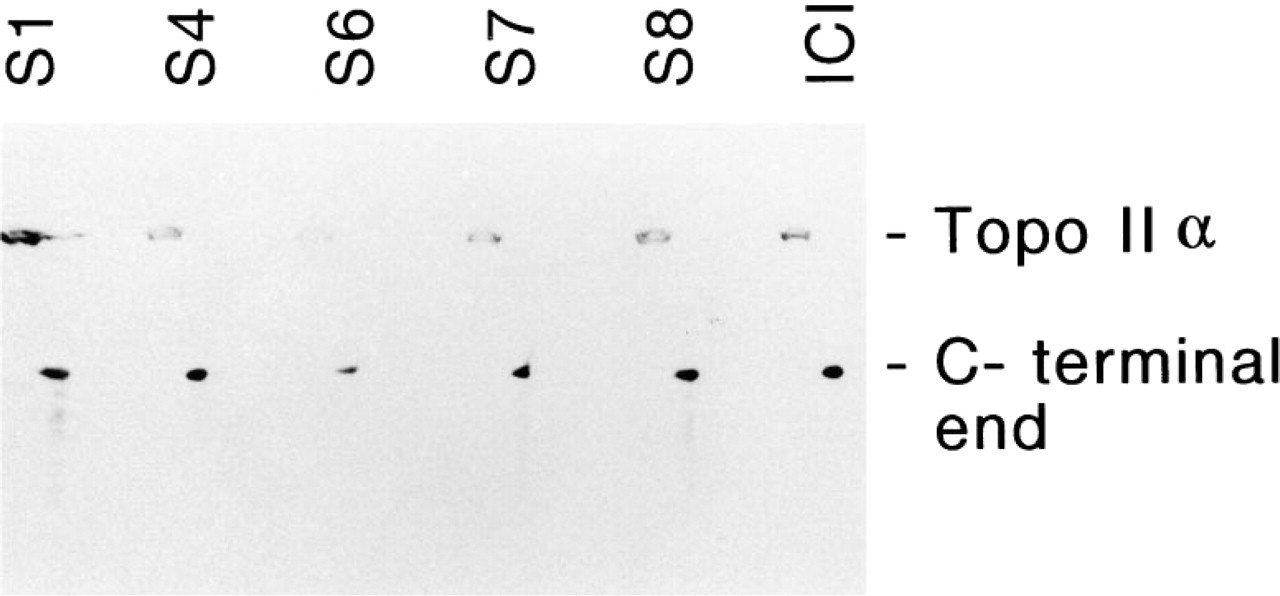
All five antibodies, as well as ICI polyclonal antiserum, recognize the fusion peptide corresponding to the 1003 C-terminal amino acid residues of human topoisomerase IIα (18 mg protein lysate from E. coli for Ki-S1, otherwise 6 mg). Bands at the top of the figure demonstrate the reactivity with the whole topoisomerase molecule.
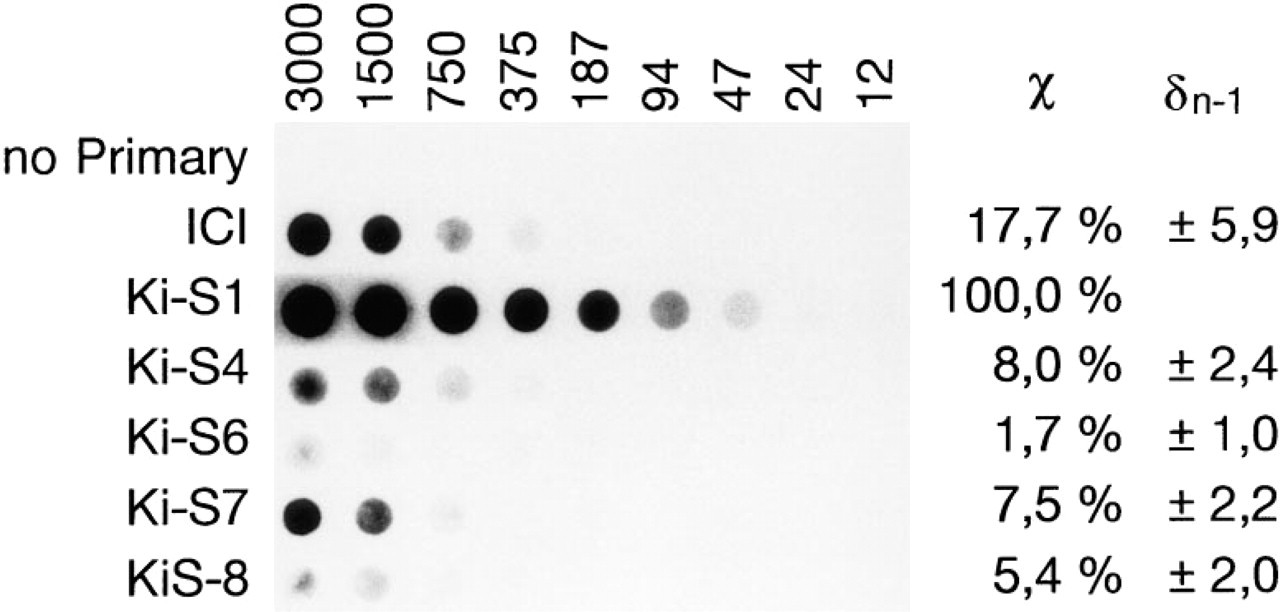
Dot-blot analysis illustrating the binding affinity of the five MAbs and the ICI antiserum to topoisomerase IIα. Vertical lanes correspond to successive dilution steps of purified human topoisomerase IIα from 3000 mU (Lane 1) to 12 mU (Lane 9). Horizontal lanes represent ICI antiserum and purified monoclonal antibodies Ki-S1, KiS-4, Ki-S6, Ki-S7, Ki-S8 (1 μg/ml each). Top lane is without primary antibody (no Primary). The results of densitometric analysis obtained by three independent experiments are indicated at right (X, mean extinction as compared to Ki-S1, set as 100%; δn-1, mean standard error).
Nevertheless, immunoprecipitation with Ki-S1 yielded an additional protein of 180 kD, which is the size of topoisomerase IIβ. The staining intensity of this band was about 4% that of the 170-kD signal. Despite the constant absence of such a band in Western blot experiments with our antibodies, this finding could have been difficult to interpret except on the basis of a crossreactivity with the β-isoform. The recent work of Biersack and associates (1996) finally provides a different and plausible explanation. Indeed, in yeast cells expressing both human isoenzymes, these were found to form heterodimers at a substantial rate. Moreover, the presence of such heterodimers could also be demonstrated in (human) HeLa cells (Biersack et al. 1996). In our experiments, topoisomerase IIβ expression levels varied between 40% and 60% compared to the α-isoform, which corresponds to 10 times the relative concentration of the co-precipitated topoisomerase. We can therefore assume that topoisomerase II heterodimers are also present in L-428 cells and account for the 180-kD band in our immunoprecipitation experiment.
The binding affinity to topoisomerase IIα in vitro differs for the antibodies, with Ki-S1 showing the highest affinity (100%), followed (in decreasing order) by Ki-S4 (8%), Ki-S7 (7.5%), Ki-S8 (5.4%), and Ki-S6 (1.7%). Because this observation, together with slight differences in the intensity and subcellular distribution of immunostaining, suggested binding to different epitopes, we performed a Western blot experiment with proteolytic fragments of purified topoisomerase IIα. The proteolytic digestion using V8-protease poses a problem insofar as this enzyme cuts at the carboxy side of glutamate residues, corresponding to 123 potential dissections of the topoisomerase IIα molecule. Therefore, a complete proteolysis would have yielded minute fragments undetectable by Western blot analysis. By limiting the time of the enzymatic reaction to 5-15 min, we were able to generate peptides in the range of approximately 25-125 kD that were readily detected by immunoblotting. Each of our antibodies, with the exception of Ki-S7, revealed a distinctive pattern of protein bands indicative of different binding sites. Because the signal detectable with ICI antiserum also disappeared after 5-min digestion, it can be speculated that this antibody and Ki-S7 bind to neighboring epitopes at the extreme C-terminus (Figure 5). This is consistent with a 13-amino-acid binding site at the extreme C-terminus containing three V8-protease-sensitive residues that are likely to be rapidly lysed by the enzyme. A complete epitope mapping for all five antibodies is the subject of current investigations.
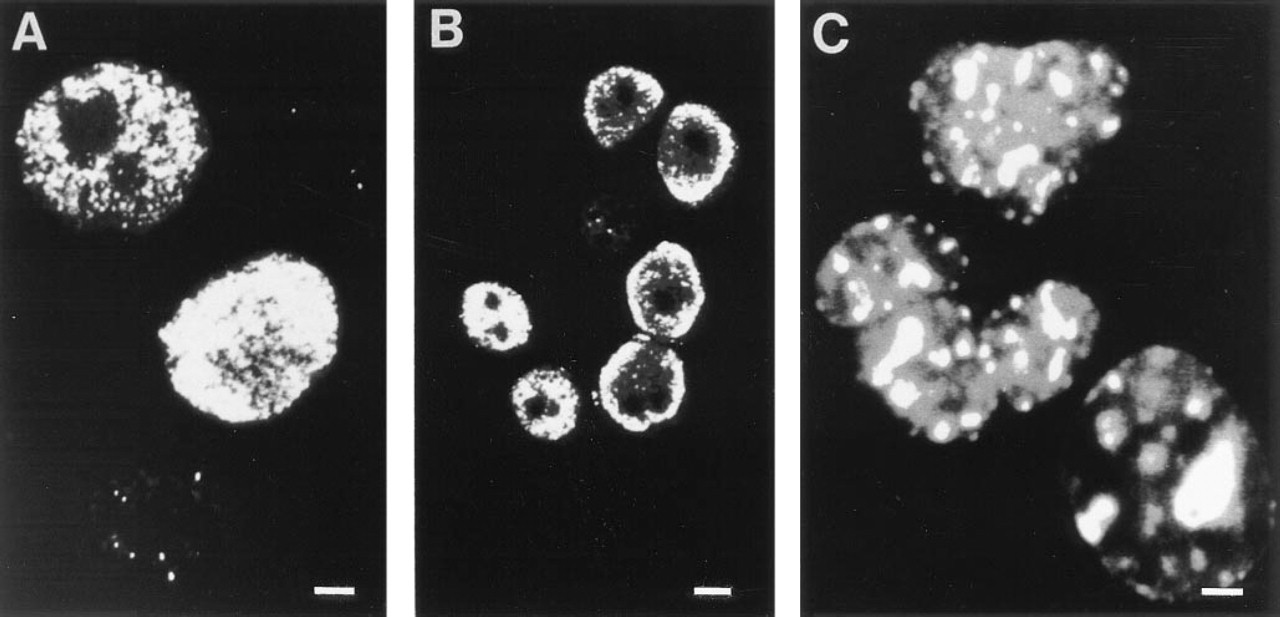
In the slowly growing cell line MCF7, immunofluorescence with Ki-S1 displays a finely punctate pattern in the nuclei of interphase cells. In many cells the antigen is only detectable as minute discrete dots; nucleoli are unstained (top). Bar = 5 μm. (B) Highly proliferating HeLa cells exhibit a similar staining pattern with Ki-S1. The majority of the cells are intensely labeled, but nucleoli are avoided, and in many cells the antigen is condensed at the nuclear membrane. Bar = 15 μm. (C) Ki-S4 immunofluorescence in the nuclei of HeLa cells is concentrated in bold irregular dots; the bigger, intensely labeled structures may represent nucleoli. Bar = 3 μm.
One year ago we provided evidence that the antigen recognized by Ki-S1 is identical to human topoisomerase II (Rudolph et al. 1995a). Subsequently, Boege and coworkers (1995) came to the same conclusion and showed by Western blot analysis of proteolytic fragments that the Ki-S1 binding epitope is likely to localize within the 495-amino-acid C-terminal region of the enzyme. From the location of major sequence heterologies, they deduced that the Ki-S1 binding site might be further narrowed down to amino acid residues 1501-1530. The C-terminal region of the molecule, which contains a putative nuclear location site (Caron et al. 1994), is indeed one of the domains at which the greatest amino acid sequence differences between the two isozymes are found, another being situated at the extreme N-terminus (Austin et al. 1993; Jenkins et al. 1992). Because our current endeavors to perform epitope mapping for our antibodies have not yet been successful, we proceeded to verify Boege's thesis by a rapid and easy assay. A fusion peptide of the 60-kD C-terminus of human topoisomerase IIα (corresponding to the 527 C-terminal residues) was probed in Western blot analysis with our five antibodies, and rabbit polyclonal antibody as a positive control. The polyclonal antiserum yielded a strong signal at approximately 60 kD that was visualized by all of our antibodies. However, of all five antibodies, Ki-S1 bound with the lowest avidity, whereas its affinity to the whole molecule was by far the strongest. These results suggest that Ki-S1 is likely to recognize several epitopes with sequence similarities, of which a lesser percentage is located in the C-terminus of topoisomerase II. Likewise, it seems improbable that this binding site should be located within the 1501-1530 region, which corresponds to the utmost C-terminal sequence of topoisomerase IIα, since the Ki-S1 binding site was conserved even after proteolysis for 15 min. The fact that all five antibodies are directed to C-terminal sequences is in itself not surprising. The recently disclosed crystal structure of yeast topoisomerase II reveals that the C-terminus (residues 990-1202) contains several α-helices and two β-sheets exposed at the surface of the folded molecule (Berger et al. 1996). Provided a comparable structure of human topoisomerase IIα exists, the α-helical structure and/or the free accessibility of these sites may be responsible for their antigenic potential.
The results of confocal fluorescence microscopy are in line with those described for topoisomerase II in previous investigations (Zini et al. 1994; Petrov et al. 1993). Whereas the nucleoplasmic distribution, i.e., a diffuse dot-like pattern, was similar in different interphase cells, the density of labeling was closely related to their proliferative potential. In mitotic cells, centromeres were highlighted above the dimmer labeling of the chromosomal scaffold. In addition, a finely punctate nucleoplasmic fluorescence pattern, sparing the chromosomes, was apparent. Because such an even distribution is hardly compatible with the precise structural changes that occur during mitosis, the signals are more likely to correspond to a remainder of enzymatically active topoisomerase uninvolved in scaffolding during mitosis (Earnshaw et al. 1985). The larger regions of condensed immunostaining could be identified as nucleoli. Their labeling might have been attributed to a crossreaction with topoisomerase IIβ. However, this could be ruled out by the isoform selectivity of our antibodies and the absence of labeling in resting cells. More probably, as already discussed by other authors (Zini et al. 1994; Boege et al. 1993; Petrov et al. 1993), this labeling corresponds to a fraction of topoisomerase IIα specifically expressed in the fibrillar component of the nucleolus.
The tissue distribution of the immunoreaction underscores the proliferation specificity of topoisomerase IIα. Accordingly, the immunohistochemical assessment of Ki-S1 labeling indices turned out to be of high prognostic relevance in breast cancer (Kreipe et al. 1993a; Sampson et al. 1992) and soft tissue sarcomas (Rudolph et al., in preparation). By a comparable immunohistochemical approach, Holden et al. (1994) found significant variations of the topoisomerase IIα content in various human malignancies. Because the expression levels of the enzyme seem to correlate with the susceptibility of tumor cells to anti-topoisomerase agents (Feldhoff et al. 1994; Fry et al. 1991; Webb et al. 1991; Davies et al. 1988), the recognition of different epitopes and the differences in binding affinity may provide a valuable means for defining thresholds of reactivity in vivo to detect subtle variations in antigen expression or enzyme activity. However, reduced protein levels cannot entirely account for the failures of topoisomerase-oriented cytotoxic therapy. Further studies of the subnuclear enzyme distribution and colocalization with topoisomerase-inhibitory drugs by use of site-specific antibodies could therefore provide a deeper insight into mechanisms of chemoresistance and the topological states, structural alterations, and biological functions of topoisomerase IIα.
Footnotes
Acknowledgements
Supported in part by a grant from the Deutsche Forschungsgemeinschaft KE 556/S=1.
We thank S. Gasser (IBI, Zurich, Switzerland) for donating the expression rector, for the C-terminus of topo IIα.