
Abstract
Deuterium oxide (D2O) increases both the fluorescence lifetime and the fluorescence intensity of the intercalating dyes propidium iodide (PI) and ethidium bromide (EB) when bound to nucleic acid structures. We have used spectroscopic analysis coupled with conventional and phase-sensitive flow cytometry to compare the alterations in intensity and lifetime of various DNA-binding fluorochromes bound to DNA and Chinese hamster ovary (CHO) cells in the presence of D2O vs phosphate-buffered saline (PBS). Spectroscopic and flow cytometric studies showed a differential enhancement of intensity and lifetime based on the mode of fluorochrome-DNA interaction. The fluorescence properties of intercalating probes, such as 7-aminoactinomycin D (7-AAD) and ethidium homodimer II (EthD II) were enhanced to the greatest degree, followed by the probes TOTO and YOYO, and the non-intercalating probes Hoechst 33342 (HO) and 4',6-diamidino-2-phenylindole (DAPI). The non-intercalating probe mithramycin (MI) gave unexpected results, showing a great enhancement of fluorescence intensity and lifetime in D2O, indicating that when staining is performed in PBS, much of the MI fluorescence is quenched by the solvent environment. Apoptotic subpopulations of HL-60 cells had a shorter lifetime compared to nonapoptotic subpopulations when stained with EthD II. These results indicate that accessibility of the dye molecules to the solvent environment, once bound to DNA, leads to the differential enhancement effects of D2O on fluorescence intensity and lifetime of these probes.
Keywords
D
Enhancement of the fluorescence intensity of DNA-binding probes improves the signal-to-noise ratio, allowing the use of lower dye concentrations and thereby reducing potential self-quenching between dye molecules bound in close proximity. Deuterium oxide (D2O; heavy water) increases EB and PI fluorescence intensity (Mazzini et al. 1983; Mazzini and Giordano 1980; Olmsted and Kearns 1977) as well as fluorescence lifetime (Sailer et al. 1996) in flow cytometry. Szabo et al. (1986) also demonstrated spectrophoto-metrically that the lifetime of DAPI bound to DNA is increased in D2O. Both the enhancement of fluorescence intensity and the increase in fluorescence lifetime have been attributed to the stabilization in the proton transfer rate between dye bound to DNA and the solvent system (Olmsted and Kearns 1977). Increased time in the excited state leads to increased fluorescence emission and extended fluorescence lifetimes.
Measurement of fluorescence lifetime using phasesensitive electronics has recently provided an additional parameter for flow cytometry analysis (Deka et al. 1994; Pinsky et al. 1993; Steinkamp and Crissman 1993; Steinkamp et al. 1993). Phase-sensitive flow cytometry provides the capability to quantify fluorescence lifetimes (Steinkamp et al. 1993) and to resolve the emissions of multiple fluorochrome labels that have different lifetime values (Steinkamp and Crissman 1993). Quantitation of the lifetime of DNA-bound fluorochromes provides information on the molecular interactions of a fluorochrome within the target molecule (Sailer et al. 1996; Heller and Green-stock 1994). The lifetimes of DNA-bound fluorochromes are altered by physical and chemical factors such as solvents, cations, pH, energy transfer, and quenching. Measurement of the lifetime of the DNA-bound fluorochrome by phase-sensitive flow cytometry coupled with simultaneous DNA content analysis allows discrimination of subpopulations of cells with discrete lifetime alterations. Application of this new flow cytometric technology showed that subpopulations of apoptotic HL-60 cells with altered chromatin structure had a shorter lifetime compared to the non-apoptotic portion of the population after staining with PI or EB (Sailer et al. 1996).
Alterations in chromatin structure change the accessibility of the DNA-bound fluorochromes and influence both the intensity (Evenson et al. 1986; Darzyn-kiewicz et al. 1984) and the lifetime of the bound dye (Sailer et al. 1996; Heller and Greenstock 1994; Lakowicz 1992; Dewey 1991; Jameson and Reinhart 1989). Differences in the structure of fluorochrome molecules and in their mode of DNA binding lead to differences in D2O-induced enhancement in the intensity and lifetime. Prior studies in our laboratory showed that D2O had a more pronounced effect on the fluorescence intensity and lifetime of PI bound to chromatin of fixed CHO cells compared to EB (Sailer et al. 1996). Enhancement of the fluorescence intensity of DNA-bound PI in D2O significantly improved the G0/G1 peak CV values for PI-stained CHO cells when these were analyzed on a commercial flow cytometer with limited laser power (Sailer et al. 1996).
In this study we used conventional and phase-sensitive flow cytometry to examine the effects of D2O on dyes with different modes of DNA binding. D2O enhanced the fluorescence intensity and fluorescence lifetime of all the dyes, but to an extent dependent on the mode of interaction of the dye with the DNA. Fluorescence intensity of non-intercalating, A-T base-specific dyes, such as HO and DAPI, was enhanced only slightly by D2O, whereas the intensity of intercalating dyes with base specificity, such as 7-AAD (G-C-specific) and EthD II (A-T-specific) was enhanced to a greater degree, although not to as great an extent as previously noted for PI and EB. Fluorescence lifetimes of stained cells were increased by D2O to an extent some-what proportional to the enhanced fluorescence intensity. Variation in either dye concentrations or the relative proportion of D2O in the solvent provides the potential to preselect a lifetime value for a probe in studies utilizing phase-resolved measurements to separate the fluorescence of dyes on the basis of their respective lifetimes rather than of their spectral emission patterns. The interaction of EthD II with subpopulations of apoptotic cells also significantly reduced fluorescence lifetime compared to the non-apoptotic cells.
The results of this study indicate that the different modes of fluorochrome-DNA interaction, as well as differences in solvent accessibility of the fluorochromes, lead to a differential enhancement effect of D2O on intensity and lifetime. The use of D2O to study intensity and lifetime provides additional information on the microenvironment of the fluorochrome-DNA interaction. An example in this study was the unexpected D2O-induced enhancement noted for the non-intercalating G-C-specific MI. On the basis of the non-intercalating mode of MI-DNA binding, a minimal enhancement of fluorescence intensity and lifetime comparable to results noted for HO and DAPI would have been expected. The great enhancement of MI intensity and the lifetime values in D2O infer that when PBS is used as the solvent, a large portion of the MI fluorescence is potentially being lost due to solvent quenching. The results of this study will lead to further insight into the mechanisms and environmental influences on fluorochrome-DNA interactions.
Materials and Methods
Cells and Culture Conditions
Chinese hamster ovary (CHO) cells were grown in suspension culture at 37C in spinner flasks containing Ham's F10 medium (Gibco BRL; Grand Island, NY) supplemented with 15% heat-inactivated bovine calf serum (Hyclone Laboratories; Logan, UT), 100 U/ml penicillin, and 100 μg/ml streptomycin (Gibco). Cell densities were maintained at 0.25-4.5 × 10⁵ cells/ml. The population doubling time was 13-14 hr.
Human promyelocytic (line HL-60) cells were maintained in suspension culture at 37C in T-150 flasks containing RPMI-1640 (Gibco) supplemented with 10% fetal bovine serum (Hyclone Laboratories), 100 U/ml penicillin, 100 μg/ml streptomycin (Gibco), and 1.25 mM
Induction of Apoptosis in HL-60 Cells and Extraction of Low Molecular Weight DNA
HL-60 cells in culture were treated with 0.15 μM campto-thecin (Sigma; St Louis, MO) for 3 hr before fixation. Cells were harvested from suspension culture by centrifugation at room temperature (RT) for 5 min at 200 X g and thoroughly resuspended in one volume of cold Puck's saline A, without Ca2+ and Mg2+ and containing 1.0 mM EDTA (Gibco). Three volumes of cold 95% ethanol were then added to yield a final cell concentration of 1.0 × 10⁶/ml in 70% ethanol. After at least 24 hr of fixation, the cells were centrifuged at RT for 5 min at 200 X g and the fixative aspirated. Cell pellets were resuspended in 50 μl of phosphate-citrate buffer (192 parts 0.2 M Na2HPO4, 8 parts 0.1 M citric acid, pH 7.8) and incubated at RT for 15 min to extract low molecular weight DNA before staining (Gong et al. 1994).
Ethanol Fixation and Cell Staining
CHO cells were harvested from suspension culture by centrifugation at RT for 5 min at 200 X g and ethanol-fixed as described above to yield a final cell concentration of 1.0 × 10⁶/ml in 70% ethanol. Cells were fixed for at least 24 h, before staining. For staining, cells were centrifuged at RT for 5 min at 200 X g and the fixative aspirated. Stock solutions of DAPI (Molecular Probes; Eugene, OR) were prepared at 1 mg/ml in distilled H2O or D2O, HO (Calbiochem; La Jolla, CA) or MI (Pfizer Laboratories; Groton, CT) was mixed at 1 mg/ml in either PBS, pH 7.0, or D2O with 0.15 M NaC1 (D2O-saline, pH 7.1). Stock solutions of 7-AAD (Molecular Probes) and EthD II (Molecular Probes) were mixed at 1 mg/ml in DMSO and further diluted in PBS or D2O-saline before staining. TOTO (Molecular Probes) or YOYO (Molecular Probes) was obtained at 1 mM in DMSO and was diluted in PBS or D2O-saline before staining. Cells were resuspended in either PBS or D2O-saline at 1 × 10⁶ cells/ml containing RNASE (Sigma) at a concentration of 50 μg/ml. For staining with MI, MgCl2 was added to 5 mM. For the fluorochromes used, the modes of fluorochrome-DNA interaction and
DNA fluorochromes: modes of binding and DNA base sequence specificity a
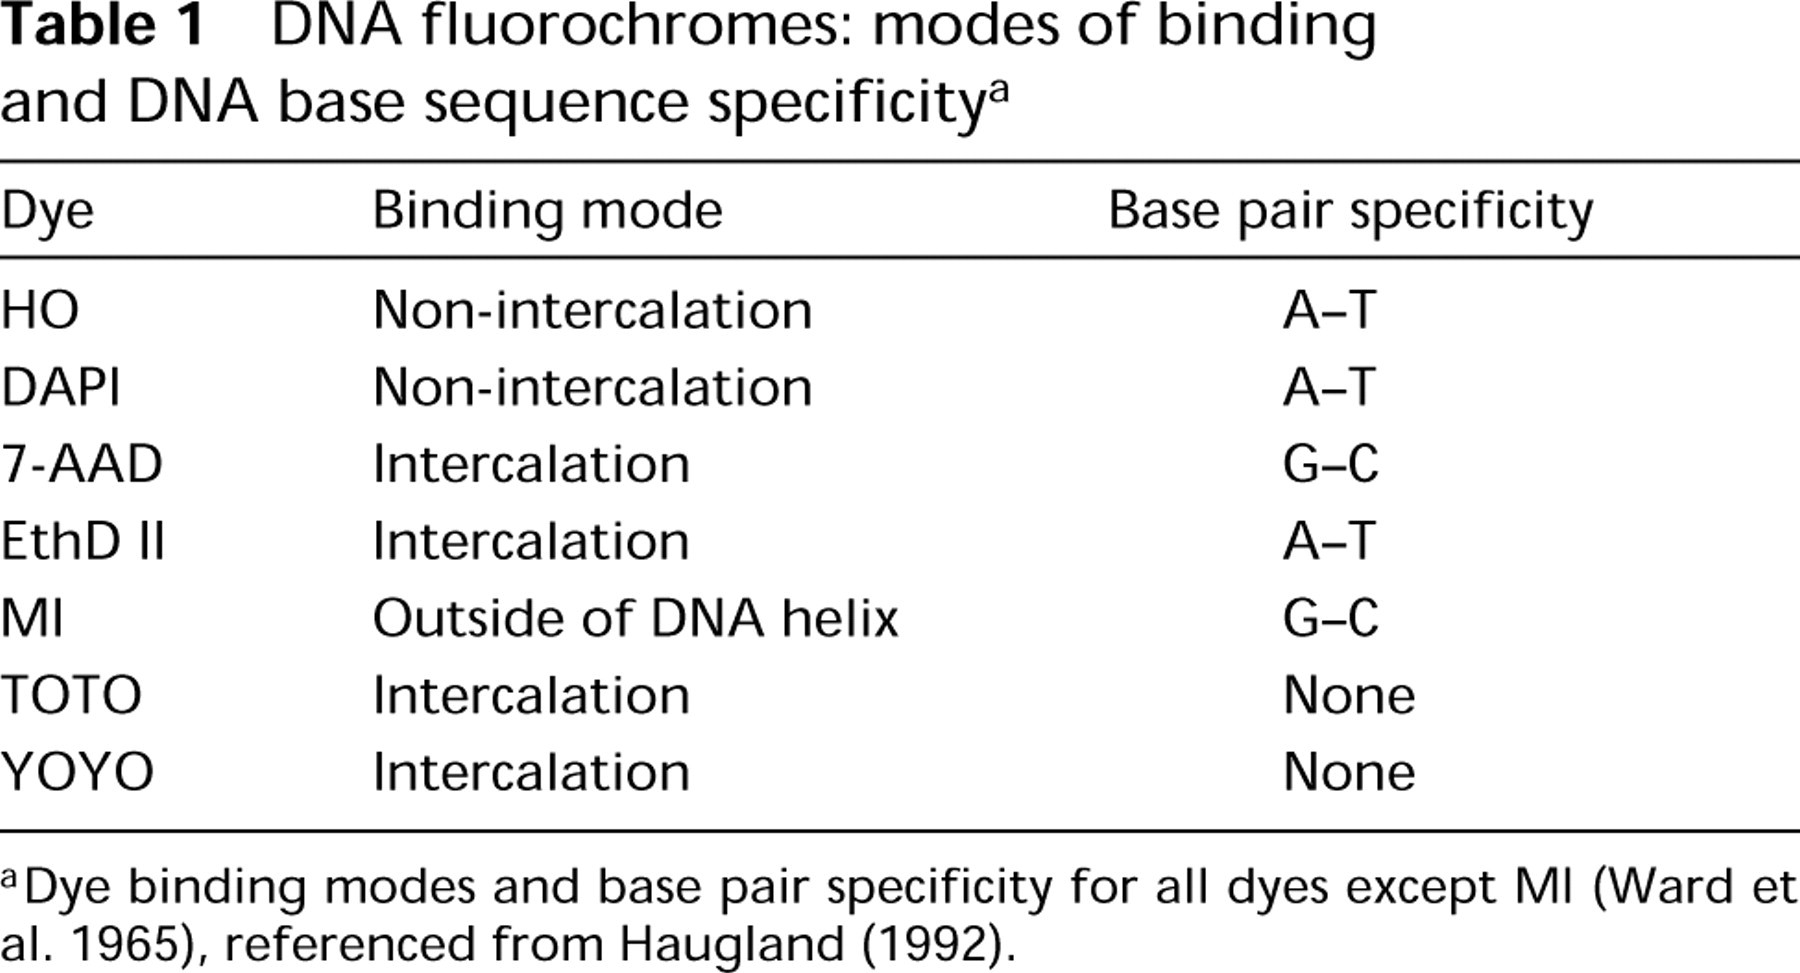
aDye binding modes and base pair specificity for all dyes except MI (Ward et al. 1965), referenced from Haugland (1992).
Spectrofluorometric Analysis
Spectrofluorometric scans of the fluorochromes were performed using a computer-driven SPEX (Edison, NJ) Fluorolog 1680 0.22 m double spectrometer with a 500-W xenon lamp source. All entrance and exit slits were set at 0.5 mm during sample runs. Free dye in solution, calf thymus DNA (Sigma) with fluorochromes in solution (50 μg/ml), or fixed and stained CHO cells were analyzed. Dye concentrations used for spectrophotometry were 0.5 μg/ml HO, 1.0 μg/ml DAPI, 20 μg/ml EthD II, 20 μg/ml 7-AAD, 5 μg/ml MI, 1 μg/ml TOTO, and 1 μg/ml YOYO.
Conventional Flow Cytometry
Flow cytometric measurements were performed on a Los Alamos flow cytometer (Steinkamp et al. 1982, 1991). An Innova 90-5 argon ion laser (Coherent; Palo Alto, CA) operating at 488 nm (300 mW) was used as the excitation source for TOTO and YOYO, 457 nm (200 mW) for MI, and 514 nm (300 mW) for 7-AAD and EthD II. A Innova Krypton laser (Coherent) was used for
Lifetime Flow Cytometry
Fluorescence lifetime measurements were performed on the Los Alamos phase-sensitive flow cytometer which has been described in detail (Steinkamp and Crissman 1993; Steinkamp et al. 1993). Stained cells were excited by a cw laser beam from an Argon ion laser (Model 2025; Spectra Physics, Palo Alto, CA), with the intensity being sinusoidally modulated at 29 MHz. Excitation wavelengths for the various fluorochromes were:
Percent increase in fluorescence intensity of different fluorochromes bound to different substrates in D2O compared to PBS a
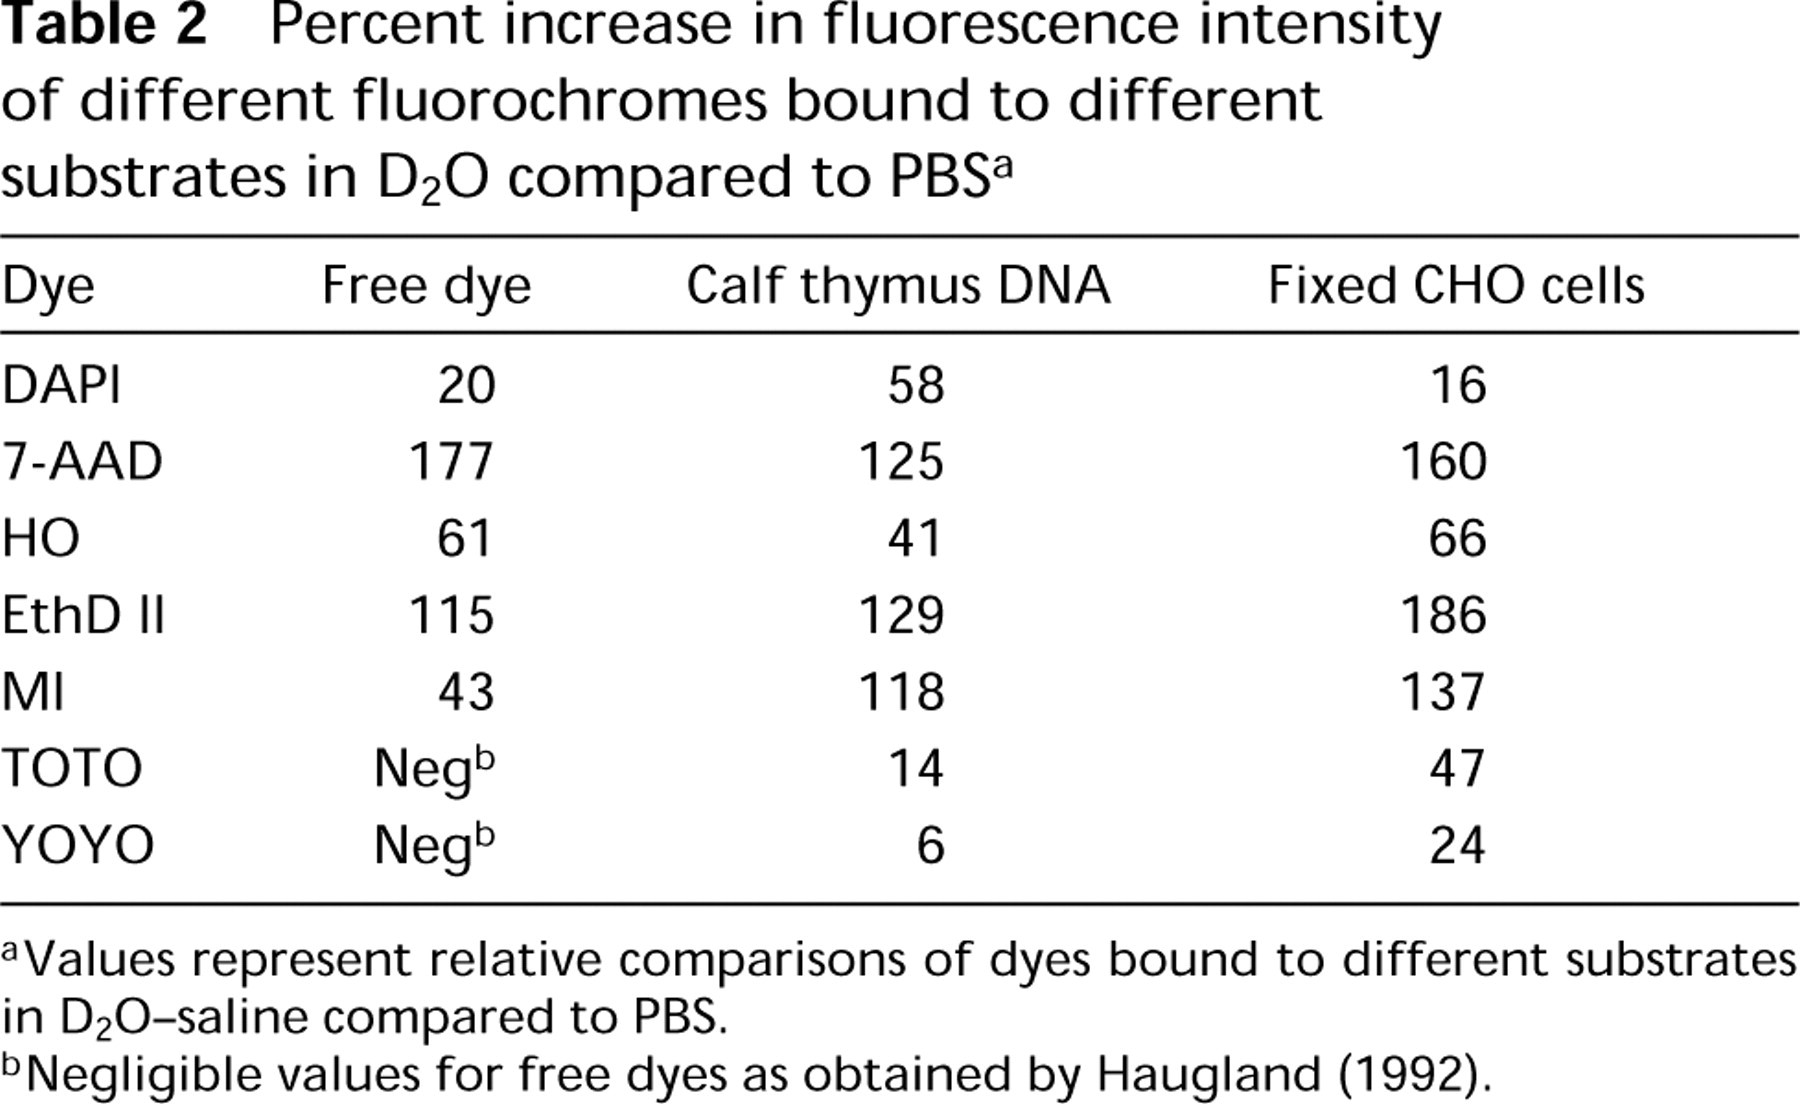
aValues represent relative comparisons of dyes bound to different substrates in D2O-saline compared to PBS.
bNegligible values for free dyes as obtained by Haugland (1992).
Statistical Analysis
Descriptive statistics and t-tests were performed in Microsoft Excel (Microsoft; Redmond, WA). Results are expressed as the mean ± SEM of at least three experiments.
Results
Comparison of Fluorescence Intensity and Spectral Alterations of Fluorochromes in PBS or D2O-Saline Bound to Calf Thymus DNA and Stained CHO Cells
The use of D2O-saline in place of PBS as the solvent in spectral studies resulted in increased fluorescence emission intensities for all of the free, unbound dyes in solution (except for TOTO and YOYO, which have no appreciable fluorescence except when DNA-bound), ranging from 20% to 177%. In order of increasing enhancement by D2O were DAPI<MI<HO<EthD II<7-AAD (Table 2). When bound to calf thymus DNA, all of the dyes exhibited a 6-129% increase in fluorescence intensity in D2O-saline compared to PBS, with the dyes ordered by increasing enhancement: YOYO<TOTO<HO<DAPI<MI<7-AAD<EthD II (Table 2). When bound to fixed, RNASE-treated CHO cells the fluorescence enhancement in D2O-saline compared to PBS was 16-186%, with the dyes ranked as: DAPI<YOYO<TOTO<HO<MI<7-AAD<EthD II (Table 2).
Changes in the excitation peaks shown in Table 3 were observed among the different substrates utilized (free dye, calf thymus DNA, fixed CHO cells, respectively) for DAPI (all p<0.05). HO, EthD II, and MI showed changes in excitation peak only between the free dye in solution and bound to DNA, either calf thymus DNA or within fixed CHO cells (all p<0.05). 7-AAD showed changes in excitation peak between either the free dye in solution or within fixed CHO cells and bound to calf thymus DNA (p<0.05). Although changes in the excitation spectra were noted for the different substrates, only minor changes were observed when the solvent used was either D2O-saline or PBS (all p>0.05). Changes were noted in the emission peak wavelength for 7-AAD (free dye or within fixed CHO cells vs calf thymus DNA; p<0.05), HO (all p<0.05), and EthD II (all p<0.05) among the different substrates. Only minor changes were noted in the emission spectra when the stained substrates in PBS or D2O-saline were compared, except for the change in emission peak for free DAPI in solution between PBS and D2O-saline (440 to 460 nm, respectively; p<0.01).
Excitation and emission peak comparisons of fluorochromes in D2O and PBS [expressed in nm (Ex/Em)] a
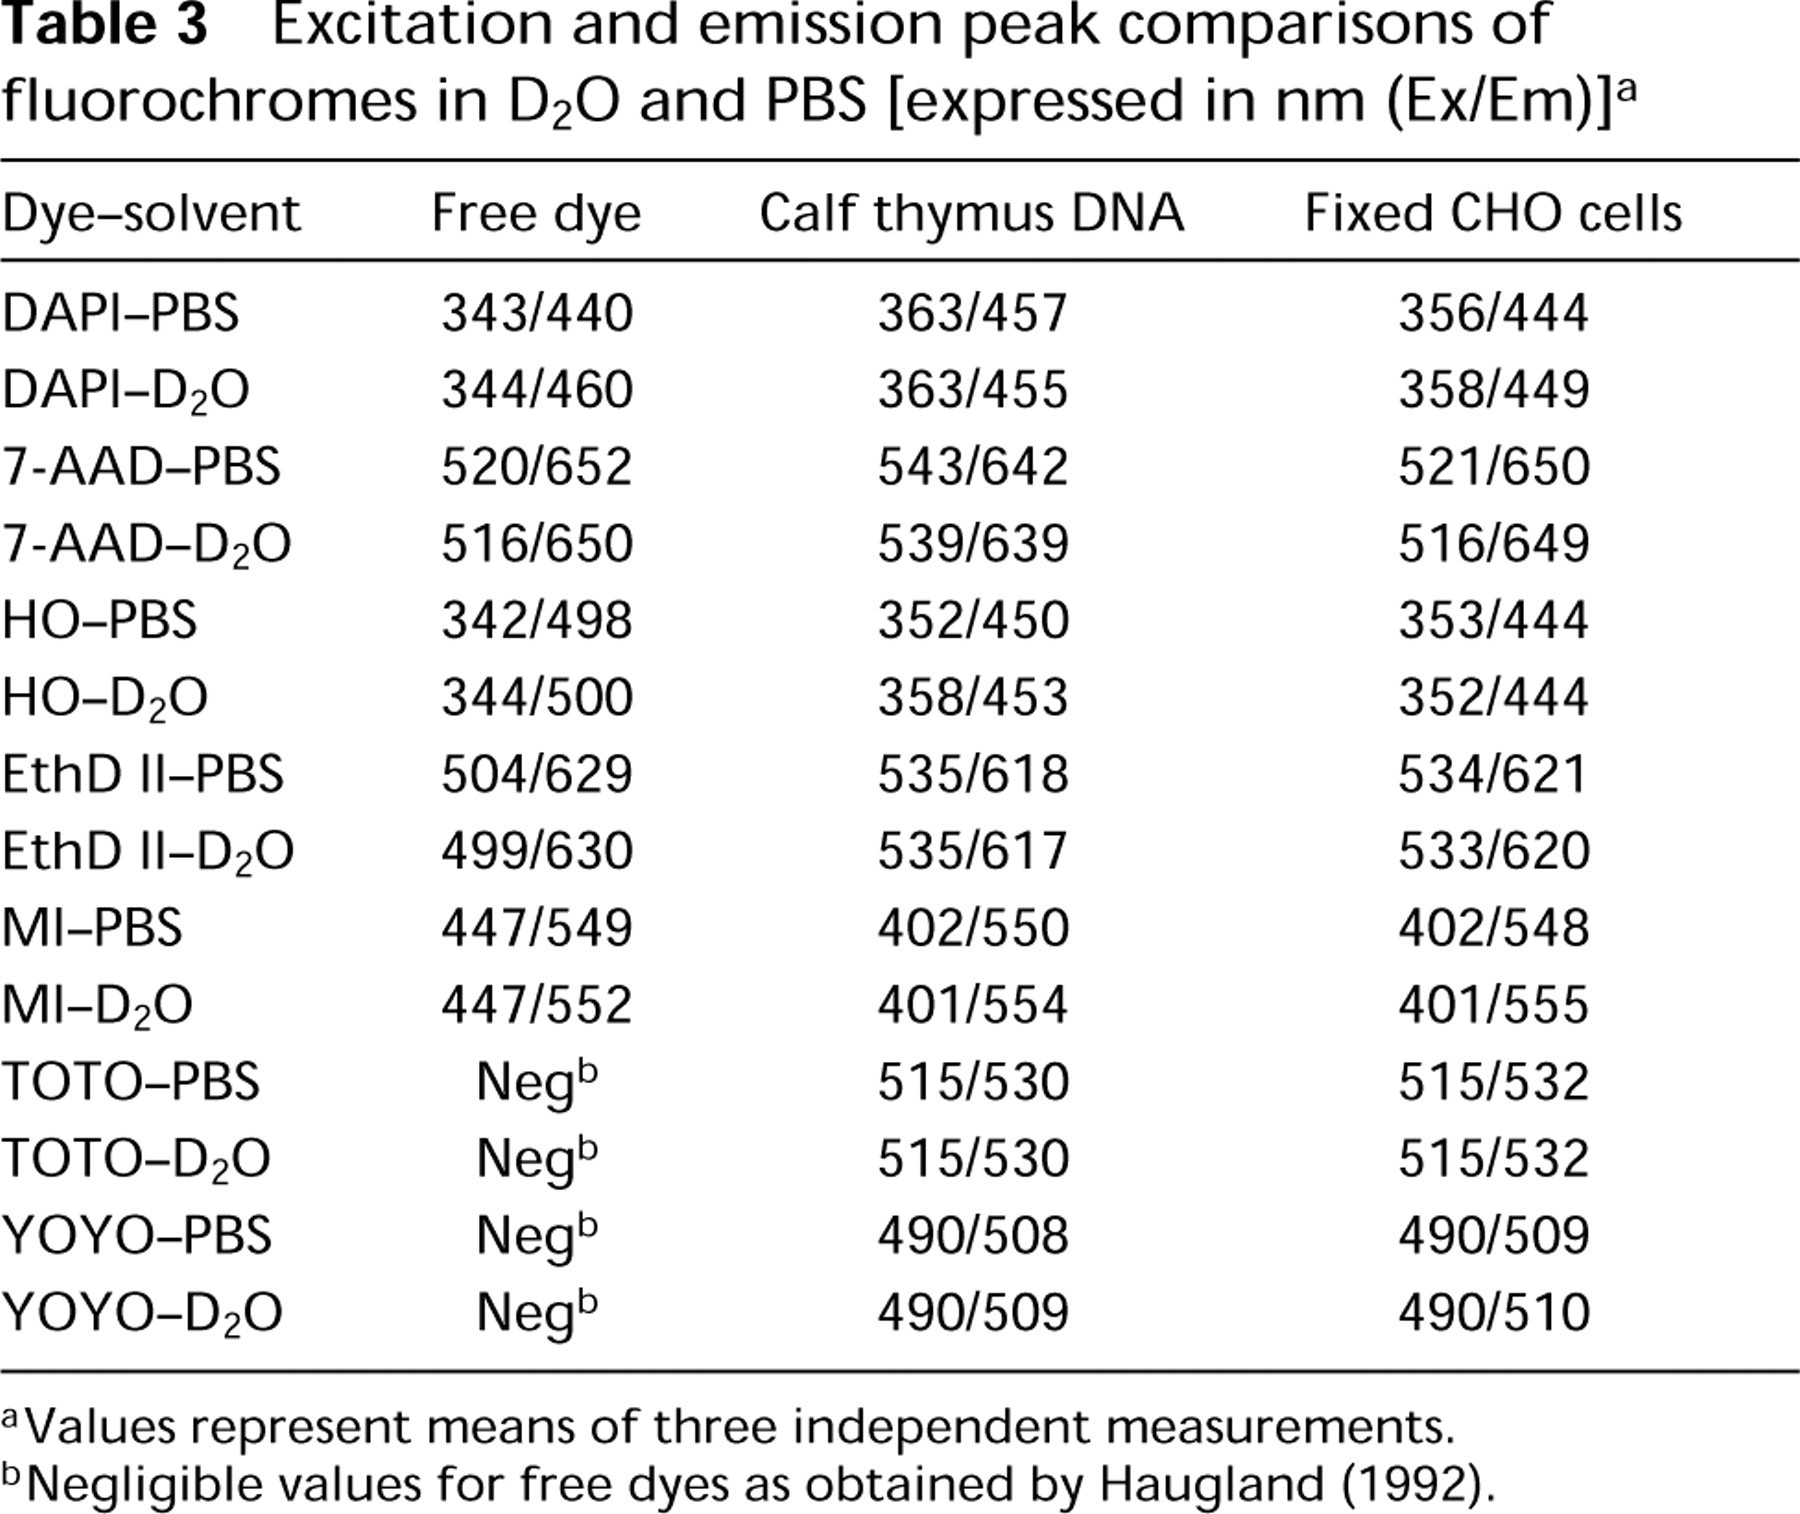
aValues represent means of three independent measurements.
bNegligible values for free dyes as obtained by Haugland (1992).
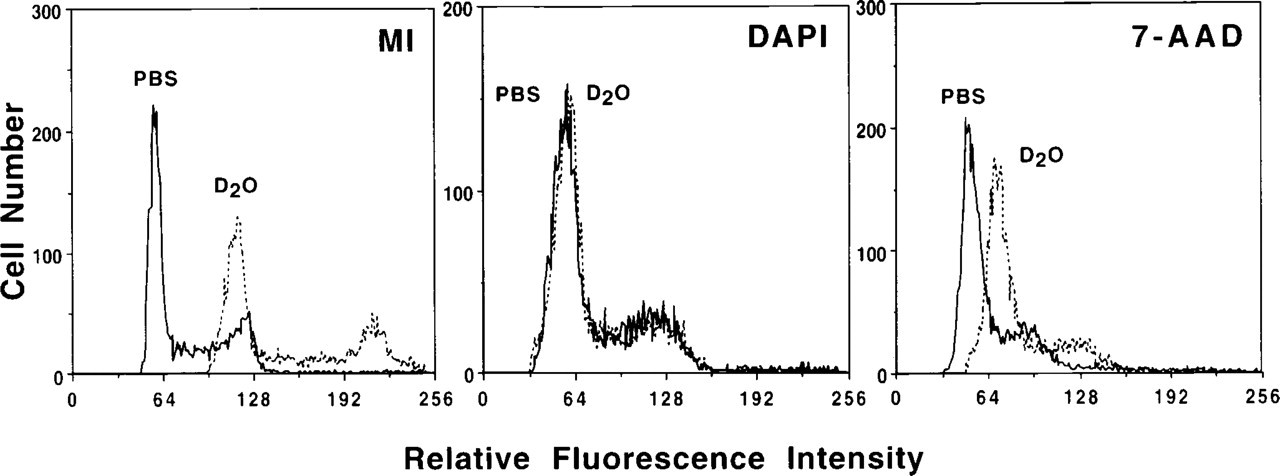
DNA content histograms illustrating the enhancement of fluorescence intensity for fixed CHO cells stained in D2O-saline vs PBS. The mean of the G0/G1 peak in D2O-saline compared to PBS was increased 150.5 ± 37.5% for MI (p<0.01), 34.5 ± 2.1% for 7-AAD (p<0.01), and only 9.2 ± 8.4% for DAPI (p>0.05). MI had the largest increase in fluorescence intensity, followed by the intercalating probes and the non-intercalating probes.
Conventional Flow Cytometric Fluorescence Intensity Measurements Using Various Solvent Ratios of PBS to D2O-Saline
The effects of PBS on the fluorescence enhancement provided by D2O was determined using conventional flow cytometric analysis of fixed CHO cells stained in mixture ratios of PBS to D2O-saline with 10% volume increments from 100% PBS to 100% D2O-saline. Figure 1 illustrates the enhancement of fluorescence intensity when samples were stained in 100% D2O-saline vs 100% PBS for MI, DAPI, and 7-AAD. Fluorochrome intensity enhancement in D2O varied, with the increase of the mean G0/G1 peak value from 100% PBS to 100% D2O-saline ranging from 7.7 to 150.5% (Table 4). Figure 2 shows examples of the fluorochrome responses to various mixture ratios of PBS to D2O-saline. The mean value of the G0/G1 peak was linearly correlated with the percent PBS for EthD II (r 2=0.952), MI (r 2=0.986), and for TOTO (data not shown; r 2=0.941) (all p<0.05). The probes 7-AAD, HO, and YOYO were not affected linearly by the addition of D2O-saline (data not shown). 7-AAD showed a constant mean G0/G1 peak value from 100% PBS until a ratio of 40% PBS:60% D2O-saline, at which point the mean increased (p<0.05). For HO, this shift occurred at 40% PBS:60% D2O-saline (p<0.05), and for YOYO occurred at 70% PBS:30% D2O-saline (p<0.05). G0/G1 peak mean values for DAPI (data not shown) were only slightly decreased over the range of mixture ratios (p>0.05). For dyes that changed linearly over the range of mixture ratios, the slope of the regression line is another indicator of how D2O-saline affects the fluorescence intensity. The slope for MI (-0.87 ±0.15) is larger than for TOTO (-0.03±0.04) or EthD II (-0.34±0.09) (both p<0.01), indicating that PBS has a greater quenching effect on MI fluorescence.
Fluorescence Lifetime of DNA Fluorochromes
For phase-sensitive flow cytometric lifetime measurements, each of the fluorochromes was utilized to stain fixed CHO cells in PBS, and Figure 3 illustrates the fluorescence lifetime histograms obtained. Lifetime values for the probes were: 2.7 ± 0.05 nsec for DAPI, 2.3± 0.06 nsec for HO, 1.5 ± 0.02 nsec for MI, 0.8 ± 0.002 nsec for 7-AAD, 10.0 ± 0.45 nsec for EthD II, 2.2 ± 0.14 nsec for TOTO, and 2.1 ± 0.09 nsec for YOYO. PI and EB had lifetime values of 15 ± 0.5 and 19.5 ± 0.4 nsec, respectively.
Percent increase in mean G0/G1 peak value for samples stained in D2O-saline vs PBS a
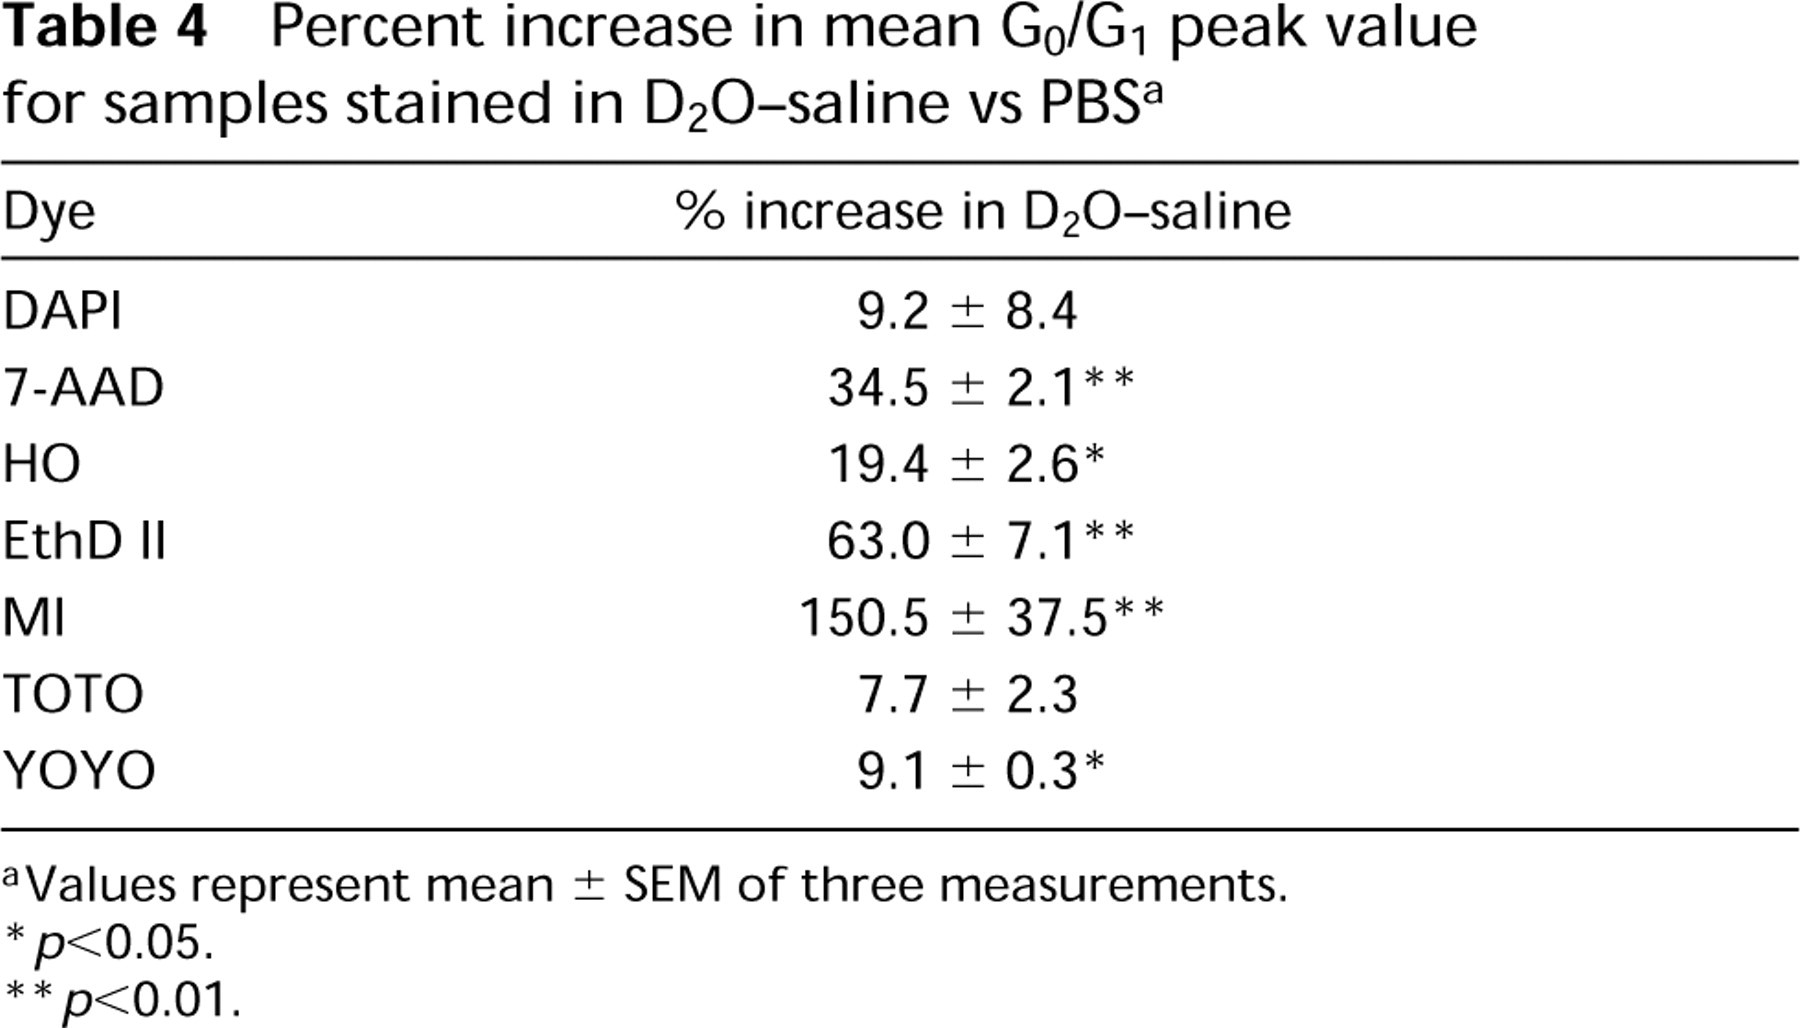
aValues represent mean ± SEM of three measurements.
∗ p<0.05.
∗∗ p<0.01.
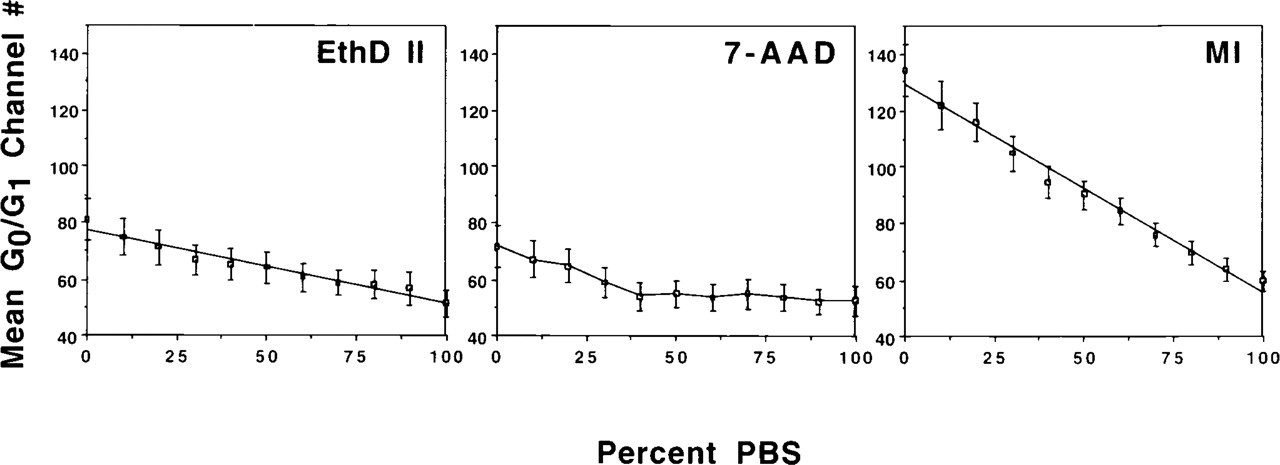
Enhancement of fluorescence intensity for fixed CHO cells stained in various mixture ratios of PBS to D2O-saline. Various responses were noted for the fluorochromes: (a) a linear response from 100% PBS to 0% PBS (100% D2O-saline), as shown for EthD II and MI, and (b) a variable response, shown for 7-AAD, in which the fluorescence intensity dropped suddenly with increasing proportions of PBS and then remained constant. Points represent the means of three measurements; error bars represent the SEM.
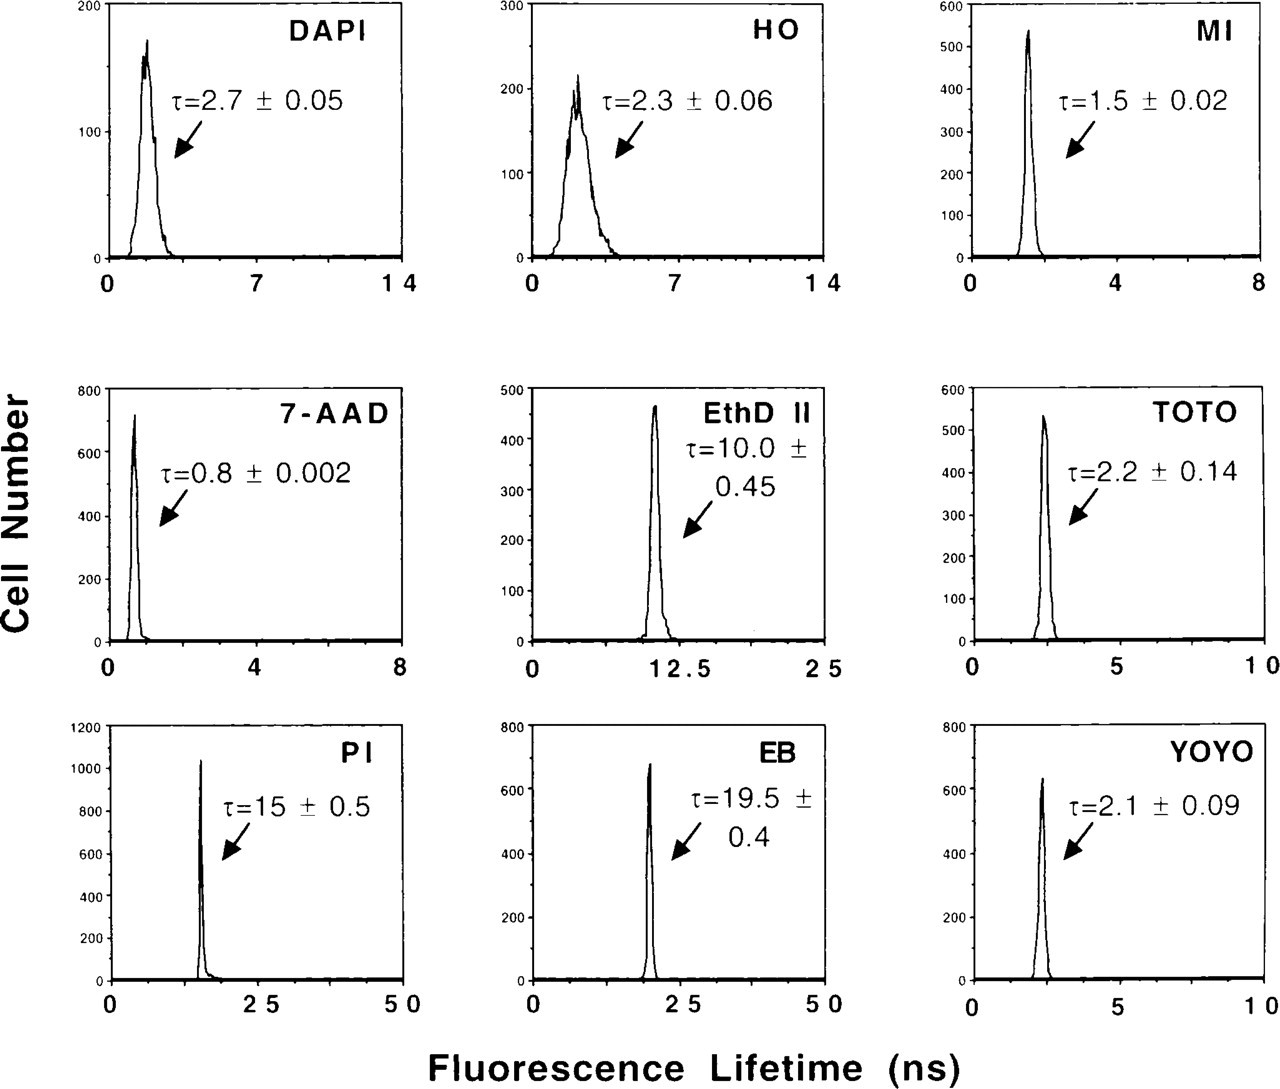
Fluorescence lifetime histograms for fixed CHO cells stained in PBS with various DNA fluorochromes. Fluorescence lifetime values for the dyes were: 2.7 ± 0.05 nsec for DAPI, 2.3 ± 0.06 nsec for HO, 1.5 ± 0.02 nsec for MI, 0.8 ± 0.002 nsec for 7-AAD, 10.0 ± 0.45 nsec for EthD II, 2.2 ± 0.14 nsec for TOTO, 2.1 ± 0.09 nsec for YOYO, 15 ± 0.5 nsec for PI, and 19.5 ± 0.4 nsec for EB.
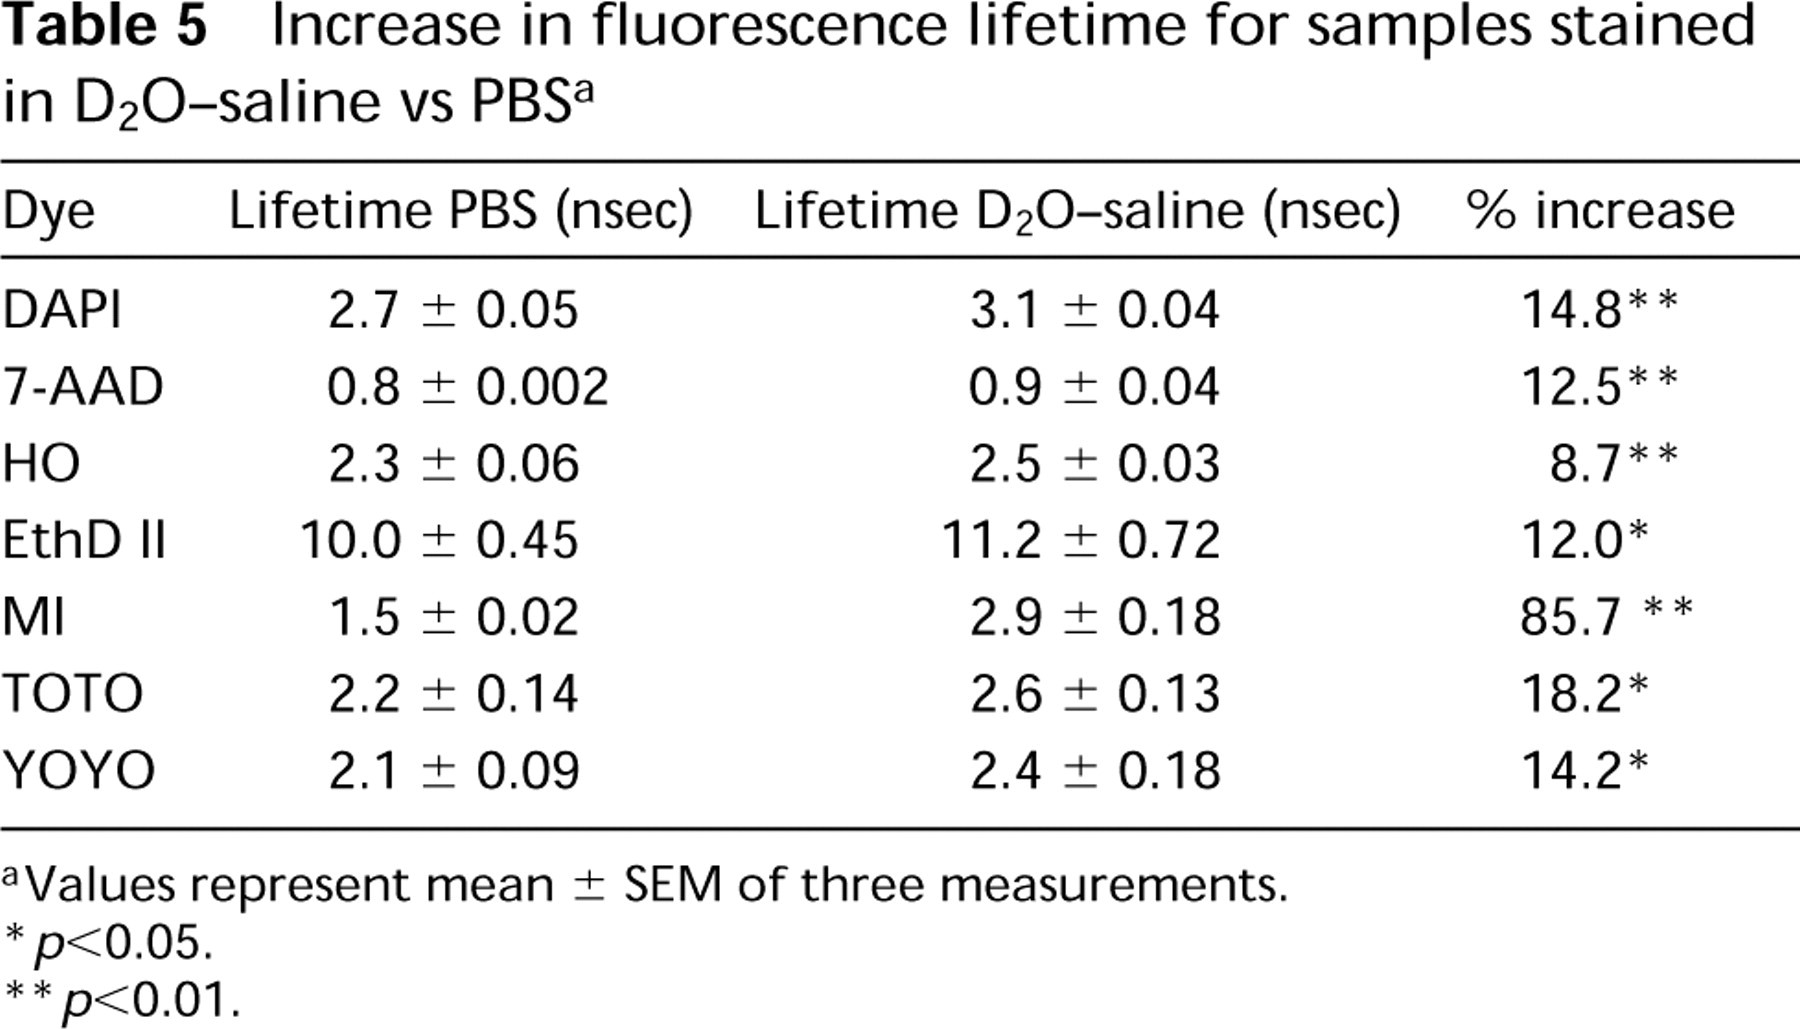
Fluorescence Lifetime Alterations in D2O
Figure 4 illustrates the effects of D2O on fluorescence lifetime for DAPI-, MI-, and EthD II-stained CHO cells. At dye concentrations somewhat routinely utilized for DNA content analysis by flow cytometry, all of the fluorochromes showed an increase in fluorescence lifetime when staining was performed in D2O-saline vs PBS (Table 5). Significant increases in fluorescence lifetime in D2O-saline were seen for all of the fluorochromes. The increase of fluorescence lifetime in D2O-saline for the fluorochromes parallels the spectral and conventional flow cytometric intensity observations, in which the intercalating fluorochromes 7-AAD and EthD II and the non-intercalating MI exhibit the largest increases.
Fluorescence Lifetime Alterations with Increasing Dye Concentration
Figure 5 illustrates the change in fluorescence lifetime in D2O-saline vs PBS with increasing dye concentrations for MI, 7-AAD and TOTO. MI showed an increasing lifetime up to staining concentrations of 1 μg/ml, but lifetime values decreased at higher dye concentrations. All of the other probes showed the highest fluorescence lifetime at the lowest dye concentrations, with the lifetimes decreasing as the dye concentration increased. One exception was the sample stained with 100 μg/ml 7-AAD in D2O-saline, in which the lifetime increased compared to the sample stained with 10 μg/ml (p<0.05). In most cases, samples stained in D2O-saline had a higher lifetime than the corresponding sample in PBS. The only exception was for 7-AAD (Figure 5) at 0.01 μg/ml dye concentration, for which the lifetime for the sample in PBS was 30.8% higher (p<.05) than the sample in D2O-saline (1.7 ± 0.17 and 1.3 ± 0.56 nsec, respectively).
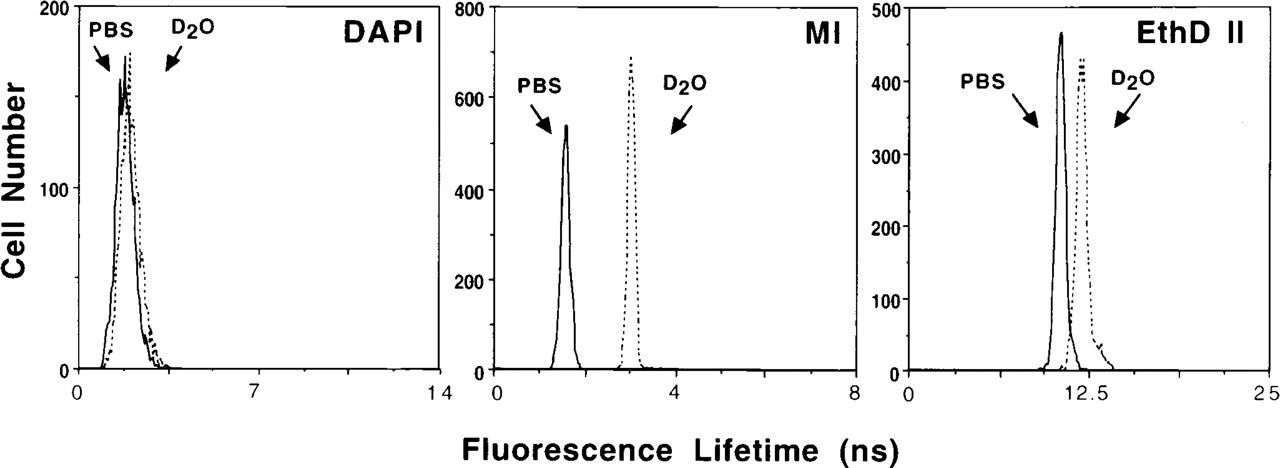
Fluorescence lifetime histograms illustrating the increase in fluorescence lifetime for fixed CHO cells stained with DAPI, MI, or EthD II in D2O-saline vs PBS. Fluorescence lifetime for DAPI-stained CHO cells in D2O-saline compared to PBS increased 14.8% (1.0 μg/ml, 2.7 ± 0.05 to 3.1 ± 0.04 nsec; p<0.01), 85.7% for MI (10 μg/ml, 1.5 ± 0.02 to 2.9 ± 0.18 nsec; p<0.01), and 12.0% for EthD II (10 μg/ml; 10.0 ± 0.45 to 11.2 ± 0.72 nsec; p<0.05).
Differential Stainability of Apoptotic Subpopulations in D2O-Saline Compared to PBS
Apoptotic cell subpopulations are apparent in a DNA content histogram as a sub-G0/G1 peak after treatment of HL-60 cells with CAM for 3 hr, ethanol fixation, and PC buffer extraction of low molecular weight DNA. Depending on the dye used for staining, the apoptotic subpopulations are shifted disproportionately from the non-apoptotic G0/G1 peak in D2O-saline compared to PBS (Table 6).
Fluorescence Lifetime of Apoptotic Subpopulations
Figure 6 illustrates the change in fluorescence lifetime for apoptotic cells stained with EthD II in PBS (Figures 6A and 6E) or D2O-saline (Figures 6B and 6F). In PBS, the lifetime of the apoptotic subpopulation was 26% lower than that of the non-apoptotic cells (7.2 ± 0.18 and 9.8 ± 1.2 nsec, respectively; p<0.01), and in D2O-saline the apoptotic subpopulation was 25% lower (7.9 ± 0.3 and 10.5 ± 1.4 nsec, respectively; p<0.01). When stained with the other fluorochromes utilized in this study, such as MI (Figures 6C and 6G, PBS; Figures 6D and 6H, D2O-saline), the apoptotic subpopulation did not have a different lifetime from that of the non-apoptotic cells (all p>0.05). In Figure 6B, a shoulder appears next to the peak representing the non-apoptotic cells in the sample stained with EthD II in D2O-saline, and is apparently a portion of the G0/G1 sub-population (Figure 6F). It is possible that we are measuring a subset of the G0/G1 population, but further study will be required before this determination can be made.
Increase in fluorescence lifetime for samples stained in D2O-saline vs PBS a
aValues represent mean ± SEM of three measurements.
∗ p<0.05.
∗∗ p<0.01.
Percent increase in fluorescence intensity of apoptotic and non-apoptotic subpopulations for samples stained in D2O-saline vs PBS a
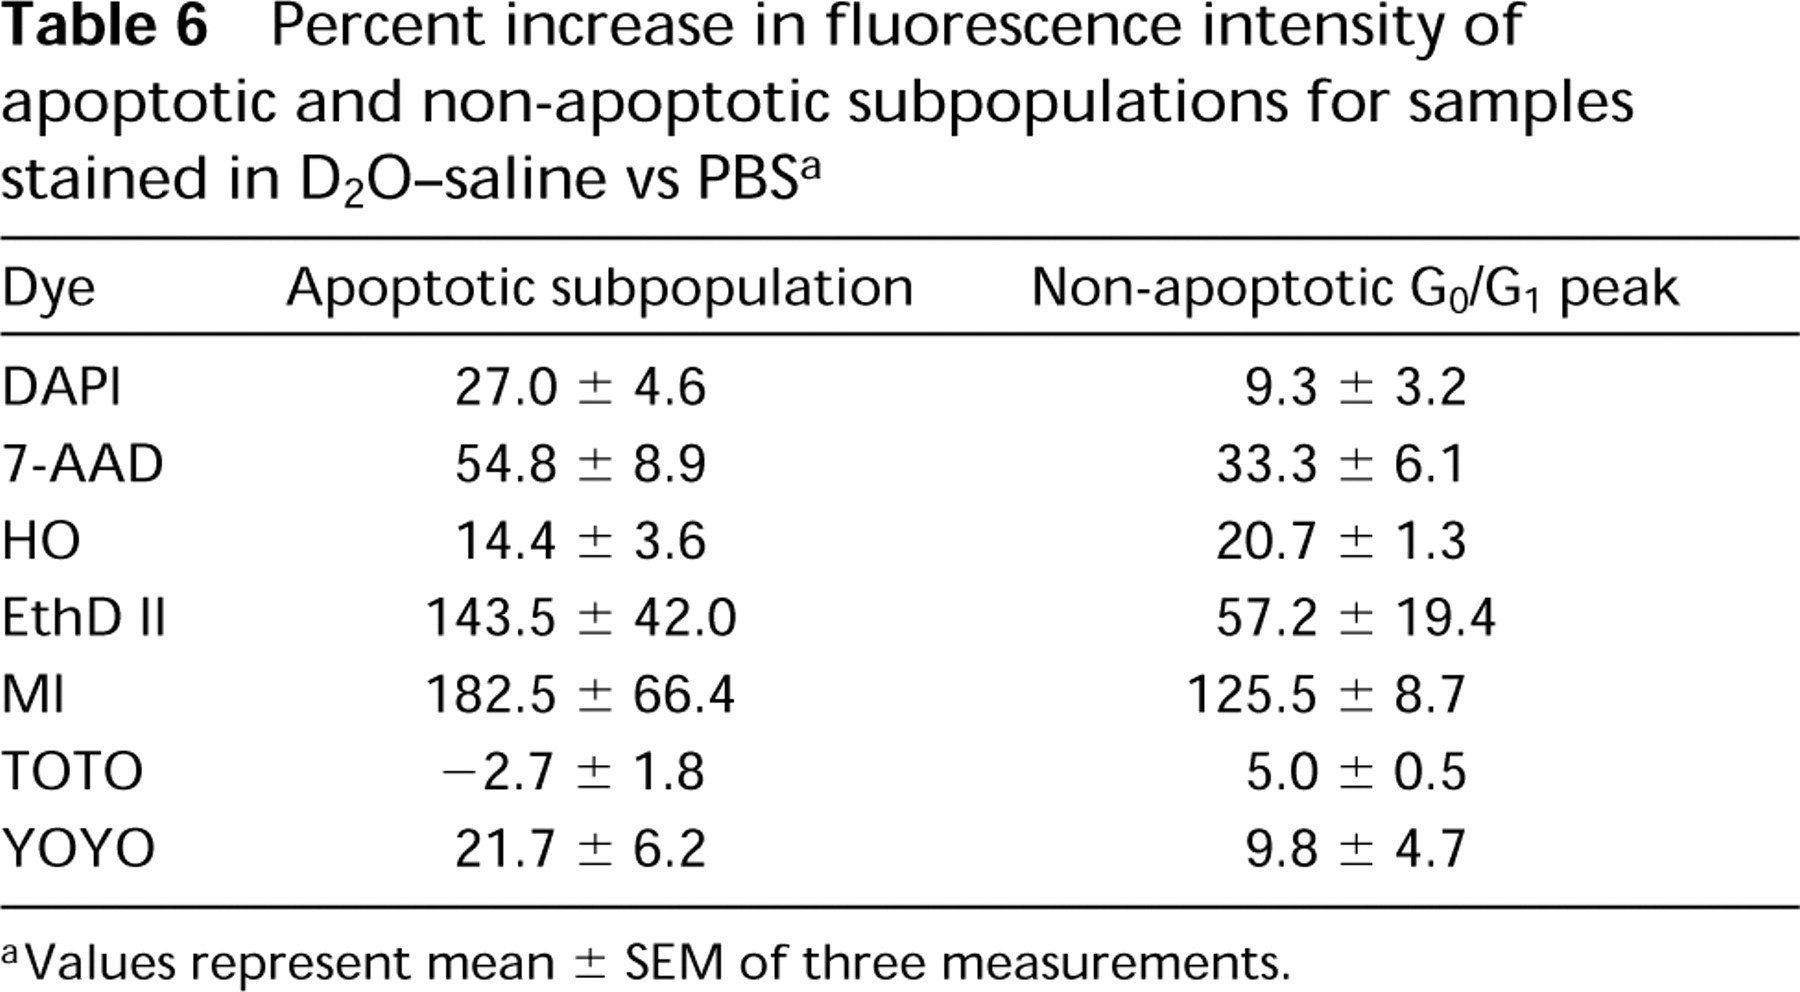
aValues represent mean ± SEM of three measurements.
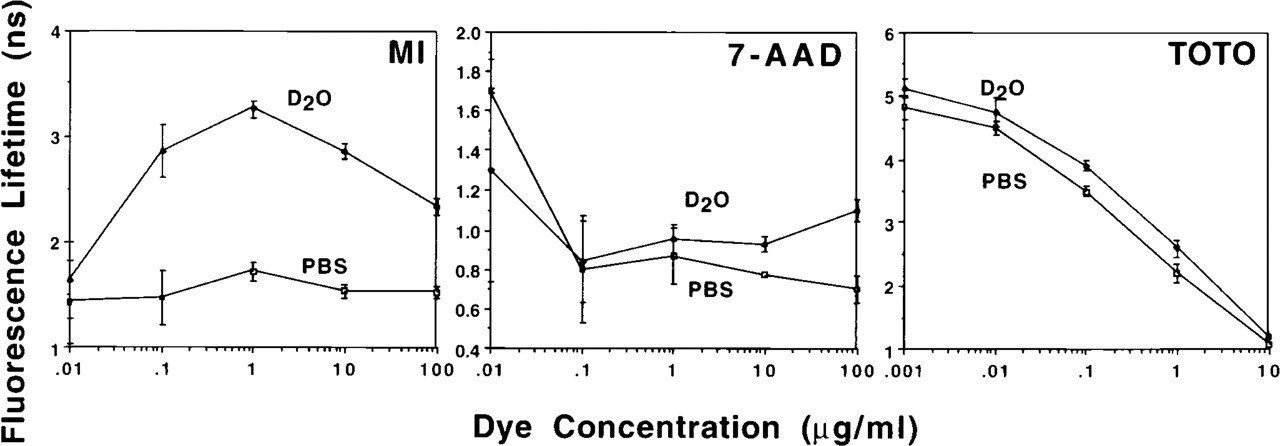
Change in fluorescence lifetime with increasing dye concentration for MI-, 7-AAD-, and TOTO-stained CHO cells. At high dye concentrations, fluorescence lifetimes decreased, indicating that dye-dye self-quenching was occurring. Samples stained in D2O-saline had greater lifetime values than the corresponding sample stained in PBS, the only exception being samples stained with 0.01 μg/ml 7-AAD. Points represent the means of three measurements; error bars represent the SEM.
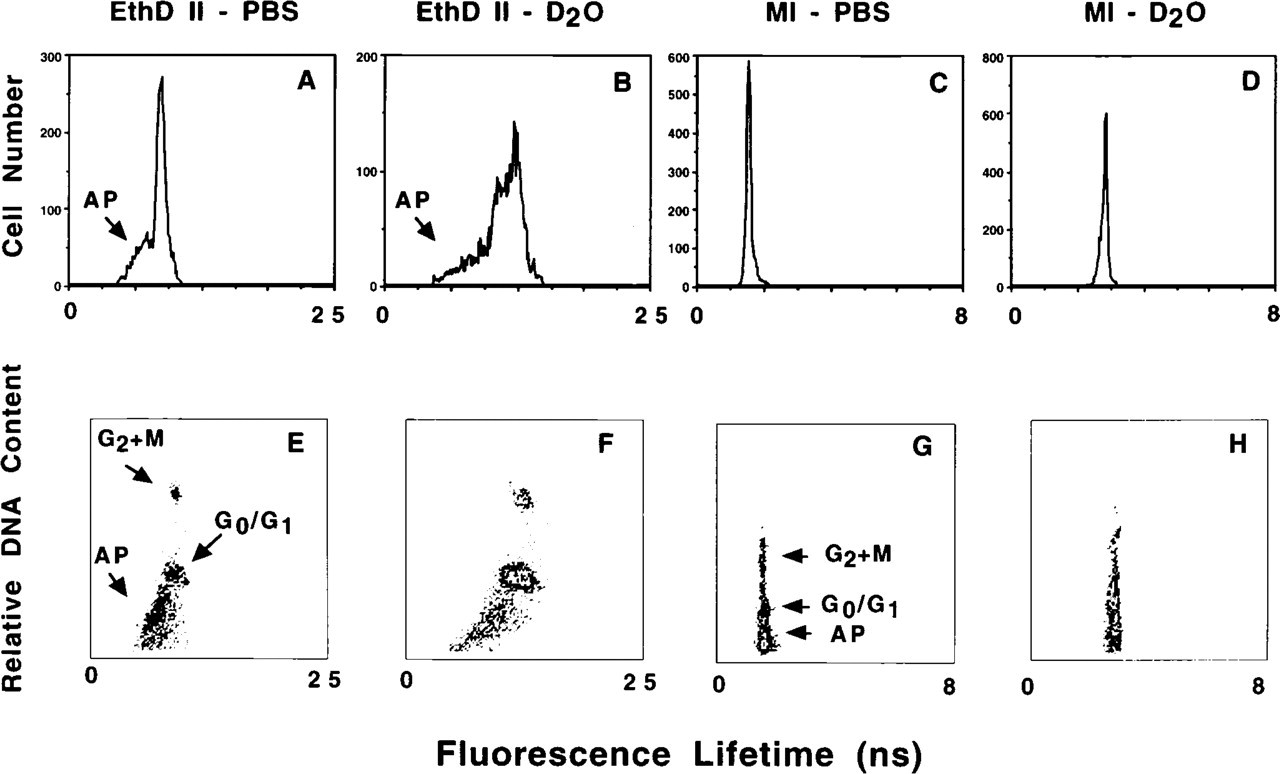
Fluorescence lifetime of camptothecin treated HL-60 cells after extraction of low molecular weight DNA. Fluorescence lifetime histograms for cells stained with EthD II in PBS (
Discussion
The fluorochromes analyzed in this study have been used previously for the spectroscopic quantification of DNA (Barcellona and Gratton 1990; Van Lancker and Gheyssens 1986; Kapuscinski and Szer 1979), by flow cytometry (Crissman and Hirons 1994; Hirons et al. 1994; Schmid et al. 1992; Evenson et al. 1986; Darzynkiewicz et al. 1984) and for analysis of DNA after gel electrophoresis (Glazer et al. 1990; Nairn et al. 1982). In this study we compared the effects of D2O and PBS on the intensity and lifetime of different DNA fluorochromes by flow cytometry. Spectroscopically, all of the dyes examined (see Table 1) showed an increase in fluorescence intensity when staining was performed in D2O-saline vs PBS (Table 2), but, with the exception of the emission peak of unbound DAPI in solution, only minor changes in the excitation or emission peaks were noted in the DNA-bound fluorochromes between PBS and D2O-saline. The absence of change in the excitation and emission peak wavelengths among identically prepared PBS- and D2O-saline-stained samples indicates that D2O does not spectrally alter the binding of the probe to the substrate, affecting only the fluorescence properties of the probes. Our study did demonstrate changes in the peak excitation wavelength when the dyes were bound to the different substrates. These alterations are postulated to indicate different binding modes of the dyes and changes in the accessibility of the dye molecules to the solvent environment (Heller and Greenstock 1994).
Phase-sensitive flow cytometric analysis of the DNA-binding fluorochromes provided fluorescence lifetime values in accord with previously published results (Netzel et al. 1995; Hochstrasser and Millar 1992; Wadkins and Jovin 1991; Barcellona and Gratton 1990; Barcellona et al. 1990; Olmsted and Kearns 1977). These results indicate that our flow cytometric measurements of fluorescence lifetimes are accurate, and provide a valuable new parameter for single-cell analyses.
Flow cytometric analysis showed that the various fluorochromes are affected by D2O in a similar manner, but to a degree that is dependent on their mode of DNA binding. The fluorescence intensities of DAPI, HO, TOTO, and YOYO were not enhanced dramatically when they were bound to fixed CHO cells, as was the case for 7-AAD, EthD II, and MI in this study, or for PI and EB in our previous study (Sailer et al. 1996). These results indicate that differences in the DNA-fluorochrome interaction, or in solvent accessibility of the fluorochrome once bound to DNA, affect the intensity enhancement effects of D2O. Intercalating probes that bind without base specificity, such as PI and EB (Haugland 1992), are enhanced in intensity and lifetime to the greatest degree, followed by the intercalating probes 7-AAD and EthD II and the minor groove, non-intercalative binding MI. Intercalating probes, such as TOTO and YOYO, and the non-intercalating A-T probes, DAPI and HO, are enhanced the least. Because TOTO and YOYO are much larger than the other intercalating probes, they may be more accessible to the solvent environment when bound, and therefore may be quenched to a greater extent by the solvent environment than are the smaller intercalating probes. The non-intercalating DAPI and HO also appear to be more accessible to the solvent environment. However, MI, another non-intercalating fluorochrome, may be shielded from the solvent environment once bound to the DNA, and therefore demonstrates a large enhancement of fluorescence intensity in D2O. On the basis of its mode of DNA binding, MI would have been expected to show results similar to HO and DAPI. When the structures of the various dye molecules are compared, MI has a large number of sites that can be protonated by D2O (Haugland 1992). Protonation by D2O has been hypothesized to lead to a decrease in the proton transfer rate between fluorochrome and solvent (Olmsted and Kearns 1977), leading to a longer time in the excited state, enhancing the fluorescence intensity, and leading to longer fluorescence lifetime values.
In our studies utilizing a range of dye concentrations, fluorescence lifetime decreased concomitant with increasing dye concentrations. This decrease in fluorescence lifetime may be due to fluorescence quenching, a process that reduces the quantum yield of a probe without changing the fluorescence spectrum (Haugland 1992; Lakowicz 1983). One source of quenching involves energy transfer between dye molecules that are bound in close proximity on the substrate, and this dye-dye self-quenching has been noted previously (Haugland 1992; Dörr 1983; Lakowicz 1983). At low dye concentrations, D2O enhances the fluorescence lifetime by limiting the quenching effect of solvent on the dye molecules. At high dye concentrations, however, D2O-induced enhancement in lifetime is usually diminished, indicating that self-quenching between dye molecules supersedes the effects of the D2O on the individual dye molecules.
Apoptosis, or programmed cell death, is characterized by internucleosomal cleavage of nuclear DNA which can be extracted from the cells after permeabilization of the cell membrane (Gong et al. 1994). The remaining nuclear DNA represents nucleosomes and fragments of DNA loops attached to the nuclear matrix (Darzynkiewicz et al. 1992), and apoptotic cells with reduced DNA content after extraction of low molecular weight DNA are regarded as a hallmark of the apoptotic process (Gong et al. 1994; Darzynkiewicz et al. 1992). In addition, our study shows further altered fluorochrome binding to the DNA within apoptotic cells. Specifically, D2O enhances the fluorescence intensity of fluorochrome bound within apoptotic subpopulations, although not to the same extent as within non-apoptotic cells, indicating that solvent access to the bound fluorochrome within the apoptotic subpopulation may be different owing to the structure of the remaining chromatin, or that fluorochrome-DNA interactions may be changed on binding to the damaged chromatin within apoptotic cells. Moreover, we have shown in this study that subpopulations of apoptotic cells stained with EthD II, and with PI and EB in our previous study (Sailer et al. 1996), have a lower fluorescence lifetime than non-apoptotic cells, suggesting an altered interaction between DNA and the fluorochromes within the apoptotic subpopulation. However, not all the fluorochromes utilized in this study yielded detectable or decreased lifetime values for the apoptotic subpopulation. This appears to indicate that the DNA-binding properties of some fluorochromes are not altered in apoptotic subpopulations compared to the non-apoptotic cells.
It is interesting to note that smaller molecular weight intercalating dyes, such as PI and EB, have relatively longer lifetime values than the larger molecular weight fluorochromes. Intercalation stabilizes the fluorochrome molecule and shields it from the solvent environment, increasing its lifetime value relative to the unbound dye. In the presence of D2O, the fluorescence lifetimes are further increased, indicating that interaction of the fluorochromes with the D2O solvent environment leads to a further stabilization of the bound fluorochrome. The larger molecular weight fluorochromes may not be shielded from the solvent environment to the same extent once intercalated, leading to lower lifetime values and decreased enhancement by D2O. Also of note is the fact that the lifetime for EB bound to fixed cells (19.5) is almost twice as large as the lifetime of EthD II (10.53) when the cells are stained in PBS. These results appear to indicate that even though these two dyes have the same fluorochrome group, the size of the molecule and the interaction of the probe with DNA and the solvent alter the fluorescence properties.
As was noted in experiments with changing dye concentrations, the fluorescence lifetime of the DNA fluorochromes is dependent on the dye concentration as well as on the solvent. This effect leads to potential preselection of specific lifetime value for a probe through a combination of dye concentration and solvent, either PBS or D2O-saline. The use of multiple DNA fluorochromes has been used previously to elucidate changes throughout the cell cycle (Steinkamp and Crissman 1993) and for the determination of apoptotic populations (Darzynkiewicz et al. 1992). Because many of these fluorochromes have overlapping emission spectra, their use in combination for conventional flow cytometry is limited. However, because dyes with overlapping emission spectra, such as PI, EB, and EthD II, have different lifetime values, the potential exists for use of these dyes in combination for phase-resolved measurements of fluorescence (Steinkamp and Crissman 1993). Information on the dye-dye self-quenching of the various fluorochromes will allow the determination of optimal dye concentrations to use for studies on the dyes in combination.
In summary, we have utilized D2O to illustrate differences in the binding of various DNA-specific fluorochromes measured by spectrophotometry, conventional flow cytometry, and phase-sensitive flow cytometry. We have shown that differences in chromatin structure, dye structure, dye-DNA interaction, and solvent accessibility lead to differences in the fluorescence intensity and fluorescence lifetime of the bound fluorochrome. These results, combined with future studies, will lead to further insight into the microenvironment of DNA-fluorochrome interaction and the effects of environmental influences on these interactions.
Footnotes
Acknowledgements
Supported by the United States Department of Energy and the Los Alamos National Laboratory Flow Cytometry Resource (NIH grants p41-RR01315, RR06758, and R01 RR07855).