
Abstract
HER2 fluorescence in situ hybridization (FISH) testing for breast cancer is largely limited to academic centers and commercial laboratories. As testing demands increase, methods for rapid and cost-effective technical validation and quality assessment will be required. Tissue microarray (TMA), a technique for high-throughput biomarker evaluation, could help facilitate these needs. Our objective was to assess the usefulness of TMA technology for validation of HER2 FISH testing. Two TMA blocks containing paired cores from 41 breast cancers were constructed. HER2 FISH was performed in parallel at two institutions and the results compared. One institution, with considerable HER2 FISH experience, served as the reference laboratory. HER2 chromogenic in situ hybridization (CISH) and immunohistochemistry (IHC) were compared to the FISH results. For positive and negative results, the concordance rate between laboratories was 100%. Using kappa statistical analysis to determine interobserver agreement, HER2 to chromosome 17 gene copy ratios showed strong agreement between laboratories with kappa = 0.85 (perfect agreement = 1.0). Four cases displaying low-level amplification by CISH contained chromosome 17 polysomy and gene copy ratios of <2.0 by FISH. Good concordance was observed between HER2 IHC and in situ hybridization testing. TMA is a robust and effective method for the technical validation of HER2 FISH testing and should be considered for use by quality assessment programs.
HER2 (human epidermal growth factor receptor-2, or HER-2/neu) is associated with poor prognosis in breast cancer (Rilke et al. 1991; Menard et al. 2001). More importantly, HER2 has been shown to predict response to specific breast cancer chemotherapeutic regimens, especially when combined with the humanized monoclonal antibody (MAb) Herceptin (Cobleigh et al. 1999; Slamon et al. 2001; Vogel et al. 2001,2002). The gene for HER2 (the oncogene c-erbB-2) is located on the long arm of chromosome 17 and encodes a cytoplasmic membrane-associated protein without a known ligand. It is believed that HER2 functions by dimerizing with other members of the epidermal growth factor receptor (EGFR) family. Slamon et al. (1989) demonstrated that the HER2 gene is amplified in 20-30% of invasive breast cancers.
Most laboratories use IHC as the preliminary test for the detection of HER2 protein expression in breast cancer specimens (Allred and Swanson 2000; Hanna 2001). FISH testing is now the most widely accepted method for confirming the presence of HER2 gene amplification in breast cancer, and in many respects is considered superior to IHC (Pauletti et al. 2000; Bartlett et al. 2001). The FDA-approved HercepTest is a popular IHC-based test for HER2 protein detection, but many laboratories use other antibodies and methods. Laboratories using “home brew” methods for HER2 testing by IHC do so largely because of the unjustifiably high price and proprietary restrictions of the HercepTest. It has been recommended that HER2 FISH analysis should reserved for cases scored as “equivocal or borderline” for overexpression of HER2 protein (i.e., HercepTest scores of 2+ or 1+) (Ellis et al. 2000; Hoang et al. 2000; Jimenez et al. 2000; Field et al. 2001; Hanna 2001; Thomson et al. 2001; Tubbs et al. 2001; Kobayashi et al. 2002).
Many academic centers and commercial laboratories offer FISH testing, but limited numbers of community hospital-based laboratories perform these assays. FISH technology requires specialized training and the purchase of specific equipment. The introduction of FISH technology by a laboratory into a clinical setting requires technical validation and the establishment of quality assurance and quality control mechanisms (Allred and Swanson 2000; Mascarello et al. 2002). For smaller laboratories this can be a daunting task, even in the face of ever-increasing demands for FISH testing by oncologists and their patients.
In light of recent reports questioning the accuracy of HER2 FISH testing results from “non-reference” laboratories, an urgent need has developed for methods to monitor the quality of these assays (Paik et al. 2002; Roche et al. 2002). Laboratories introducing HER2 FISH as a clinical test should voluntarily subject themselves to a period of technical validation. All-red and colleagues consider an assay to have achieved technical validation when it is “sensitive, specific, reproducible, and interpreted in a uniform manner from laboratory to laboratory” (Allred and Swanson 2000).
Considering the complexities associated with molecular techniques as well as the expense and potential morbidity associated with Herceptin therapy, testing for predictive markers such as HER2 deserves rigorous validation. The nature of HER2 testing adds an additional challenge because a sample must be determined to be either “positive” or “negative.” TMA is a high-throughput method for biomarker evaluation that is gaining widespread acceptance. TMAs are composed of cores from “donor” blocks derived from many specimens and are ideal for use as control tissues and for quality assessment.
The use of TMA sections for the measurement of breast cancer prognostic and predictive markers using both IHC and in situ hybridization has recently been validated (Skacel et al. 2002; Zhang et al. 2003). We believe that a practical extension of these findings would be the use of TMA for the technical validation of HER2 testing by FISH. Similarly, TMA would be useful for evaluating CISH, another technique for HER2 analysis. Recent data have suggested that CISH is comparable to FISH for HER2 analysis (Tubbs et al. 2002; Gupta et al. 2003). Here we evaluate the usefulness of TMA technology for technical validation of HER2 FISH testing.
Materials and Methods
Patient Material and TMA Construction
Invasive breast carcinomas from 41 patients were used for this study. The cases were obtained from the files of the Surgical Pathology Department of Northwestern Memorial Hospital (Chicago, IL) and were selected over a 2-year period (2000-2001). For the purposes of technical validation and assessment of test reproducibility, the cohort included a number of cases determined to overexpress HER2 protein by IHC (14 cases scored 3 +). Each specimen was fixed in alcoholic formalin for 8-12 hr, processed, and embedded in paraffin. At our institution we prepare alcoholic formalin specifically for breast specimen fixation and processing. It consists of equal parts 37% neutral buffered formalin and 95% ethanol. Two TMA blocks were constructed using a tissue arraying instrument (Beecher Instruments; Silver Spring, MD) and 1.5-mm cores. The first array contained breast cancers from 23 patients (two cores per patient) and two cores of both renal cell carcinoma and normal prostate (for orientation), for a total of 50 cores. The second array contained breast cancers from 18 patients (two cores per patient) and four cores for orientation, for a total of 40 cores. The TMA blocks were assembled using previously described methods with recording of alphabetic coordinates in a spreadsheet to designate the exact location of tissue cores (Kononen et al. 1998). The H&E sections were used to select the most representative area of the tumor for TMA construction. To account for potential tumor heterogeneity, one tissue core from each tumor was obtained from the center of the tumor and the second core was taken from the periphery of each tumor as previously suggested (Camp et al. 2000). TMA coordinates and clinicopathological data of the cohort were stored in a spreadsheet for reference. Immediately before sectioning the TMA blocks were heated in an oven at 37C for 1 hr and then placed in a refrigerator (4C) for 30 min. We find that this heating step, before sectioning of a TMA block, assists in filling in cracks and defects at the core-wax interface that could cause individual cores to not adhere to the slide. The TMA slides were carefully sectioned and mounted on charged glass slides as 4-μm sections. H&E-stained TMA sections were used as morphological references for each core studied.
FISH Analysis
FISH analysis was performed separately by two laboratories using similar protocols. Northwestern Memorial Hospital (Chicago, IL) was the “testing” laboratory conducting the validation. The clinical FISH laboratory of The M.D. Anderson Cancer Center (Houston, TX) served as the “reference” laboratory. The TMA slides were preheated at 60C overnight, then deparaffinized in xylene and ethanol. The slides were submerged in Vysis Paraffin Pretreatment Reagent (Vysis; Downers Grove, IL) for 13 min at 80C in a waterbath. After the sections were rinsed with deionized water, the slides were treated with protease solution (250 mg pepsin + 62.5 ml 0.2 N HCl, pH 1.0) for 13 min at 37C in a water-bath. After rinsing and and air-drying, 20 μl of probe was applied to each TMA slide. The Vysis PathVysion HER2 DNA probe kit was used, which contains the LSI-HER2 (spectrum orange) and CEP-17 (spectrum green) probes. The slides were coverslipped and sealed with rubber cement, denatured for 5 min at 73C, and then hybridized overnight at 37C. Denaturization and hybridization were performed on separate Boekel Slide Moats (Boekel Scientific; Feasterville, PA). For post-hybridization washing, the slides were immersed in 2 × SSC with 0.3% NP-40 at 73C in a waterbath for 1 min. The TMA slides were air-dried in the dark, then counterstained with 20 μl of DAPI (4,6-diamidino-2-phenylindole). The FISH signals were visualized using Vysis filter sets and an Olympus BX41 (Olympus America; Melville, NY) fluorescent microscope and a Zeiss (Carl Zeiss; Thornwood, NY) microscope attached to a QUIPS Image Capture system (Applied Imaging; Santa Clara, CA). The relative ratios of LSI-HER2 to CEP-17 signals were counted in 60 tumor cells for each case by two individuals (LKD and cytotechnologist K. Sikka) under oil at ×1000 magnification. Two 1.5-mm cores were present in all but three cases, and 30 cells from each core were analyzed and the counts combined for a single score. HER2 to chromosome 17 ratios ≥2.0 were considered positive for HER2 gene amplification. The results were entered into a spreadsheet. Pairwise kappa scores were determined for each case assayed by the two laboratories (Cohen 1960). The kappa statistic calculates the level of agreement between two observers. The range and strength of agreement for kappa values are as follows: <0.00 = poor; 0.00-0.20 = slight; 0.21-0.40 = fair; 0.41-0.60 = moderate; 0.61-0.80 = substantial; 0.81-0.99 = almost perfect; and 1.00 = perfect agreement.
CISH Analysis
CISH analysis was performed using the Zymed Spot-Light CISH polymer detection kit (Zymed; South San Francisco, CA) according to the suggested procedure (Tanner et al. 2000). This kit uses a diaminobenzidine (DAB) detection method and a digoxigenin-labeled probe to assay for the HER2 gene (Zymed Spot-Light HER2 DNA Probe). Two separate tissue sections from each TMA were deparaffinized and washed in absolute alcohol before steam heat pretreatment in Heat Pretreatment Solution. After two washes with PBS, enzymatic digestion with Pretreatment Enzyme was performed at 37C for 8 min. Three additional PBS washes and dehydration of the slides in graded alcohols were performed. After air-drying, 15 μl of probe was applied to each section and coverslips were applied. The slides were denatured at 95C for 5 min and the hybridization was performed overnight at 37C. After the hybridization, the slides were placed in pre-warmed 0.5 × SSC solution for 5 min and were washed with PBS/Tween-20 three times for 2 min each. According to the Spot-Light kit instructions, the signal was visualized by sequential incubations at room temperature with CAS-block (10 min), anti-digoxigenin fluorescein (30 min), anti-fluorescein peroxidase (30 min), and DAB (20 min). After rinsing with distilled water, the slides were lightly counterstained with hematoxylin and coverslipped. Scoring was performed by one pathologist (ELW) as previously described (Tanner et al. 2000; Gupta et al. 2003). Tumors with more than 10 gene copies or with large gene copy clusters were considered amplified and those with one to five gene copies were considered non-amplified. Low-level amplification was defined as six to ten gene copies in tumor cell nuclei.
IHC Analysis
Immunohistochemical analysis for HER2 protein expression was performed using a polyclonal rabbit anti-human anti body to the c-erbB-2 oncoprotein (A0485, dilution 1:1000). The antibody used for this study was purchased from DAKO (Carpinteria, CA) and is the antibody included as part of the DAKO HercepTest kit. We performed a standard (ABC) IHC procedure under conditions modified for our laboratory (Northwestern Memorial Hospital, Chicago, IL). IHC was performed using the Ventana NexES automated staining system and the Ventana ES DAB detection kit (Ventana Medical Systems; Tucson, AZ). Microwave antigen retrieval was performed for 12 min in citrated buffer, allowing 20 min for cooling. The staining procedure was performed according to the detection kit instructions. The TMA sections were scored for HER2 protein expression independently by two pathologists (LKD and ELW) and a consensus score was obtained for discrepant cases. Scoring was performed using the HercepTest system (score range 0 to 3 +).
Results
HER2 FISH analysis was successfully performed on 36/41 breast cancer cases tested. Visualization of the FISH signals in the majority of tissue cores was not difficult, and the use of TMA sections did not hinder interpretation. Core morphology, observed by ×10 objective using a DAPI filter, was acceptable for TMA navigation (Figure 1). Overall, the staining and signal quality for the majority of the cores were excellent for both laboratories. Pairs of cores from two cases contained no residual invasive tumor on the TMA slides. One case was uninterpretable because of overdigestion (Figure 2). Complete absence of signal was observed in two cases and was probably due to inadequate tissue coverage of cores by probe on the TMA section edge. This incomplete coverage was secondary to the large amount of surface area that the TMA section occupied on the glass slide.
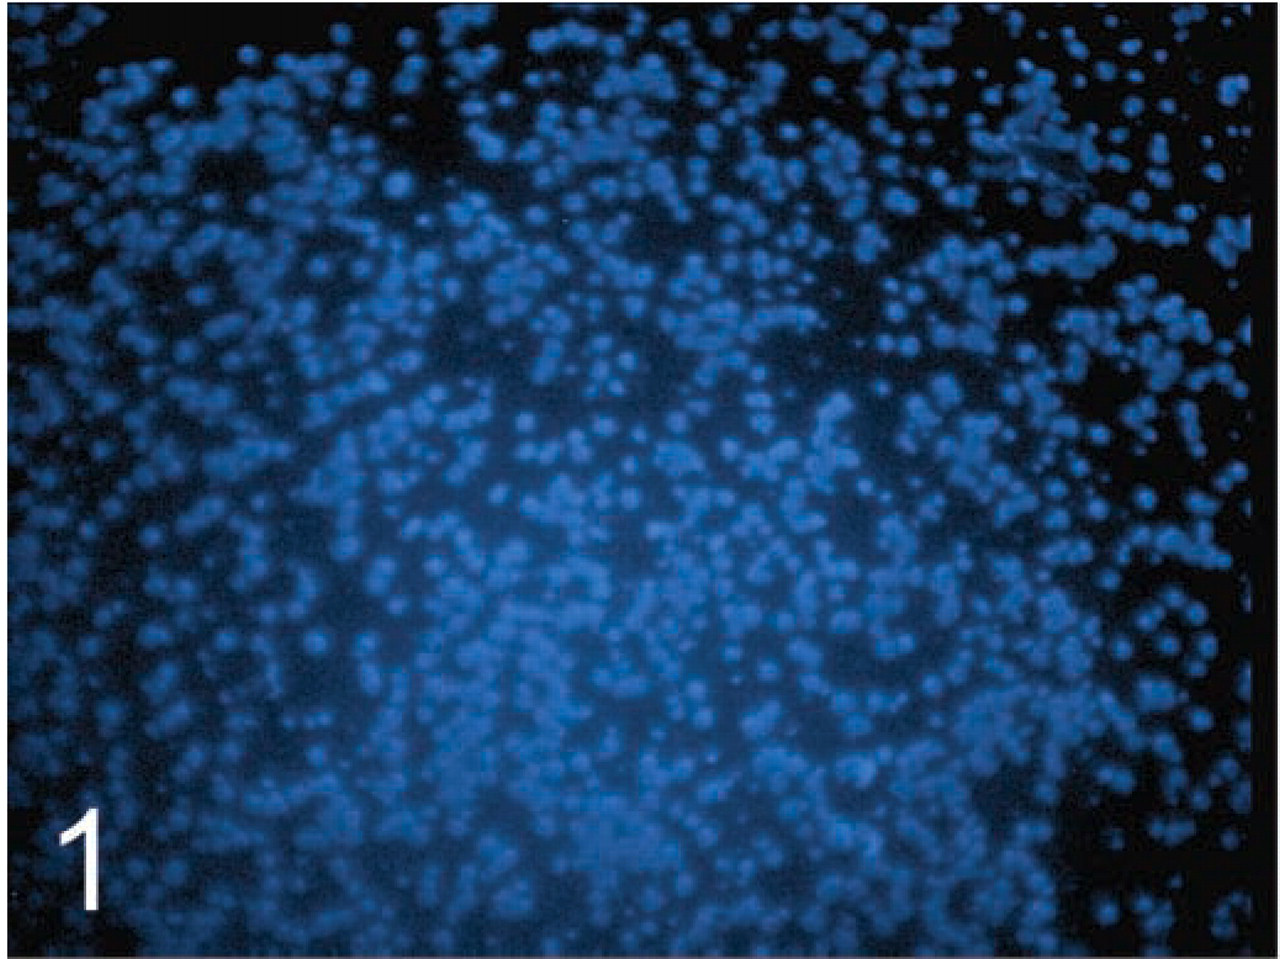
TMA breast cancer core as visualized using a DAPI filter and a ×10 objective.
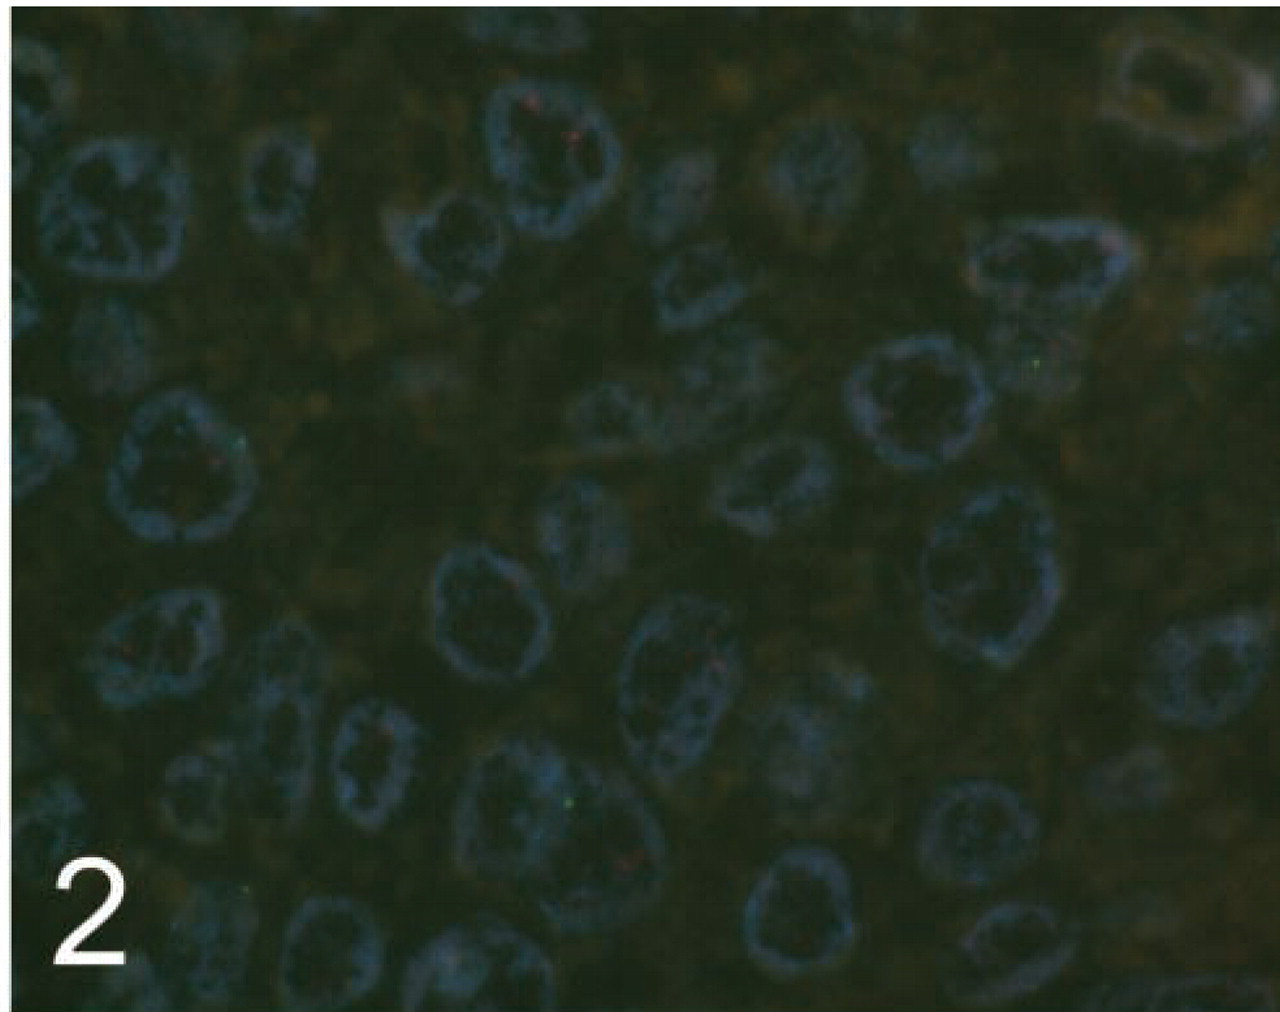
A TMA breast cancer core overdigested by protease, with occasional small signals present.
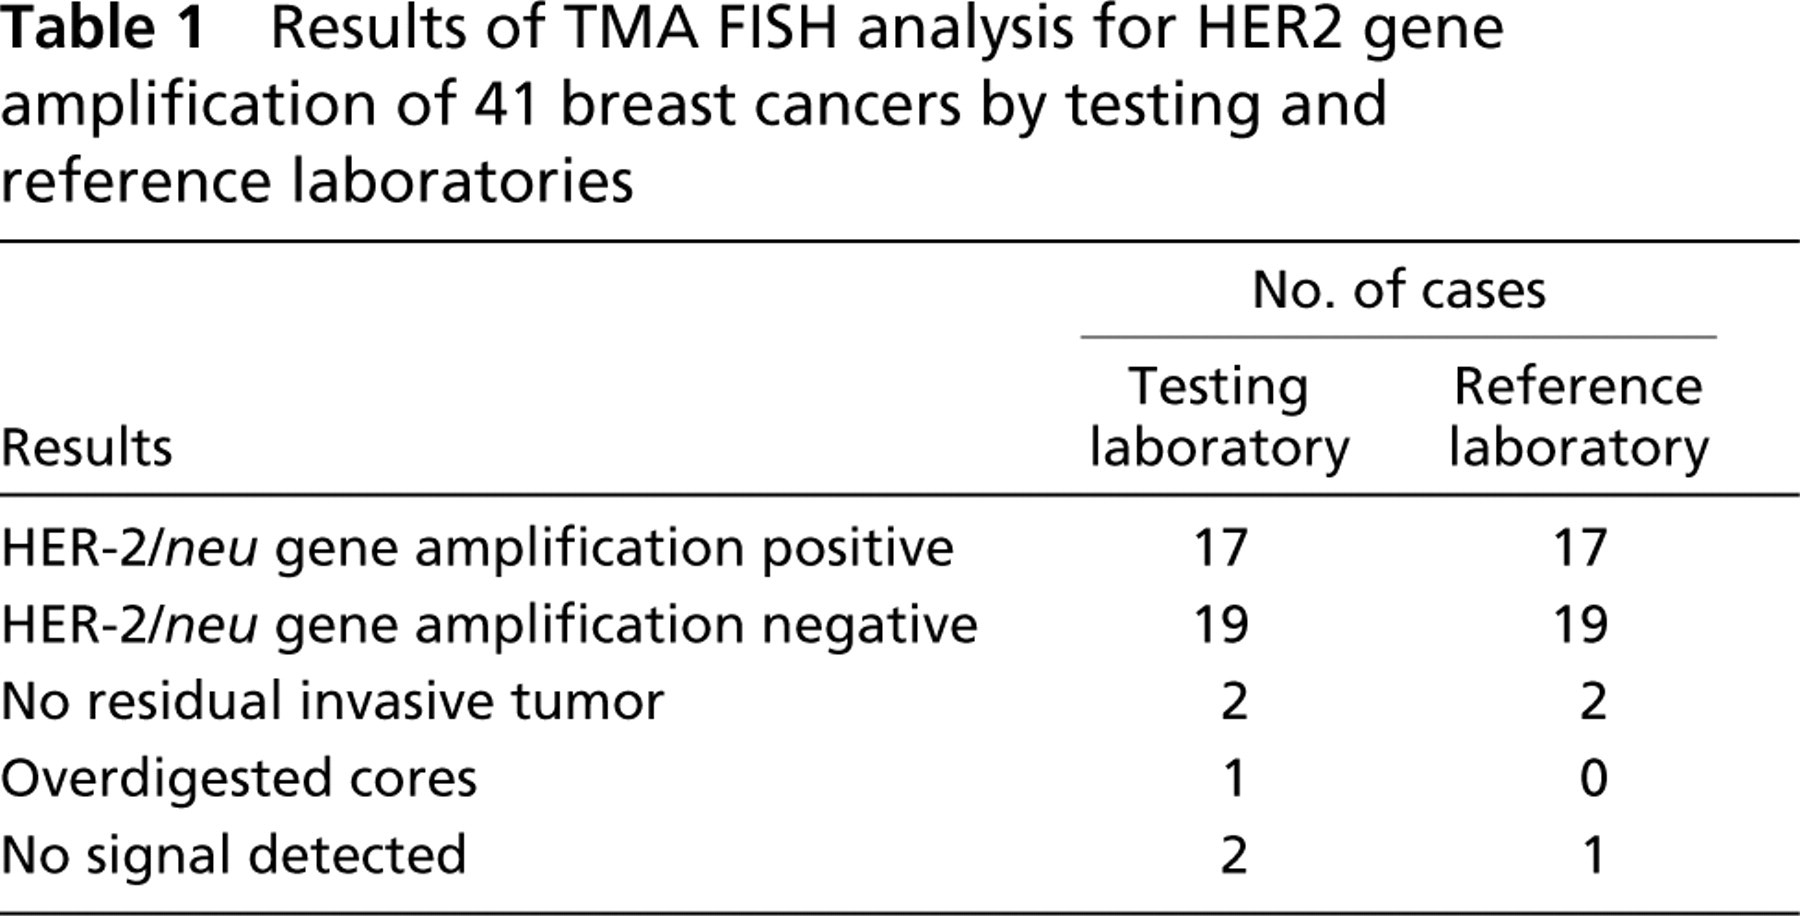
Table 1 lists the results from the cases used in the comparison. For these cases, the concordance rate for positive and negative results between the testing laboratory and the reference laboratory was 100%. HER2 gene amplification (Figure 3) was identified in 17 cases and was found to be absent in 19 cases by both laboratories. The mean HER2 to chromosome 17 gene copy ratios were 3.5 (test laboratory) and 4.2 (reference laboratory). Substantial agreement for the HER2 to chromosome 17 gene copy ratios obtained for each case was observed between the two laboratories (kappa = 0.85).
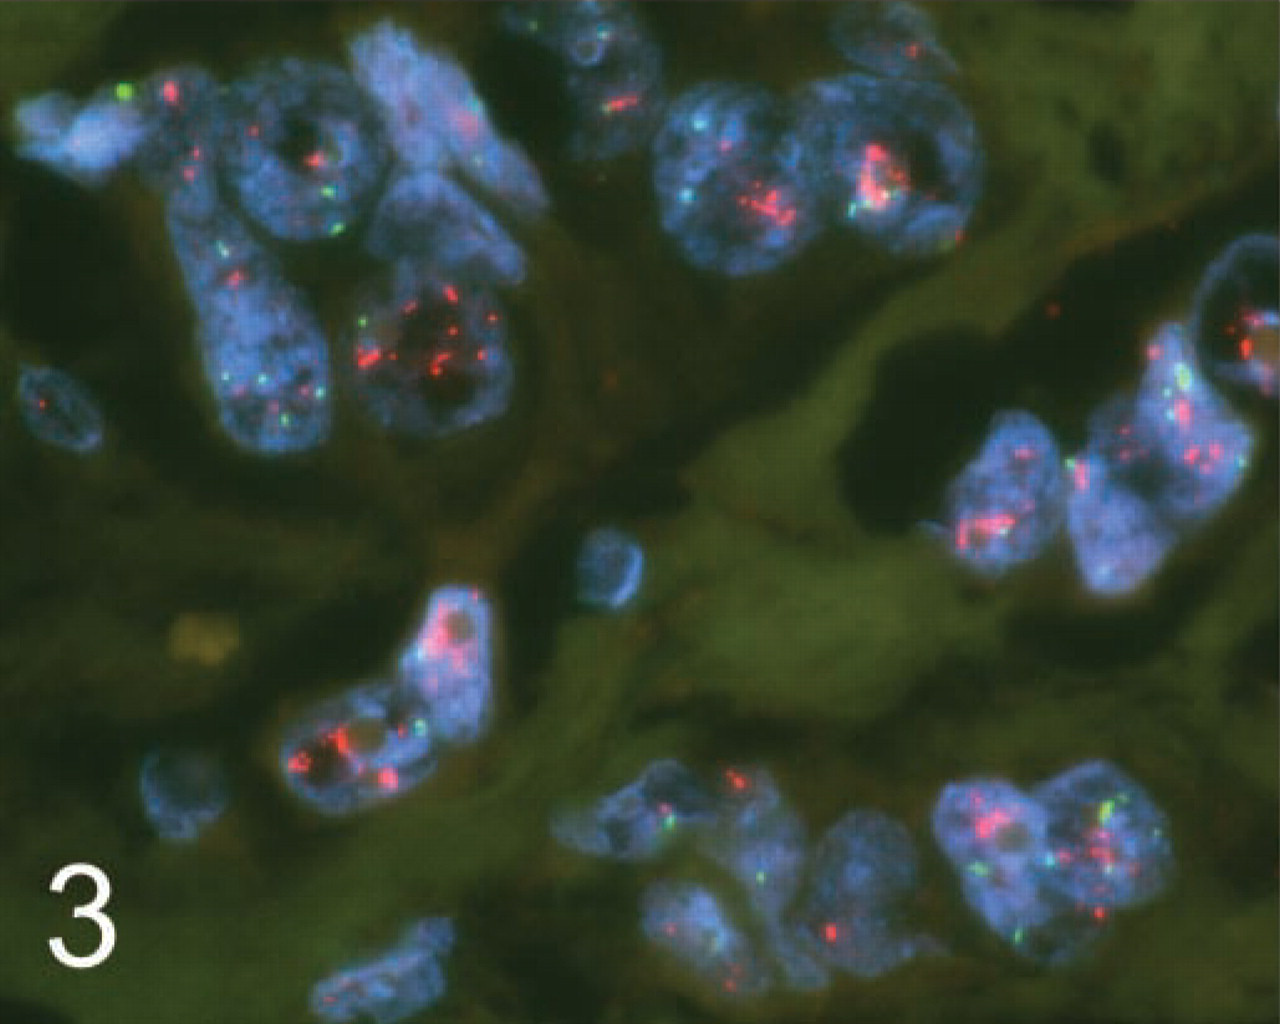
Example of a TMA breast cancer case with HER2 gene amplification assayed with dual-probe FISH.
Results of TMA FISH analysis for HER2 gene amplification of 41 breast cancers by testing and reference laboratories
IHC to detect HER2 protein overexpression was performed on the TMA sections by the testing laboratory and compared to the results obtained by the FISH analyses. Results for 38 cases were available. Table 2 lists the IHC scores compared to the HER-2 gene amplification status as determined by FISH. All 14 cases (100%) scored 3+ by IHC were found to be HER2 gene-amplified. Of the 16 negative (score 0) IHC cases, one case (6%) exhibited gene amplification. For the five cases scored as 1+ and the three cases scored as 2+ by IHC, one case from each group (20% and 33%, respectively) was later determined to be HER2 gene-amplified by FISH.
Comparison of HER2 testing results by IHC and FISH on TMA sections
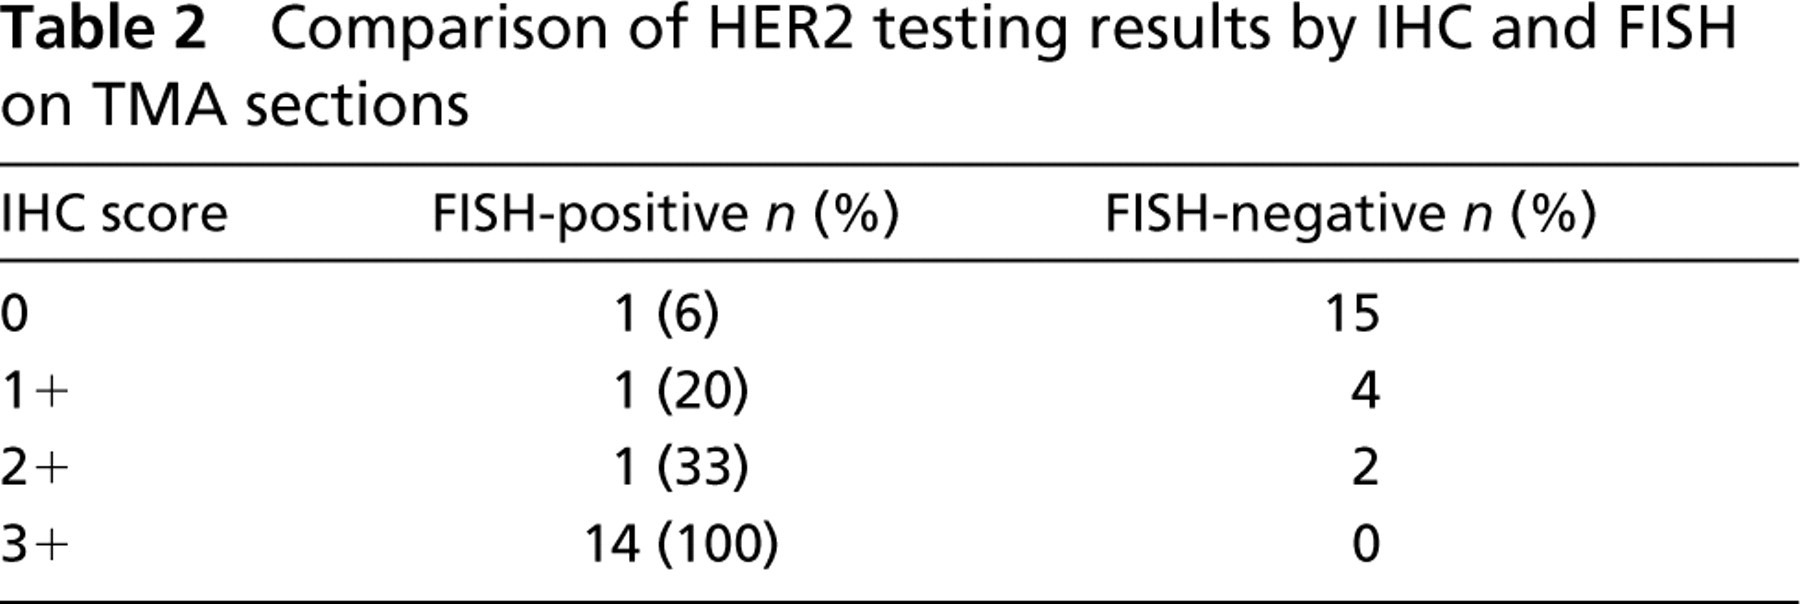
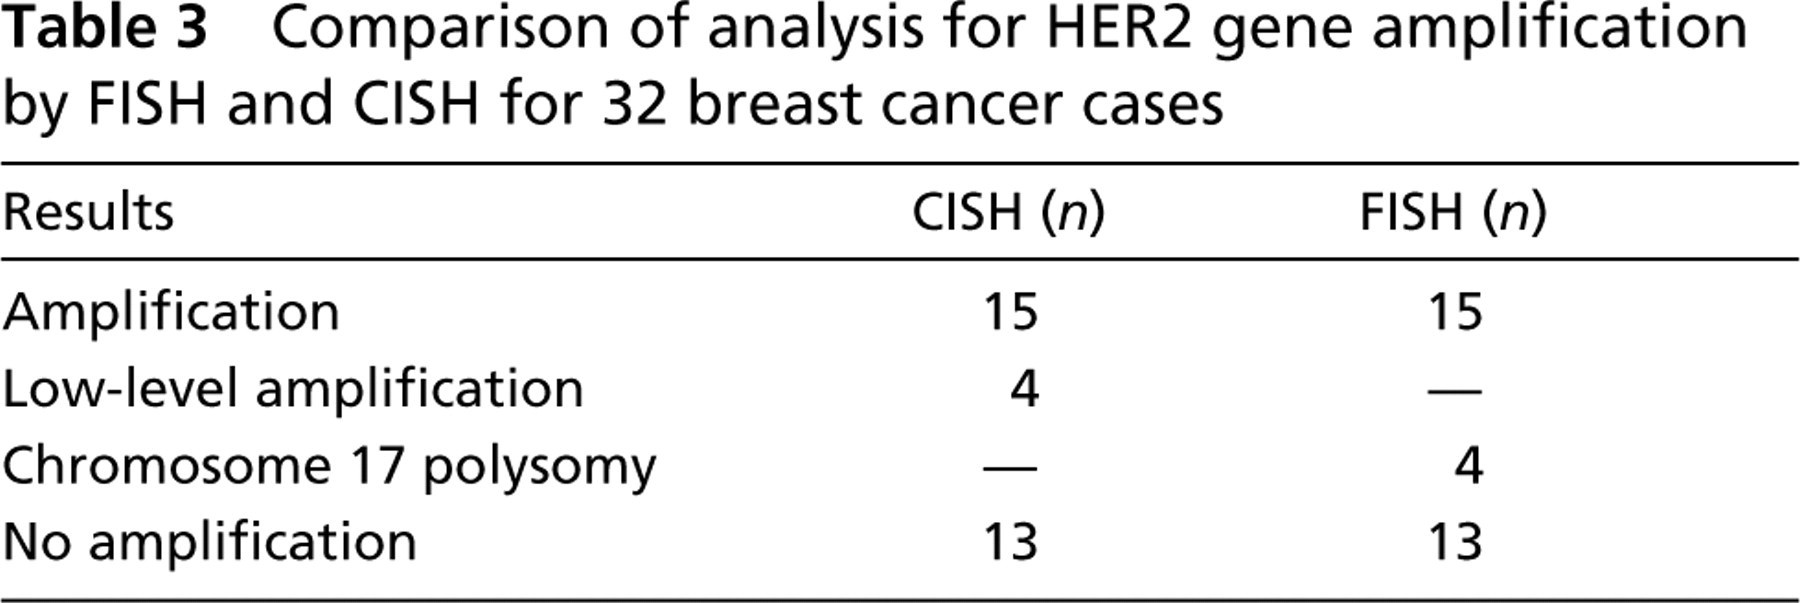
Table 3 summarizes the CISH vs the FISH results. Only 32 cases contained acceptable signals for CISH interpretation because of insufficient probe coverage in a region of one of the TMA sections. HER2 gene amplification (including low-level amplification) was observed in 19 cases by CISH analysis (Figure 4) and in 15 cases by FISH analysis. Low-level amplification by CISH (six to ten gene copies per tumor cell nucleus) was seen in all four of these “discrepant” cases. FISH analysis demonstrated polysomy for chromosome 17 for each of these four cases and their HER2 to chromosome 17 gene copy ratios were each <2.0. None of the 13 non-amplified CISH cases contained HER2 gene amplification by FISH analysis.
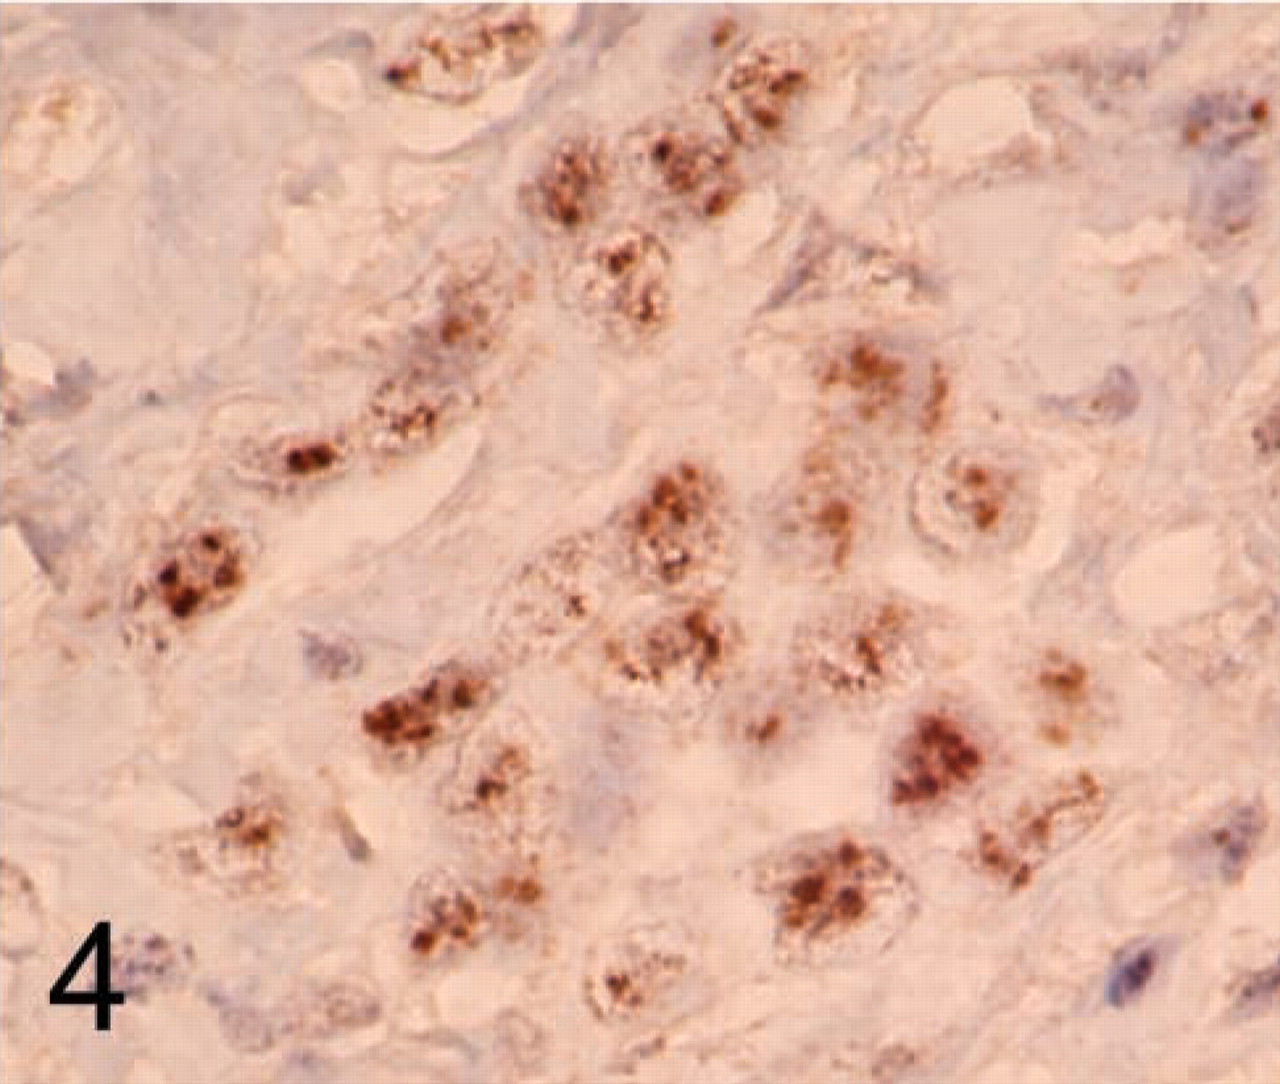
Example of a TMA breast cancer case with HER2 gene amplification assayed with CISH.
Comparison of analysis for HER2 gene amplification by FISH and CISH for 32 breast cancer cases
Discussion
Here we describe the technical validation of HER2 FISH testing using TMA blocks consisting of duplicate cores from a cohort of clinical breast cancer cases. The TMA, first described by Kononen et al. (1998), is a high-throughput and cost-effective method for biomarker evaluation (Skacel et al. 2002). Conceptually, the TMA evolved from Battifora's “multitumor sausage” technique (Battifora 1986). Recent studies have validated the use of TMA sections for analysis of biological markers in breast cancer (Camp et al. 2000; Torhorst et al. 2001; Gancberg et al. 2002; Zhang et al. 2003). We extended the use of TMA technology for the technical validation of HER2 testing by FISH. For the purposes of the validation, we constructed two TMA blocks with relatively equal numbers of HER2-positive and -negative tumors. The increased numbers of HER2 overexpressors enabled us to more accurately validate the technical performance and reproducibility of the test. We also evaluated the use of TMAs for CISH, an emerging technology for HER2 gene expression analysis.
The concordance rate was 100% with the reference laboratory for positive and negative HER2 FISH results for the 36 cases that could be compared. Strong agreement for HER2 gene to chromosome 17 gene copy ratios were also observed (kappa = 0.85). These results indicate that the HER2 FISH assay, as performed by the testing laboratory, compares favorably with the assay performed by the reference laboratory. In addition to the TMA sections, standard histological sections from 30 additional clinical breast cancer cases were included in our formal validation of HER2 FISH (data not provided), largely to include “real life” testing conditions in the validation.
The analysis of FISH signals using the TMA sections was uncomplicated, and DAPI staining provided acceptable morphology for TMA navigation under the fluorescent microscope. Although biological heterogeneity is believed to be an issue with TMA use, it is not relevant when identical TMA sections are compared between laboratories. Although not the focus of this study, we observed markedly discrepant HER2 to chromosome 17 signal ratios in only a single case between the paired cores obtained from the center and the periphery of the 41 tumors evaluated.
Evaluation of the performance of IHC testing for HER2 by the testing laboratory was conducted as part of the validation. The IHC results (scored as 0,1 +, 2 +, and 3 +) were compared to the results obtained by FISH in a fashion often published in the literature (Diaz 2001). Overall, concordance for HER2 testing by IHC and FISH was good. The concordance rates between IHC cases scored as 3+ and 0 were excellent for FISH-positive and -negative cases, respectively. For IHC cases scored as 1+ and 2+, one case from each group was later determined to be HER2 gene-amplified by FISH. One of these tumors (scored as 2+) displayed marked chromosome 17 polysomy when assayed by FISH. Non-correlative IHC results compared to FISH, such as these, are in keeping with findings of past reports (Jacobs et al. 1999; Hoang et al. 2000; Ridolfi et al. 2000; Tubbs et al. 2001).
In addition to comparing HER2 FISH testing between institutions, we also compared FISH testing results with those determined by CISH. Recently, Gupta et al. (2003) compared these two in situ hybridization techniques in 31 clinical breast cancer cases. They found that in four cases with low-level amplification for the HER2 oncogene by CISH, chromosome 17 polysomy was present in three of these cases as assayed by FISH (PathVysion). We found similar findings in our comparison, in which 4/32 cases contained chromosome 17 polysomy and all were low-level amplified by CISH. Gupta et al. (2003) concluded that use of a newly marketed chromosome 17 CISH-based probe (Zymed) would be necessary when low-level HER2 gene amplification was detected initially using CISH to rule out aneusomy.
In summary, we utilized TMA sections for the validation of HER2 molecular testing by our laboratory. Although these sections enabled our laboratory to rapidly achieve technical validation for HER2 FISH testing, we will continue to monitor our clinical testing results on traditional histological sections. We evaluated both FISH- and CISH-based HER2 testing methods and compared our results to those of a reference laboratory with considerable FISH experience. We found TMA to be a robust and effective method for the technical validation of HER2 FISH testing, and we believe that its use should be considered for external quality assessment programs.
Footnotes
Acknowledgements
We thank Cynthia Reese for her assistance with the TMA sections. We also wish to thank Emily Tarco and Kumkum Sikka for their technical assistance and expertise.