
Abstract
This study examined temporal changes in growth plate apoptosis molecules and growth factors in an animal model of radiation injury with and without a radioprotectant. Thirty weanling 5-week Sprague-Dawley rats underwent right knee irradiation with single-fraction 17.5 Gy while the left served as internal control. Six animals each were sacrificed at 0.5, 1, 2, 3, or 4 weeks after irradiation. Half of the animals received pretreatment with amifostine (WR-2721) radioprotectant. Immunohistochemical staining for PTHrP, Bcl-2, Bax, caspase-3, FGF-2, and TGF-β was performed. PTHrP decreased to a nadir at 1 week after irradiation but rebounded to above control levels at 2 weeks in the reserve and transitional zones. The radioprotectant amifostine blunted the decrease in PTHrP but kept PTHrP expression lower than controls during the rebound phase in untreated irradiated animals. Hypertrophic zone Bax expression was decreased by amifostine in both irradiated and non-irradiated limbs at 1 and 2 weeks. FGF, TGF-β, Bcl-2, and caspase levels generally decreased at 1 week and returned thereafter toward control levels. These findings underscore the importance of PTHrP in response to growth plate irradiation and show the novel finding of a decrease in Bax expression with amifostine pretreatment.
R
The serial effects of irradiation on key growth plate growth factors, anti-apoptotic molecules, and pro-apoptotic molecules has not been examined in vivo. Parathyroid hormone-like protein (PTHrP) has been implicated in autocrine and paracrine feedback loops that coordinate growth plate chondrocyte proliferation and differentiation (Lee et al. 1996; van der Eerden et al. 2000). Two postnatal growth plate control loops involving PTHrP have been suggested based on identification of PTHrP in the prehypertrophic, hypertrophic, and reserve zone chondrocytes: (a) a partially autocrine loop involving the prehypertrophic and early hypertrophic cells, and (b) a loop involving the reserve zone cells. PTHrP is generally accepted to maintain chondrocytes in a proliferative, less differentiated state by upregulating the pro-survival (anti-apoptotic) mitochondrial membrane associated B-cell leukemia-2 protein (Bcl-2) to block the pro-apoptotic Bcl-2-associated X protein (Bax) and resultant apoptosis. In cell culture, irradiation of chick chondrocytes decreased PTHrP mRNA expression accompanied by a decrease in Bcl-2 expression and increased caspase 3 expression (Pateder et al. 2002). No discernible effects upon transforming growth factor-beta (TGF-β) or fibroblastic growth factor (FGF) were noted (Pateder et al. 2002). However, both TGF-β and FGF have been implicated as key growth plate growth factors promoting proliferation (Rosselot et al. 1994; Shida et al. 2001).
The use of radioprotectant drugs has been suggested to minimize damage to the growth plate during irradiation for childhood extremity tumors (Tamurian et al. 1999; Damron et al. 2000; Pateder et al. 2002; Damron et al. 2003). Amifostine, a free radical scavenger, has been shown to be effective in growth plate radioprotection in vivo, providing significant reduction in growth loss from both single and fractionated doses of irradiation without affecting normal growth in an established growing rat model (Tamurian et al. 1999; Damron et al. 2000; Damron et al. 2003). Up to 57% of growth loss from a single irradiation dose has been recovered by amifostine at high doses in that model (Damron et al. 2000). However, the effect of amifostine on growth plate growth factors and on anti-apoptotic or pro-apoptotic molecules has not been examined. An understanding of the amifostine effects on these growth plate molecules and growth factors is sought both to understand its mechanism of action and also to aid in the selection of alternative agents, because amifostine's effect is incomplete.
We hypothesized that irradiation would result in transient decreased expression of PTHrP, Bcl-2, FGF, and TGF-β (as proliferative growth factors and anti-apoptotic molecules) and an increase in Bax and caspase (as indicators of apoptosis) expression, followed by a return to normal over time. The radioprotectant amifostine was hypothesized to partially reverse each of the radiation-mediated changes in growth plate growth factors and in anti-apoptotic and pro-apoptotic molecules in a nonselective fashion.
Materials and Methods
Thirty weanling 5-week-old Sprague-Dawley rats underwent right knee irradiation with a single 17.5 Gy fraction while the left limb served as an internal control. Six animals were sacrificed at each of the following time intervals after irradiation: 0.5, 1, 2, 3, and 4 weeks. Half of the animals at each time period received amifostine 100 mg/kg IP 20 min before radiation exposure.
The animals were anesthetized with Telezol 30 mg/kg IP before radiotherapy treatment and were then placed upon a Plexiglas sheet with the right leg extended, secured with tape, and placed under the radiation source (Philips MGC 30; Shelton, CT) (Tamurian et al. 1999). Irradiation was administered using 250 kVp X-rays at 15 mA with a 30-cm source to skin distance and a dose rate of 3.0 Gy/min. With beam collimation and lead shields, only the right knee regions were exposed (the distal half of the femur and the proximal half of the tibia). The proximal femur and the distal tibia were shielded from irradiation (Tamurian et al. 1999).
The proximal tibiae for three animals per time and treatment group were fixed for 3 hr at room temperature (RT) in a fixative containing 2% glutaraldehyde, 2% paraformaldehyde, and 0.7% RHT (hexamine ruthenium trichloride) in a 0.1 M cacodylate buffer, pH 7.4. After several changes of wash buffer and storage at 4C, the specimens were embedded in methylmethacrylate (MMA) (Erben 1997), sectioned at 5 μm on a Leica rotary microtome, and mounted four sections per slide (two slides per growth plate) on APES-coated microslides. Sections were deplasticized using three changes of xylene and hydrated through a graded series of alcohol to deionized water.
Immunohistochemical staining for PTHrP (parathyroid hormone-like protein, Ab-2) (Oncogene; Cambridge, MA), Bcl-2 (clone Bcl-2–100; Zymed, San Francisco, CA), Bax (P19; Santa Cruz Biotechnology, Santa Cruz, CA), caspase-3 (CPP32, Ab-4; Neomarkers, Fremont, CA), FGF-2 (sc-79; Santa Cruz Biotechnology), and TGF-β (Chemicon MAb 1032 or Santa Cruz sc-146) was performed. PTHrP Ab-2 is a purified polyclonal rabbit antibody raised against the peptide corresponding to residues 34–53 of human PTHrP with rat cross-reactivity. Bcl-2 Ab is a mouse synthetic peptide MAb corresponding to amino acids 41–54 of the Bcl-2 protein. Bax Ab is an affinity-purified rabbit polyclonal antibody raised against a peptide mapping to the amino terminus of mouse Bax. Caspase, FGF-2, and TGF-β antibodies are also rabbit polyclonal antibodies. Appropriate negative and positive control tissues were examined (breast carcinoma for PTHrP, normal human colon for Bcl-2, human colon carcinoma for Bcl-2 and FGF-2, breast carcinoma for Bax, tonsil for caspase, and porcine uterus for TGF-β). Staining for PTHrP receptor1 (Ab-1; Oncogene) was attempted late on these sections, but despite being able to demonstrate its presence in more recently harvested tissue, very little useful immunoreactivity could be shown on the sections derived from animals used for the current study.
For antigen retrieval, slides were either placed in a vegetable steamer for 40 min (PTHrP, Bax-19, Bcl-2, TGF-β), microwaved twice 6 min at 90% power (caspase 3), or boiled for 10 min (FGF-2) in 0.01 M citrate buffer, pH 6.0, then allowed to cool to RT and followed with a wash in PBS. The sections were then incubated for 1 hr at RT in blocking buffer containing 0.1 M PBS with 10% normal horse serum (NHS) and 2% bovine serum albumin (BSA). The following antibodies were incubated overnight at 4C with primary antibody diluted with PBS/BSA and 2% NHS: Bax (P19), Santa Cruz Biotechnology, sc-526, 1:75; Bcl-2, Zymed Laboratories, 18–0193, 1:100; PTHrP, Oncogene, PC09, 1:150; TGF-β, Santa Cruz Biotechnology, sc-146, 1:20; FGF-2, Santa Cruz Biotechnology, sc-79, 1:250; and caspase 3, Neomarkers, RB-1197-P1, 1:20. The next day all sections were washed several times with PBS/BSA and incubated in biotinylated anti-mouse/anti-rabbit IgG (1:200; Vector Laboratories, Burlingame, CA) for 30 min at RT. After several PBS/BSA washes, the slides were incubated for 20 min at RT in avidin-biotinylated enzyme complex (ABC) (Vector Elite Kit; Vector Laboratories). Finally, after several PBS/BSA washes the slides were visualized with DAB as the chromogen (BioGenex) for 5 min, washed in deionized water, and counterstained with 2% methyl green or hematoxylin. Negative controls were substitutions of primary antibody or secondary antibody with antibody diluent.
Slides were reviewed by two reviewers (TAD, SM) with one reviewer having no specific knowledge of the treatments. All eight of the sections from two different depths of section (four sections at each depth) within each growth plate were reviewed to obtain an overall impression of the staining. Staining was graded 0 to 3 for its extent within each zone (reserve, proliferative, transitional, and hypertrophic) and 0 to 3 for intensity of staining. For each stain, an index was calculated to reflect overall staining extent and intensity by multiplying the value for extent by the value for intensity within each zone. Hence, the following formula was used:

The grading and scoring were modifications of those previously reported to account for variability in both staining intensity and percent positivity (McCarty et al. 1985). The same scoring system reported by McCarty et al. has been used by others (Scheres et al. 1988; Bosman et al. 1992). In the original scoring system there were five grades of staining intensity (0, 1 +, 2 +, 3 +, and 4 +). For each case, the proportion of cells exhibiting each intensity level was visually estimated, each of these percentages was multiplied by the corresponding staining intensity, and the totals were added to obtain the total staining for the case. Our approach is a modification of this technique. There are two major modifications. First, four grades of staining intensity (0, 1 +, 2 +, and 3 +) were used. Second, because the staining intensity in any given zone was quite homogeneous (among the cells that are positive), the scoring of McCarty et al. (1985) was simplified by estimating the proportion of positive cells for each zone (instead of estimating the proportion of cells showing 0, 1+, 2 +, and 3+ staining for each zone) and multiplying that by the intensity. The indices were intended only to give an impression of relative changes over time in each growth factor and apoptosis-related protein rather than to express an absolute quantitative amount of expression of those molecules.
The periphery of the growth plate was excluded from review for these purposes because its contribution to bone growth both in width and length renders it more difficult to interpret relative to its changes after irradiation. After independent reviews, on recommendation by the statistician, the two reviewers completed a final consensus rating for each slide based on simultaneous review of slides for which their scores differed by any amount. Essentially all differences were minor (one level) and were easily resolved.
Staining indices were determined individually for the reserve zone, the proliferative zone, the transitional zone, and the hypertrophic zone (Figure 1). The reserve zone was defined as the region from the epiphysis (excluding all cells related to the secondary center of ossification) to the first flattened chondrocyte at the base of a cell column. The proliferative zone extended from there to the first chondrocyte in which a shape change was evident. The transitional zone extended from there to the first level of fully enlarged chondrocytes. The hypertrophic zone extended from there to the chondro-osseous junction (Wilsman et al. 1996). The 1-week irradiated specimens, despite their paucity of cells, still maintained scattered stacks of flattened cells to define the reserve/proliferative junction and enlargement in cell size to define the proliferative/transitional and transitional/hypertrophic junctions (Damron et al. 2003). Our definitions of these zones in these same irradiated animals 1 week after the insult is substantiated by the previously reported BrdU labeling within the irradiated growth plate, which is restricted to the zone we have defined as the proliferative zone (Damron et al. 2003). The 2–4 week specimens exhibited clonal collections of returning cells, which presented further difficulty in defining zones. However, examination of these clones through serial sections confirmed that the base of essentially all of the clones extended up to a reproducible reserve/proliferative junction, so the base of the clone closest to the secondary center of ossification was taken as that junction in each section. Maturation from proliferative to transitional and hypertrophic zones within the clones was clear.
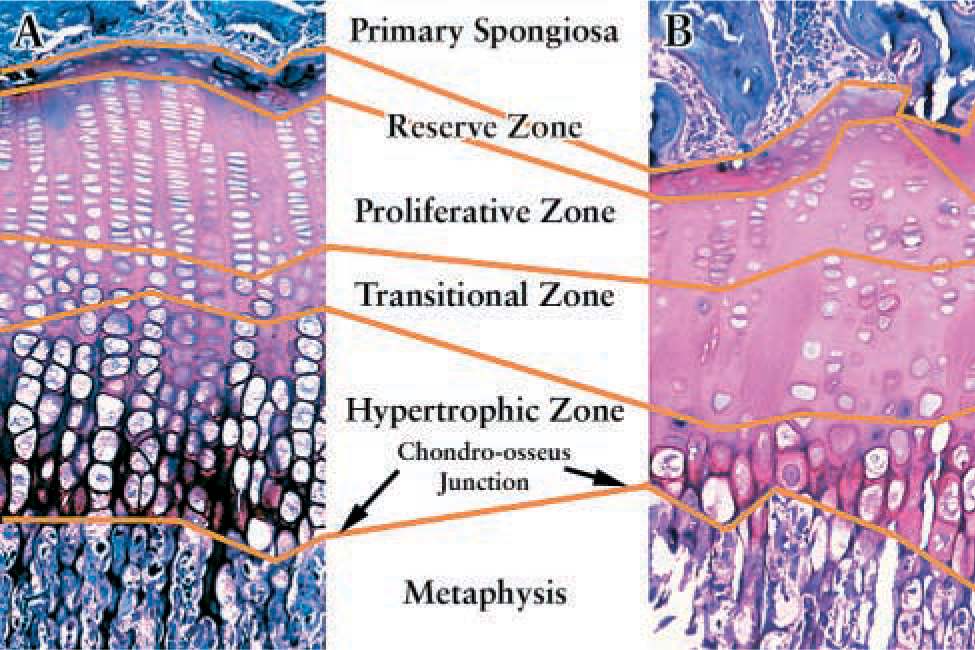
Diagram of a normal (
(
Results
Representative immunohistochemistry results are shown in Figures 2, 3, and 4. The IHC results must be viewed in the context of the dramatic changes in length, growth rate, histomorphometry, and BrdU labeling evidence of proliferative activity that occur after growth plate irradiation, as previously reported elsewhere for these same animals (Damron et al. 2003). Lengths of the irradiated femurs and tibiae become 10–20% less than their non-irradiated counterparts by 1 week after irradiation and remain significantly less through 4 weeks. Proximal tibial growth rate after irradiation decreases to 18% of controls at 1 week but then returns gradually to about 80% of control growth rate by 4 weeks. Overall growth plate height reaches its nadir at 1 week as well, but then rebounds to greater than controls by 2 weeks, attributable, it appears, to an increase in matrix area fraction during a period when chondroclast resorption is suppressed. The increase in matrix area fraction largely occurs in the hypertrophic zone. Beginning at 2 weeks, proliferative clones appear that repopulate the growth plate gradually over the ensuing weeks. It is at this time point, at least for the animals in this study irradiated in the fashion described, that the first signs of a reparative response to the growth plate are noted. By 4 weeks, irradiated growth plate height nears that of the controls and the expanding clones have reestablished some degree of more normal structure to the growth plate. BrdU labeling is noted in the distorted proliferative zone of the irradiated growth plate but is significantly reduced at the 0.5- and 1-week time points. Amifostine administration before this irradiation significantly increases growth, growth rate, growth plate height, and hypertrophic zone height compared to the untreated but irradiated growth plates (Damron et al. 2003).
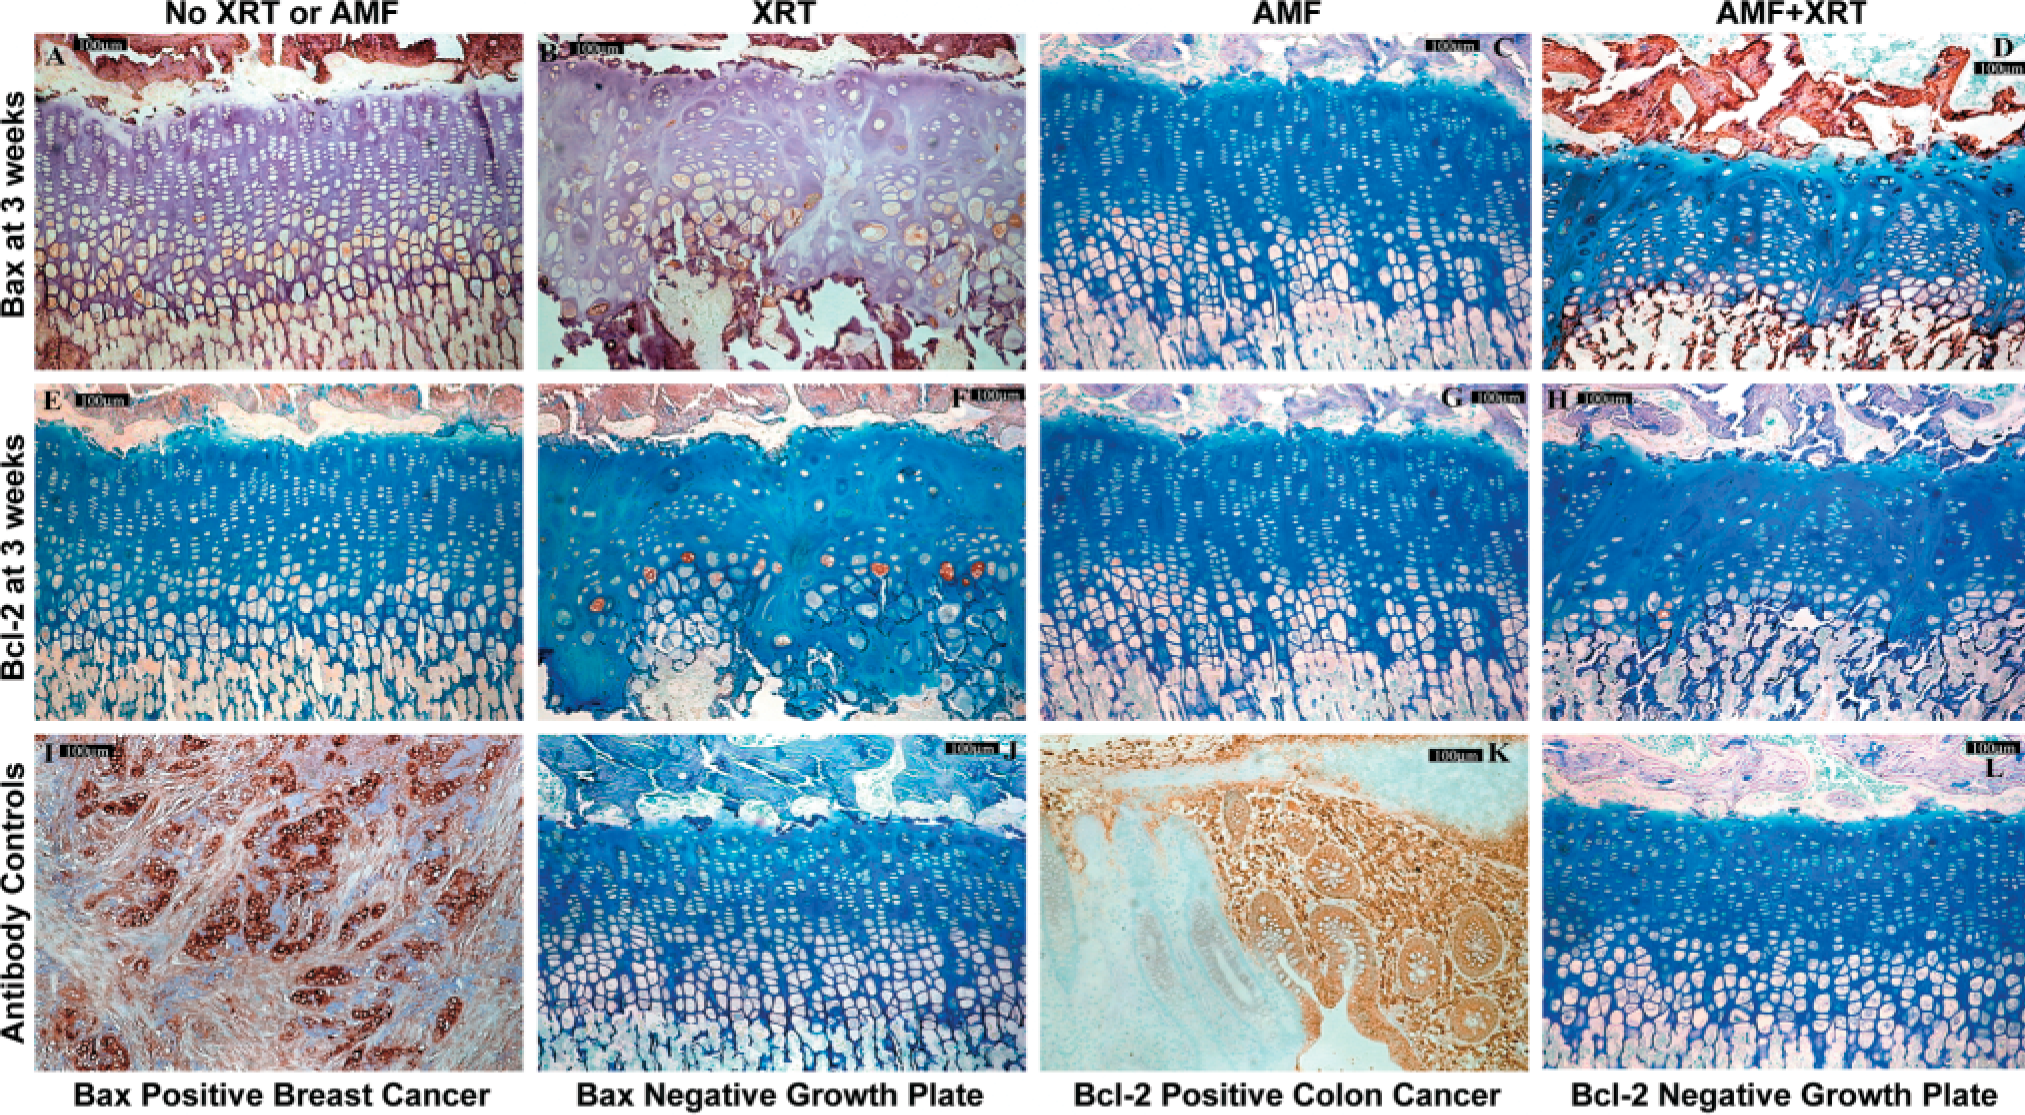
Typical IHC staining patterns for Bax (
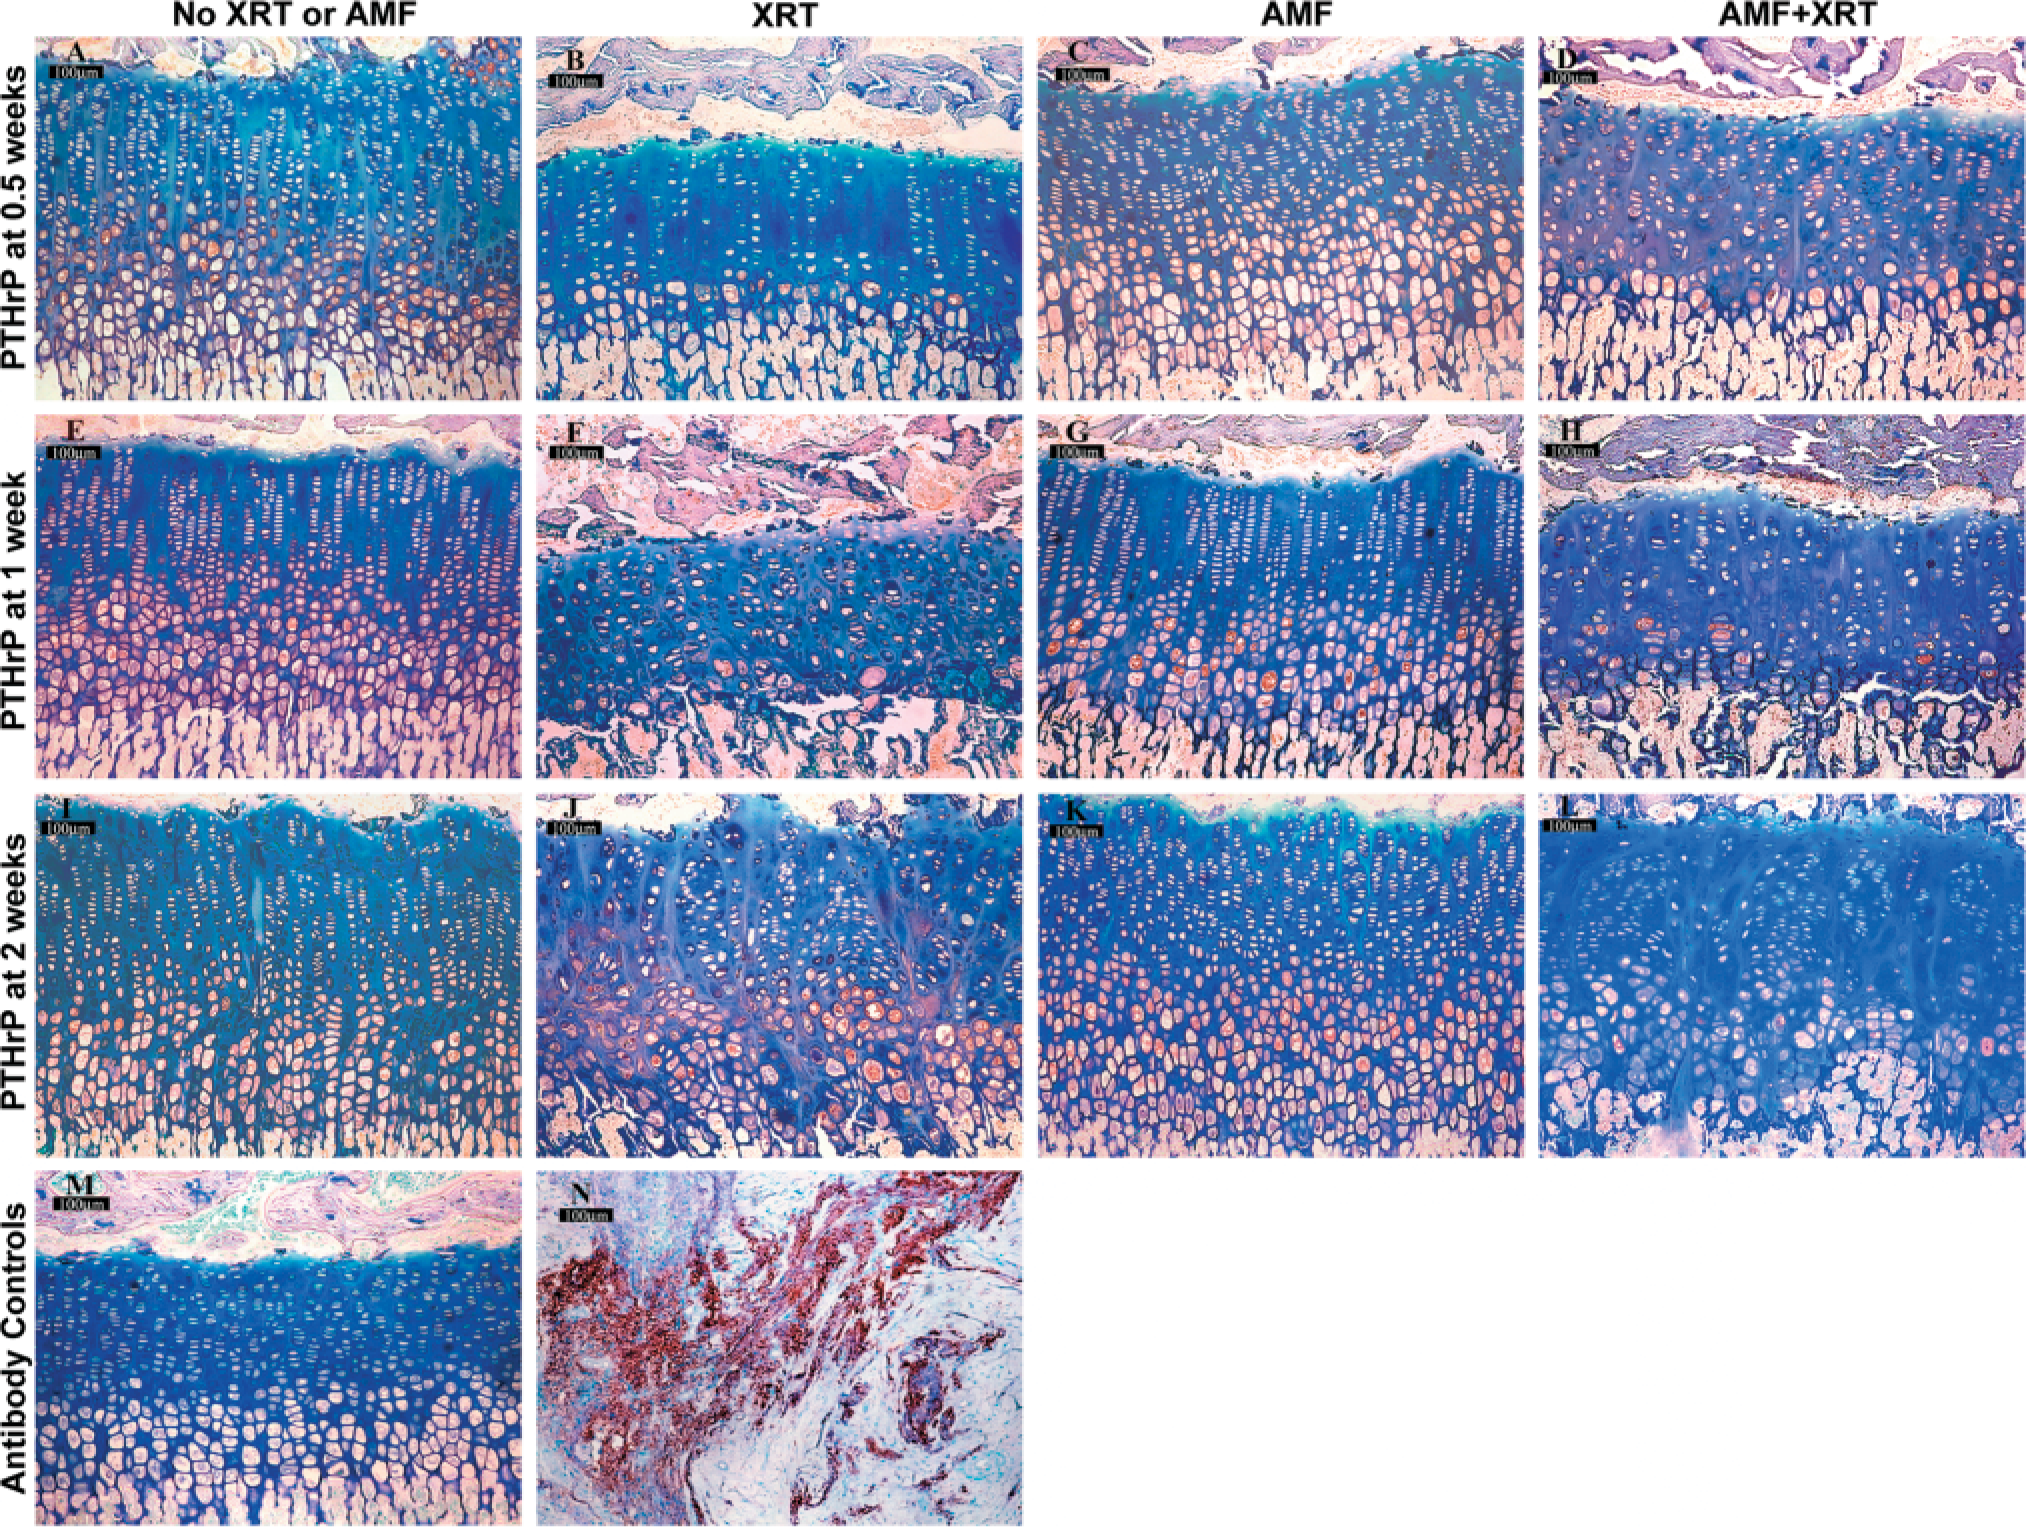
PTHrP
Control unirradiated growth plate demonstrated PTHrP expression predominately in the transitional and early hypertrophic zones (Figure 2). Mean staining index was greatest for the transitional zone, followed by the hypertrophic zone and reserve zones, respectively (Figures 5A-5C). Very little staining was observed in the proliferative zone. PTHrP staining was cytoplasmic and/or intranuclear. The PTHrP staining index did not differ markedly over time for these unirradiated controls, but the index generally tended to be gradually lower at the third and fourth weeks of observation. PTHrP has been previously observed predominately within the transitional, hypertrophic, and reserve zones, as shown here (Lee et al. 1996; van der Eerden et al. 2000).
Irradiated tissue showed the lowest staining index for PTHrP at 1 week after irradiation, falling from higher levels at 0.5 weeks in all zones (Figures 2A-2D). The decrease at 1 week corresponds to the nadir of growth plate height and growth rate as well as the peak time of growth plate histomorphometric disarray after irradiation, as previously reported (Damron et al. 2003) (Figures 2E-2H). By 2 weeks after irradiation, there was a notable return in PTHrP staining index to mean peak levels greater than control in all zones. At that point, 2 weeks after irradiation, there were notable differences between groups in the reserve, transitional, and hypertrophic zones (Figures 2I-2L). This 2-week time point represents the first point in this model at which evidence of a reparative response is observed, as shown by an increase in growth plate height, growth rate, and appearance of proliferative clones (Damron et al. 2003). At 3 weeks after irradiation, the PTHrP staining index returned to lower levels closer to, or the same as, unirradiated tissue in all zones except the reserve zone, where significantly higher levels persisted. There were notable differences between groups at 3 weeks for the reserve and transitional zones, although for the latter zone this was accounted for primarily by the lower staining index of the amifostine group. By 4 weeks, PTHrP staining index had decreased further in all zones to levels similar to those of control tissue. Both the 3- and 4-week time points correspond to a gradual return more towards a normal growth plate height, growth rate, and histomorphometry (Damron et al. 2003).
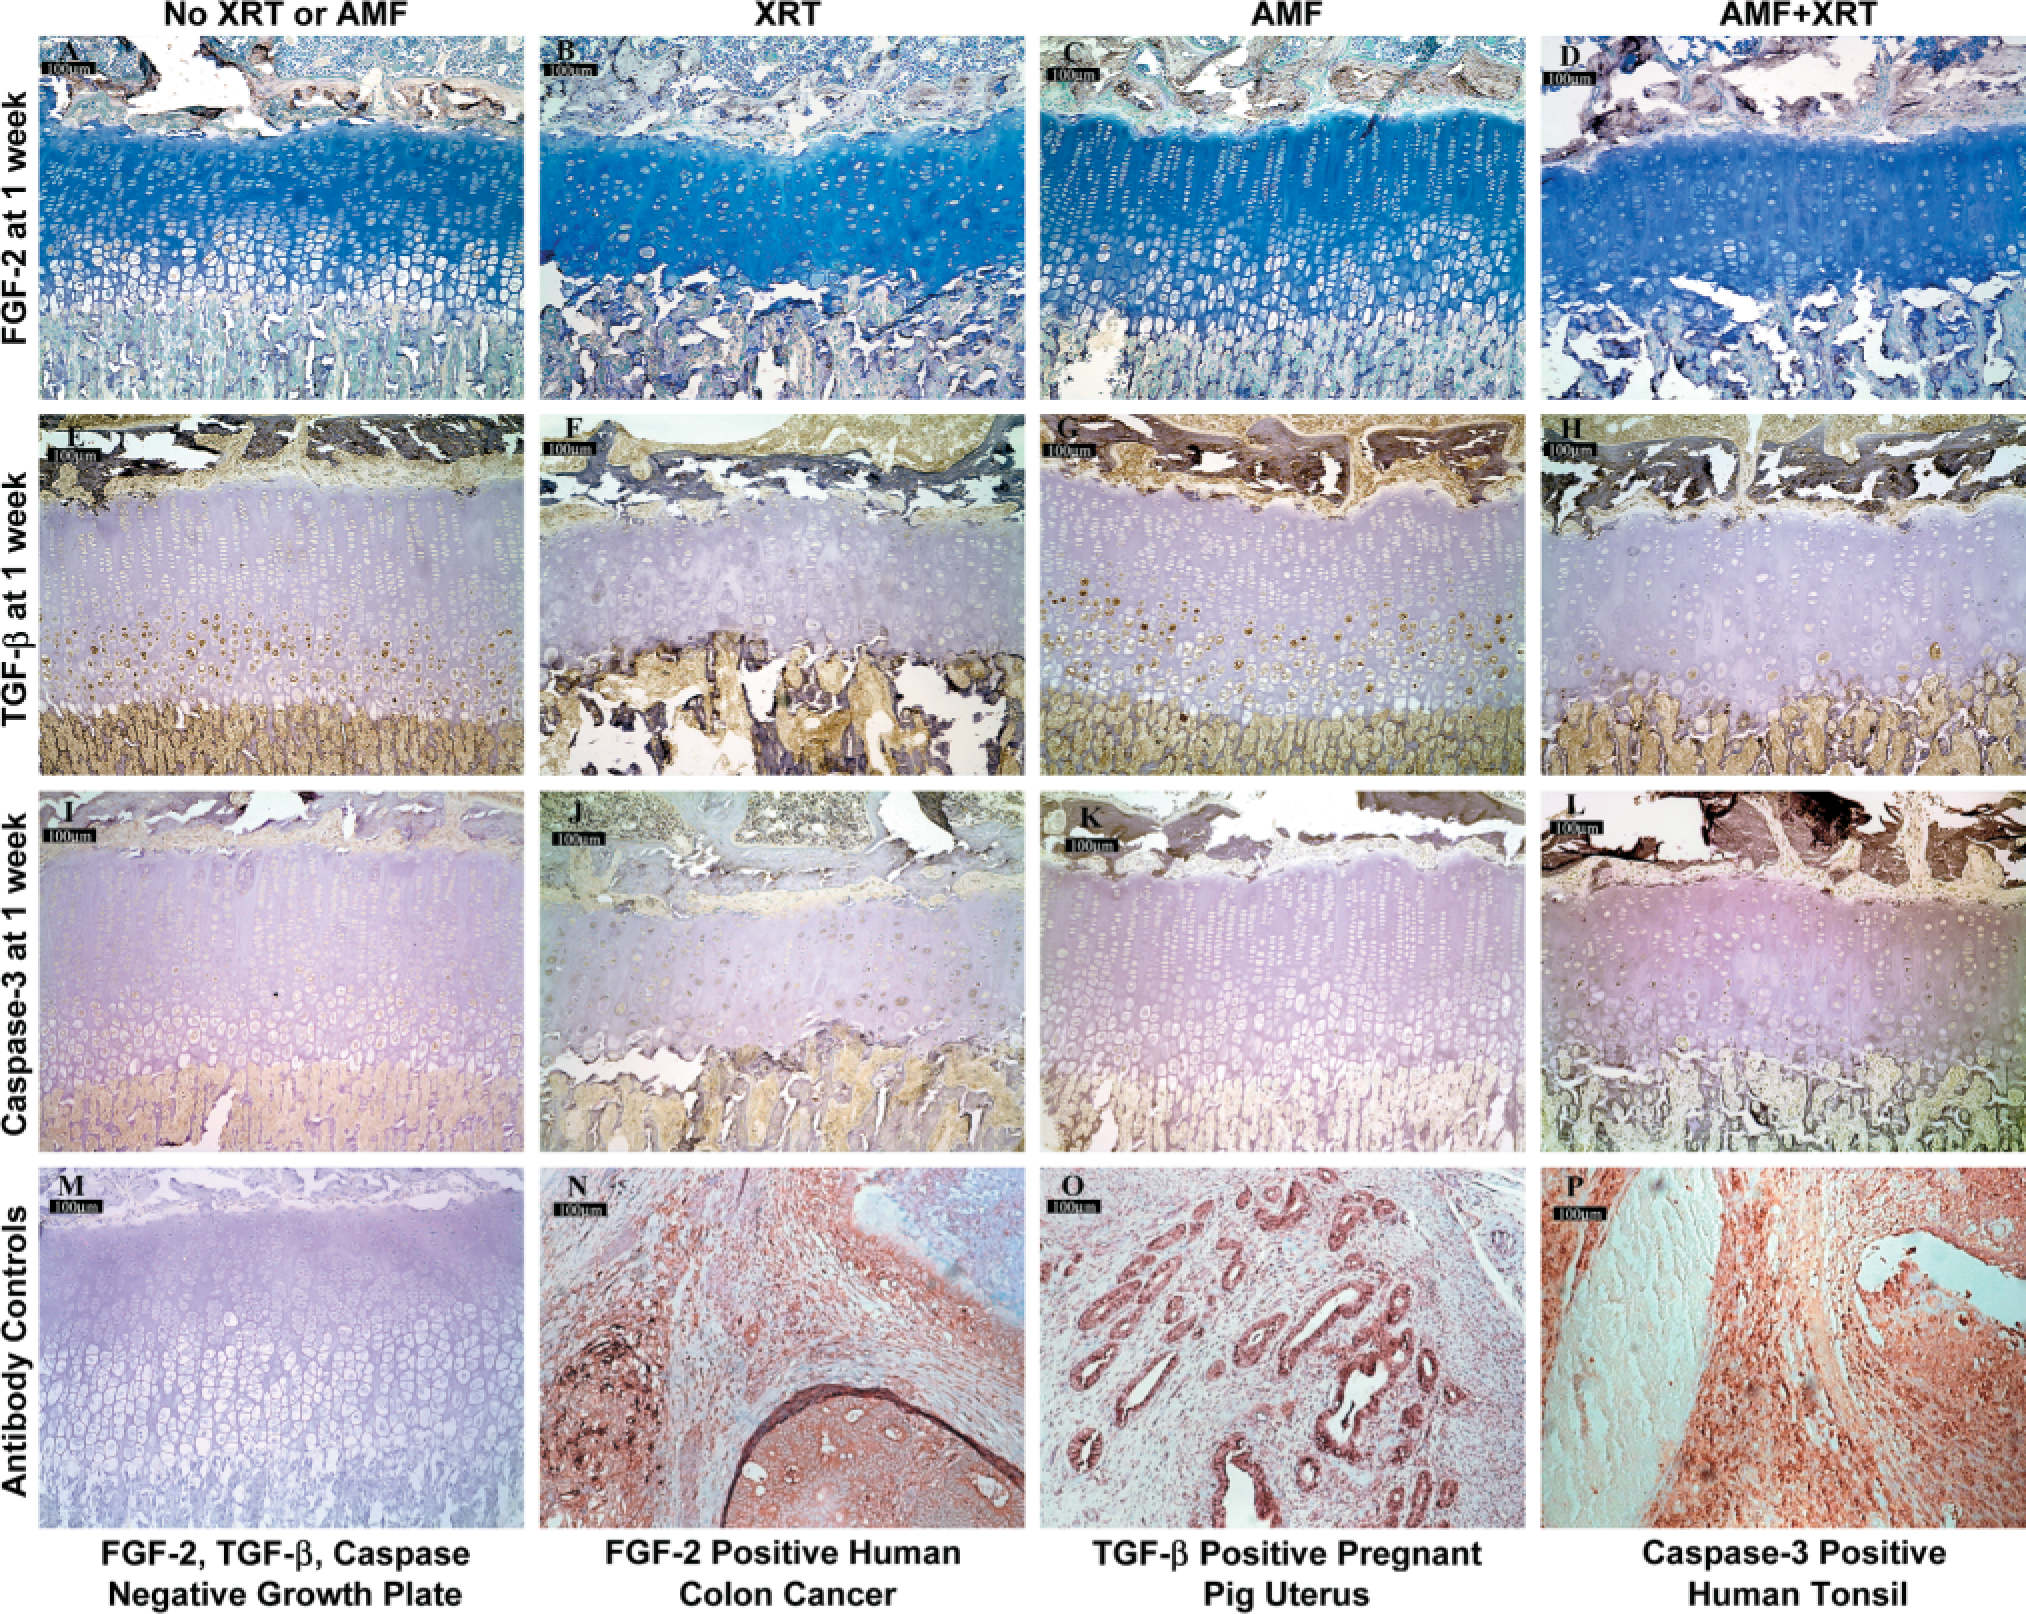
Typical IHC staining patterns for fibroblastic growth factor-2 (FGF2) (
Amifostine administration tended to blunt the initial reduction in transitional and hypertrophic zone PTHrP expression at 1 week after irradiation (Figures 5B and 5C). Surprisingly, the irradiated tissue from animals that had received amifostine did not show the increased PTHrP staining index at 2 or 3 weeks that had been seen in growth plate recovering from irradiation alone (Figures 5A-5C). The lower staining index for this group created differences in staining between groups at 2 weeks in the reserve, transitional, and hypertrophic zones and at 3 weeks in the reserve and transitional zones described earlier. Mean PTHrP staining index in the amifostine-treated and irradiated growth plate for all zones was not only less than irradiated specimens (except at 1 week) but also less than unirradiated controls for the transitional and hypertrophic zones. The PTHrP staining indices for unirradiated tibia in animals that had received amifostine were very close to control unirradiated tissue in all zones.
(
Hypertrophic zone (HZ) staining index for Bax is shown according to treatment group. Bax staining index was greatest in the hypertrophic zone. The limbs receiving amifostine, whether irradiated or not, had significantly lower levels of Bax staining index than the corresponding nonirradiated and irradiated limbs.
Bax
Bax cytoplasmic, intranuclear, and pericellular staining in controls was present in all zones but greatest in the late hypertrophic zone (Figure 3A–3D). Lesser amounts of staining for Bax were present in the transitional zone, followed by a scant amount in the proliferative zone. Essentially no reserve zone Bax staining was seen in the controls. Bax expression has been reported previously throughout the growth plate (Wang et al. 1997). After irradiation, Bax showed scattered cells with increased intensity at 1 and 2 weeks but an overall decreased staining index compared to controls in the transitional and hypertrophic zones (Figure 6). Notable differences in Bax staining index between groups were noted at 1 week in both the transitional and hypertrophic zones and at 2 weeks in the hypertrophic zone. By 3 and 4 weeks, the irradiated tissue Bax staining index had returned essentially to control levels.
The hypertrophic and transitional zone growth plate chondrocytes in the amifostine-pretreated tissue had decreased Bax expression at nearly all time points compared to controls and, most consistently, in the hypertrophic zone, also compared to irradiated tissue. This contributed to the notable differences in hypertrophic zone staining evident at 1 and 2 weeks. This was true both for right irradiated and for left unirradiated tibiae, although the staining index was lowest for the amifostine-treated unirradiated tissue (Figure 6).
Hypertrophic zone staining index for fibroblastic growth factor-2 (FGF-2) is shown according to treatment group. FGF-2 staining index was greatest in the hypertrophic zone. Note the decrease in FGF-2 staining index at 1 week after irradiation, followed by a return to normal thereafter. This pattern was representative of that observed after irradiation for TGF-β and caspase staining indices as well.
Bcl-2
Bcl-2 cytoplasmic and intranuclear staining was seen predominately in the late proliferative, transitional, and early hypertrophic zones in control tissue (Figures 3E-3H). Bcl-2 expression has been shown to decrease from proliferative to transitional and hypertrophic cells, being nearly absent in late hypertrophic cells, which is essentially identical to the distribution observed in the present report (Wang et al. 1997). After irradiation, staining for Bcl-2, following the pattern of decreased PTHrP (its upstream modulator), decreased on average to less than controls in each of those zones through 2–3 weeks, returning to control level only at 3–4 weeks, hence lagging behind PTHrP in its return by a week or more.
FGF
FGF control staining was predominately intranuclear and distributed within the transitional and hypertrophic zones, with a small amount of staining in the late proliferative region (Figures 4A-4D). Basic FGF (FGF-2) has been reported to localize in differing portions of the growth plate according to the species examined. In both the avian and the porcine growth plate, FGF-2 has been reported to localize to the hypertrophic zone, although in the former extracellular FGF-2 has also been identified in the reserve and proliferative zones (Rosselot et al. 1994; Twal et al. 1994,1996; Luan et al. 1996; Leach et al. 1997). In rats, peak FGF-2 intracellular staining has occurred in the proliferative zone and early hypertrophic zone (Jingushi et al. 1995). In normal mice, chondrocyte FGF-2 staining has been shown to be greatest in the reserve zone and lowest in the hypertrophic zone (Coffin et al. 1995).
FGF hypertrophic zone staining index after irradiation decreased to levels markedly less than control levels at 1 week and then gradually returned to control levels by 4 weeks (Figure 7). Staining after irradiation was predominately cytoplasmic from 0.5 through 2 weeks but thereafter returned to an intranuclear pattern. Amifostine blunted the initial decrease in FGF staining at 1 week after irradiation but it did not result in increased FGF staining beyond control levels thereafter, nor was there any difference in staining compared to irradiated growth plates without amifostine.
TGF-β
TGF-β control staining was both cytoplasmic and intranuclear, with a distribution throughout all zones but greatest in the late proliferative, transitional, and hypertrophic zones (Figures 4E-4H). TGF-β1 has been observed previously in the reserve, proliferative, and transitional zones of rats with weak hypertrophic staining (Matsunaga et al. 1999). Jingushi et al. (1995) localized TGF-β1 intracellular staining predominately to the proliferative and upper hypertrophic zones but extracellular staining only to the hypertrophic zone. TGF staining after irradiation decreased markedly to less than control levels at 1 week and then gradually returned to control levels thereafter. In the transitional zone, the FGF staining index decreased notably from 0.5 to 1 week and then increased from 1 week to 2 weeks. As with FGF, amifostine blunted the initial decrease in TGF staining but did not increase TGF staining beyond controls or irradiation thereafter.
Caspase
Caspase staining was predominately cytoplasmic and distributed primarily within the transitional and hypertrophic zones (Figures 4I-4L). Although there were no dramatic differences between the four groups of animals, caspase staining was generally less in the amifostine-treated animals than in those that received irradiation alone at 2 and 3 weeks in the transitional zone and at 2 through 4 weeks in the hypertrophic zone.
Discussion
The present study characterizes IHC staining for potentially important growth plate repair modulators after a single 17.5-Gy γ-irradiation dose in an active growth plate using the Sprague-Dawley rat model. These findings expand on previous reports of the normal distribution for these growth factors and apoptosis-related molecules in the unirradiated growth plate (Lee et al. 1996; Wang et al. 1997; van der Eerden et al. 2000) and support previous findings of diminished PTHrP expression after irradiation and potentially dual feedback loops for PTHrP response to growth plate injury. Novel findings include the demonstration that decreased PTHrP expression after radiation is transient, followed by a dramatic increase in the reserve and transitional zones, and that amifostine, as a radioprotectant, appears to act predominately by diminishing Bax expression, favoring reduction in apoptosis in the radioprotected growth plate.
Interpretation of the present findings must be tempered by the inherent limitations of the techniques used. The reliance on IHC alone describes only protein expression, and its grading is subjective. More objective comparison of relative protein expression between samples would require Western blotting, which was not performed in the present study. Differences in protein expression do not necessarily reflect transcriptional differences because differences in post-transcriptional processing, translation, post-translational processing, and protein degradation may also account for these changes. Hence, no conclusions can be made with respect to transcriptional differences among specimens, and examination with Northern blotting and polymerase chain reaction would be needed to assess those differences.
The decrease in PTHrP staining through 1 week after irradiation supports our hypothesis and the findings of others that PTHrP expression is diminished by irradiation (Pateder et al. 2001). However, this suppression in PTHrP expression was present in the transitional zone only at 1 week after irradiation. The subsequent increase in PTHrP expression in all zones first noted at 2 weeks after irradiation corresponds to our histomorphometric demonstration in the same animal model of return of growth plate morphology by way of proliferative clones and more normal growth rate at this same time point (Damron et al. 2003; Margulies et al. 2003). These findings suggest a potential role for PTHrP in growth plate cartilage response to injury. The significant increase in both reserve zone and transitional zone PTHrP staining 2 weeks after irradiation further supports the role of two sites of response and is consistent with an earlier reported suggestion of potentially independent feedback loops in the postnatal animal (Lee et al. 1996; van der Eerden et al. 2000).
Bcl-2 expression, which has been reported to be up-regulated by PTHrP, was found to be reduced after irradiation, as would be expected in accordance with the decrease in PTHrP, but it remained reduced for a longer period than PTHrP. Hence, Bcl-2 return in response to irradiation, after an initial nadir at 1 week, appeared to follow but to lag behind that of PTHrP. Although Bax expression did not appear consistently increased after irradiation, the relative increase in the Bax to Bcl-2 ratio for the first 2–3 weeks after irradiation at this dose in the Sprague-Dawley rat may favor apoptosis (Oltvai et al. 1993; Mullauer et al. 2001). IHC alone is probably not sensitive enough to demonstrate the subtle differences in the Bcl-2 and Bax that regulate apoptosis, and many other pro-apoptotic and anti-apoptotic molecules are involved in this intricate balance that were not examined at all. Staining for caspase did not reveal clear evidence of increased apoptosis at the time periods examined in this study. More definitive apoptotic signaling changes may be seen earlier after irradiation (within the first 24–48 hr) and may have been missed by these relatively late examinations or by artifactual absence of specific staining for active caspase markers.
TGF-β1 and FGF-2 showed a decrease in staining at 1 week and then a return toward control levels. Both of these growth factors have been shown to have positive proliferative effects on growth plate chondrocytes (Jingushi et al. 1995; Nasatzky et al. 1999; Weksler et al. 1999). Hence, their decrease would be consistent with the decrease in proliferative activity after irradiation as previously demonstrated at these time points by reduced BrdU labeling (Damron et al. 2003). TGF-β is known to increase PTHrP expression in normal epiphyseal chondrocytes and to modulate increased proliferation stimulated by 17β-estradiol (Nasatzky et al. 1999; Pateder et al. 2000). TGF-β is also increased in lung tissue of fibrosis-prone mice after thoracic irradiation in correlation with inflammatory cell infiltrates and fibrosis, changes not observed in the growth plate after irradiation (Rube et al. 2000). Therefore, as a known stimulator of extracellular matrix production, a post-irradiation increase in TGF-β would be a logical candidate to explain the apparent increase in cartilage matrix after irradiation. However, the temporal decrease in TGF-β at 1 week does not correspond to the relative increase in matrix at that time (Blobe et al. 2000). Hence, any potential relative increase in matrix production as a contributor to continued growth at the 1 week nadir in this animal radiation injury model appears to be modulated independently of TGF-β.
The growth plate chondrocyte proliferative cytokine bFGF, recognized as an endothelial mitogen, has been hypothesized to play a role in linking chondrocyte hypertrophy with blood vessel penetration (Leach et al. 1997). As reported previously for bovine chondrocytes, bFGF staining here was maximal toward the hypertrophic zone, supporting this role in vascular ingrowth of the terminal chondrocyte region. The decrease in bFGF staining at 1 week after irradiation in this model corresponds to the accumulation of increased overall growth plate height 1 week later (Damron et al. 2003; Margulies et al. 2003). A reduction in bFGF expression at 1 week may lead to reduction in vascular ingrowth into the terminal hypertrophic zone, hence contributing to accumulation of matrix and resultant growth plate thickening without the normal resorption on the metaphyseal side. TGF-β, another potent angiogenesis promoter, has not been localized to the terminal hypertrophic zone region, making it an unlikely candidate to be involved in this process (Matsunaga et al. 1999; Blobe et al. 2000). As proliferative growth factors, however, the decrease in both TGF-β and bFGF at 1 week after irradiation corresponds to the nadir in oxytetracycline-labeled growth rate. Hence, reduced proliferation after irradiation may be mediated in part by reduced expression of these growth factors.
The primary observed function of the free radical scavenger amifostine was to significantly decrease Bax staining compared to controls. This decrease was observed independent of irradiation, as both the unirradiated left-sided limbs from the animals that received amifostine and the irradiated, amifostine-pretreated right limbs from the same animals showed decreased Bax staining compared to controls. Amifostine also blunted the decrease in PTHrP that occurred at 1 week after irradiation. However, amifostine did not result in an increase over controls in the PTHrP staining observed at 2 weeks after irradiation and, in fact, was markedly below control and irradiated limb levels of staining at this time point. The fact that amifostine-treated irradiated limbs, which have been shown previously to have increased growth rate over untreated irradiated limbs, did not show the same increase in PTHrP over controls, as was observed in the irradiated limbs, downplays the role that PTHrP seems to have in modulating the effect of amifostine at the 2-week time point after irradiation in this animal model. Therefore, it is more likely that amifostine achieves its positive effects on restoring irradiated growth plate chondrocyte function through a Bax-mediated decrease in apoptosis rather than entirely and directly through the PTHrP pathway.
Similarly, the amifostine-treated limbs after irradiation did show some decrease in the drop in TGF-β1 and FGF-2 staining that occurred with irradiation alone at 1 week after irradiation. However, similar to its lack of effect at 2 weeks on PTHrP, amifostine-treated irradiated growth plates did not show any notable increase in TGF-β1 or FGF-2 staining beyond controls at the key 2-week time point corresponding to the point of first observed return of proliferative clones. Hence, similar to its action relative to the PTHrP/Bcl-2 pathway, amifostine does not appear to achieve its effects on growth plate chondrocytes directly via upregulation of the proliferative mediators TGF-β and FGF-2 at the 2 week point in this model.
In summary, the Sprague-Dawley rat growth plate, irradiated with a single fraction at a level that allowed recovery of function, followed a temporal sequence of changes in the expression of many potentially important modulators. The major effects of irradiation from this perspective included a notable decrease in PTHrP, TGF-β, and FGF-2 at 1 week after this single 17.5-Gy fraction. The recovery phase seen initially at 2 weeks after irradiation was characterized by a marked increase in PTHrP expression in the reserve, transitional, and hypertrophic zones, supporting the importance of PTHrP in a postnatal regulatory feedback loop. The proliferative growth factors TGF-β in the transitional zone and FGF-2 in the hypertrophic zone also returned rapidly to control levels as the growth plate began to recover. However, the exact interrelationship among these various modulators remains unclear and awaits further more detailed study.
Other candidate radioprotectant drugs that use mechanisms such as the PTHrP/Bcl-2 pathway or that have a positive effect on proliferative mediators may provide a basis for combination therapies that will result in greater overall radioprotection than when the drugs are used independently. Hence, combination therapy using amifostine with other radioprotectants warrants further study.
Footnotes
Acknowledgements
Supported by grants from the Children's Miracle Network, the Orthopaedic Research Foundation, and the NIH (CA83892).
We thank Patrick Damron and James Lindbom, MD, for their assistance in procuring porcine tissue for this study. We also thank Lee Reichel for technical assistance.