
Abstract
Despite the continued presence of growth plates in aged rats, longitudinal growth no longer occurs. The aims of this study were to understand the reasons for the cessation of growth. We studied the growth plates of femurs and tibiae in Wistar rats aged 62–80 weeks and compared these with the corresponding growth plates from rats aged 2–16 weeks. During skeletal growth, the heights of the plates, especially that of the hypertrophic zone, reflected the rate of bone growth. During the period of decelerating growth, it was the loss of large hydrated chondrocytes that contributed most to the overall decrease in the heights of the growth plates. In the old rats we identified four categories of growth plate morphology that were not present in the growth plates of younger rats: (a) formation of a bone band parallel to the metaphyseal edge of the growth plate, which effectively sealed that edge; (b) extensive areas of acellularity, which were resistant to resorption and/or remodeling; (c) extensive remodeling and bone formation within cellular regions of the growth plate; and (d) direct bone formation by former growth plate chondrocytes. These processes, together with a loss of synchrony across the plate, would prevent further longitudinal expansion of the growth plate despite continued sporadic proliferation of chondrocytes.
L
Despite all the advances made in recent years, understanding longitudinal bone growth is still a challenge to the cell biologist because it is difficult, in the growth plate of rapidly growing animals, to separate the multitudinous events temporally and spatially. In larger mammals (rabbit upwards), the growth plates close at skeletal maturity and longitudinal growth ceases. Smaller rodents (rats, mice), however, maintain a growth plate into old age (Mehta et al. in press). Although this provides the potential for continued longitudinal growth, in reality bone growth ceases after a certain time. In rats, the rate of growth increases between 1 and 5 weeks, then declines until skeletal maturity, which is achieved by 11.5–13 weeks (Kember 1973; Hunziker and Schenk 1989). Bones still continue to grow, albeit at a reduced rate, until ∼26 weeks of age, after which growth virtually ceases in rats (Walker and Kember 1972). The reason for the continued presence of a growth plate in the absence of longitudinal growth is not understood, nor is it known why linear growth no longer occurs.
We studied the age-related changes in growth plate morphology during the period of 2–16 weeks, which included periods of accelerating growth, skeletal maturity and decelerating growth. In the growing animals, we could relate the height and morphology of the growth plates to the rate of longitudinal growth, in agreement with previous studies. In the aged rats, we identified four categories of age-related changes in the growth plate, each of which altered growth plate function and could potentially explain and contribute to the observed cessation of growth.
Materials and Methods
Animals
All animal experimentation was performed under license from the Home Office in accordance with the Animals Act (1986). Wistar rats, bred in the University of Southampton animal facility, were housed in plastic boxes in rooms maintained at 22C with a 12-hr light cycle. All animals had free access to water and food. For studies of the growth plates of younger rats, rats were culled at 2, 4, 8, 12, or 16 weeks (two to four rats in each group). In addition, 10 rats were allowed to live without intervention until they died from natural causes or were culled if there was evidence of pain or distress. The time of death (or culling) ranged from 62 to 87 weeks.
Tissue Processing and Histology
Tibiae and femurs were removed and fixed in 4% paraformaldehyde for 48 hr and decalcified in 5% EDTA in 0.1 M Tris at 4C, which was replaced on a weekly basis until decalcification was complete. The proximal and distal parts of the bones were cut longitudinally. The proximal part of the femur was cut through the femoral head, whereas the distal part of the femur and the proximal portion of the tibia were cut coronally through the midline such that two symmetrical anterior and posterior portions remained. These bone samples were dehydrated in graded ethanols, cleared in chloroform, and embedded in paraffin. Longitudinal sections (6 μm) were obtained from the proximal and distal parts. These were mounted on poly-L-lysine-coated slides and stained by one of the following methods. Alcian blue and Sirius red were used (Lison 1954) to distinguish red-staining bone matrix from blue-staining cartilage matrix. Enzyme histochemistry for tartrate-resistant acid phosphatase activity (TRAP) was carried out to identify osteoclasts and hence regions of resorption. The method used naphthol AS-BI phosphate and hexazotized pararosaniline, as previously described (Roach 1999).
Immunocytochemistry was carried out for proliferating cell antigen (PCNA), a marker of cell proliferation, the S-100 protein, a marker of cells of the chondrocytic lineage, and type I collagen, the typical bone-type collagen. The anti-PCNA (monoclonal anti-rat, 1:100 dilution) was obtained from DAKO (Glostrup, Denmark); the anti-S-100 antiserum (rabbit anti-bovine, 1:200 dilution) was obtained from Sigma (Poole, Dorset, UK), and the anti-type I collagen (LF-67, rabbit anti-human, crossreacts with rat, 1:300 dilution) was a gift from Dr. Larry Fisher (NIH, Bethesda, MD). For PCNA immunocytochemistry, sections were covered with the primary antibody overnight at 4C, followed by visualization with the avidin-biotin method with peroxidase and 3-amino-9-ethylcarbazole (AEC), yielding a brown reaction product. These sections were counterstained with 0.2% light green and 1% Alcian blue. Control sections were incubated with mouse serum (negative control; Sigma), and then treated as above. No staining was found in control sections. For double immmunocytochemistry of type I collagen and the S100 protein, sections were incubated with the anti-type I antibody for 2 hr at room temperature, followed by visualization with avidin-biotin-peroxidase and AEC as above. The sections were then incubated with the anti-S100 antibody overnight and visualized using the alkaline phosphatase anti-alkaline phosphatase method (APAAP) with Fast blue, yielding a blue reaction product (Cordell et al. 1984).
Results
Changes in the Growth Plates Up to and Beyond Skeletal Maturity (2–16 Weeks)
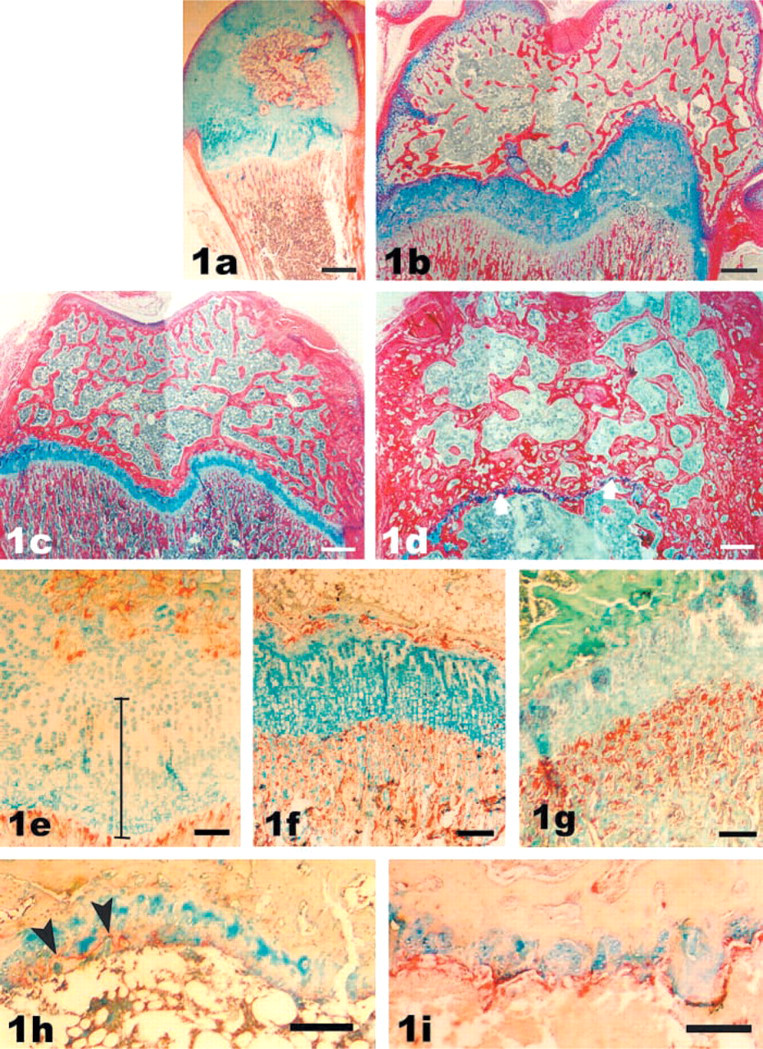
Using the Alcian blue-Sirius red stain, the growth plate cartilage could be clearly distinguished from bone and appeared as a blue band between the secondary ossification center of the epiphysis and the metaphyseal spongiosa (Figures 1a-1d). At 2 weeks, approximately half of the cartilaginous epiphysis (chondroepiphysis) had been replaced by the secondary ossification center (Figure 1a). At this age, the height of the growth plate could not be taken as the distance between the primary spongiosa and the secondary ossification center (bony epiphysis), because approximately one third of that distance still represented the epiphyseal cartilage of the chondroepiphysis rather than growth plate cartilage. The latter could be discerned from the morphology of the chondrocytes and is marked by the bar in Figure 1e. At 4 weeks, the secondary ossification center almost, but not quite, filled the chondroepiphysis. The height of the growth plate was now equal to the distance between the secondary center of ossification and the metaphysis, at least in the central part of the plate. By 8 weeks (not shown) and 12 weeks (Figure 1c), the height of the growth plate had started to decrease, with a further slight decrease evident at 16 weeks (not shown). In old rats, only a very thin band of growth plate cartilage remained (arrows in Figure 1d).
To identify ongoing resorption, sections were stained for TRAP activity, which identifies resorbing cells, such as osteoclasts (Mostafa et al. 1982; Hermanns 1987). During bone remodeling, TRAP activity is also present in the matrix at “reversal” lines marking the border where resorption has ceased and deposition of new bone matrix has commenced (Roach 1999). At 2 and 4 weeks, resorption took place at the epiphyseal and metaphyseal borders of the growth plates (Figures 1e and 1f), whereas from 12 weeks onwards resorption was confined to the metaphyseal border (Figure 1g). In old rats, TRAP activity was either completely absent or was present in the matrix at the reversal line which, in this case, marked the border between horizontal bone deposition (see below) and growth plate cartilage (Figure 1h). Only in one old rat, which had died of kidney failure, were many TRAP-positive cells observed at the diaphyseal border of the growth plate as well as on bone trabeculae (Figure 1i), suggesting ongoing resorption of the growth plate cartilage.
Distal epiphyses of the rat femur during early growth (2 weeks,
Changes in the heights and morphology of the distal femoral growth plates (
Comparison of the proximal tibial growth plate of an 8-week-old rat (
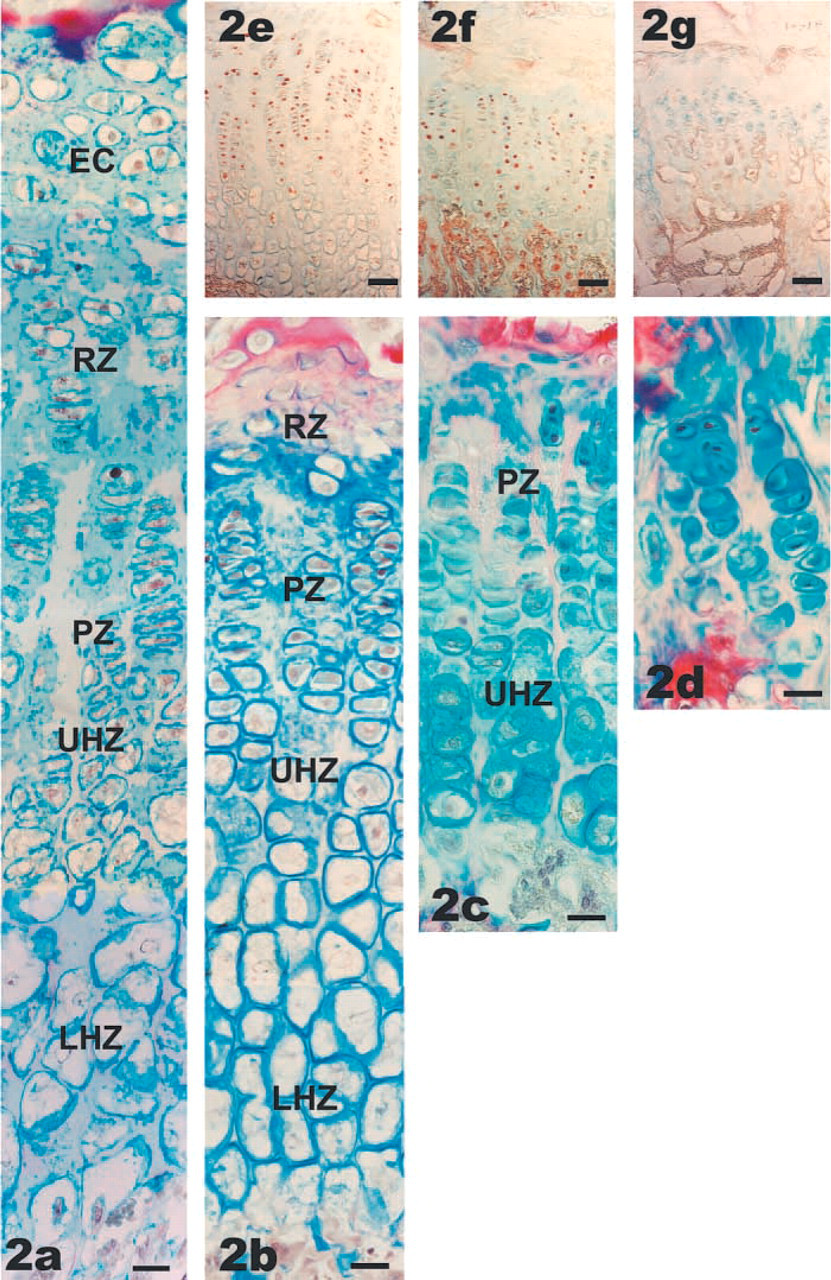
A more detailed examination of the growth plate structure at the various ages demonstrated that the heights of the metaphyseal growth plates changed considerably with age, as illustrated in Figure 2. Maximal growth plate height was achieved at 2 and 4 weeks (Figures 2a and 2b) and at this stage the various zones of the growth plate, i.e., the reserve zone (RZ), proliferative zone (PZ), upper hypertrophic zone (UHZ), and lower hypertrophic zone (LHZ), were clearly distinguished. The lower hypertrophic zone was wide and included chondrocytes with cell heights up to 40 μm. The decrease in the heights of the growth plates was mostly due to loss of the lower hypertrophic zone (12 weeks; Figure 2c) and in old rats all cells were of similar size, which corresponded to the size of the proliferative cells of the younger growth plates (Figure 2d).
To determine the incidence and location of cell proliferation, sections were stained for PCNA, a marker for proliferating cells (Tajima et al. 1996; Iwaki et al. 1997). As expected, chondrocytes of the proliferative zone showed a high incidence of cell division during the rapid growth periods at 2 (not shown) and 4 weeks (Figure 2e), whereas hypertrophic chondrocytes were negative for PCNA. This high incidence was maintained in the proliferative zone at 12 weeks (Figure 2f), when PCNA-positive cells were also found in some cells close to the vascular front which, judging from their size and morphology, were in the hypertrophic region. In the growth plates of old rats, PCNA-positive cells could no longer be identified (Figure 2g).
Growth Plate Morphology of Old Rats
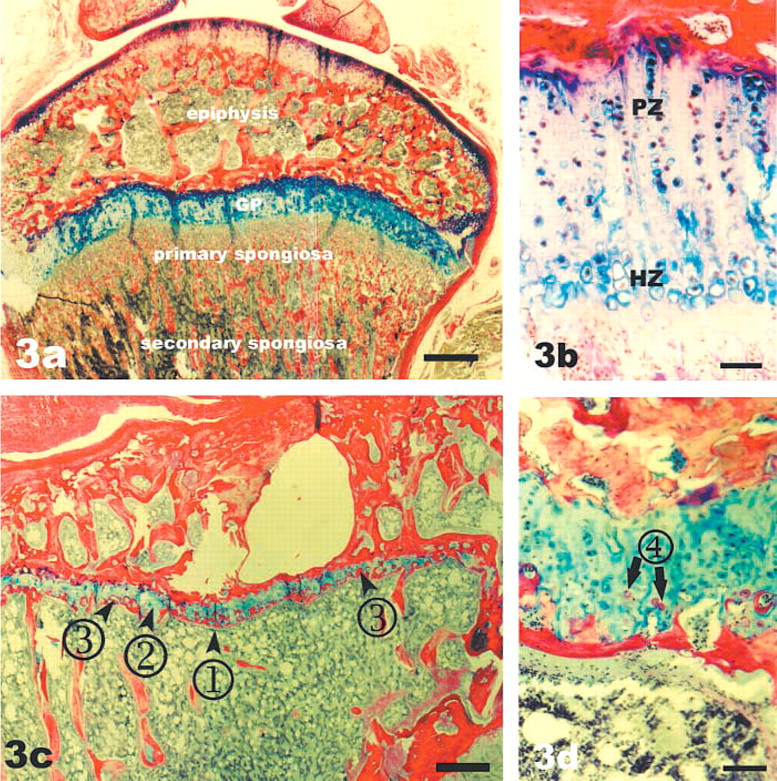
Although the heights of the growth plates changed with age until at least 16 weeks, the height within a given growth plate was fairly uniform, as illustrated by the 8-week-old tibial growth plate shown in Figure 3a, where the blue-staining band of growth plate cartilage separated the bony epiphysis from the endochondral bone of the spongiosa. In contrast, the growth plates of old rats were irregular and the spongiosa consisted of a few fairly thick spicules. In addition, several features were found that were not present in younger animals. These were (a) a thin band of bone matrix apposed horizontally to the growth plate cartilage (1 in Figure 3c, also seen as a red-staining band in Figure 3d), (b) large regions of cartilage that did not contain cells (2 in Figure 3c, better illustrated in Figures 4a-4c) alternating with regions of high cellularity, (c) partial resorption of the core growth plate cartilage and replacement with bone (3 in Figure 3c, better seen in Figures 4g-4i), and (d) apparent bone formation within the lacunae of growth plate chondrocytes (4 in Figure 3d, better seen in Figure 5). These features were found in all growth plates of aged rats, although the extent of each varied among animals.
Features of aged rat growth plates: Acellularity (
Horizontal Bone Band. During endochondral ossification in young growth plates, bone matrix is deposited onto struts of non-resorbed calcified cartilage that project into the marrow space at a right angle to the growth plate disc (Figures 1a-1c and Figure 3a). In the aged rats, spongiosa was absent in some regions, presumably as a consequence of resorption (Figure 3c). In such areas, bone matrix was directly apposed to the cartilage, parallel to the growth plate (Figure 3d), effectively sealing the growth plate with bone at the metaphyseal border.
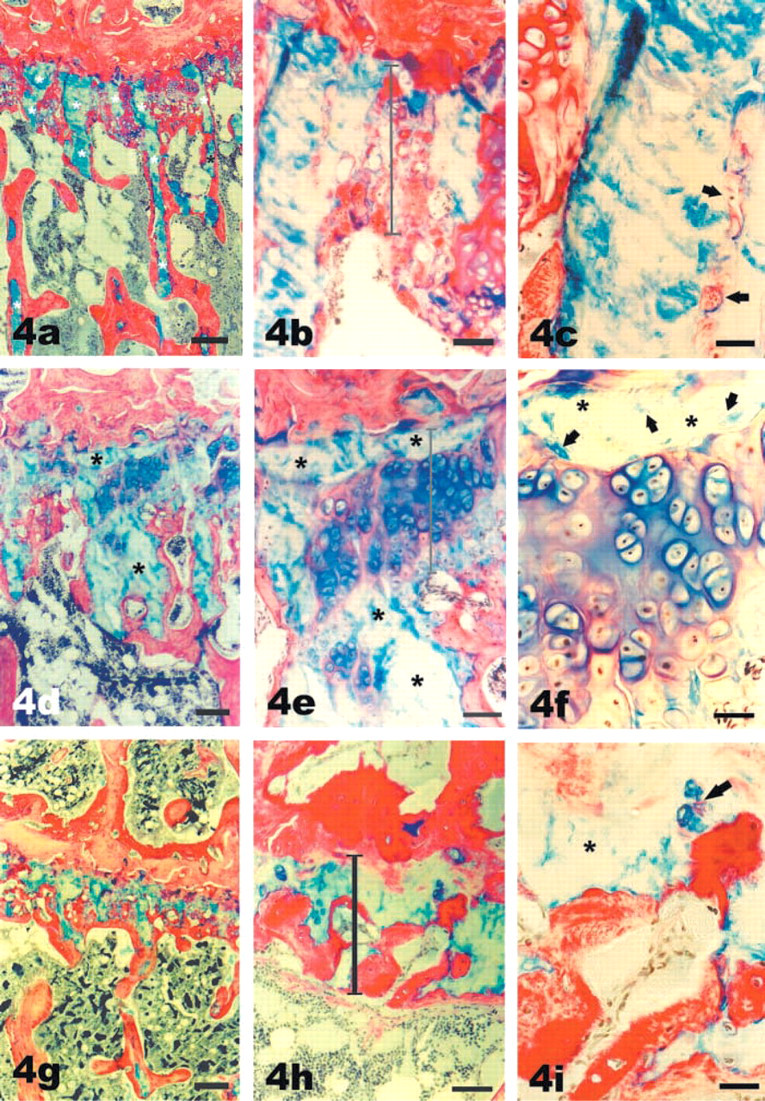
Acellularity and High Cellularity. In the growth plates of young rats, the cartilage core, which forms the center of the spicules of primary and secondary spongiosa, is usually thin and is only detectable only at higher magnification. By contrast, some spicules of aged rats contained a wide core of cartilage that was evident even at low magnifications and often persisted well below the average height of the growth plate (∗ in Figures 4a, 4d-4f, and 4i). Closer examination of these cartilage cores revealed that no cells were present (Figure 4b and 4c). Such acellular regions could extend from the former reserve zone to the vascular front and beyond into the spongiosa (Figure 4a), suggesting that the cartilage matrix was more resistant to resorption than adjacent cellular matrix. Acellular areas were also identified in the growth plates of 12-and 16-week-old animals, although less frequently (not shown). Adjacent to acellular regions, regions of high cellularity were frequently present (Figures 4d and 4e). They were characterized morphologically by the deeper Alcian blue staining, which is indicative of recently synthesized proteoglycans (Figures 4e and 4f), and by the fact that cells were present in clusters. The close proximity of the cells within a cluster (Figure 4f) suggested that the increased cellularity had resulted from cell division. However, PCNA was not detectable by immunocytochemistry (not shown) within these clusters, indicating that the cells had left the cell cycle, i.e., that the cell division had happened some time ago. Often the cellular regions appeared confined by adjacent acellular regions, suggesting that the expansion of the chondrocytes had been limited by external constraints.
Remodeling of Core Growth Plate Cartilage. In the growth plates of young rats, resorption of cartilage takes place at the vascular front in a coordinated and uniform manner, so that the overall height of the growth plate (the core cartilage) remains constant within an individual growth plate. Although the growth plates of old rats were irregular, it was still possible to approximate an average height of core cartilage by viewing the whole growth plate at low magnification, (see Figure 3c, shown at higher magnification in Figures 4h and 4i). Acellular regions, as mentioned above, clearly extended below this average core into the spongiosa. In addition, vascular invasion from the marrow space had taken place into this core of growth plate cartilage in many samples from the aged rats (Figures 4g-4i) and bone matrix had been deposited on the edges of the resorbed cartilage cavities (Figures 4h and 4i). In location, this was different from the normal process of endochondral ossification, in which bone is deposited onto struts of cartilage that project below the height of the growth plate. We shall refer to this process as remodeling of core cartilage. In general, this remodeling was confined to the lower half of the growth plate, but could reach towards the upper third of the growth plate (Figures 4h and 4i).
Intralacunar Bone Formation by Former Chondrocytes? A rarer feature than the previous three was the finding that a Sirius red-positive matrix surrounded some individual chondrocytes within the growth plate cartilage (Figures 5a-5c). In the examples illustrated, the cells were found at some distance from vascular channels. In some lacunae, the matrix stained both red (typical for bone) and blue (typical for cartilage, arrows in Figure 5b). Occasionally cells were surrounded by a very thin line of red-staining matrix only (arrowheads in Figure 5b), which probably indicated a very early stage. More frequently, the Sirius red-positive matrix filled the lacuna or extended over several lacunae (∗ in Figure 5b).
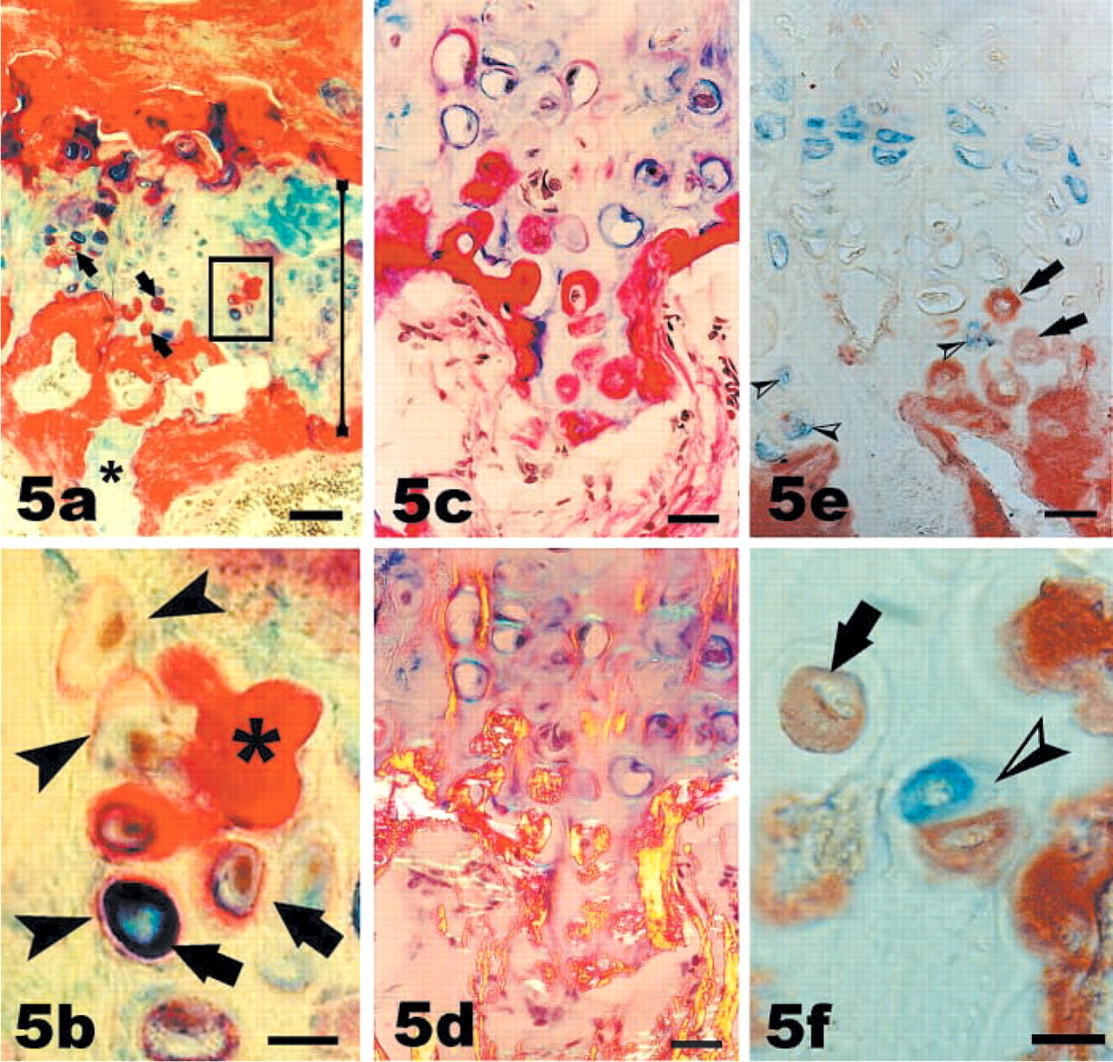
Bone formation within chondrocytic lacunae. (
The Sirius red-positive intralacunar matrix displayed the typical birefringence of bone matrix (Figure 5d) and was immunopositive for type I collagen (arrows in Figures 5e and 5f), suggesting that bone matrix had been formed by former chondrocytes. In some cases (not shown), vascular invasion was closely associated with this intralacunar bone formation. Hence, the possibility that a lacuna that appeared intact in one section was connected to a vascular channel in the third dimension could not be excluded, and it was therefore possible that in these instances vascular-derived osteoblasts had deposited the bone matrix. However, in many cases (illustrated by Figure 5) bone matrix-containing lacunae were at a considerable distance from the vascular spaces, suggesting that the lacuna had remained intact and that the bone matrix had been synthesized by former chondrocytes.
To determine whether the type I collagen matrix co-localized with the chondrocyte-specific marker S100 (Weiss and Dorfman 1986), double immunocytochemistry was carried out. Staining for S100 was observed in chondrocytes, but not all chondrocytes were positively stained (Figure 5e). Staining was best in chondrocytes of the upper regions of the old rat growth plates, whereas the cells closer to the vascular front (i.e., the region of interest) were generally negative for S100, with a few exceptions (arrowheads in Figure 5e). It is possible that the immuno-reactivity for S100 was reduced in the old rat growth plates, which unfortunately prevented definite conclusions about whether type I collagen co-localized with the S100 protein. Thus far, cells that were positive for type I collagen (arrows in Figure 5e) were distinct from cells positive for S100 (arrowheads in Figure 5e). Because previous work had demonstrated that an asymmetric cell division was the crucial early event in the transdifferentiation from hypertrophic chondrocytes to bone-forming cells in chick growth plates (Roach et al. 1995), we searched for examples of asymmetric doublets, i.e., two cells with different characteristics present within the same lacuna. Indeed, a doublet in which one cell was positive for type I collagen and the other positive for the S100 protein was identified. This supported the notion that the osteogenic differentiation of chondrocytes in the old rats was not a gradual further differentiation of chondrocytes but was rather a transdifferentiation in which acquisition of the osteogenic phenotype coincided with loss of the chondrogenic phenotype. If this was the case, then it would be unlikely that type I collagen would co-localize with the S100 protein in the same cell, because the two phenotypes would be mutually exclusive.
Extensive intralacunar bone, such as that illustrated in Figure 5, was observed only in 2/10 animals, which raised the question of what was special about these two animals. Although we could not provide a definitive answer, we noted more evidence of anabolic bone formation within the medullary space in these animals compared with the rest, suggesting that these two rats had received some unknown anabolic stimulus.
Discussion
This study first described the changes in rat growth plates that relate to the overall rate of longitudinal growth up to skeletal maturity, then identified those changes that occurred within the growth plates after growth had ceased. The overall height of the growth cartilage was an indication of the rate of longitudinal bone growth, in agreement with previous studies (Thorngren and Hansson 1973; Hunziker and Schenk 1989). During the period of rapid growth (up to 5 weeks), the height of the growth plate was greatest, whereas during the period when growth was slowing down (8–16 weeks), the height of the growth plate progressively decreased. This decrease could be a consequence either of a reduced rate of proliferation or an increased rate of cell death of terminal chondrocytes at the chondro-osseous junction. In rabbits (Aizawa et al. 1997), both were found to contribute to the decrease in growth plate height and eventual closure. The percentage of proliferating cells fell from 55% at 5 weeks to 13% at 20 weeks, whereas the percentage of TUNEL-positive chondrocytes increased from 3% to 26% during the same time period (Aizawa et al. 1997). As the present study and those of others (Breur et al. 1991; Kuhn et al. 1996; Wilsman et al. 1996; Farnum et al. 2002) have shown, the greatest contribution to the overall growth plate height was the hypertrophic zone, particularly the final cell volume achieved by hypertrophic chondrocytes. After the growth spurt, the lower hypertrophic zone, which contained the extremely large and hydrated hypertrophic chondrocytes, gradually disappeared, whereas the height of the proliferative zone and the rate of proliferation remained relatively constant, at least until 12 weeks, as indicated by a similar incidence of PCNA-positive chondrocytes. In old rats, the large hydrated cells were absent altogether, indicating that the capacity for volume increase was lost with age. It is not known what regulates the volume increase of hypertrophic chondrocytes during periods of active growth or what prevents the volume increase as growth slows down. It could be a function of the lifespan of hypertrophic cells or the rate of cartilage erosion at the vascular front. When vascular invasion of the cartilage was delayed, either by insufficient mineralization, as in rickets, or by absence of MMP-9 (Vu et al. 1998), hypertrophic chondrocytes lived longer but the cell volume did not continue to increase. Whatever the mechanisms for the volume increase during hypertrophy, absence of this increase appeared be the main factor associated with deceleration and, eventually, cessation of growth.
After 28–30 weeks, growth virtually ceases in rats (Walker and Kember 1972). However, changes in growth plate structure still took place, as deduced from the morphology of the growth plates in aged rats. These changes were (a) increased acellularity coupled with high cellularity in adjacent regions, (b) remodeling of the core growth plate cartilage, (c) bone formation by former chondrocytes, and (d) sealing of the growth plate at the metaphyseal edge with bone matrix. Increased irregularities and formation of a horizontal bone band had also been noted by Kimmel (1991) and Kalu et al. (1984).
The presence of large acellular regions suggested that the chondrocytes, which had formed this cartilage, had undergone programmed cell death and that the cell remnants had been eliminated in situ. In apoptosis, the major type of programmed cell death (type I cell death), the end stage is the formation of apoptotic bodies, which are removed by heterophagocytosis (reviewed by Henson et al. 2001) There are, however, other modes of programmed cell death (reviewed by Clarke 1990; Leist and Jaattela 2001). For example, type II cell death is known to be associated with autophagosomes/autolysosomes and the dead cells are eliminated via an autophagocytic process (reviewed by Majno and Joris 1995; Bursch 2001; Uchiyama 2001). Such modes of death are prevalent when the heterophagocytic process would be overwhelmed or when phagocytosis of apoptotic remnants would be impossible, e.g., during insect metamorphosis (Lockshin and Zakeri 1994), in the developing nervous system (Uchiyama 2001), or in chondrocytes that are surrounded by extracellular matrix (Roach and Clarke 1999, 2000). The presence of vast acellular regions in the growth plates of aged rats is consistent with cell elimination via an autophagocytic process. Surprisingly, these vast acellular areas of cartilage appeared to be more resistant to resorption and vascular invasion than adjacent cellular regions, since the acellular regions persisted below the level of the growth plate cartilage. Cartilage is generally avascular due to the presence of antiangiogenic molecules, but the resistance to invasion is normally overcome in the hypertrophic zone (Cancedda et al. 1995; Alini et al. 1996). The present results suggest that the presence of viable cells was likely to be essential in overcoming this resistance.
Acellular regions were observed to alternate with regions of high cellularity. Because ongoing proliferation could not be demonstrated in the old rats, the high cellularity suggested that cell proliferation had occurred at some stage after growth had ceased but that insufficient matrix synthesis had failed to separate the daughter cells. Morphologically, such regions resembled the proliferative zone of younger growth plates in some places, but the crucial difference was the lack of synchrony across the plate. Linear growth would be possible only if proliferation of one column of chondrocytes occurred in synchrony with its lateral neighbors across the entire plate. Because this was not the case in the aged rat growth plates, expansion, if it occurred at all, was localized and was also constricted by adjacent acellular regions as well as by bone formation at the metaphyseal edge.
The second feature found only in the growth plates of aged rats was remodeling within the core of growth plate cartilage, where the core is defined as that cartilage that was present in the growth plate when longitudinal growth ceased. The process was similar to endochondral ossification in that resorption of cartilage matrix was followed by bone deposition onto the walls of the resorbed cavities. The crucial difference was the location of this ossification, in that it was found within the core of growth plate cartilage, not within the vascular/marrow space as would be the case in younger rats. The degree of within-GP remodeling was related to the degree of overall bone remodeling (unpublished observations), suggesting that the growth plate was subject to the same factors that stimulated bone remodeling.
In addition to remodeling of core cartilage, a bonelike matrix was also observed within chondrocytic lacunae, suggesting that some chondrocytes in aged rat growth plates had become bone-forming cells. There has been considerable debate over the past 40 years about whether chondrocytes can become bone-forming cells under certain circumstances (Holtrop 1966; Moskalewski and Malejczyk 1989; Thesingh et al. 1991; Descalzi-Cancedda et al. 1992; Roach 1992, 2002; Roach et al. 1995). In the growth plates of younger rats, there was no evidence of bone formation by chondrocytes. Even in the older rats, intralacunar bone matrix was mainly observed in some rats, suggesting that additional, presumably anabolic, stimuli were required for intralacunar bone formation. These findings add to the weight of evidence that chondrocytes have the potential to become bone-forming cells, but only fulfill this potential under the appropriate stimulus.
In summary, the present studies provide new insights into the mechanisms of restricting longitudinal growth in old rats despite the presence of a growth plate. The overall lack of synchrony of cellular events, the increase in the acellular areas combined with remodeling of the core cartilage, and sealing of the growth plate at the metaphyseal border resulted in a growth plate that was no longer functional so that longitudinal growth was restricted or impossible.
Acknowledgments
We are grateful to Dr S. Langley-Evans and Dr A. Ahie-Sayer (MRC Environmental Epidemiology Unit, University of Southampton) for providing the rat bones. We also wish to acknowledge the superb technical expertise of Ms Stefanie Inglis.