
Abstract
Aneuploid cancers exhibit a wide spectrum of clinical aggressiveness, possibly because of varying chromosome compositions. To test this, karyotypes from the diploid CCD-34Lu fibroblast and the aneuploid A549 and SUIT-2 cancer lines underwent fluorescence in situ hybridization (FISH) and DAPI counterstaining. The number of DAPI-stained and FISH-identified chromosomes, 1–22, X,Y, as well as structural abnormalities, were counted and compared using the χ2, Mann–Whitney rank sum test and the Levene' equality of variance. Virtually all of the evaluable diploid CCD-34Lu karyotypes had 46 chromosomes with two normal-appearing homologues. The aneuploid chromosome numbers per karyotype were highly variable, averaging 62 and 72 for the A549 and SUIT-2 lines, respectively. However, the A549 chromosome numbers were more narrowly distributed than the SUIT-2 karyotype chromosome numbers. Furthermore, 25% of the A549 chromosomes had structural abnormalities compared to only 7% of the SUIT-2 chromosomes. The chromosomal compositions of the aneuploid A549 and SUIT-2 cancer lines are widely divergent, suggesting that diverse genetic alterations, rather than chance, may govern the chromosome makeups of aneuploid cancers.
S
There has been a recent understanding of the DNA repair, cell cycle, and mitotic checkpoints (Nurse 1997,2000; Paulovich et al. 1997). It is possible that various derangements of these regulatory gene networks might cause differing aneuploid tumor chromosomal compositions and lead to various levels of genetic instability and clinical aggressiveness for these cancers. To test whether or not wide chromosomal variations might occur among different aneuploid cell populations, we have performed a fluorescence in situ hybridization (FISH) study of the karyotypic chromosomes of one diploid (CCD-34Lu, control) and two aneuploid (A549 and SUIT-2) cancer cell lines. The karyotypes of the diploid CCD-34Lu line almost invariably contained 46 chromosomes with two normal appearing copies of each FISH-localized homologue. However, the two aneuploid cancer lines showed wide differences in their mean karyotypic chromosome numbers, variations in the numbers of individual chromosomes per karyotype, and the occurrence of FISH-identified structural chromosome abnormalities.
Materials and Methods
Cell Culture
The diploid CCD-34Lu cell line (derived from female lung tissue) and the aneuploid A549 line (derived from a male lung carcinoma) were obtained from American Type Culture Collection (Rockville, MD). The SUIT-2 aneuploid cell line (derived from a male pancreatic adenocarcinoma) was a generous gift from Dr. Takeshi Iwamura (Department of Surgery, Miyazaki Medical College, Miyazaki, Japan). Each of the cell lines was grown as monolayers in DMEM (CCD-34Lu and A549) or McCoy' (SUIT-2) medium containing
FISH Chromosomal Localizations
This method has previously been described in detail (Allison and Nestor 1999). Centromere-specific probes, used when available, and chromosome “paints” were labeled with Spectrum Orange or Spectrum Green (Vysis; Downers Grove, IL). Slides were incubated in a 2 × SSC solution (pH 7.0) for 30 min, followed by dehydration. The centromeric/paint probe mixtures consisted of 1 μl Spectrum Orange and Spectrum Green probes, 1 μl ddH2O, and 7 μl hybridization solution (50% formamide/2 × SSC/10% dextran sulfate). The probe mixtures were denatured at 70C for 5 min and held at 4C until use. Cells hybridized to the probe mixtures were denatured for 2 (paint mixture) and 5 (centromeric mixture) min, in 70% formamide/2 × SSC solution at pH 7.0. This was followed by slide incubation overnight with probe solution in a humidified chamber at 43C, washing in 50–65% formamide/2 × SSC solution (pH 7.0), and counterstaining with DAPI. The Spectrum Orange fluorochromes were localized with a rhodamine-specific filter cube, BP510–560, FT580, LP590, with a Zeiss microscope under epifluorescence optics with a Neofluar ×100 oil immersion lens (NA 1.30; Carl Zeiss, Thornwood, NY). The Spectrum Green fluorochromes were visualized with filter cube BP450–490, FT510, LP520, and a G365, FT395, LP420 filter cube was used for the DAPI stain. Analogue images were digitized and processed for removal of extraneous background fluorescence by Probevision software (Applied Imaging; Santa Clara, CA).
FISH Karyotypic Chromosome Distributions
The number of chromosomes localized with chromosome-specific FISH probes (1–22, X,Y) were counted in at least 20 separate karyotypes of each cell line. The numbers of each FISH-localized chromosome counted in separate karyotypes of the same line were placed in the columns of a rectangular matrix with 24 column headings for each chromosome 1, 2, … 22, X, and Y. The sum of each row of this matrix gives a total number of chromosomes of one “pseudo-karyotype.” Random changing of the positions of the chromosome numbers in each column, relative to its neighbors, allows the generation of “pseudo-karyotypic” chromosome distributions for each line. The mean chromosome numbers and standard deviations of such distributions stabilize at total karyotype number (n) values >100 (data not shown).
Statistical Analysis
Statistical software packages used for data analysis were version 2.03 of Sigma Stat and Version 10.1 of the SPSS for Windows program. Differences in the frequency of chromosome abnormalities were compared using the χ2 test in a 2 × 2 contingency table. Analysis of the difference in mean DAPI-stained and FISH-identified chromosome numbers of each cell line was performed using the Mann-Whitney rank sum test. The DAPI-stained and “FISH-pseudo” chromosome distribution spreads were analyzed by Levene' test of equality of variance. Finally, the correlation coefficient (r) was used to measure the strength of association between the mean number and variability of the individual DAPI-stained and FISH-identified chromosomes. Values of the correlation coefficient (r) ranging between 0 and 0.33 were not correlated, whereas values between 0.33 and 0.66 and between 0.66 and 1 were weakly and highly correlated, respectively.
Results
Karyotypes and FISH-identified Chromosomes
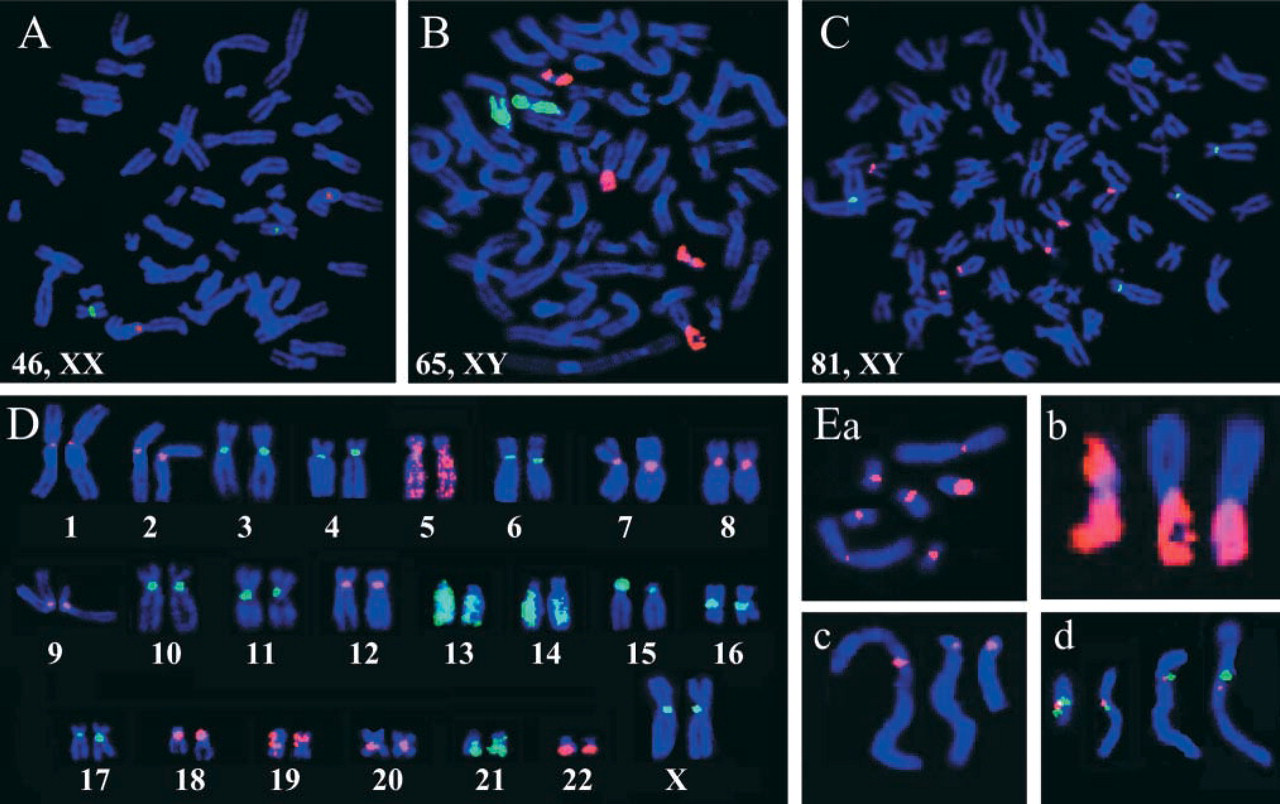
FISH was used to examine the individual chromosomes of three cell lines: A normal lung fibroblast cell line, CCD-34Lu, with a diploid complement of 46 chromosomes, was compared to the aneuploid A549 (lung carcinoma) and SUIT-2 (pancreatic adenocarcinoma) cell lines. Figures 1A–1C show CCD-34Lu, A549, and SUIT-2 karyotypes with 46, 65, and 81 DAPI-stained (blue) chromosomes, respectively. The CCD-34Lu karyotype in Figure 1A shows the expected diploid number of two FISH-localized centromeric probes for chromosomes 1 (red) and 16 (green). However, the A549 karyotype in Figure 1B, showing co-localization of two FISH “paint probes” identifying chromosomes 19 (red) and 1 (green), clearly reveals four copies of chromosome 19. Similarly, the SUIT-2 karyotype in Figure 1C, co-localized with FISH probes specific for the centromeres of chromosomes 17 (red) and 4 (green), shows six and four copies of these chromosomes, respectively. Therefore, the two aneuploid karyotypes (Figures 1B and 1C) both show an elevation in the number of DAPI-stained chromosomes to well above the 46 diploid number (Figure 1A) and highly variable numbers of the FISH-identified homologues (Figures 1B and 1C).
FISH probes specific for all human chromosomes (1–22 X,Y) were hybridized to karyotypes of each of the three lines. The female CCD-34Lu karyotypes did not hybridize with FISH probes specific for the Y chromosome. Figure 1D shows a composite karyotype of the CCD-34Lu cell line showing localization of centromeric (1–4, 6–12, 15–18, 20, X) and paint (5, 13, 14, 19, 21, 22) FISH probes. Each of the CCD-34Lu chromosomes have normal morphology and appropriate FISH probe localizations (Figure 1D). Conversely, the aneuploid A549 and SUIT-2 lines often had FISH-identified chromosomes with structural abnormalities such as extrachromosomal fragments (ECFs), breaks, end localizations (ENDs), and fusions (Figures 1Ea–1Ed).
Localization of chromosome-specific FISH probes in DAPI-stained karyotypes. The diploid CCD-34Lu (
FISH Chromosome Numbers
We counted the numbers of FISH-localized homologues for each chromosome (1–22, X,Y) in at least 20 karyotypes of each cell line. All but six of the female CCD-34Lu karyotypes 332/338 showed two normal-appearing homologues of each somatic and sex (X) chromosome (Figure 1D). In the karyotypes lacking two homologues, the total number of DAPI-stained chromosomes was less than 46. Because no triploid or higher numbers of individual FISH-localized chromosomes were found in the CCD-34Lu karyotypes, it is likely that the CCD-34Lu karyotypes with less than 46 chromosomes were due to cytogenetic preparation error caused by some chromosomes washing off the slides.
The average copy number of FISH-identified A549 and SUIT-2 chromosomes per karyotype, plotted for each individual chromosome in Figures 2A and 2B, usually varied from the diploid value of two found for the CCD-34Lu karyotypes (Figures 1A–1D). There was often wide variability of averages and ranges of copy numbers of the FISH-identified aneuploid chromosomes in different karyotypes of the same line, as evidenced by the wide standard deviation (SD) bars for many of the individual FISH-localized chromosome counts (Figures 2A and 2B). However, the average chromosome copy number of a given individual. FISH-identified chromosome was often different in the A549 and SUIT-2 karyotypes. For example, in the A549 line there were 5.8 ± 1.40 copies of chromosome 1 per karyotype (Figure 2A), but the SUIT-2 karyotypes only averaged 4.0 ± 1.0 copies of chromosome 1 (Figure 2B). Figure 2C shows a plot of the mean copy numbers of the individual FISH-identified A549 chromosomes on the Y-axis vs the mean copy numbers for the same SUIT-2 chromosomes on the X-axis. Only a weak correlation (r=0.543) was found between the average chromosome copy numbers of the two lines. The copy number variation of individual, FISH-identified chromosomes also differed between the two aneuploid lines. Figure 2D shows the percent coefficients of variation (% CVs; SD divided by the mean multiplied by 100) of each individual FISH-identified A549 karyotypic chromosome count plotted on the Y-axis vs the % CVs of the counts of the same SUIT-2 chromosomes on the X-axis. Again, only a weak correlation (r=0.478) was found between the variability of individual A549 and SUIT-2 chromosome copy numbers (Figure 2D).
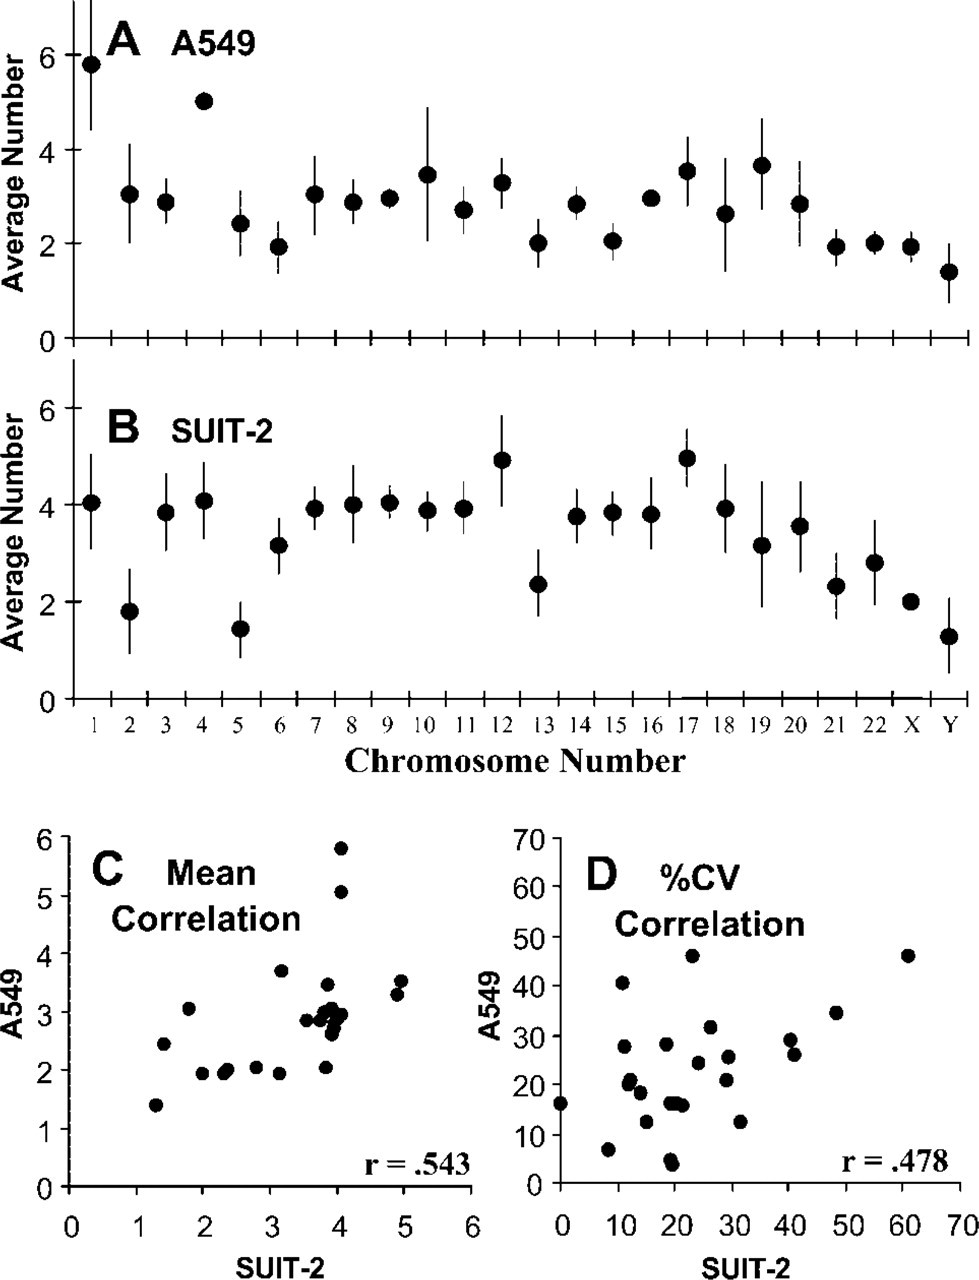
Average numbers of FISH-localized individual chromosomes in different karyotypes of the aneuploid A549 and SUIT-2 lines: mean number of chromosome-specific FISH probes ±SD for each individual chromosome in the A549 (
Percent abnormalities for FISH-identified chromosomes in CCD-34Lu, A549, and SUIT-2 karyotypes
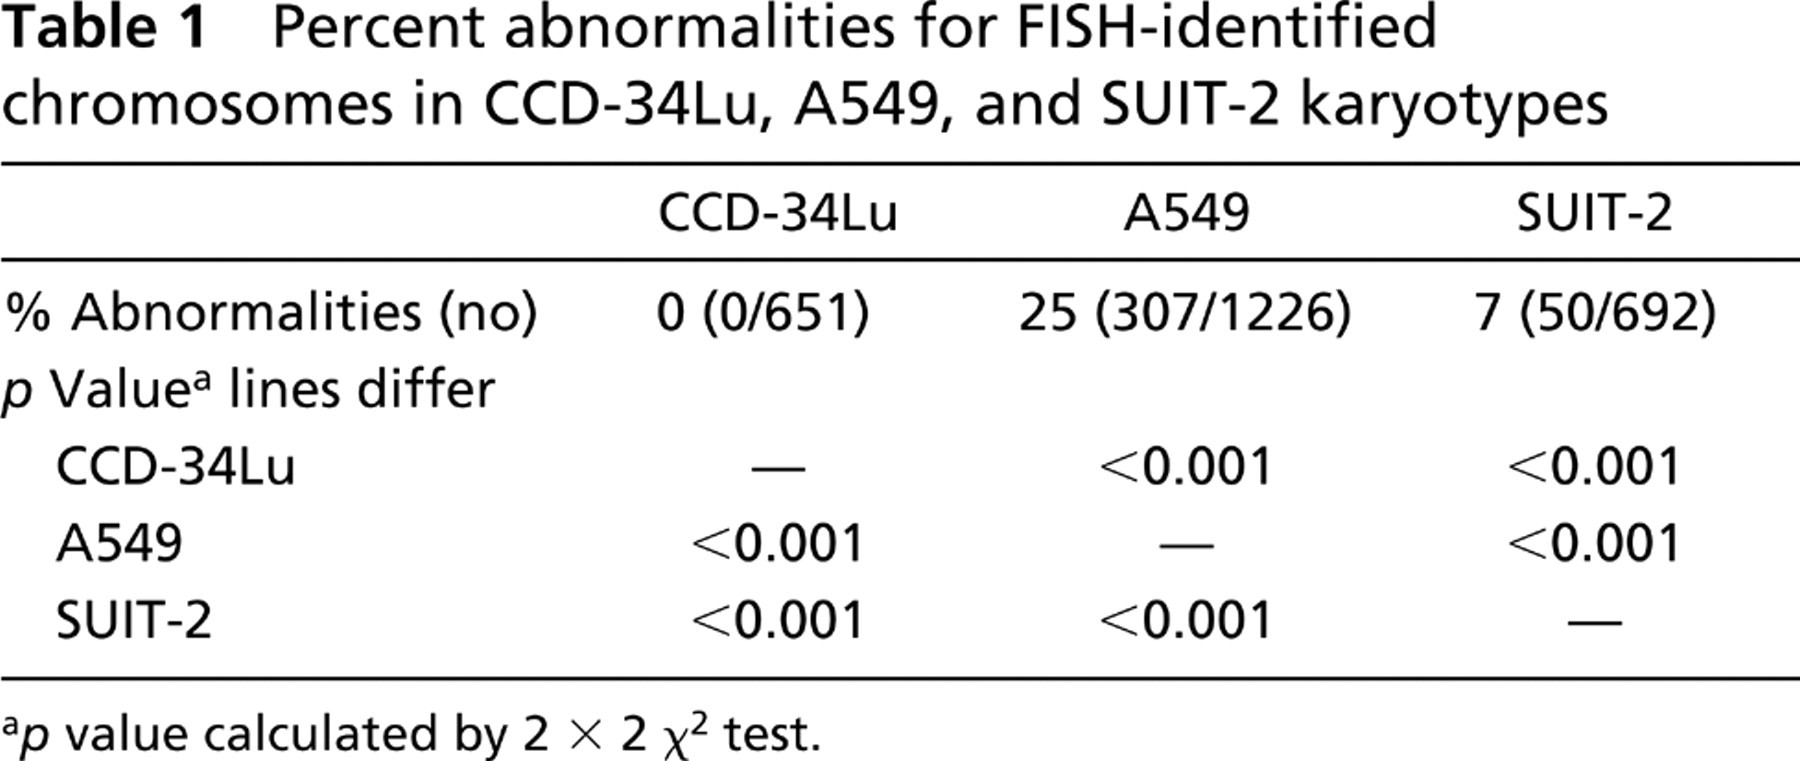
p value calculated by 2 × 2 ×2 test.
FISH-identified Chromosome Abnormalities
The numbers of FISH-identified structurally abnormal chromosomes differed significantly (p<0.001) among the karyotypes of the three lines (Table 1). No abnormalities were found in any of the FISH-identified CCD-34Lu chromosomes scanned (0/651; Table 1). However, 25 (307/1226) and 7% (50/692) of the FISH-identified A549 and SUIT-2 chromosomes had abnormalities. The chromosomes of both aneuploid lines had significantly more FISH-identified abnormalities than the diploid CCD-34Lu chromosomes (p>0.001; Table 1), and the A549 chromosomes had significantly more structural abnormalities than the SUIT-2 chromosomes (p<0.001; Figures 3A and 3B; Table 1).
The percentages of the different types of chromosome abnormalities for each SUIT-2 and A549 chromosome (1–22 X,Y) are plotted in Figures 3A and 3B. Black-and-white hatched bars give the percent of extrachromosomal fragments (ECFs; Figure 1Ea); gray bars give the percent of chromosome breaks (Figure 1Ed; usually occurring around the centromeric regions) plus the percent of abnormalities near the telomeric regions called ENDs (Figure 1Ec), which are often hard to distinguish from breaks. Black bars give the percent of chromosomes with fusions (Figure 1Ed). Figures 3A and 3B show that the highest frequencies of chromosomal abnormalities did not occur in the same FISH-identified A549 and SUIT-2 chromosomes. For example, 41% of the A549 chromosome 19s had abnormalities, whereas only 1% of the SUIT-2 chromosome 19s were abnormal (Figures 3A and 3B).
To further analyze this point, Figure 3C shows the percentage of abnormalities of the individual SUIT-2 chromosomes (1–22, X,Y) on the X-axis plotted against those found in the A549 line for the same chromosomes on the Y-axis. It is apparent that there is no correlation (r=0.072) between the occurrence of FISH-identified structural abnormalities in the same individual chromosomes of the two lines. To determine whether or not the same A549 and SUIT-2 chromosomes might have highly variable frequencies of structurally abnormal chromosomes from karyotype to karyotype, we plotted the percent CVs of the chromosome abnormalities for each individual SUIT-2 (X-axis) and A549 (Y-axis) chromosome in Figure 3D. Again, there was no correlation (r=0.26) between the variability of anomalous individual chromosomes for the two aneuploid lines (Figure 3D).
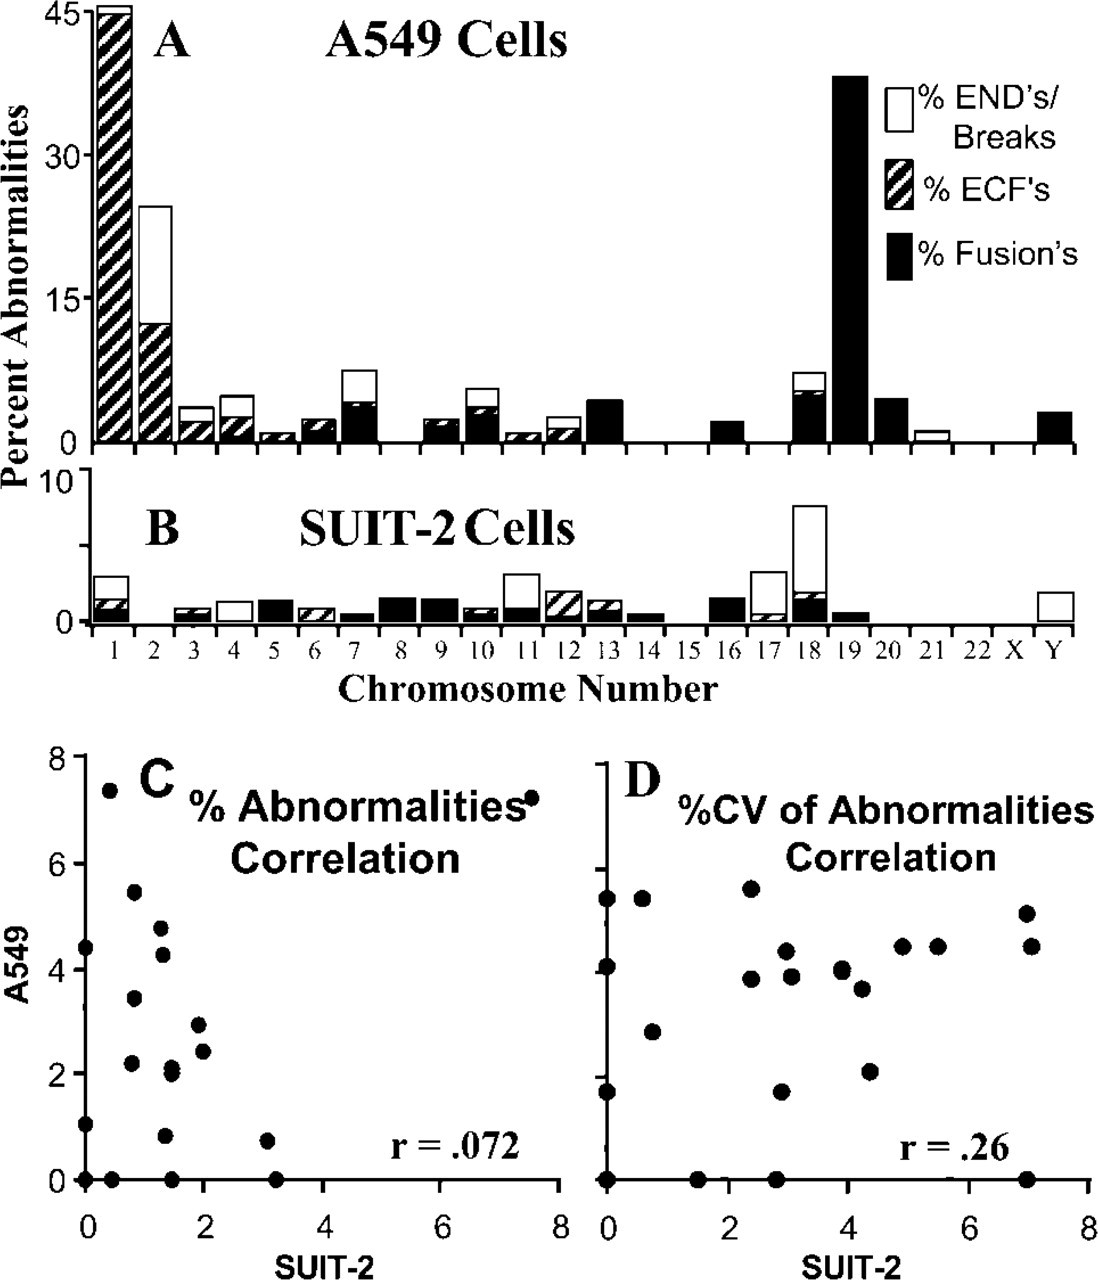
Average percentages of FISH-identified chromosome abnormalities per individual chromosome in (
DAPI-stained vs FISH-identified Chromosome Distributions
Multiple slides of each line were scanned to find karyotypic spreads suitable for simultaneous counting of the number of DAPI-stained chromosomes and chromosome-specific centromeric and paint FISH probes (Figures 1A–1C). Even after “hypo” treatment, certain karyotypes still had overlapping chromosomes, making them unsuitable for analysis. Only 90 (338/375), 98 (636/650), and 58% (378/648) of the CCD-34Lu, A549, and SUIT-2 karyotypes, respectively, were sufficiently spread for the counting of their individual DAPI-stained chromosome numbers. The mean chromosome numbers ± % CV for the DAPI-stained, CCD-34Lu, A549, and SUIT-2 karyotypes were 46 ± 1.3%, 62 ± 7%, and 76 ± 9%, respectively, and differed significantly from one another (p<0.001; Table 2). The six CCD-34Lu karyotypes that had fewer than 46 DAPI-stained chromosomes (38, 41, 42, 43, 44, and 45) were probably due to part of these karyotypes being washed off the slide during cytogenetic preparation. Figures 4A–4C show the DAPI-stained karyotypic chromosome numbers of the CCD-34Lu, A549, and SUIT-2 lines, respectively. The degrees of spread of these three DAPI-stained chromosome number distributions differ significantly from one another (Figures 4A–4C. p<0.001; Table 3). These line-specific differences in the spreads of the karyotypic chromosome number distributions (Figures 4A–4C) were not due to the introduction of bias by the selection of “evaluable karyotypes,” because exactly the same results were obtained for image analysis measurement of the DNA contents (Feulgen) of 100 consecutive, intact metaphase cells of each line (p<0.001; Nestor and Allison, unpublished data).
Mean numbers of DAPI-stained and “FISH-pseudo” karyotypic chromosome distributions: mean number of DAPI-stained chromosomes
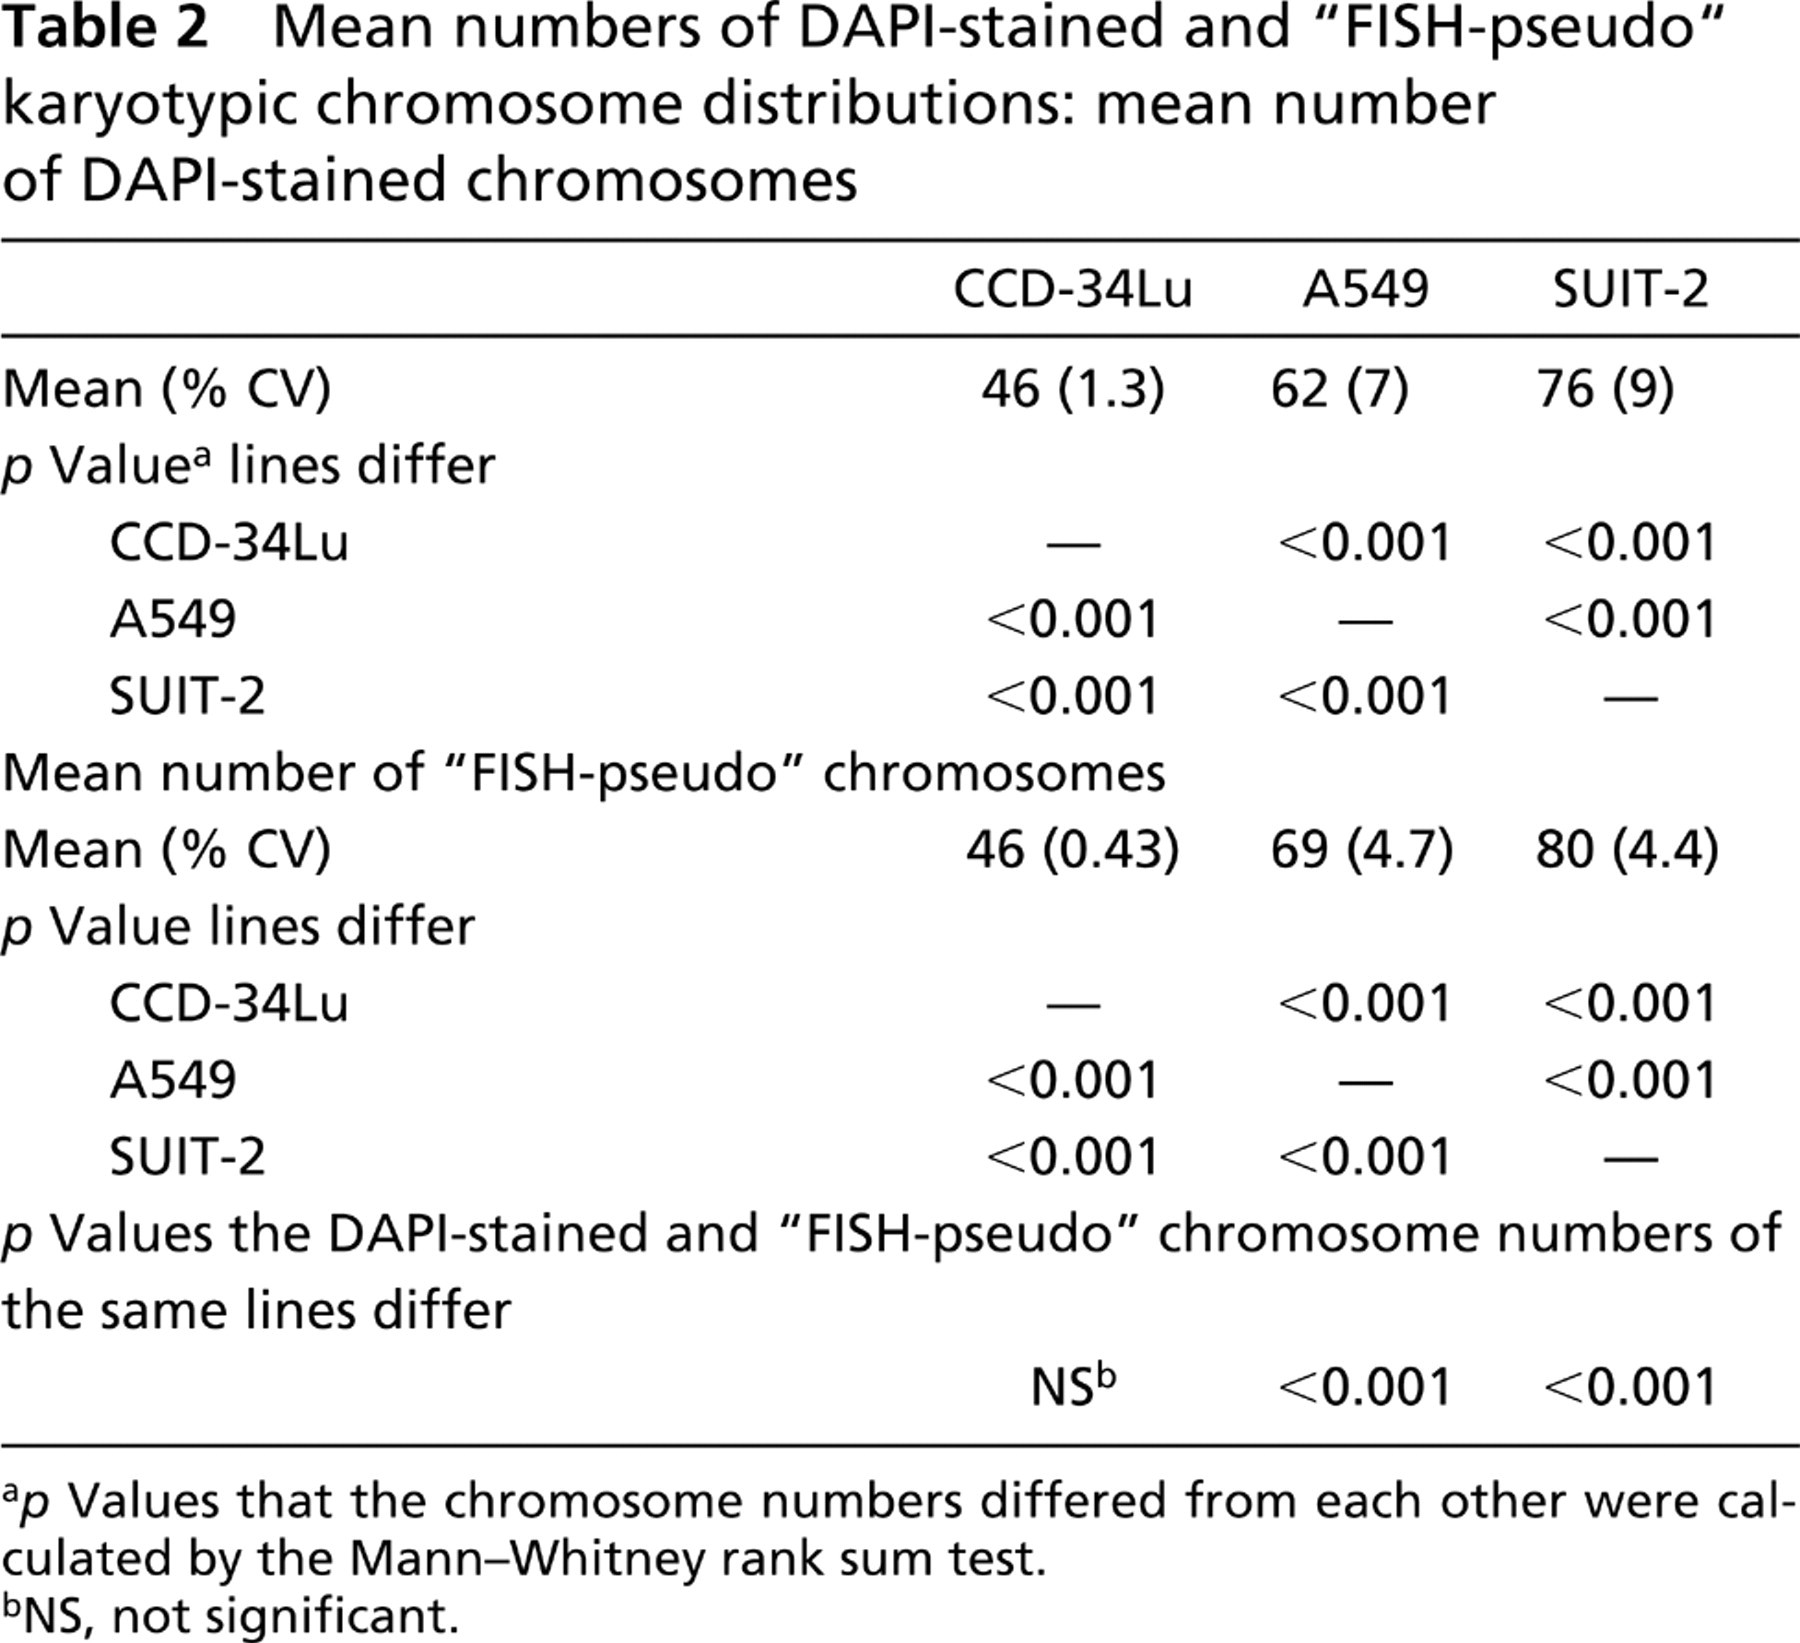
p Values that the chromosome numbers differed from each other were calculated by the Mann–Whitney rank sum test.
NS, not significant.
The numbers of FISH-identified individual chromosomes counted in the different karyotypes of each line were randomly combined into “FISH-pseudo” karyotypic chromosome distributions (see Materials and Methods). The mean chromosome numbers (± % CVs) of the “FISH-pseudo” karyotypic chromosome distributions were 46 ± 0.43%, 69 ± 4.7%, and 80 ± 4.4% for the CCD-34Lu, A549 and SUIT-2 lines, respectively (Figures 4D–4F). The diploid CCD-34Lu line showed a perfect correspondence of its DAPI-stained and “FISH-pseudo” karyotypic chromosome distributions (p=NS; Figures 3A and 3D; Tables 2 and 3). In contrast, both of the aneuploid “FISH-pseudo” karyotypic distributions had higher mean chromosome numbers and less spread than their corresponding DAPI-stained karyotypic chromosome distributions (p<0.001; Figures 4B,4E,4C, and 4F; Tables 2 and 3). Moreover, both aneuploid “FISH-pseudo” karyotypic chromosome distributions (Figures 4E and 4F) had significantly more dispersion than that of the CCD-34Lu “FISH-pseudo” karyotypic distribution (p<0.001; Figure 4D; Table 3) but not from each other (p=NS; Figures 4E and 4F; Table 3).
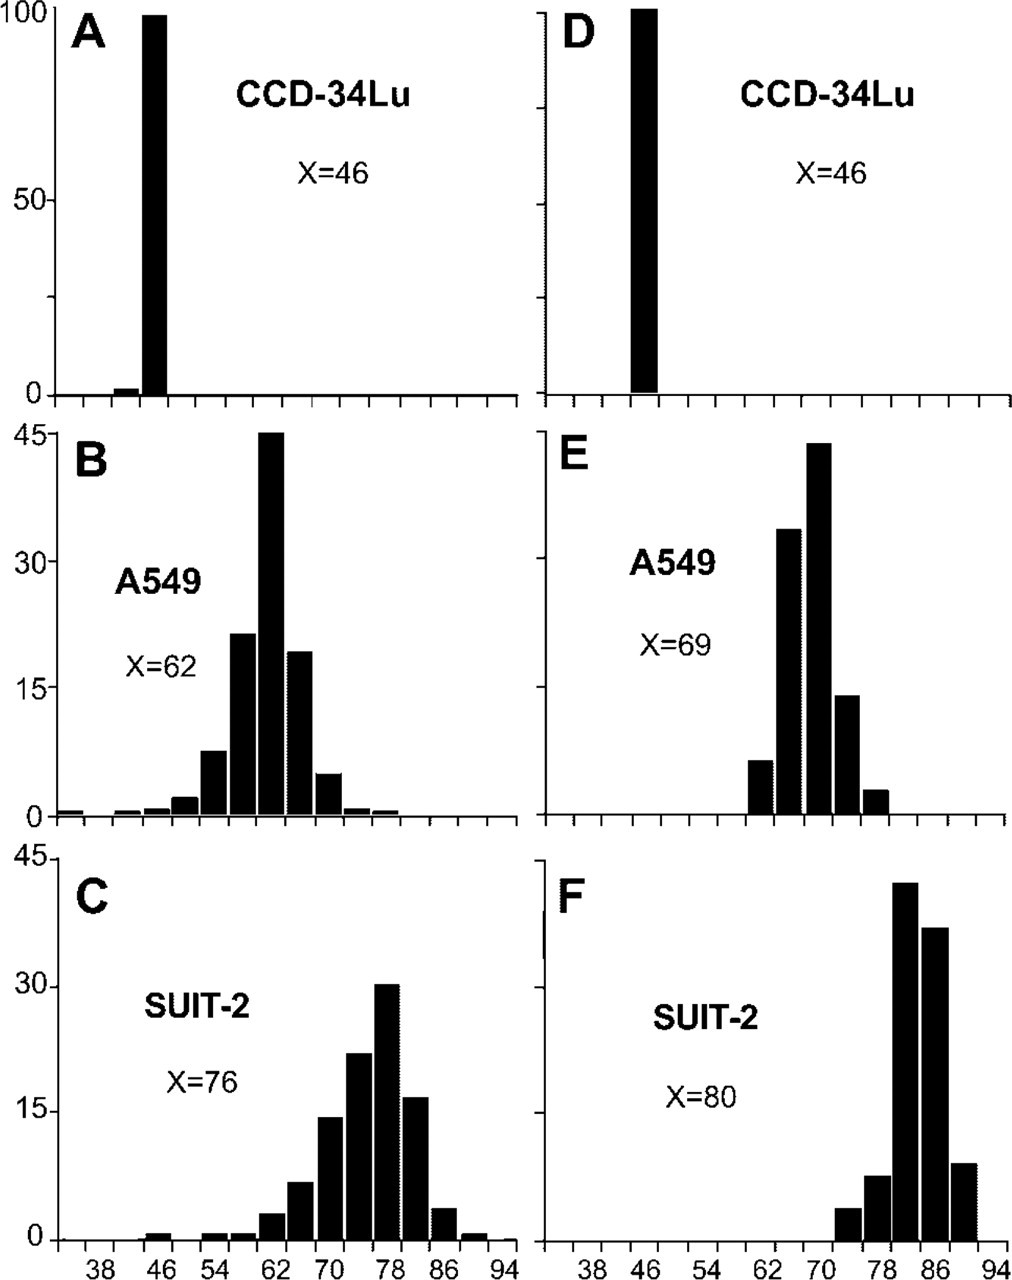
DAPI-stained and “FISH-pseudo” karyotypic chromosome distributions. DAPI-stained chromosome counts of the CCD-34Lu (
Discussion
In 1890, Hansemann observed unbalanced mitoses in human cancer cells (Hansemann 1890). In 1902, Boveri noted that “multipolar mitoses might lead to … tumor-like formations” in sea urchin embryos and in 1914 presented his famous hypothesis that cancer may be due to abnormal chromosomes (Boveri 1902,1964,1914, 1929). Karyotypic chromosome analyses in the 1950s revealed that nontransformed human cells had a tightly regulated “diploid (2C)” number of 46 chromosomes and, in support of Boveri' hypothesis, that many cancers often had non-diploid chromosome numbers and abnormally formed chromosomes or “aneuploid” chromosomal compositions (Hsu and Moorhead 1956; Levan 1956; Makino 1956).
Probabilities that the spreads of the DAPI- and “FISH-pseudo” karyotypic chromosome distributions differ from each other a
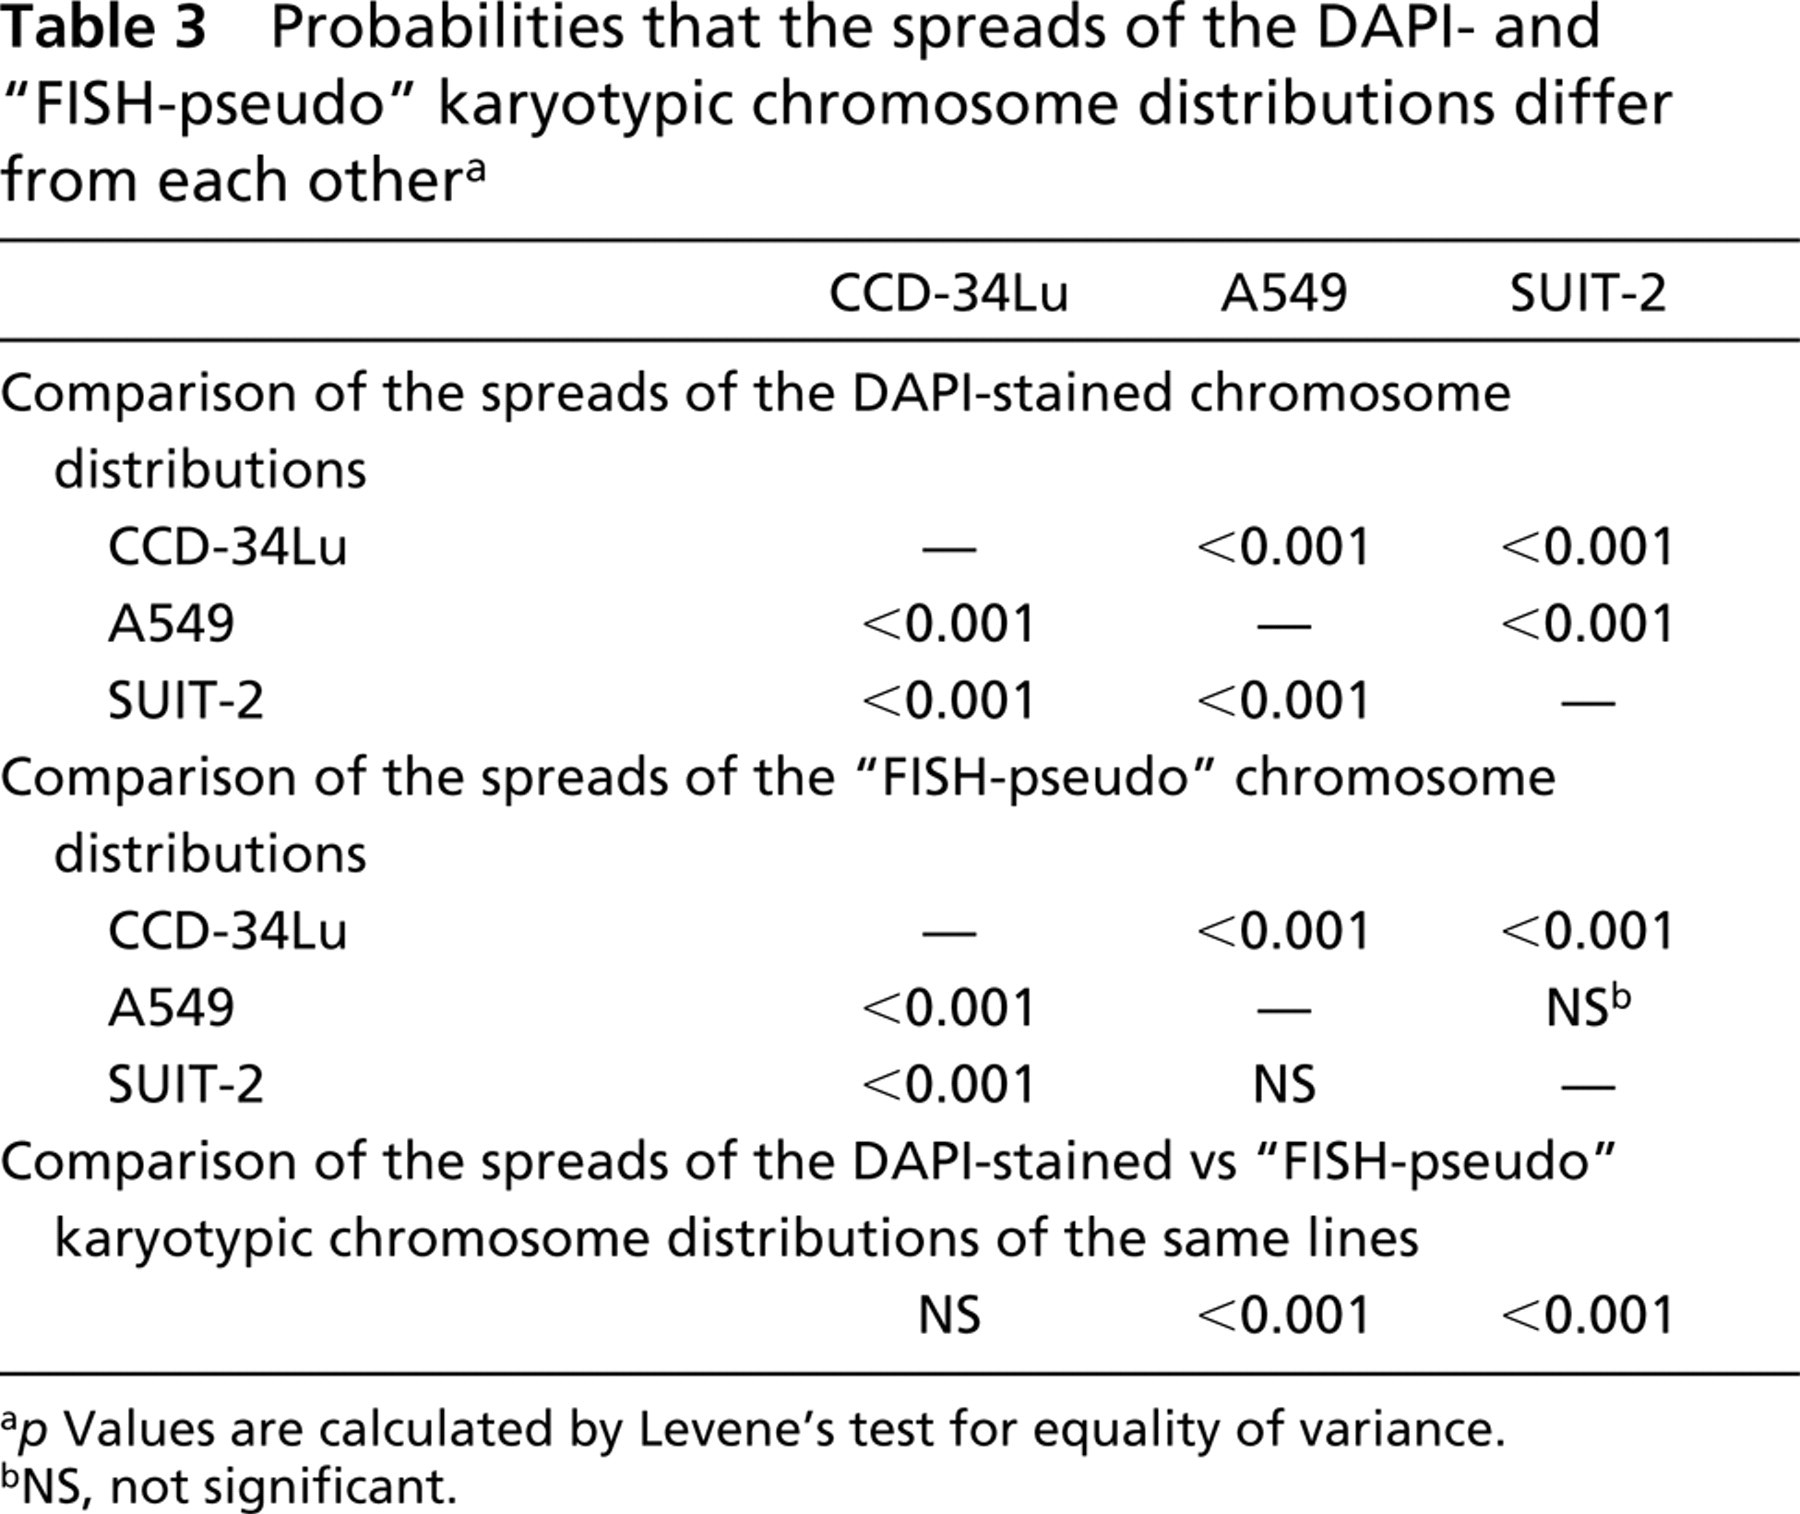
p Values are calculated by Levene' test for equality of variance.
NS, not significant.
The direct examination of the cancer chromosomes of a solid tumor to determine its “ploidy level,” or whether it has a diploid or aneuploid chromosome complement, is a very tedious and time-consuming procedure, requiring the establishment of a separate tissue culture line for each tumor to be karyotyped.
Measurement of the DNA contents of interphase cells by image (Swift 1950,b; Bedi and Goldstein 1976; Allison et al. 1981,1984; Hardie et al. 2002) or flow cytometry (Van Dilla et al. 1969; Kraemer et al. 1971; Crissman and Tobey 1974) allows estimates of cancer ploidy levels to be made without karyotyping. In both methods, the tumor cell DNA index is calculated as the ratio of the DNA content of the G0/G1 tumor cells to that of the diploid peak of the cells of the nontransformed tumor stroma. Although cytometric image and flow DNA measurements are subject to serious errors if performed incorrectly (Allison et al. 1984; Bose et al. 1989,1993), extensive studies with these techniques allow some firm conclusions to be drawn about the role of tumor ploidy levels in human cancer.
Most interestingly, although one might suppose that patients with aneuploid tumors (DNA index ≠1) would prove to have worse prognoses than patients with diploid tumors (DNA index =1), this is not always the case. Many clinically benign tumors have aneuploid DNA contents (Anniko et al. 1984; van den Ingh et al. 1985; Joensuu et al. 1986,1989; Joensuu and Klemi 1988). Surprisingly, for certain infant neuroblastomas, aneuploidy in a tumor is a favorable prognostic sign (Christiansen and Lampert 1988; Taylor et al. 1988). The finding of aneuploidy in thyroid, gallbladder, and node-positive breast carcinomas gives little independent prognostic information (Hedley et al. 1987; Hamming et al. 1988; Donohue et al. 1990). Aneuploidy in colorectal carcinomas (Armitage et al. 1985; Scott et al. 1987; Jones et al. 1988; Heimann et al. 1990), melanoma (Kheir et al. 1988), and node-negative breast cancers (Clark et al. 1989; Ellis et al. 1989) is a negative prognostic indicator and is of clinical value in the selection of adjuvant therapy. The finding of aneuploidy in a pancreatic carcinoma forebodes an ominous prognosis (Allison et al. 1991,1998; Eskelinen et al. 1991).
This highly variable influence of the DNA index on patient prognosis raises the possibility that chromosomal aneuploidy is not fundamental to the genetic instability of cancer. Early molecular and karyotypic analyses appeared to support this possibility. Specifically, it was found that although karyotypic anomalies were usually highly variable in similarly staged cancers (Braun 1969; DiPaolo 1975; Harnden and Taylor 1979; Sandberg 1990; Heim and Mitelman 1995; Lodish et al. 1995; Johansson et al. 1996), all cells in certain cancers occasionally had somatic mutations in, or losses of, a rapidly expanding number of newly described “oncogenes” or “tumor suppressor genes” (Pitot 1986; Stanbridge 1990; Lodish et al. 1995; Mitelman et al. 1997; Haber and Fearon 1998; Lewin 2000). This suggested that aneuploidy might be a secondary event after the molecular changes that cause transformation and might play little or no role in malignant progression (Harnden and Taylor 1979; Cairns 1981; Hieter and Griffiths 1999).
However, as the molecular networks governing the cell cycle, DNA repair, apoptosis, and mitosis have become more clearly defined, it is apparent that the genetic defects associated with malignancy occur in thousands of genes (Stoler et al. 1999). Furthermore, the cancer-associated genetic changes vary from tumor to tumor, and precise and reproducible genetic defects in relatively few molecules have not been found as singular causation factors for any class of cancer (Augenlicht et al. 1987; Stanbridge 1990; Strauss 1992; Plattner et al. 1996; Heppner and Miller 1998; Boland and Ricciardiello 1999; Weitzman and Yaniv 1999; Duesberg et al. 2000; Li et al. 2000). The important question appears to be how cancer cells generate this wide range of genetic diversity (Strauss 1992; Boland and Ricciardiello 1999).
Aneuploidy in itself may influence genetic expression by several diverse mechanisms, including rearrangements of genetic control elements causing inappropriate gene expression, abnormal “fusion proteins” resulting from rearranged coding sequences, changes in the acetylation and/or phosphorylation of the chromatin-associated proteins altering mRNA transcription and editing, altered DNA methylation influencing patterns of gene transcription, and gene dosage effects either silencing or activating genetic expression (Klein 1994; Scheid et al. 1996; Galitski et al. 1999; Hieter and Griffiths 1999).
Several recent lines of evidence strongly suggest that aneuploidy is responsible for or associated with the genetic instability of most cancers. Only 10% of colon cancers have defects in the excision repair of the single-stranded DNA mismatch errors that cause their genetic instability. Such cancers have microsatellite instability (“MIN cancers”). Most importantly, the MIN colon cancers were found to have diploid chromosome compositions, whereas all of the MIN-negative colon cancers were aneuploid (Lengauer et al. 1997; Cahill et al. 1998), implying that chromosomal aneuploidy is in some way responsible for, or associated with, the genetic instability of the vast majority of colon cancers. Supporting this view is the recent finding of Duesberg et al. (2000) that aneuploidy invariably precedes transformation in carcinogen-treated Chinese hamster embryo cells.
Although these studies suggest that aneuploidy causes or is associated with the genetic instability of many cancers, it is still not clear why aneuploidy is such a highly variable prognostic marker for different tumors. We postulate that the wide spectrum of clinical aggressiveness among different aneuploid cancers is due to the existence of different types of cancer aneuploidy, each created by various molecular defects in gene networks governing the cell cycle, recombination, the repair of double-stranded DNA breaks, and the mitotic checkpoints.
For example, aneuploid cells are usually formed by a 2C to 4C chromosome doubling preceding chromosome losses or gains by nondisjunction of individual sister chromatid pairs or the formation of multipolar mitosis, both of which lead to daughter cells with aneuploid chromosome complements (Boveri 1902, 1964, 1914; Shackney et al. 1989; Levine et al. 1991). This initial 2C to 4C chromosome doubling could be due to genetic changes in several gene networks that control the passage through mitosis (reviewed in Allison et al. 2003), and the specific mitotic control changes present in a given tumor may influence its subsequent mechanisms and rate of chromosome losses or gains. Similarly, molecular defects in the G1/S checkpoint allow certain cancer cells to enter S-phase without having synthesized adequate nucleotide pools to complete DNA synthesis (Allison et al. 1985, 1986,1989; Paulovich et al. 1997), leading to stalled replication forks and to double-stranded DNA breaks and broken chromosomes (Paulovich et al. 1997). If these cancers also have genetic defects in their DNA damage surveillance and repair networks (Rouse and Jackson 2002), the double-stranded DNA breaks may form abnormal aneuploid chromosomes (Figure 1E) (Paulovich et al. 1997). Therefore, the specific defects in the G1/S checkpoint and the DNA damage-repair gene networks present in a given tumor may control its rate of aneuploid chromosome formation.
Several mitotic defects can also contribute to aneuploidy. The prometaphase migration of each sister chromatid pair stops upon arrival at the metaphase plate, but the “early arrivals” wait at the plate for the “late arrivals” before anaphase begins (reviewed in Allison et al. 2003). This pause is controlled by the “wait anaphase” (WA) checkpoint and is regulated by the Bub, Mad, and other mitotic-spindle associated proteins that are often lost, or altered, in aneuploid cancers (Cahill et al. 1998; Jaffrey et al. 2000; Jalle-palli et al. 2001).
The chromosome composition of an individual aneuploid karyotype is the result of a specific lineage of gradual chromosome changes occurring over many cell generations, and the overall chromosome makeup of a given aneuploid cell population is the sum of its separate karyotype lineages (Makino 1956; Harada et al. 1998). This evolution of separate karyotypic lineages is due to the cumulative accumulation of chromosome breaks, recombinations, and nondisjunctions secondary to DNA damage (Tease 1987), altered nucleotide metabolism (Hecht et al. 1987), genetic defects leading to recombination and segregation errors (Zimmering 1987), and abnormal centromere/kineto-chore functions (Fitzgerald 1987; Vig 1987; Vig and Sandberg 1987; Carlson 1988). The interactions of these highly complex mechanisms (Vig 1987; Vig and Sandberg 1987) lead to cancer cells with extremely variable chromosome compositions (Macville et al. 1999), from which genetic combinations favoring tumor progression can be selected (Johansson et al. 1996; Hoglund et al. 2001; Phillips et al. 2001). The complexity underlying aneuploidy has led it to be modeled as a random process (Shackney et al. 1989; Rasnick 2002) rather than assuming that discrete and identifiable subtypes of aneuploidy might exist.
Our findings suggest, however, that the chromosome compositions of a given aneuploid cell population may not occur entirely by chance. Specifically, if the mitotic, cell cycle, and DNA repair mishaps that produce aneuploidy were truly random and the same for all cancers, then the chromosomal compositions of aneuploid cell lines in long-term culture would become more similar from repeated random DNA replication and segregation errors. However, the long-term aneuploid A549 and SUIT-2 cancer lines differ significantly from each other in their DAPI-stained karyotypic chromosome numbers (Figures 1B and 1C), numbers of FISH-detected individual chromosomes (Figures 2A and 2B) and, most markedly, in the occurrence of FISH-detected chromosome abnormalities (p<0.001; Figures 3A and 3B; Tables 1–3). There was only a weak correlation between the numbers and variability of the FISH-identified individual chromosomes (Figures 2C and 2D) and there was no correlation between the occurrence of FISH-identified chromosome abnormalities for the two aneuploid lines (Figures 3C and 3D).
The differences between the two aneuploid lines are consistent with the idea that their overall chromosome compositions were created by differing genetic defects in their respective cell cycle, DNA repair, and mitotic checkpoint mechanisms rather than by identical and random nondisjunctions, chromosome breaks, and recombinations. For example, the higher proportion of structurally abnormal A549 chromosomes, compared to SUIT-2 chromosomes (Figures 2A and 2B; Table 1) may be due to more serious defects in the A549 line' cell cycle and DNA damage checkpoints responsible for preventing abnormal chromosome formation compared to the SUIT-2 line. A549 metaphase cells with large numbers of abnormally formed chromosomes may, in turn, have difficulty in achieving sufficient numbers of bipolar microtubule attachments and/or chromosomes properly aligned at the metaphase plate necessary to trigger anaphase. If the majority of these chromosomally aberrant, metaphase-blocked A549 cells eventually die, this may explain the overall more narrowly distributed A549 karyotypic chromosome number compared to the SUIT-2 karyotypic chromosome distribution (Figures 4B and 4C; Tables 2 and 3).
Several comparative genomic hybridization (CGH) studies have found changes in the copy numbers of different chromosomes for breast, head and neck, liver and colorectal cancers (Bockmuhl et al. 1998; Korn et al. 1999; Gray et al. 2000; Jain et al. 2001). Although various selective pressures in these diverse tissue microenvironments may contribute to these tissue-specific chromosome alterations, these results are also consistent with different pathways being favored for producing chromosomal instability during the transformation of different tissue types. Supporting this possibility is a recent CGH study of hepatoblastomas from white and Japanese patients, in whom clear differences in copy numbers of chromsome13q were found, indicating that the genetic compositions of the nontransformed parental cells can influence tumor chromosome compositions in a nonrandom manner (Gray et al. 2000). Further, the recently reported interactions between p53 mutations and CGH changes affecting the prognosis of breast cancer patients (Jain et al. 2001) are also consistent with a nonrandom complexity in the gene networks that govern chromosomal instability.
Finally, random combinations of the individual FISH-identified chromosome numbers did not reconstitute the DAPI-stained karyotypic chromosome distributions of either aneuploid line (Figures 4B, 4E, 4C, and 4F; Tables 2 and 3): The “FISH-pseudo” distributions of both aneuploid lines had significantly higher and more tightly distributed chromosome numbers than the actual counts of their DAPI-stained aneuploid chromosomes (p<0.001; Tables 2 and 3). The higher chromosome numbers of the “FISH-pseudo” distributions are most likely due to fusion chromosomes carrying multiple copies of FISH-detected, chromosome-specific DNA sequences (Figures 1E, 3A, and 3B), because fusions lower the numbers of the DAPI-stained chromosomes relative to the numbers of FISH probes detected (Table 2). The increased spreads of the DAPI-stained chromosome distributions of both aneuploid lines, relative to their “FISH-pseudo” distributions (Figures 4B, 4E, 4C, and 4F; Table 3) is unexplained but may be because many of the counted DAPI-stained chromosomes did not have FISH-identifiable DNA sequences. Such chromosomes could undergo normal mitotic segregation by tumor activation of “neocentromeres” (reviewed in Craig et al. 1999) or, alternatively, such DNA fragments might be partitioned into the daughter chromosomal masses by non-mitotic mechanisms. We are now trying to determine which of these possibilities is actually occurring.
In summary, if the striking differences in chromosome compositions of the CCD-34Lu, A549, and SUIT-2 lines prove not to be rare exceptions, but the general case, then strong evidence will be provided for various genetic defects in the cell cycle, DNA repair, and mitotic checkpoints governing the chromosomal compositions of aneuploid cancers. Such heterogeneity in the genetic mechanisms governing chromosome and genome stability may provide an explanation for the wide spectrum of clinical aggressiveness of different aneuploid cancers.
Footnotes
Acknowledgements
Supported by the Cancer Biology Fund of the Medical College of Ohio Foundation and by the F.M. Douglass Foundation, grant # 01–215, and by St. Vincent Mercy Medical Center.
We thank Kay Langenderfer for her help and support in the preparation of this manuscript and Prof Sadik Khuder for help with the statistical analysis.