
Abstract
We established a triple-labeling method with two rabbit polyclonal antibodies and a mouse monoclonal antibody and examined autopsied brain tissue with cotton wool plaques (CWPs). One of the polyclonal antibodies was so diluted (anti-Aβ42 or anti-Aβ40/1:30,000 or anti-von Willebrand factor/1:1000) that its visualization was possible only after amplification with the catalyzed reporter deposition (CARD) method. The other polyclonal antibody (anti-Aβ40 or anti-Ap42/1:1000) was visualized with a fluorochrome conjugated to an anti-rabbit antibody that specifically visualized the latter polyclonal antibody because of its lower sensitivity. A monoclonal antibody, AT8, was superimposed to yield triple immunofluorolabeling. Serial optical sections with an interval of 0.3 μm were reconstructed to allow three-dimensional (3D) observation of these three epitopes. Aβ40 was localized to core-like structures, mainly in layers I–III, and was sometimes in contact with the vascular wall, both without neuritic reactions. CWPs, present in layers I–VI, were labeled with anti-Aβ42 and were accompanied by neuritic reactions. These differences suggest that mechanisms of Aβ deposition and its relation to neuritic reactions or to blood vessels differ according to the lesion, even in the same microscopic field.
Keywords
T
One of the obstacles was that the antibodies to be applied on the same sections were from the same species, which usually hampers multilabeling. Several procedures have been proposed to circumvent this difficulty, with some success. For example, conjugation of enzyme, biotin, or fluorochrome to one of the primary antibodies allows separate detection of the two antibodies, but it requires a relatively large amount of the antibody and the conjugation procedure can be cumbersome (Van der Loos et al. 1989; Uchihara et al. 1995). Another approach is to wash out the bound antibodies with glycine buffer at very low pH after the first cycle of immunodetection (Nakane 1968). Treatment in a microwave oven after the color development of the first primary antibody has been reported to be effective in avoiding crossreaction (Lan et al. 1995). Although these sequential procedures are generally successful in detecting non-co-localizing epitopes, they are not applicable for multiple immunofluorescence labeling.
A previous study demonstrated that double immunofluorolabeling with two antibodies from the same species was possible with extensive blockade with F(ab's)2 fragment (Lewis–Carl et al. 1993) between the two primary antibodies. However, double labeling with this method was associated with a significant decrease in the sensitivity of one of the primary antibodies applied after this extensive blocking. This trade-off of double labeling with decreased sensitivity was circumvented when one of the antibodies was amplified (Hunyady et al. 1996) with the catalyzed reporter amplification method (CARD). CARD amplification is mediated by the horseradish peroxidase (HRP) on the secondary antibody that catalyzes the activation of tyrosine bound to biotin (Bobrow et al. 1989). The activated tyrosine becomes attached to proteins in the tissue section at the site of the antigen–antibody reaction. Biotin bound to tyrosine can then be visualized (Adams 1992). With this method, discrimination of the two epitopes is possible based on the different sensitivity of the immunodetection systems either with or without the amplification. The first antibody to be used must be diluted below the level detectable with standard secondary antibody labeled with fluorochrome, but above the level detectable with CARD amplification (Hunyady et al. 1996). In the present study we used two different polyclonal antibodies produced in rabbits to visualize two different epitopes possibly co-localizing with each other on the same structure, Aβ40/Aβ42, and Aβ40/von Willebrand factor (a specific marker for vascular endothelial cells). The third antibody, AT8, a mouse monoclonal antibody (MAb) against paired helical filaments (PHFs), major components of neurofibrillary tangles and neurites (Mercken et al. 1992), can be combined by using a differently labeled secondary antibody specific for mouse IgG without danger of crossreaction with these polyclonal antibodies.
In observing structures, such as senile plaques, that exceed the thickness (5–10 μm) of routine histological sections, we are not sure whether or not portions included in the section under observation represent the entire structure. We therefore obtained serial optical sections under a laser scanning confocal microscope to be reconstructed for 3D observation. Three-dimensional reconstruction of triple-labeled sections, as we established in this study, can provide an opportunity to observe the entire structure of CWPs and the spatial relationship between the relevant structures.
Materials and Methods
A dementia patient with a familial background of Alzheimer disease was diagnosed with AD based on the presence of many senile plaques and neurofibrillary tangles. Senile plaques in this case were not clearly detectable with the Bodian method, but hematoxylin and eosin staining visualized the cotton wool feature of the plaques without a core. In addition, a core-like structure and perivascular deposits of Aβ were observed (Nakayama et al. 2001; Tabira et al. 2002). The genetic abnormality associated with this phenotype remains to be clarified.
We first undertook experiments to establish the optimal concentrations of the antibodies for the methods used, especially the dilution of the primary antibodies visualized with the CARD method but undetectable by the standard method without CARD amplification. The list of primary antibodies is provided in Table 1. Three-μm-thick mirror sections were obtained from formalin-fixed, paraffinembedded blocks from the occipital lobe of this patient. Deparaffinized sections were treated with formic acid (>99%) for 5 min to enhance Aβ-like immunoreactivity (Kitamoto et al. 1987). After being treated with 2% H2O2 and incubation with 5% bovine serum albumin in PBS, sections were incubated at 4C for 2 days with different concentrations (1:1000–1:100,000) of anti-Aβ40 or anti-Aβ42 antibody (Akiyama et al. 1997). One of the mirror sections was visualized after amplification with CARD as previously described (Bobrow et al. 1989; Adams 1992; Uchihara et al. 2000). Briefly, after application of an anti-rabbit IgG made in goat conjugated to horseradish peroxidase (HRP, 1:500; Pierce, Rockford, IL), the HRP signal was amplified with biotinylated tyramide (1:1000; Perkin–Elmer, Boston, MA) and was finally visualized with FITC conjugated to streptavidin (1:200; Vector, Burlingame, CA; Uchihara et al. 2000). The counterpart of the mirror section was visualized with anti-rabbit IgG made in goat conjugated with FITC (1:200; Vector).
For triple immunofluorolabeling, deparaffinized sections were similarly subjected to immunolabeling with CARD amplification with one of the polyclonal antibodies made in rabbits (anti-Aβ42 1:30,000; anti-Aβ40 1:30,000; or anti-von Willebrand factor 1:1000; DAKO, Glostrup, Denmark) as described above and finally visualized to Cy5 conjugated to streptavidin (1:200; Kirkegaard & Perry, Gaithersburg, MD). von Willebrand factor is a marker for vascular endothelial cells and the anti-von Willebrand factor antibody immunolabels blood vessels (Uchihara et al. 1995). The sections were then incubated with a mixture of AT8 (1:1000; mouse monoclonal antibody against PHFs; Innogenetics, Zwijndrecht, Belgium) and another polyclonal antibody (anti-Aβ40 or anti-Aβ42 1:1000) at 4C for another 2 days in the dark. These two antibodies were visualized with a mixture of anti-mouse IgG made in sheep conjugated with rhodamine (1:200; Jackson ImmunoResearch, West Grove, PA) and anti-rabbit IgG made in goat conjugated with FITC (1:200; Vector), respectively.
Antibodies and optimal dilutions used in this study
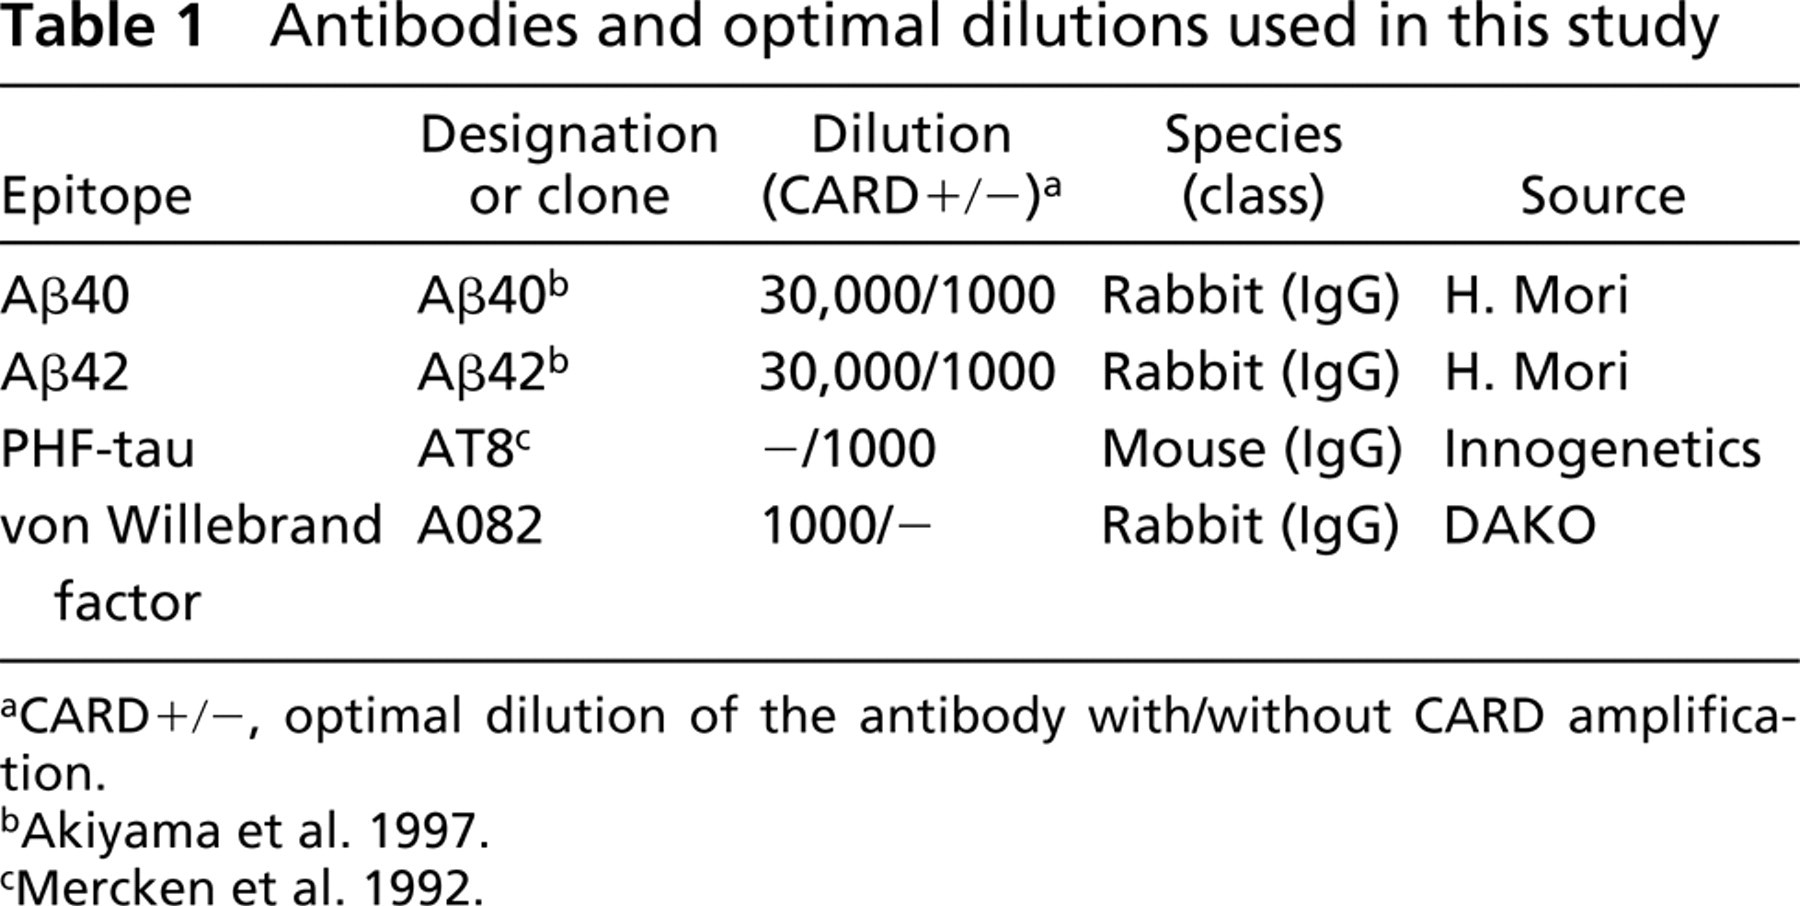
CARD+/-, optimal dilution of the antibody with/without CARD amplification.
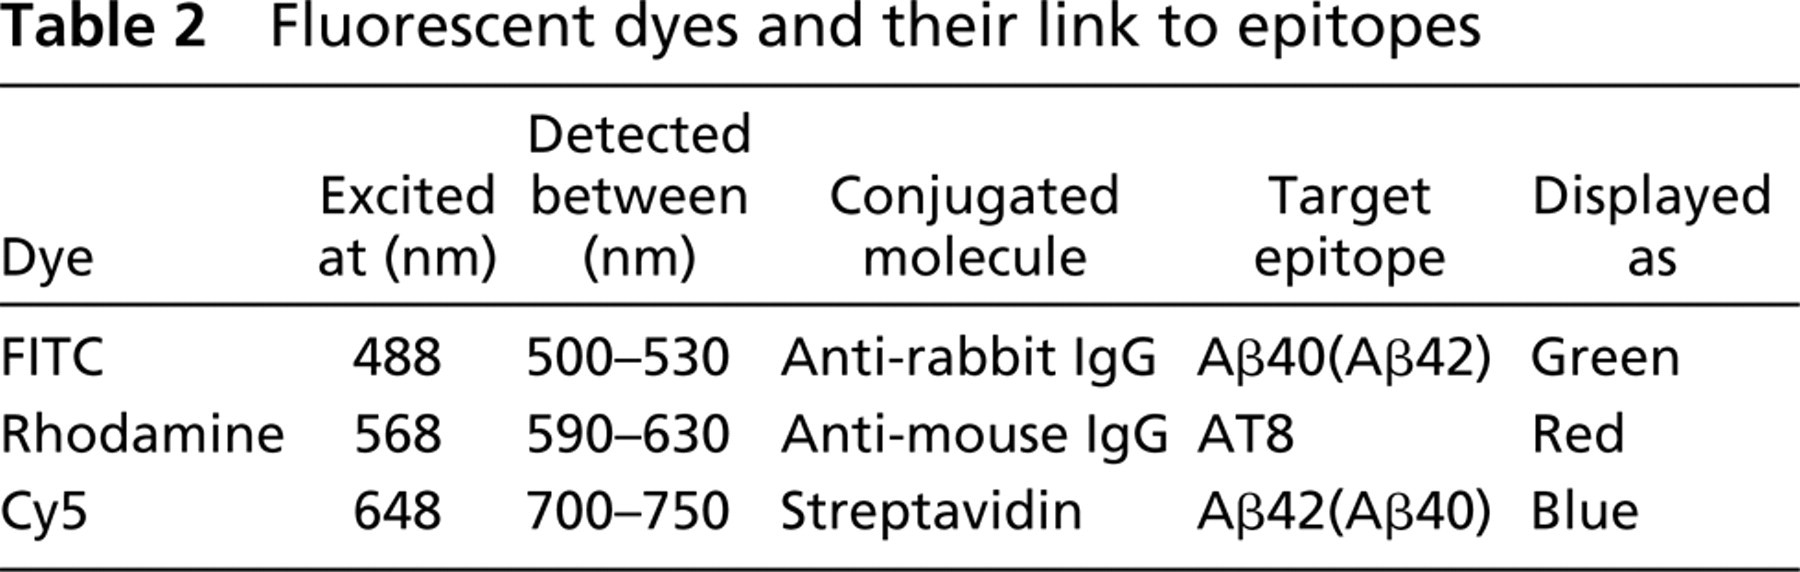
For 3D observation, formalin-fixed blocks were washed in PBS and cryoprotected by being soaked in 20% sucrose buffered with 0.1 M phosphate. Thick floating sections (50–100-μm in thickness) were obtained on a freezing microtome. They were subjected to the triple-immunolabeling method as above with prolonged incubation (up to 7 days) with the primary antibody. Sections were mounted with 90% glycerol in 0.1 M phosphate buffer containing 0.1% of p-phenylenediamine and were observed under a confocal laser scanning microscope (Leica TCS/SP; Heidelberg, Germany). Excitation of the fluorochromes and their maximal detection wavelength are summarized in Table 2. Serial optical sections were obtained and reconstructed for 3D analysis on software (TRI/3D; Ratoc System, Tokyo, Japan).
Results
Serial dilution of one of the polyclonal antibodies (anti-Aβ40) demonstrated that the usual immunofluorescence method without CARD amplification (Figures 1A, 1C, 1E, and 1G) requires a high concentration of the antibody (1:1000) to obtain maximal labeling (Figure 1C). However, CARD amplification (Figures 1B, 1D, 1F, and 1H) enabled us to use the antibody at lower concentrations (up to 1:30,000) to obtain a clear fluorescent signal of an equivalent intensity with little background staining (Figure 1F). Omission of either primary antibody, secondary antibody, or biotinylated tyramide completely eliminated the immunofluorescent signal. Similar results were obtained with the anti-Aβ42 antibody (data not shown).
Fluorescent dyes and their link to epitopes
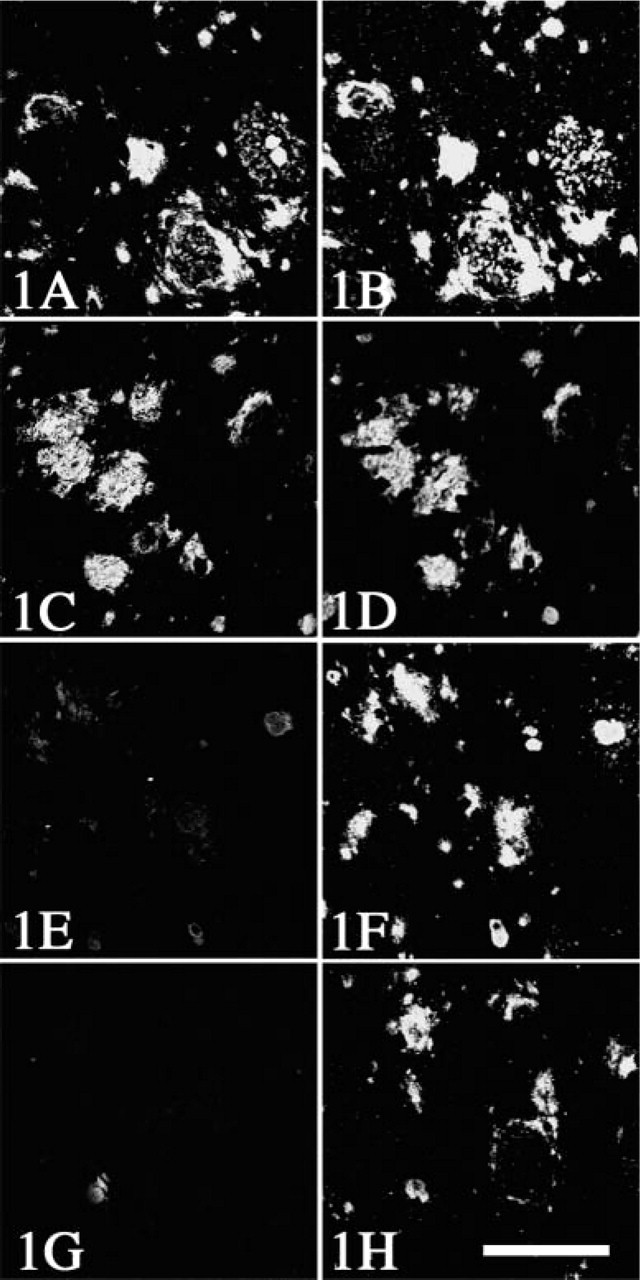
Immunolabeling of mirror-section pairs from cerebral cortex with anti-Aβ40 at dilution 1:1000 (
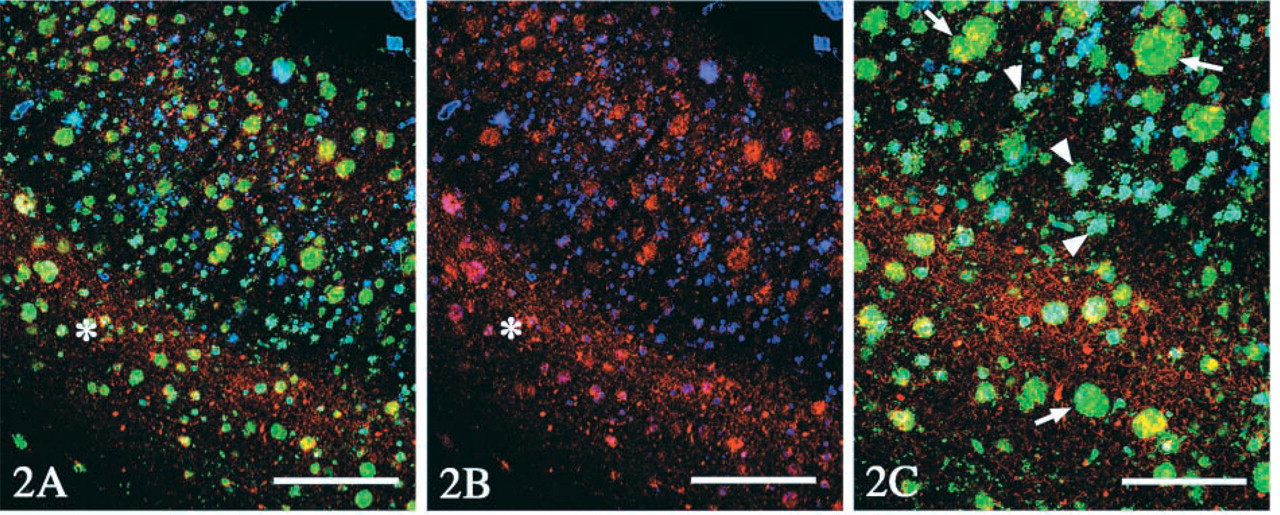
Therefore, we first performed CARD-amplified immunofluorolabeling with anti-Aβ40 (Figures 2A–2C), which was visualized with Cy5, shown as blue. Subsequent double labeling with AT8 (1:1000; Figures 2A–2C, red) and with anti-Aβ42 (1:1000; Figures 2A and 2C, green) antibody was visualized with the mixture of anti-mouse IgG conjugated with rhodamine and anti-rabbit IgG conjugated with FITC. As shown in Figure 2, no crossreaction between the two rabbit polyclonal antibodies (anti-Aβ40 and anti-Aβ42) was detectable. Moreover, it is noteworthy that reverse experiments, anti-Aβ42 with amplification followed by anti-Aβ40, gave essentially the same results (Figure 3).
(
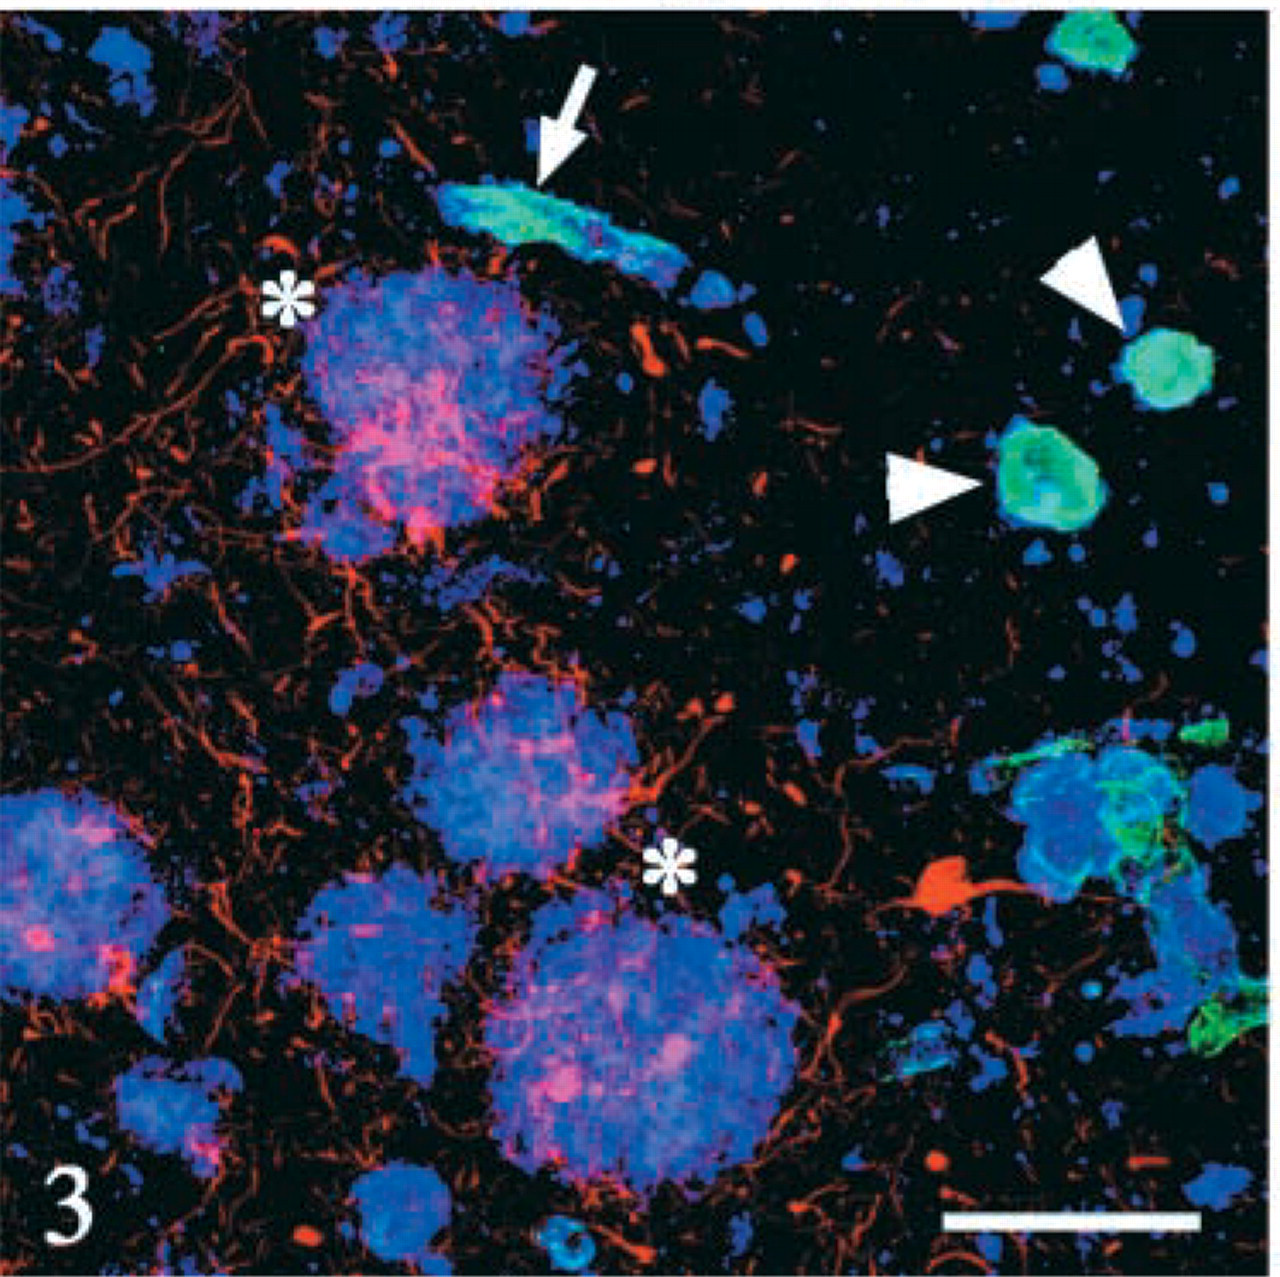
Triple immunofluorolabeling of the cerebral cortex with anti-Aβ42 (blue), anti-Aβ40 (green), and anti-PHF tau (red). Cotton wool plaques (asterisks) are positive mainly for Aβ42, and participation of Aβ40 is not detectable. Core-like structures (arrowheads) and blood vessel (arrow) are positive for Aβ40 and for Aβ42 to a lesser extent. Reactive neurites are slender and are clustered around CWPs but are not detectable around Aβ40-positive structures. Bar = 100 μm.
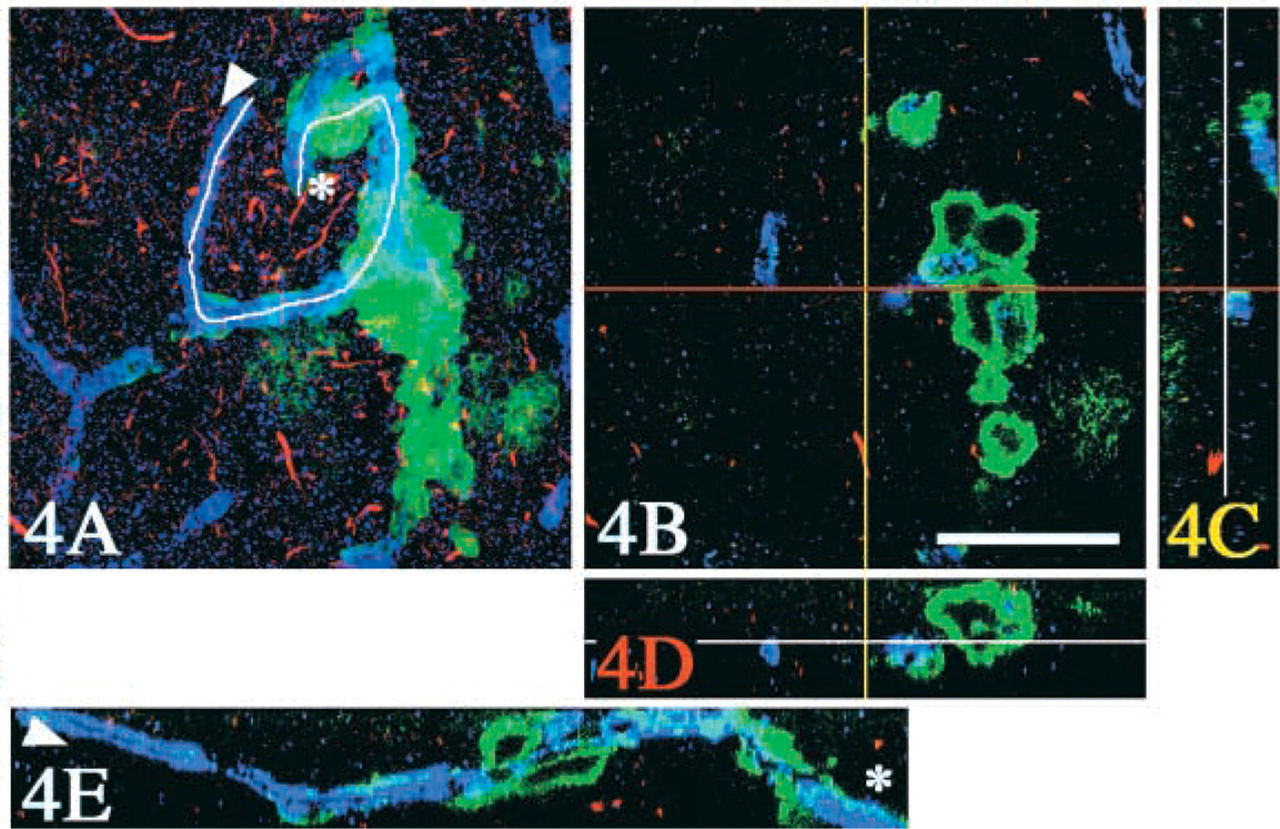
A total of 114 optical sections (X–Y with the interval of 0.3 μm along Z-axis) were obtained from a triple-labeled thick floating section (green, Aβ40; red, PHF-tau; blue, von Willebrand factor for blood vessels) from the cerebral cortex. Three-dimensional reconstruction was performed on the software. (
Most of the CWPs were homogeneously labeled with the anti-Aβ42 antibody [green in Figure 2 (arrows) and blue in Figure 3], and participation of Aβ40 was partial on these CWPs (blue in Figure 2 and green in Figure 3). In contrast, Aβ40 was deposited as core-like structures (arrowheads in Figures 2C and 3), which were rare in deeper layers of the cerebral cortices (asterisk in Figure 2B, blue) and contained also Aβ42 (arrowheads in Figure 2C). Three-dimensional analysis demonstrated that these core-like structures positive for Aβ40 (Figure 4, green) were sometimes clustered along the blood vessel (arrowhead in Figure 4A). The Aβ40 epitope was sometimes co-localized to the vessel wall, with an occasional continuity to these core-like structures. Neuritic reactions, detected with AT8/rhodamine, were present around CWPs (asterisks in Figure 3, red), but they were rarely observed around the core-like structures (arrowheads in Figure 3) or the vessel wall (arrow in Figure 3).
As suggested by the stacked view of the 114 optical sections (Figure 4A), some of the core-like structures were occasionally clustered around blood vessels. Three-dimensional observation with the software enabled us to examine a simultaneous stereoscopic view of these three epitopes (Aβ40, PHF-tau, and blood vessel). Finally, a cross-sectional view along an arbitrary cutting line on the blood vessel (from arrowhead to asterisk in Figure 4) showed that Aβ40 accumulated around the blood vessel either in a linear or a spherical fashion (Figure 4E).
Discussion
We successfully performed triple immunofluorolabeling with two antibodies raised in rabbits and another mouse MAb. Single immunofluorolabeling with different concentrations of the anti-Aβ40 antibody clarified that the optimal dilution of the anti-Aβ antibodies without CARD amplification was 1:1000, whereas equivalent labeling was obtained at a dilution of 1:30,000 after amplification with CARD. One of the theoretical bases for discriminating two distinct epitopes with antibodies raised in the same species depends on this difference in the optimal concentration of the antibody for immunofluorescence study (Hunyady et al. 1996). The anti-Aβ40 antibody in the first cycle was so diluted (1:30,000) that the corresponding epitope could be visualized only after the amplification, but visualization without amplification, as used in the second cycle, was not sensitive enough to detect this anti-Aβ40 antibody diluted further to another 30-fold below the detection threshold. It is possible that the anti-rabbit antibody used in the first cycle before CARD amplification could be a source of crossreaction because it has an affinity for the other polyclonal antibody produced also in rabbit used in the second cycle. Practically, this reaction was found to be less than the detection threshold, as demonstrated in Figure 2, which showed definite separation of the signals from Aβ40 and Aβ42 epitopes. Specific labelings were perfectly interchangeable when the two antibodies, anti-Aβ40 and anti-Aβ42, were replaced with each other (Figure 3), which provided additional evidence that crossreaction between the two epitopes was negligible. The absence of crossreaction may be explained by the low concentration of the first primary antibody, which attracts, if any, a very tiny amount of the anti-rabbit antibody. This amount of the anti-rabbit antibody should be far below the detection threshold even if the second polyclonal antibody is attached to it. Wide separation of the emission signals from FITC and from Cy5 made it possible to insert another emission signal from rhodamine without crosstalk between them (Table 2), because rhodamine was designed to label another monoclonal antibody, AT8, through anti-mouse IgG, which never crossreacts with the other two polyclonal antibodies produced in rabbits.
These triple-labeled sections demonstrated that most of the CWPs were homogeneously stained with the anti-Aβ42 antibody (Crook et al. 1998; Le et al. 2001; Steiner et al. 2001; Verkkoniemi et al. 2001; Tabira et al. 2002). One of the intriguing findings was that core-like structures were intensely labeled with the anti-Aβ40 antibody. These core-like structures were rare in deeper cortical layers of the cerebral cortex (Figure 2B) and were not necessarily associated with deposits of Aβ42. Although a possible spatial relationship of these core-like structures to blood vessels was suspected even with two-dimensional observation (Figure 3), 3D reconstruction confirmed that they were sometimes in continuity with blood vessels similarly labeled with the anti-Aβ40 antibody (Figure 4). Furthermore, this reconstruction enabled us to observe cross-sectional images not only along the X, Y, or Z axis but also along an arbitrary line tracing the target structure, e.g., blood vessels as shown in Figure 4E. No similar relationship to blood vessels was evident with Aβ42-positive CWPs. Simultaneous labeling with AT8/rhodamine demonstrated that AT8-positive neurites were slender, without focal swelling, and were abundant around CWPs but rarely associated with the core-like structures. Furthermore, AT8-positive structures were uniformly scattered throughout the entire thickness of the sections, providing proof that this triple immunofluorolabeling reliably and homogeneously detected the structures in question under the present experimental conditions applied to the thick sections. Morphology, immunohistochemical features, and association of tau-positive neurites were found to be different in Aβ42-positive CWPs from those in Aβ40-positive core-like structures and blood vessels. These differences suggest that mechanisms involved in Aβ deposition may be different in these structures found in the same microscopic field.
In summary, we established a triple-immunofluoro-labeling method with two rabbit polyclonal antibodies and a mouse monoclonal antibody, which simultaneously visualized Aβ40, Aβ42, or von Willebrand factor and PHF-tau epitopes. Application of this triple immunofluorolabeling enabled thick sections to be analyzed on a 3D basis. Immunohistochemical features and distribution were found to be different between Aβ42-positive deposits and their Aβ40-positive counterparts. This suggests that the mechanism of Aβ deposition for CWPs is different from that of other Aβ deposits, such as core-like structures. This triple-labeling method will expand the applicability and precision of multiple immunoflurolabeling, which is advantageous in a wide range of research and diagnosis.
Footnotes
Acknowledgements
Supported in part by a grant (TU) from the Ministry of Culture, Sports, Science and Technology, Japan.
We are grateful to Mr Ray Cowan for reading the manuscript.