
Abstract
Arginase I (AI), the fifth and final enzyme of the urea cycle, detoxifies ammonia as part of the urea cycle. In previous studies from others, AI was not found in extrahepatic tissues except in primate blood cells, and its roles outside the urea cycle have not been well recognized. In this study we undertook an extensive analysis of arginase expression in postnatal mouse tissues by in situ hybridization (ISH) and RT-PCR. We also compared arginase expression patterns with those of ornithine decarboxylase (ODC) and ornithine aminotransferase (OAT). We found that, outside of liver, AI was expressed in many tissues and cells such as the salivary gland, esophagus, stomach, pancreas, thymus, leukocytes, skin, preputial gland, uterus and sympathetic ganglia. The expression was much wider than that of arginase II, which was highly expressed only in the intestine and kidney. Several co-localization patterns of AI, ODC, and OAT have been found: (a) AI was co-localized with ODC alone in some tissues; (b) AI was co-localized with both OAT and ODC in a few tissues; (c) AI was not co-localized with OAT alone in any of the tissues examined; and (d) AI was not co-localized with either ODC or OAT in some tissues. In contrast, AII was not co-localized with either ODC or OAT alone in any of the tissues studied, and co-localization of AII with ODC and OAT was found only in the small intestine. The co-localization patterns of arginase, ODC, and OAT suggested that AI plays different roles in different tissues. The main roles of AI are regulation of arginine concentration by degrading arginine and production of ornithine for polyamine biosynthesis, but AI may not be the principal enzyme for regulating glutamate biosynthesis in tissues and cells.
A
We recently reported the patterns of arginase isozyme expression in mouse brain and embryo (Yu et al. 2001,2002). We began with the idea from prior work in humans and rodents that AI was responsible primarily for urea synthesis and that AII was likely to be primarily responsible for the biosynthesis of ornithine, subsequently leading to the production of other biologically relevant molecules such as polyamine and glutamate or proline. Therefore, we expected AII to be more widely expressed during embryonic development and in the brain. Our hypothesis was contradicted by our study results, which demonstrated widespread expression of AI in developing embryos and in brain (Yu et al. 2001,2002). The expression pattern of arginase isozymes in embryos and brain suggested that AI is the principal form that participates in ornithine biosynthesis in embryonic development and in the nervous system.
AI was found only in human and mouse liver by Northern blotting analysis (Vockley et al. 1996; Morris et al. 1997) but was detected in mouse brain and embryos by in situ hybridization (ISH) techniques (Yu et al. 2001,2002). A possible explanation for this discrepancy is the higher sensitivity of ISH, which is capable of detecting mRNA in single cells and relating microscopic topological information to mRNA expression. Until the present study, arginase expression and distribution in most postnatal tissues had not been studied by ISH.
Compared with other urea cycle enzymes, arginase has a much wider distribution in tissues, which suggests that arginase has important physiological roles aside from the urea cycle. These include potential roles as a regulator of the synthesis of polyamines, glutamate, proline, and NO (Kepka-Lenhart et al. 2000; Li et al. 2001). Arginase hydrolyzes arginine to ornithine which, in turn, serves as a precursor for polyamine biosynthesis via ornithine decarboxylase (ODC), or proline and glutamate via ornithine aminotransferase (OAT). OAT, which is located in mitochondria, catalyzes the reversible conversion of ornithine and a-ketoglutarate to glutamic-γ-semialdehyde and glutamate (Figure 1). Depending on the physiological circumstances, OAT functions in arginine metabolism, leading to glutamate or proline biosynthesis, or by the reverse reaction to de novo ornithine synthesis (Peraino et al. 1969; Mezl and Knox 1976; Wang et al. 1995a). ODC, which catalyzes the conversion of ornithine to putrescine in an irreversible reaction, is the key rate-limiting enzyme for the biosynthesis of polyamines (putrescine, spermidine, and spermine), which play a pivotal role in the control of DNA, RNA, and protein synthesis during cell growth, differentiation, and transformation of cells (Pegg et al. 1982; Hougaard 1992; Thomas and Thomas 2000). The hypothesis that arginase may also be rate-limiting for polyamine biosynthesis is supported by recent studies showing that cell proliferation rates could be increased by elevation of AI expression and consequent increased production of polyamines (Wei et al. 2001). Overexpression of arginase also relieved MAG/ myelin-mediated inhibition of neurite growth in isolated dorsal root ganglionic neurons. The same effect is also achieved by addition of polyamines (Cai et al. 2002). To explore the possible role of arginase on polyamines and glutamate biosynthesis pathways, we analyzed the expression of arginase isozymes and their localization with ODC and OAT in postnatal mouse tissues.
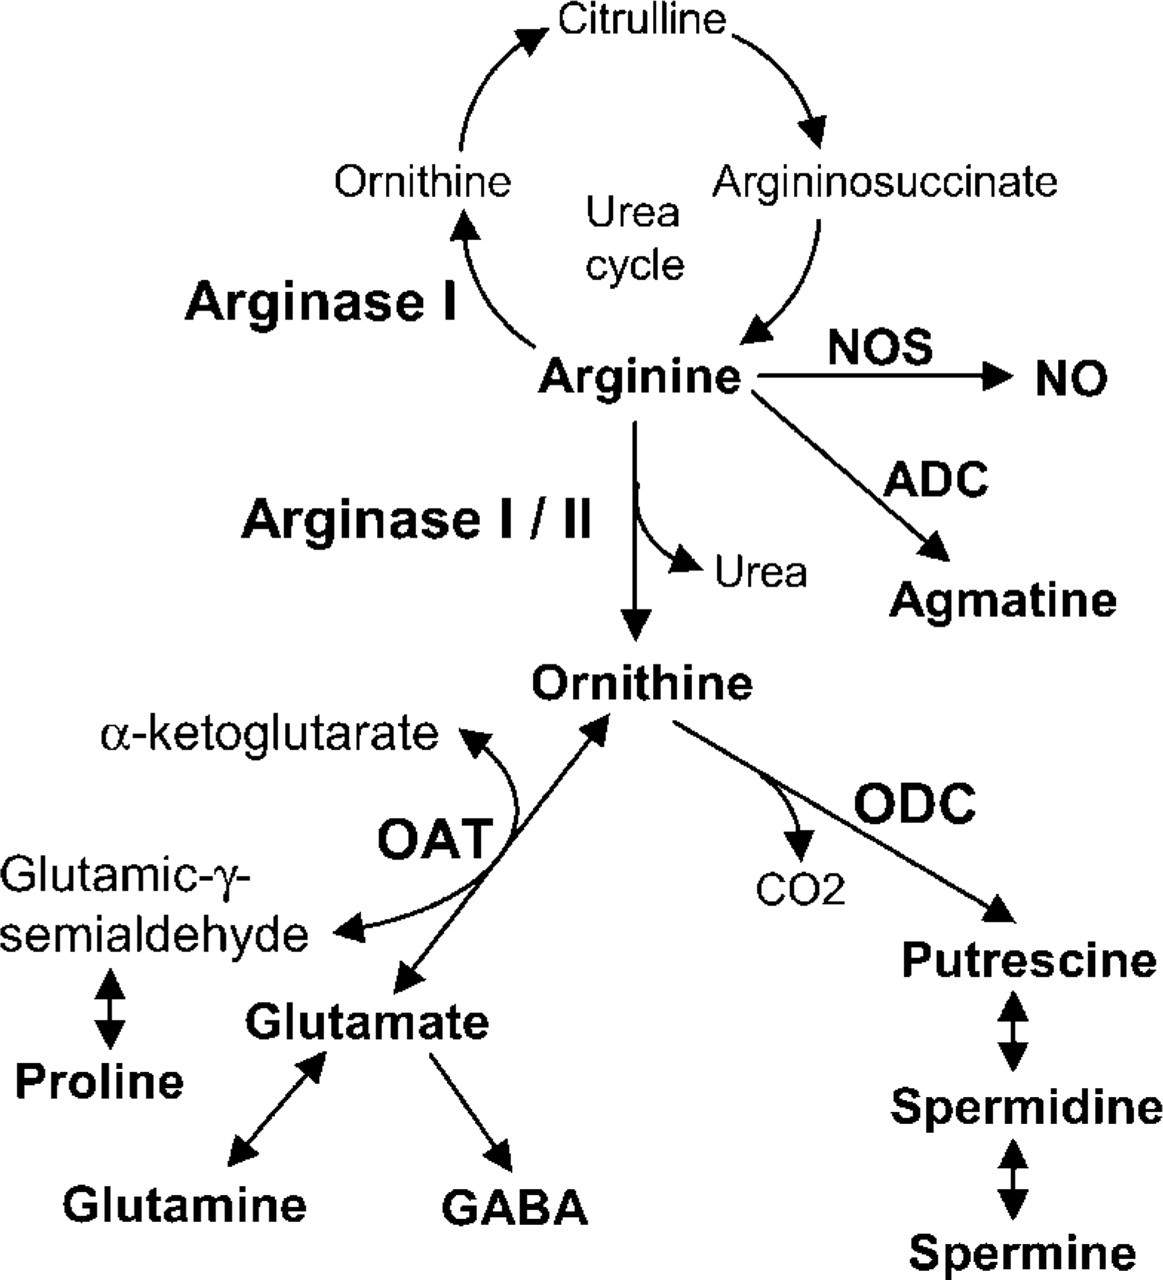
Metabolic pathways of arginine. ADC, arginine decarboxylase; GABA, γ-aminobutyric acid; NO, nitric oxide; NOS, nitric oxide synthase; OAT, ornithine aminotransferase; ODC, ornithine decarboxylase.
Materials and Methods
Animal and Tissue Preparation
C57BL/6 mice were maintained in the UCLA vivarium facilities and were free of infection with known pathogens. They were fed normal lab chow, were given access to water ad lib, and were maintained on 12-hr light–dark cycles. The studies were approved by the UCLA Animal Welfare Committee.
C57BL/6 mice at ages 1, 2, 3, 6, and 12 weeks were used (except skin for RT-PCR). For ISH study, the animals were perfused with 5-10 ml of PBS to flush the blood from the circulatory system through the left ventricle, and then perfused with 25 ml of 4% paraformaldehyde in PBS. The tissues were postfixed with 4% paraformaldehyde in PBS overnight, cryoprotected in 30% sucrose in PBS for 24 hr at 4C, embedded with OCT on dry ice, and stored at −80C until sectioning on a cryostat. Sections were cut at 20-μm thickness, thaw-mounted on Superfrost slides (Fisher Scientific; Pittsburgh, PA), and kept at −80C until use. The tissues for RT-PCR analysis were flash-frozen in liquid nitrogen and kept at −80C until use.
Preparation of cDNA Templates
The AI and AII cDNAs fragments were 956 bp (bases 237–1192; Chieko 1996) and 910 bp (bases 131–1040; Iyer et al. 1998), respectively. The ODC and OAT fragments were 728 bp (bases 63–790; Hickok et al. 1986) and 744 (bases 63–806; Manenti et al. 2002), respectively. Total RNA was isolated from liver or kidney using a total RNA purification system (Sigma; St Louis, MO). RNA reverse transcription and PCR amplification were done as described below. The amplified fragments were checked on a 1% agarose gel and then the PCR products were inserted into the pCRII-TOPO cloning vector (Invitrogen; San Diego, CA). The sequence of positive clones was verified by the UCLA DNA Sequencing Facility.
Synthesis of DIG RNA Probes and ISH
Digoxigenin (DIG)-labeled RNA probes were transcribed from cDNA fragments inserted into plasmids. On the basis of the cDNA sequence, the plasmid DNAs were linearized by BamHI and XbaI or EcoRV and SpeI for antisense and sense preparation. The linearized plasmid DNAs were purified using the QIAGEN quick PCR purification kit (QIAGEN; Valencia, CA), then checked by 1% agarose gel. Linearized plasmid DNA (>1 μg) template was incubated with T7 or SP6 RNA polymerase, 5 × transcription buffer (Promega; Madison, WI), and DIG-RNA labeling mixture (Boehringer Mannheim, Indianapolis, IN) for 2 hr at 37C. It was then incubated with 1 μl deoxyribonuclease I (20 U/μl) for 15 min at 37C to digest template DNA. After ethanol precipitation, the pellet was rinsed with 70% ethanol, dried under vacuum, and reconstituted in RNase-free TE buffer.
Prepared sections were dried for 1 hr at 37C after removal from a −80C freezer. After treatment with 0.25% acetic anhydride in 0.1 M triethanolamine, the sections were incubated with a pre-hybridization solution (Boehringer Mannheim) for 2 hr at 65C and then hybridized overnight at the same temperature with DIG-labeled RNA probe and hybridization solution (Boehringer Mannheim). After washing with 5 × SSC at 65C for 5 min, the slides were washed with 0.2 × SCC at 65C twice for 30 min. Then the sections were incubated with anti-DIG-AP FAb fragments (Boehringer Mannheim) for 2 hr and developed in development buffer (Boehringer Mannheim) overnight at room temperature. Sections were observed and photographed with a CCD camera attached to a Nikon microscope. A brown signal, which was only present in the antisense slides, was judged as positive. No brown signal was observed in sense probe slides (for photos of sense control or AI antisense negative in AI knockout mouse tissues, please refer to Yu et al. 2002).
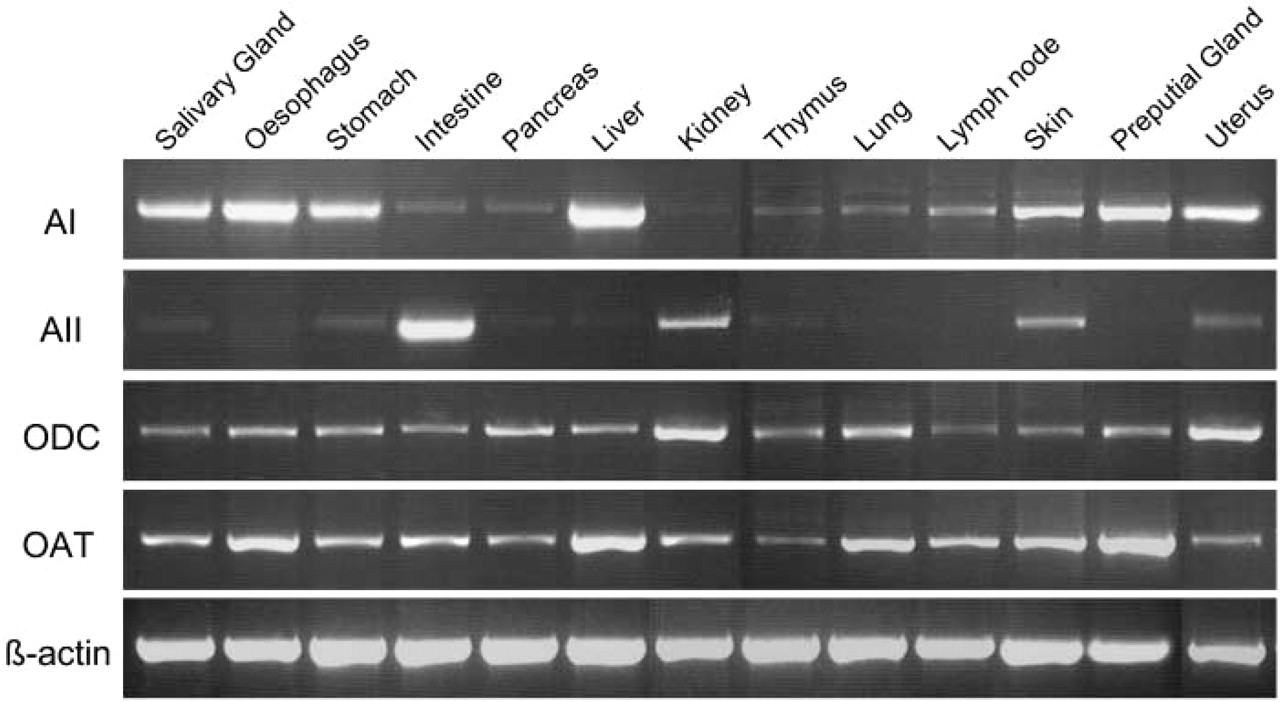
AI, AII, ODC, and OAT expression in mouse tissues by RT-PCR. AI expression was seen in most of the tissues except kidney. Strong expression was observed in the salivary gland, esophagus, stomach, liver, skin, and preputial gland. Strong AII expression was seen in the intestine and kidney. ODC was expressed in every tissue, with strongest expression in the kidney. OAT was present in every tissue studied. All the tissues were collected from 12-week-old mice except for the skin, which was obtained from 2-day-old neonatal mice.
RT-PCR
Total RNA was isolated from 50–100 mg of tissue using a total RNA purification system (Sigma). The quality and quantity of total RNA were detected by 230/260/320-nm UV light. To avoid contamination of hair, skin tissue was taken from 2-day-old neonates. RT-PCR was performed using the ThermoScript RT-PCR System (Invitrogen). cDNA was transcribed from 1 μg of total RNA for each one reaction; 2 μl of the cDNA reaction products was used as template in 50 μl of PCR reaction. Amplification was done using 30 cycles consisting of 30 sec at 94C, 30 sec at 55C, and 30 sec at 72C. Reaction mixture without template cDNA was used as a negative control. The PCR reaction (9 μl) was run on a 1.5% agarose gel to visualize the products. All primers for PCR were the same as for ISH.
Histochemistry and Cytochemistry
PAS (periodic acid-Schiff) staining was performed for identification of mucopolysaccharides of the salivary gland. Slides were stained in periodic acid solution for 5 min, then in Schiff's reagent solution for 15 min (Sigma). The nuclei were stained with hematoxylin. The confirmation of histology for other tissues was completed using hematoxylin and eosin staining from the contiguous section.
Results
RT-PCR
The expression of AI, AII, ODC, and OAT genes in mouse tissues by RT-PCR is shown in Figure 2. AI expression was seen in most of the tissues studied except kidney. Strong expression was observed in the salivary gland, esophagus, stomach, liver, skin, and preputial gland. Strong AII expression was seen only in the intestine and kidney. ODC was expressed in all the tissues, with strongest expression in the kidney. OAT was present in every tissue studied.
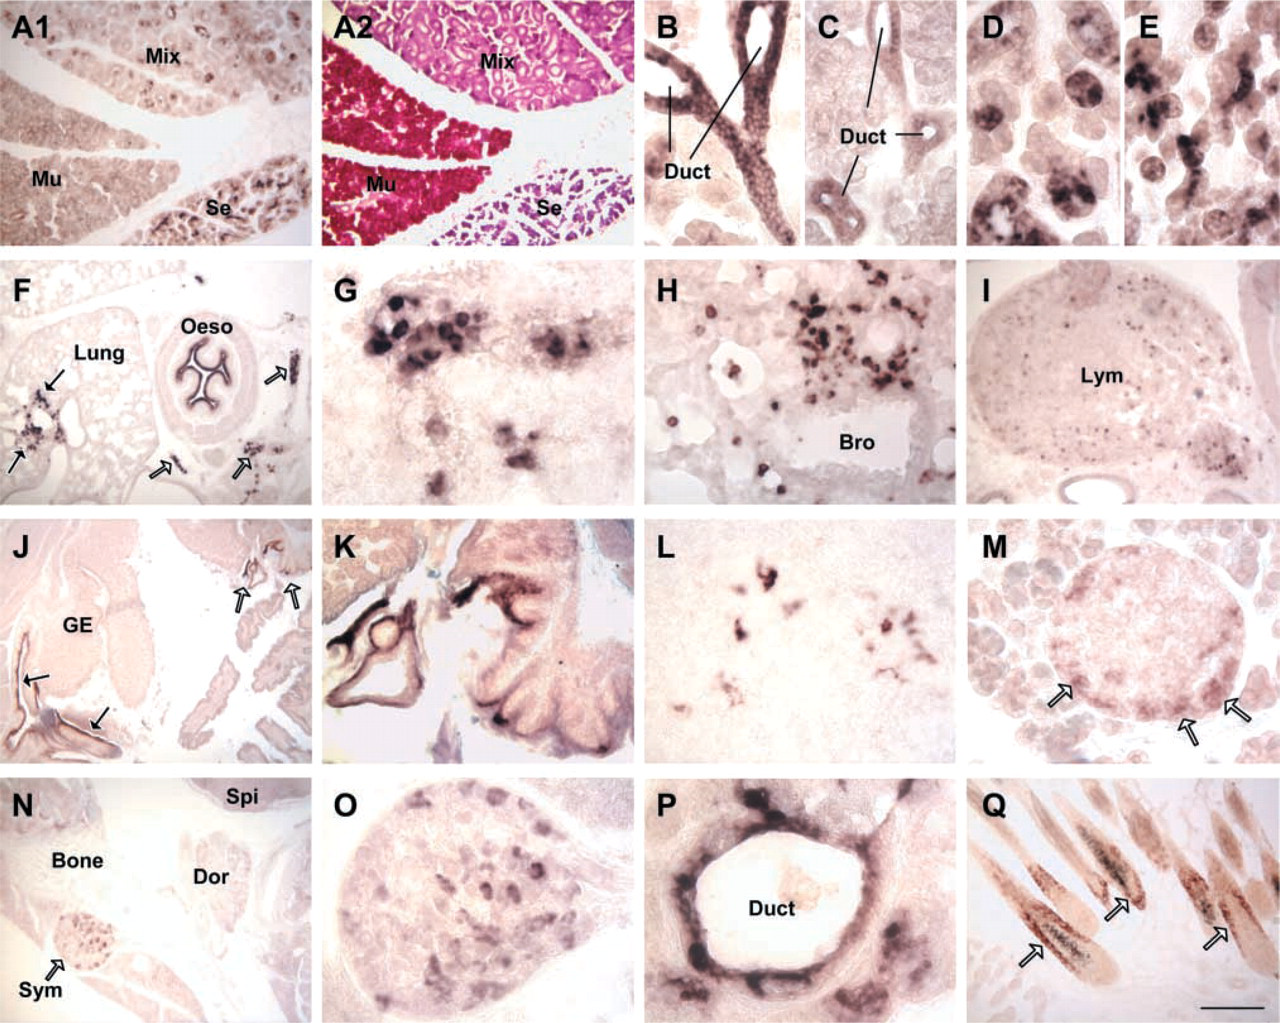
Wide expression of AI in mouse tissues by ISH. (
In Situ Hybridization
AI Expression The widespread expression of AI, as detected by ISH, is shown in Figure 3. AI was expressed in the salivary gland, esophagus, stomach, intestine, pancreas, liver, thymus, lung, lymph node, skin, preputial gland, uterus, and sympathetic ganglia. In the salivary gland, esophagus, stomach, and preputial gland, AI was located in the epithelium. In the lung, thymus, and lymph node, AI was expressed in the leukocytes. Compared to adults (12 weeks), stronger expression was seen in fetal esophagus, stomach, skin, and lung.
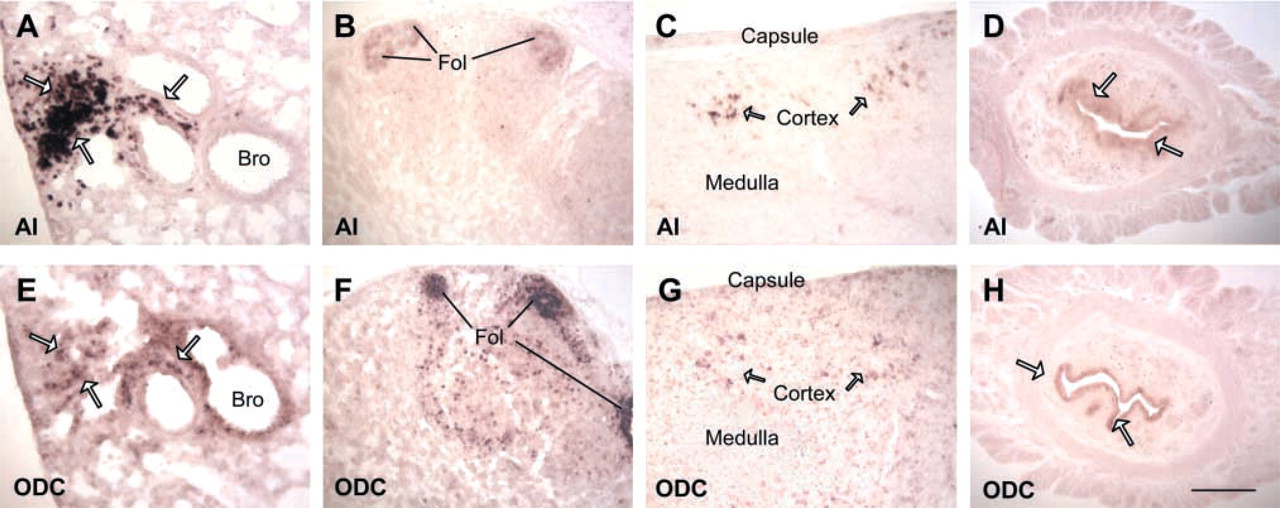
Co-localization of AI and ODC by ISH. The name of the specific genes is marked on the bottom left corner of each photograph. (
Digestive System. AI was expressed in the salivary gland, esophagus, and stomach in the surface epithelium, duct epithelium, and secretory epithelium. In the salivary glands, AI was seen in both the duct epithelium (Figures 3B and 3C) and the secretory epithelium (Figures 3D and 3E). In the serous gland and mixed gland, only serous gland epithelium expressed AI. No AI expression was seen in the mucous gland epithelium of the mucous gland and mixed gland (Figures 3A1, 3C, and 3D). In the esophagus, the expression was located in the surface stratified squamous epithelium; the expression in neonates (Figure 3F) was much stronger than in adults. In the stomach, strong expression was seen only in the surface epithelium of the cardia and pylorus (Figures 3J, 3K, and 6D). AI expression in the intestine was very weak and was seen only in the 1- and 2-week-old neonates.
In the liver, AI was expressed in the periportal hepatocytes. No expression was seen in the pericentral hepatocytes (Figure 5A).
Pancreas. In the pancreas, very weak expression of AI was seen in the gland cells of the exocrine portion but moderate AI expression was present in the peripheral cells of the islet of Langerhans (endocrine portion) (Figure 3M).
Leukocytes. In the lung, scattered AI-positive macrophages/monocytes were present in the alveolar wall and in the alveolar cavity. Concentrated AI positive macrophages/monocytes were also observed in the fetal lung (Figures 3F, 3H, and 4A). AI-positive macrophages were also present in the pericardial and pleural cavity (Figures 3F and 3G). In the thymus, the expression was located in the thymocytes (lymphocytes) in the cortex (Figures 3L and 4C). In the lymph node, the expression was located in the lymphocytes (Figures 3I and 4B).
Sympathetic Ganglia. AI was expressed in the ganglion neurons in the sympathetic ganglia. Expression was seen during postnatal development from 1 week to 12 weeks (Figures 3N and 3O).
Other Tissues. AI was expressed in the skin and in some reproductive tissues such as preputial gland and uterus. In the skin, AI was expressed in the hair follicle; expression was detected during postnatal day 1 to 2 weeks (Figures 3Q and 6G). In the preputial gland, AI was expressed in the duct epithelium but not glandular epithelium (Figures 3P and 6A). In the uterus, expression was seen in the endometrium (Figure 4D).
AII Expression
By ISH, strongest AII expression was seen in the small intestine (data not shown). Expression in the kidney was weaker than that in the small intestine. In the kidney, AII was present in the inner zone of proximal tubules (Figure 6J).
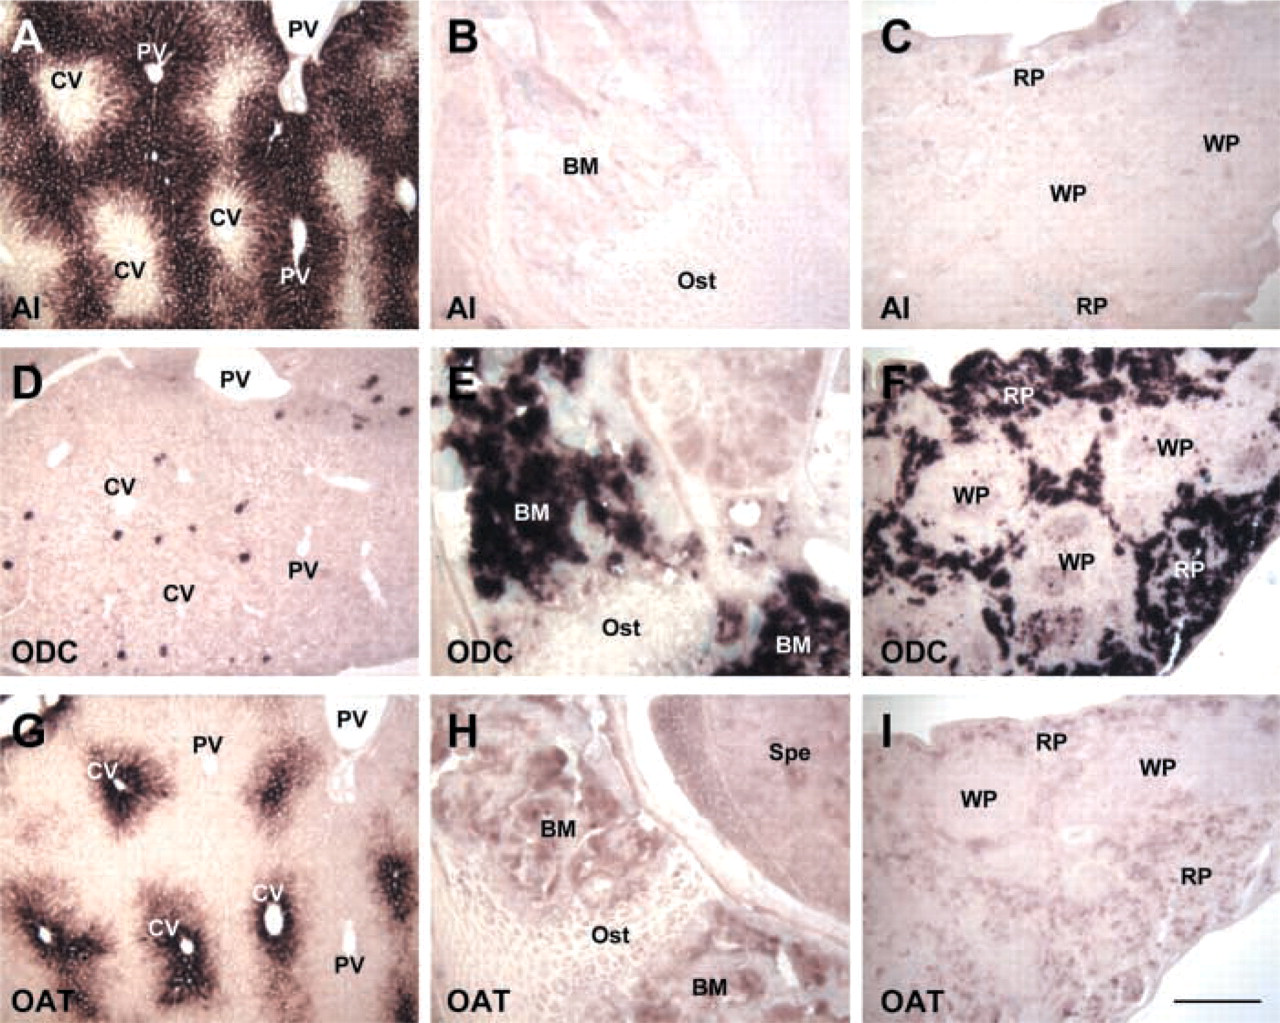
Different localization of AI and ODC or OAT in the liver, bone marrow, and spleen by ISH. The name of the specific gene is marked at the left bottom corner of each photograph. (
Expression and Localization Patterns of AI, AII, ODC, and OAT Genes
A comparison of AI, AII, ODC, and OAT expression by ISH is shown in Table 1. Several patterns can be deciphered. (a) AI is the principal form of arginase to be expressed in various tissues and cells, except intestine and kidney. (b) AI co-localized with ODC alone in many tissues, such as esophagus, uterus, macrophages in lung, and lymphocytes in thymus and lymph node (Figure 4). (c) AI co-localized with both OAT and ODC in some tissues, such as the salivary gland epithelium, but AI did not co-localize with OAT alone in any tissue examined. (d) AI was expressed strongly but was not co-localized with either ODC or OAT in a few tissues, such as in preputial gland, stomach, and skin (Figure 6). (e) ODC was highly expressed in the spleen and the bone marrow, in which arginase expression was not seen, and only very low expression of OAT was present (Figure 5). (f) OAT was co-localized with ODC alone in some tissues, such as surface epithelium of respiratory tract and hair bulb of skin (Figure 6). (g) AII was highly expressed in the intestine and kidney and AII was co-localized with ODC and OAT in the small intestine (Table 1). (h) AI expression was not detected in the kidney, whereas no AII expression was found in the liver. AI, OAT, and ODC were not co-localized in the same region of the liver (Figure 5), and AII, ODC, and OAT were not co-localized in the same region of the kidney (Figure 6).
Histochemistry and Cytochemistry
PAS staining identified subtypes of the salivary glands. The mucous gland epithelium was stained reddish-purple, whereas the serous salivary gland was stained blue-purple only by hematoxylin (Figure 3A2). H&E staining was used for confirmation of leukocytes and other tissues, as demonstrated in our previous study (Yu et al. 2002).
Discussion
The present study has shown, for the first time, that AI is not only widely expressed in mouse tissues but that it is also the principal form of arginase expressed in most mouse tissues and cells, except small intestine and kidney (Figures 2–6). AI is co-localized with ODC in many tissues and with both ODC and OAT in some tissues, whereas co-localization of AII with ODC and OAT was seen only in the small intestine.
Because both AI and ODC exist in the cytoplasm and the reaction catalyzed by the ODC reaction is irreversible, co-localization of AI and ODC could shift the metabolic fate of arginine to the direction of arginine→ornithine→putrescine. The co-localization pattern of AI and ODC presented here supports the hypothesis that arginase contributes to polyamine biosynthesis (Pegg and Peter 1982). Ornithine is available from the blood circulation (Pegg et al. 1982) and can also be produced within the cell from arginine by the action of arginase. However, no previous study has shown that the supply of tissue ornithine is dependent on arginase. The interesting result from the present study is that AI was not co-localized with ODC in the spleen, bone marrow, and liver (Figure 5), which possess rich blood circulation. However, AI was co-localized with ODC in the highly regenerative tissues and cells in which blood circulation is relatively low, such as the surface epithelium of the esophagus, lymphocytes in lymph node and thymus, and endometrium of the uterus (Figure 4). It appears that tissues with ample blood circulation can obtain enough ornithine/putrescine from plasma for polyamine biosynthesis but that, in the highly regenerative tissues that have relatively low blood circulation, endogenous ornithine biosynthesis is needed for polyamine production. This AI and ODC expression pattern thus demonstrates that one of the physiological roles of AI is production of endogenous ornithine to ensure sufficient polyamine production, at least in some tissues.
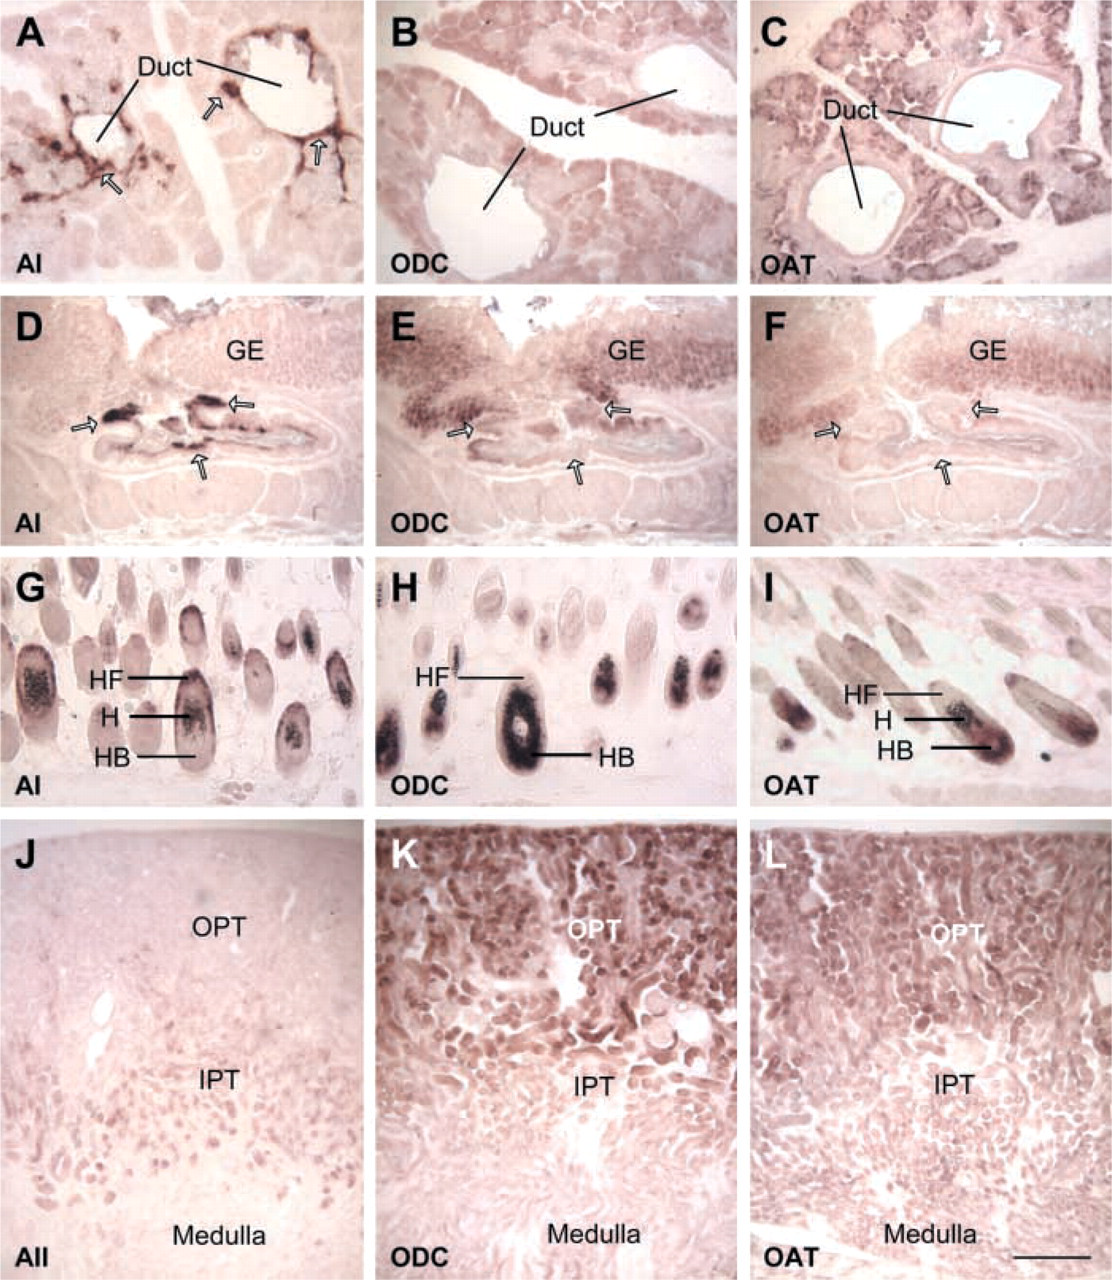
Differential localization of AI or AII with ODC and OAT by ISH. The name of the specific gene is marked at left bottom corner of each photograph. (
In tissues where AI co-localizes with ODC and OAT, it is difficult to determine whether the role of OAT is to produce glutamic-γ-semialdehyde/glutamate by the forward reaction (arginine→ornithine→glutamate) or to supply ornithine for polyamine biosynthesis by the reverse reaction. However, if AI co-localized with OAT alone, it would increase the possibility that the metabolic pathway proceeds in the forward direction. The present study shows that AI does not co-localize with OAT alone in any of the tissues examined but does co-localize with both OAT and ODC in a few tissues. Therefore, though ornithine produced by AI could serve as substrate for both glutamate and polyamine biosynthesis pathways in these tissues, the importance of AI in these metabolic pathways is unknown, because a reversible OAT reaction could also supply ornithine for this purpose. Contrary to our expectations, in some tissues, such as the respiratory tract surface epithelium and hair bulb, no arginase expression was seen but strong OAT expression along with ODC expression was observed (Figure 6). Endogenous ornithine is needed for growth and regeneration in these tissues with a relative low blood circulation. The co-localization pattern of OAT and ODC increases the possibility that endogenous ornithine can be supplied by the reverse OAT reaction. The results presented here suggest that AI may not be the principal enzyme producing ornithine for glutamate or pro-line biosynthesis in most tissues. Instead, OAT may be the principal enzyme that provides endogenous orni-thine in some tissues.
Localization and intensity of AI, AII, ODC, and OAT mRNAs in mouse tissues by in situ hybridizationa
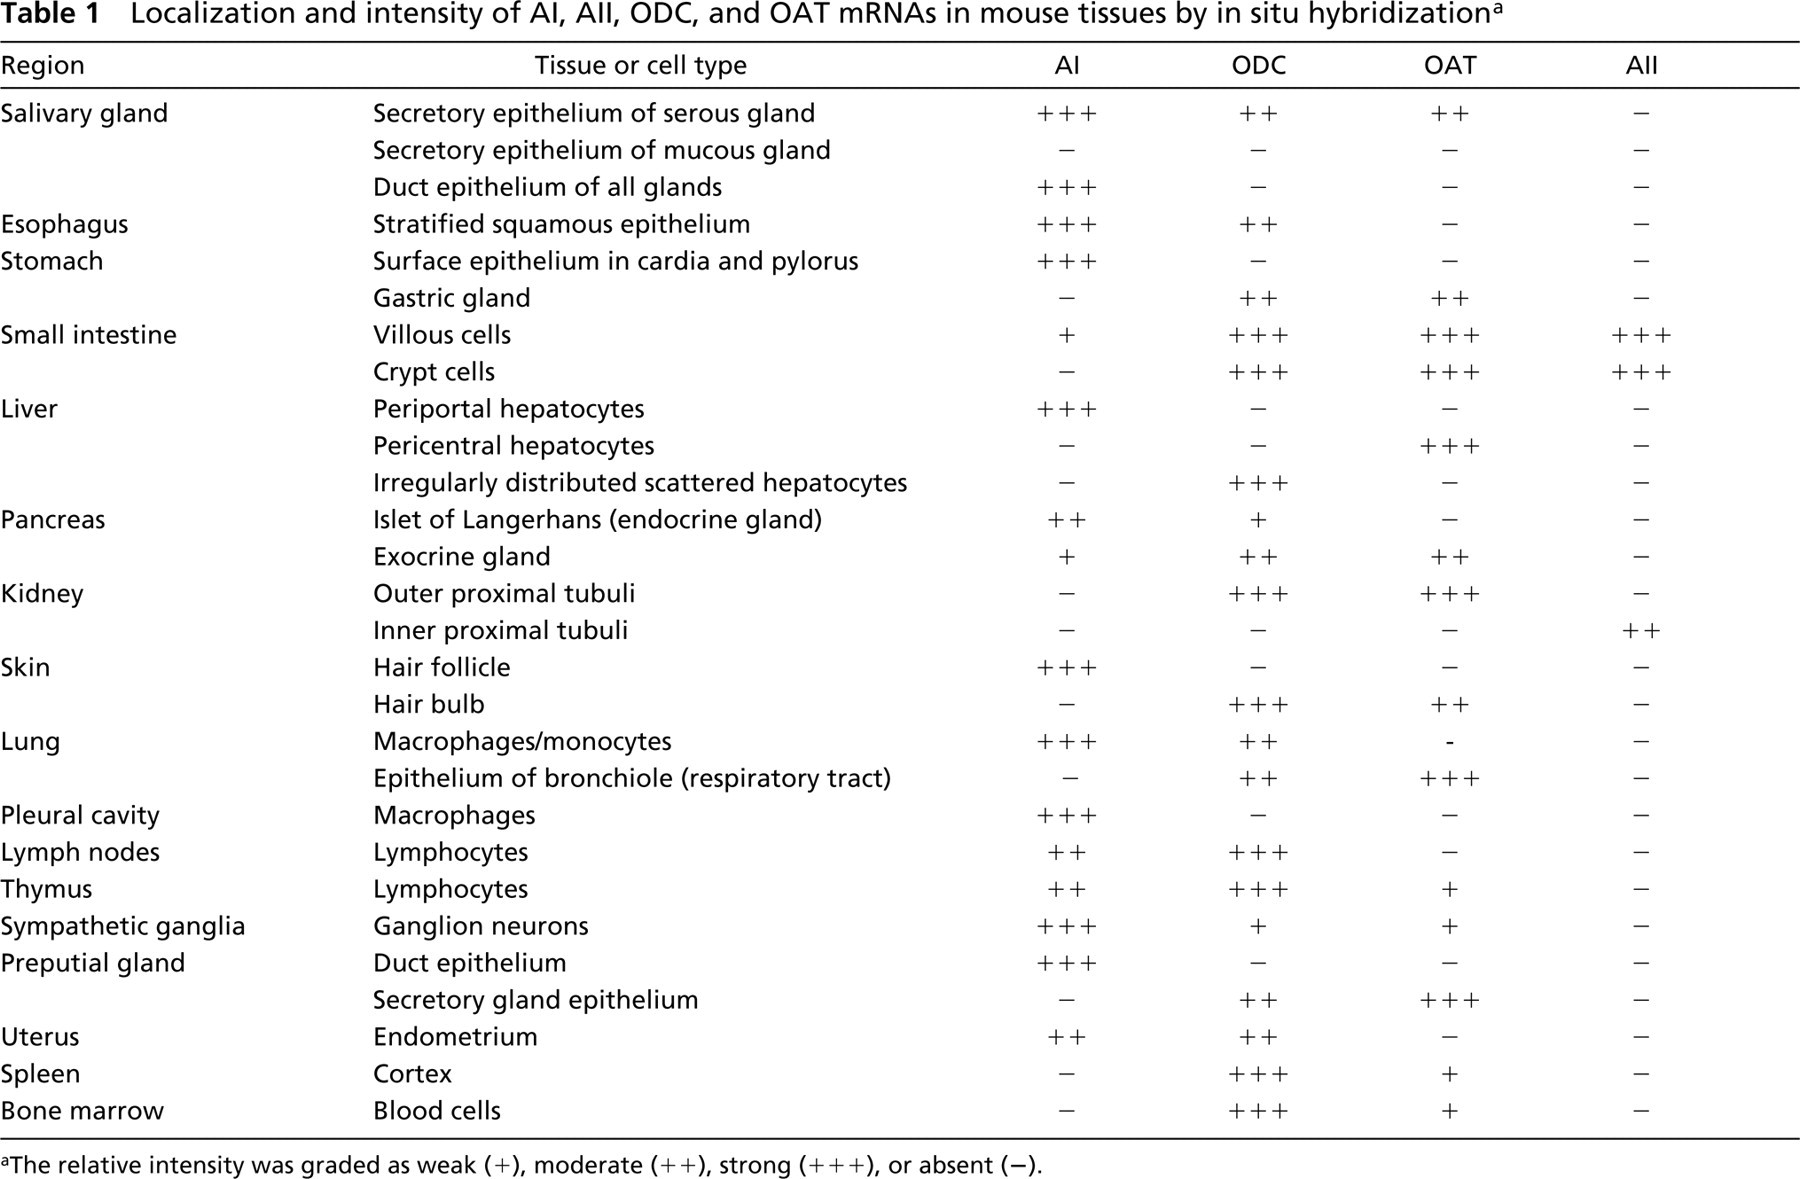
The relative intensity was graded as weak (+), moderate (++), strong (+++), or absent (−).
Another possible role for AI is regulation of argi-nine concentration by degradation of arginine in ex-trahepatic tissues. This is suggested by the AI expression pattern in the gland duct epithelium and the surface epithelium of the upper GI tract. AI was strongly expressed in the duct epithelium of the salivary gland and preputial gland, without co-localization with ODC or OAT (Figure 6). We also examined NO synthase mRNAs (iNOS and eNOS) expression in these tissues but did not find co-expression with AI (data not shown). The duct epithelium AI may regulate the secretory fluid's arginine concentration to influence its calcium concentration and pH for the physiological needs (Abdollahi et al. 2000; Endo et al. 2002). Another interesting result from the present study is that AI was not expressed at all in the respiratory tract (Figure 4A) but was strongly expressed in the upper GI tract. Very strong AI expression was seen in the surface epithelium of the entire oral cavity at postnatal day 1 (Yu et al. 2002), in the esophagus, and in the stomach surface epithelium in the cardia and pylorus regions (Figures 3J and 3K), which are very sensitive to pH changes. GI tract AI could degrade ar-ginine to ornithine as soon as it enters the GI tract, thus protecting the surface epithelium from any detrimental effects of a high arginine concentration.
In the present study we found that AI was strongly expressed in the macrophages/monocytes in the lung, in the pericardial and pleural cavities, and in the lymphocytes under physiological conditions. AI not only is induced by pathological conditions (Waddington et al. 1998; Ochoa et al. 2001; Tsuei et al. 2001) but, more importantly, it is expressed in the immune system under physiological conditions (Yu et al. 2002). Co-induction of arginase and NOS by lipopolysaccha-ride (LPS) in murine macrophage lines has been studied by many investigators, and it has been hypothesized that arginase may modulate/downregulate NOS activity by competition for the common substrate arginine (Wang et al. 1995b; Gotoh et al. 1996; Sonoki et al. 1997; Gotoh and Mori 1999). On the other hand, another study showed that overexpression of AI in macrophage had no effect on NO synthesis but produced twice as much putrescine (Kepka–Lenhart et al. 2000). In the present study and our additional study on NOS (data not shown), we found that, in the sympathetic ganglion neurons, AI expression pattern was not similar to that of OAT or ODC but was very similar to that of NOS. Sympathetic ganglion AI may regulate NO biosynthesis through degradation of the common substrate arginine. On the other hand, AI may regulate polyamine biosynthesis in macrophages and lymphocytes because AI was co-localized with ODC in macrophages and lymphocytes. Nevertheless, the distribution of AI in the macrophages was wider and stronger than ODC but was more limited than ODC in the lymphocytes (Figure 4), suggesting that the role of AI in the leukocytes may not be limited to polyamine biosynthesis. AI may have other roles in the immune system that still remain unknown.
Arginase II was highly expressed in the small intestine, and was co-localized with OAT and ODC in the small intestine (Table 1). Similar results have also been reported by others (De Jonge et al. 1998; Ozaki et al. 1999; Dekaney et al. 2001), and AII was thought to be involved in the synthesis of proline and polyamines in the small intestine and kidney (Wu and Morris 1998; Ozaki et al. 1999). However, in the present study we have shown that, although AII was co-expressed with ODC and OAT in the kidney, it was not found in the same cells as the other two enzymes. ODC and OAT were located in the outer proximal tubules, whereas AII was located in the inner proximal tubules (Figure 6). The proximal tubule is the major site of re-absorption of amino acids and protein. Arginine reabsorbed by the proximal tubule can be converted to ornithine by AII. The patterns of AII, ODC, and OAT localization suggest the possibility that the physiological role of AII in kidney is not to regulate polyamine or pro-line biosynthesis but to regulate blood arginine concentration. High blood arginine concentration can increase AII activity in the kidney, as shown by studies on hyperargininemia patients in whose kidneys AII activity was significantly and reproducibly increased (Grody et al. 1989,1993).
During embryonic development, we found strong AI expression in the sensory ganglion neurons in the dorsal root ganglia and retina (Yu et al. 2002). However, AI was not detected in the sensory ganglion neurons during postnatal development by ISH, and AI expression in the sympathetic ganglion neurons in the postnatal development was stronger than that during embryonic development. In some tissues and cells, such as in the thymus, lymphocytes, pancreas, stomach, and esophagus, AI was expressed in both embryonic and postnatal development (Yu et al. 2002), but the location and/or intensity of AI signal is different in some tissues. For example, in the pancreas AI was strongly expressed in the glandular cells during the early stage of embryonic development, but during postnatal development no strong expression was seen in the glandular cells. In the stomach, AI was expressed in the surface epithelium of the entire stomach during embryonic development, but it was expressed only in the cardia and pylorus during postnatal development. The stronger expression of AI in some tissues in embryos and/or neonates suggests that AI may have roles in organogenesis and development, although the mechanism remains unknown.
In the present study, the expression of ISH is concordant with the RT-PCR data in most of the tissues studied. For example, strong AI expression in the salivary gland, esophagus, stomach, liver, and preputial gland was detected by RT-PCR, and strong AI signal was also found in those tissues by ISH. However, in some tissues small amounts of mRNA can be detected only by RT-PCR but not by ISH.
In summary, a central and well-known role of AI is catalyzation of the hydrolysis of arginine to ornithine and urea as the final step of the urea cycle. Furthermore, the role of AI outside the urea cycle has not yet been well recognized. The present study is the first to show that AI is widely expressed in mouse tissues. AI was found to be the principal form expressed in most tissues and cells, except in the intestine and kidney. AI co-localized alone with ODC, but not OAT, in some tissues, whereas AII was not co-localized with either ODC or OAT alone in the tissues examined. AI was also expressed alone in some tissues without co-localization with both ODC and OAT. The arginase, ODC, and OAT expression patterns suggest a dichot-omous role of AI, which is production of ornithine for polyamine biosynthesis and regulation of arginine concentration by degrading arginine.
Footnotes
Acknowledgements
Supported by USPHS grants HD-06576 and HD-04612, and in part by the Mental Retardation Research Program at UCLA.