
Abstract
Satellite cells (SCs) are the main source of new fibers in regenerating skeletal muscles and the key contributor to extra nuclei in growing fibers during postnatal development. Aging results in depletion of the SC population and in the reduction of its proliferative activity. Although it has been previously determined that under conditions of massive fiber death in vivo the regenerative potential of SCs is not impaired in old muscle, no studies have yet tested whether advanced age is a factor that may restrain the response of SCs to muscle denervation. The present study is designed to answer this question, comparing the changes of SC numbers in tibialis anterior (TA) muscles from young (4 months) and old (24 months) WI/HicksCar rats after 2 months of denervation. Immunostaining with antibodies against M-cadherin and NCAM was used to detect and count the SCs. The results demonstrate that the percentages of both M-cadherin- and NCAM-positive SCs (SC/Fibers × 100) in control TA muscles from young rats (5.6 ± 0.5% and 1.4 ± 0.2%, respectively) are larger than those in old rats (2.3 ± 0.3% and 0.5 ± 0.1%, respectively). At the same time, in 2-month denervated TA muscles the percentages of M-cadherin and NCAM positive SC are increased and reach a level that is comparable between young (16.2 ± 0.9% and 7.5 ± 0.5%, respectively) and old (15.9 ± 0.7% and 10.1 ± 0.5%, respectively) rats. Based on these data, we suggest that aging does not repress the capacity of SC to become activated and grow in the response to muscle denervation.
S
On the other hand, results obtained in cross-age transplantation experiments showed that there are sufficient cellular reserves to allow both old and extremely old muscles to regenerate as well as young ones if they are both placed in comparable environments (Carlson and Faulkner 1989; Carlson et al. 2001). At the same time, it was demonstrated that even a reduced SC population in aged animals was sufficient to repair a damaged muscle to near control levels (Carlson and Faulkner 1996; Carlson et al. 2001). Furthermore, despite the fact that the proliferative response of SCs becomes retarded with aging, Grounds (1998) concluded that the overall regenerative capacity of these cells is not impaired in old muscles. Therefore, advanced age itself does not appear to be a key factor that limits the regenerative potential of SCs in senescent skeletal muscles under conditions in which reparative processes are triggered by muscle fiber death and degeneration.
Nevertheless, this conclusion is mainly based on the results of experiments in which the reparative response of SCs in aged skeletal muscle was initiated by the death of associated muscle fibers. However, in such circumstances, SCs might be stimulated by two factors: lack of suppressive influence from the plasmalemma of a viable muscle fiber (Bischoff 1990), and the presence of a mitogen released from degenerating muscle fibers (Bischoff 1986). Therefore, it is of interest to analyze the capacity of SCs within aged skeletal muscles to become activated under conditions that eliminate powerful cell-stimulating effects.
For three decades, it has been known that muscle denervation devoid of massive fiber death is able to stimulate the activation of SCs in young and adult animals (Hess and Rosner 1970; Ontell 1974; Hanzlikova et al. 1975; McGeachie and Allbrook 1978; Snow 1983). The first two months of denervation are the most crucial in SC reproduction (Viguie et al. 1997), and prolonged interruption of the nerve supply leads to progressive depletion of the SC pool in chronically denervated skeletal muscles (Dedkov et al. 2001). Nevertheless, no studies have yet tested whether advanced age itself may be a factor that suppresses the capacity of SCs to become activated in response to muscle denervation.
In the previous denervation experiments, the degree of SC activation and growth in skeletal muscles was analyzed by two attributes: the changes in absolute or relative number of SCs (Ontell 1974; Hanzlikova et al. 1975; Snow 1983; Viguie et al. 1997; Dedkov et al. 2001), and radioactive ([3H]-thymidine) or non-radioactive (5-bromo-2-deoxyuridine) labeling indices of SC nuclei, which are generally designed to estimate the number of SCs undergoing DNA synthesis and, consequently, proliferation (McGeachie and Allbrook 1978; Murray and Robbins 1982; Schmalbruch and Lewis 2000). However, until now, the prime characteristic that would actually indicate the growth of an SC population in denervated skeletal muscle remains the increased number of SCs.
SC numbers have been routinely counted under high magnification based on both morphological and topographical identification of these cells by use of the electron microscope (Hanzlikova et al. 1975; Snow 1983; Schmalbruch and Lewis 1994; Viguie et al. 1997; Dedkov et al. 2001). However, the practical matter of sample size permitted by electron microscopy has raised concerns about obtaining a statistically significant number of SCs for quantitative studies. Hence, the employment of a light microscopic method of SC identification, which would use low magnification to examine larger samples, has been considered more promising (Ontell 1974). Unfortunately, initial attempts to devise a technique for light microscopic identification of SCs were based on the use of non-specific cell markers that could also give grounds for a miscalculation.
It has been more recently discovered that the SCs of skeletal muscle from adult rodents express at least two distinct cell adhesion molecules on their surface; NCAM, [neural cell adhesion molecule (Covault and Sanes 1986)] and M-cadherin (Bornemann and Schmalbruch 1994; Irintchev et al. 1994). Accordingly, the application of antibodies against both proteins appears to be an appropriate method for specific identification of SCs under the light microscope. At this time, counts of either M-cadherin-positive (M-cad+) or NCAM-positive (NCAM+) SCs seem to be a reliable technique for assessing changes in the SC populations of both normal and denervated skeletal muscles.
The present study was designed to compare the responses of SCs from 4-month-old (young adult) and 24-month-old (old) rats to permanent denervation of skeletal muscles. The relative number of M-cad+ and NCAM+ SCs was taken as a characteristic to demonstrate a level of SC activation in tibialis anterior muscles after 2 months of motor denervation. As a result of this study, we demonstrated that advanced age did not restrain the capacity of SCs to become activated in response to muscle denervation.
Materials and Methods
Animals and Experimental Design
The study was conducted on eight 4-month-old (young) and six 24-month-old (old) rats of the WI/HicksCar strain. After ether anesthesia, the right sciatic nerve was surgically exposed high in the thigh and then ligated with silk in two places. The nerve was cut between the two sutures, and both stumps (proximal and distal) were implanted into muscle tissue as far away from each other as possible. The rats were treated with oral terramycin for 5 days after surgery. All operations and subsequent animal care were carried out in accordance with the guidelines of the Unit for Laboratory Animal Medicine at the University of Michigan. One and 2 months after the surgical procedures the tibialis anterior (TA) muscles were removed from both denervated and intact contralateral (control) legs of the rats, and all animals were sacrificed by an overdose of anesthetic.
Immunohistochemistry and Fluorescent Microscopy
Each denervated and control TA muscle was fixed at resting length in freshly prepared 2% paraformaldehyde in 0.1 M PBS for 24 hr at 4C and was then transversely cut in the mid-belly area. The samples were washed overnight in PBS and cryoprotected in a graded sucrose series at 4C. Muscle pieces oriented for transverse and longitudinal sectioning were placed in specimen molds containing TBS/Tissue Freezing Medium (Triangle Biomedical Sciences; Durham, NC) and were then quickly frozen in isopentane that had been pre-cooled by dry ice. Serial 8.0-μm sections were cut from each sample with a cryostat and mounted on warm glass slides. Before staining, the sections were washed in double-distilled water at room temperature (RT) and fixed in 100% methanol for 10 min at −20C. The slides were allowed to air-dry. The sections were then re-hydrated in PBS at RT, treated with 1% Triton X-100 for 5 min, washed in PBS, and then incubated with 20% normal goat serum for 10 min. The adjacent serial sections were double labeled with mixtures of different primary antibodies for 3 hr at 37C. Two pairs of antibodies were routinely used: (a) rabbit anti-NCAM affinity-purified polyclonal antibody (2.5 μg/ml; Chemicon International, Temecula, CA) and mouse anti-laminin B2 monoclonal antibody, clone D18 (undiluted supernatat; Developmental Studies Hybridoma Bank (DSHB), University of Iowa, Iowa City, IA) and (b) rabbit anti-M-cadherin affinity-purified polyclonal antibody [1:50; produced by Dr. Anton Wernig, Department of Physiology, University Bonn. The specificity of this antibody was previously characterized in the studies of Irintchev et al. (1994) and Rose et al. (1994)] and mouse anti-laminin B2 monoclonal antibody, clone D18. In addition, the combination of rabbit anti-M-cadherin polyclonal antibody and mouse anti-NCAM monoclonal antibody, clone AG1 (undiluted supernatant, DSHB, University of Iowa, Iowa City, IA) on a single section was used to establish the possible co-expression of NCAM and M-cadherin proteins in the same SCs. After staining with primary antibodies, the sections were washed in PBS at RT, incubated with 20% normal goat serum for 10 min, and then labeled with a mixture of FITC- and Cy3-conjugated goat anti-mouse and goat anti-rabbit secondary antibodies (Jackson ImmunoResearch Laboratories; West Chester, PA) for 45 min at RT. To acquire the most optimal result for SC detection in muscle fibers, the primary antibodies in each pair were in turn visualized using secondary antibody conjugated with FITC or Cy3, respectively. For control, omission of one or both primary antibodies was used. After incubation with secondary antibodies, the sections were rinsed in PBS, mounted in Vectashield mounting medium for fluorescence with DAPI (Vector Laboratories; Burlingame, CA) to counterstain the nuclei, and then cover-slipped. Observation of the sections was made with a Zeiss Axiophot-2 universal microscope (Carl Zeiss; Jena, Germany) equipped with Cy3, FITC, and UV filters and with differential interference contrast (DIC) optics. Fluorescence and DIC images were captured using a Zeiss Axiocam digital camera and figures were prepared from electronic images using Adobe Photoshop (Adobe Systems; San Jose, CA).
Quantitative and Statistical Analysis
Images from randomly selected areas of cross-sectioned in mid-belly control and 2-month denervated TA muscles (three of each muscle were used for young and old rats) were captured under the same magnification with a Zeiss Axiophot-2 universal microscope using a Zeiss Axiocam digital camera. Three discrete images of each examined area included the laminin-positive basal lamina of muscle fibers visualized with FITC, M-cad+ or NCAM+ SCs visualized with Cy3 and nuclei counterstained with DAPI were recorded using the proper filter for fluorescence. Three separate electronic images of the same microscopic field were transformed into a single composite figure using Adobe Photoshop. This technique makes it possible to clearly distinguish the M-cad+, or NCAM+ SCs, located beneath the basal laminae of muscle fibers (Figure 1). The numbers of muscle fibers (both associated and not associated with SCs) and M-cad+ (or NCAM+) SCs were calculated on each prepared figure. Only SC profiles cut through the nuclear region of the cell were used in our calculations. In total, M-cad+ (or NCAM+) SCs were collected in each muscle from a section area consisting of 1000 fiber profiles that altogether provided 3000 fiber profiles for both control and denervated muscles from young and old rats. The frequencies of both NCAM+ and M-cad+ SCs per muscle were expressed as a percentage of the ratio of the number of SCs to the number of fibers (associated and not associated with SCs). Quantitative data were analyzed with a two-way analysis of variance (ANOVA). The values are expressed as means ±SEM.
Results
At the beginning of our study, the appropriate antibody systems were selected to obtain the optimal result for detection of both M-cad+ and NCAM+ SCs with the fluorescent microscope. According to our tests, the use of secondary antibodies conjugated with Cy3 compared with the application of FITC-labeled secondary antibodies showed the best results for clear visualization of the sites at which a primary antibody binds to M-cadherin or NCAM proteins, which are expressed in SCs. The rabbit anti-NCAM polyclonal antibody was a more suitable marker for distinguishing a larger number of SCs in the skeletal muscle as compared with the mouse anti-NCAM monoclonal antibody (data not shown). At the same time, the use of a mouse anti-laminin monoclonal primary antibody that was visualized with a FITC-conjugated secondary antibody represented an appropriate antibody system for differentiating the muscle fiber basal lamina.
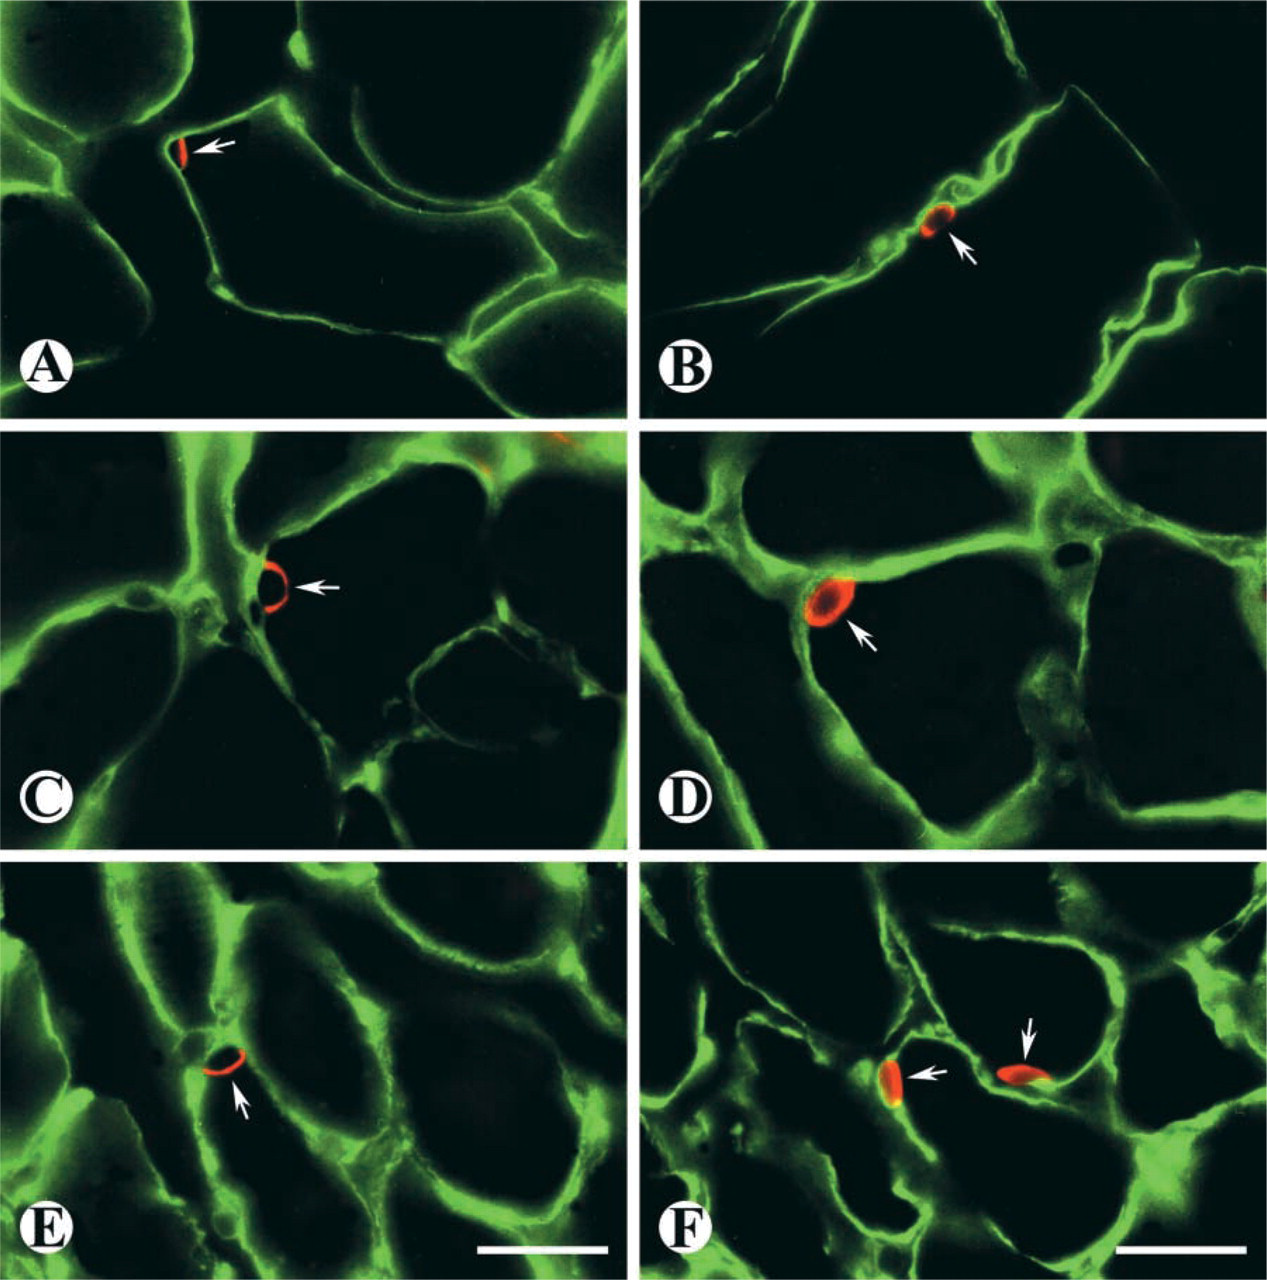
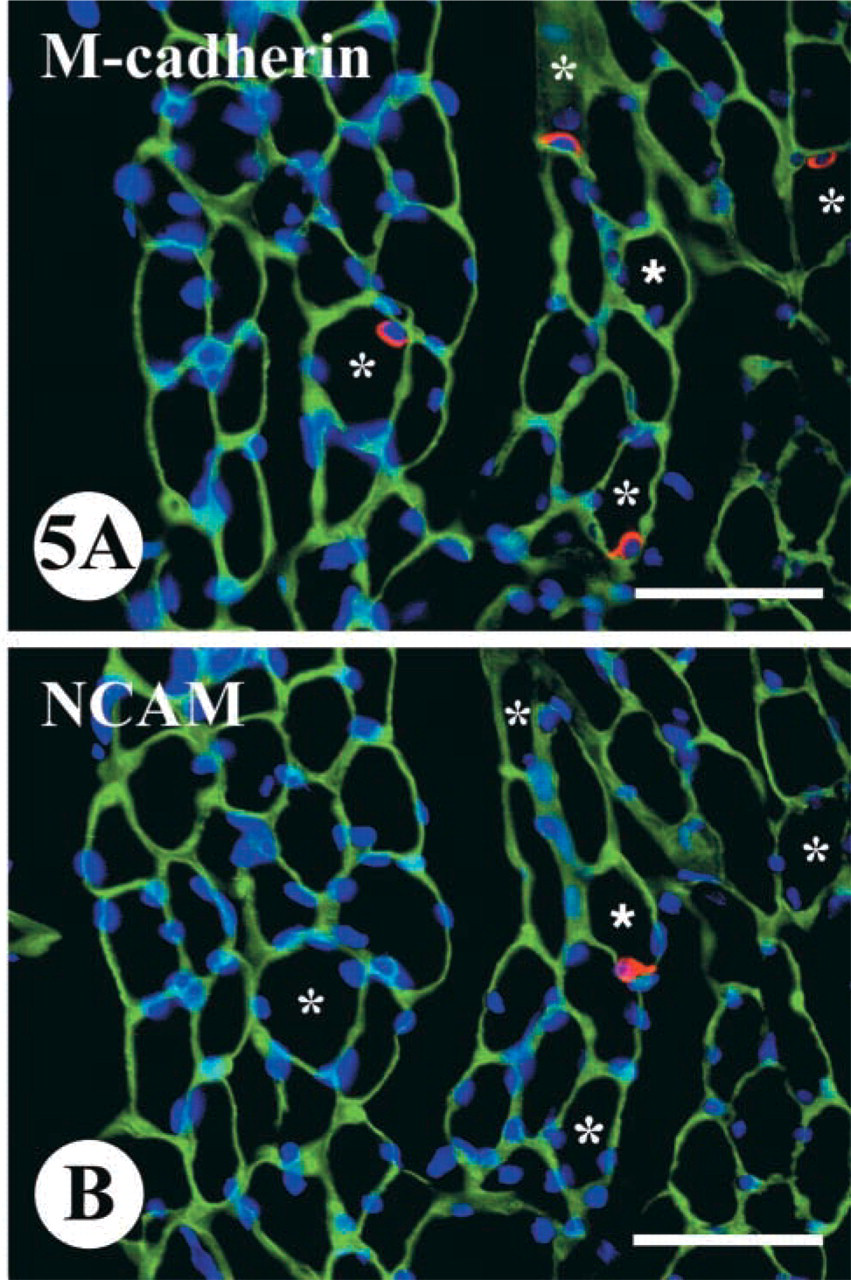
The results of immunostaining on cross-sections of both control and denervated skeletal muscles demonstrated that polyclonal primary antibodies against either M-cadherin or NCAM protein were able to distinguish SCs located beneath the basal lamina of normal and atrophied muscle fibers. The expression of M-cadherin protein was predominantly detected in the area where a SC interfaces with a muscle fiber (Figures 1A, 1C, and 1E), whereas NCAM protein was expressed around the cell surface and in the cytoplasm (Fig. 1B, 1D, and 1F).
Considering the fact that SCs undergo activation in response to muscle denervation, their shape and distribution of SCs in denervated muscle were examined prior to a quantitative analysis of their number. Immunostaining on longitudinal sections revealed that SCs labeled for either M-cadherin or NCAM were commonly irregularly situated on the surface of muscle fibers, in such a way that some part of a muscle fiber might demonstrate two or three neighboring SCs while another part of the same muscle fiber was absolutely devoid of them (Figure 2). The majority of SCs in denervated muscles displayed an enlarged nuclear region and one or two slender extensions of cytoplasm that stretched along the longitudinal axis of the muscle fiber, sometimes for a long distance (Figure 3).
Double-labeled immunofluorescent staining on cross-sections from TA muscles showing the expression of M-cadherin (
Some of the SCs in a denervated skeletal muscle co-expressed both M-cadherin and NCAM proteins. This was demonstrated by the use of double labeling with a rabbit anti-M-cadherin polyclonal antibody and a mouse anti-NCAM monoclonal antibody on the same section (Figure 4). However, the application of this co-staining technique for detection and counting of SCs has a major disadvantage because of its inability to appropriately label the muscle fiber basal lamina. The absence of laminin-positive fiber profiles on cross-sections of skeletal muscle made it extremely difficult to determine accurate topographical relationships between muscle fibers and other cells that might be stained for either M-cadherin or NCAM, or for both M-cadherin/NCAM proteins.
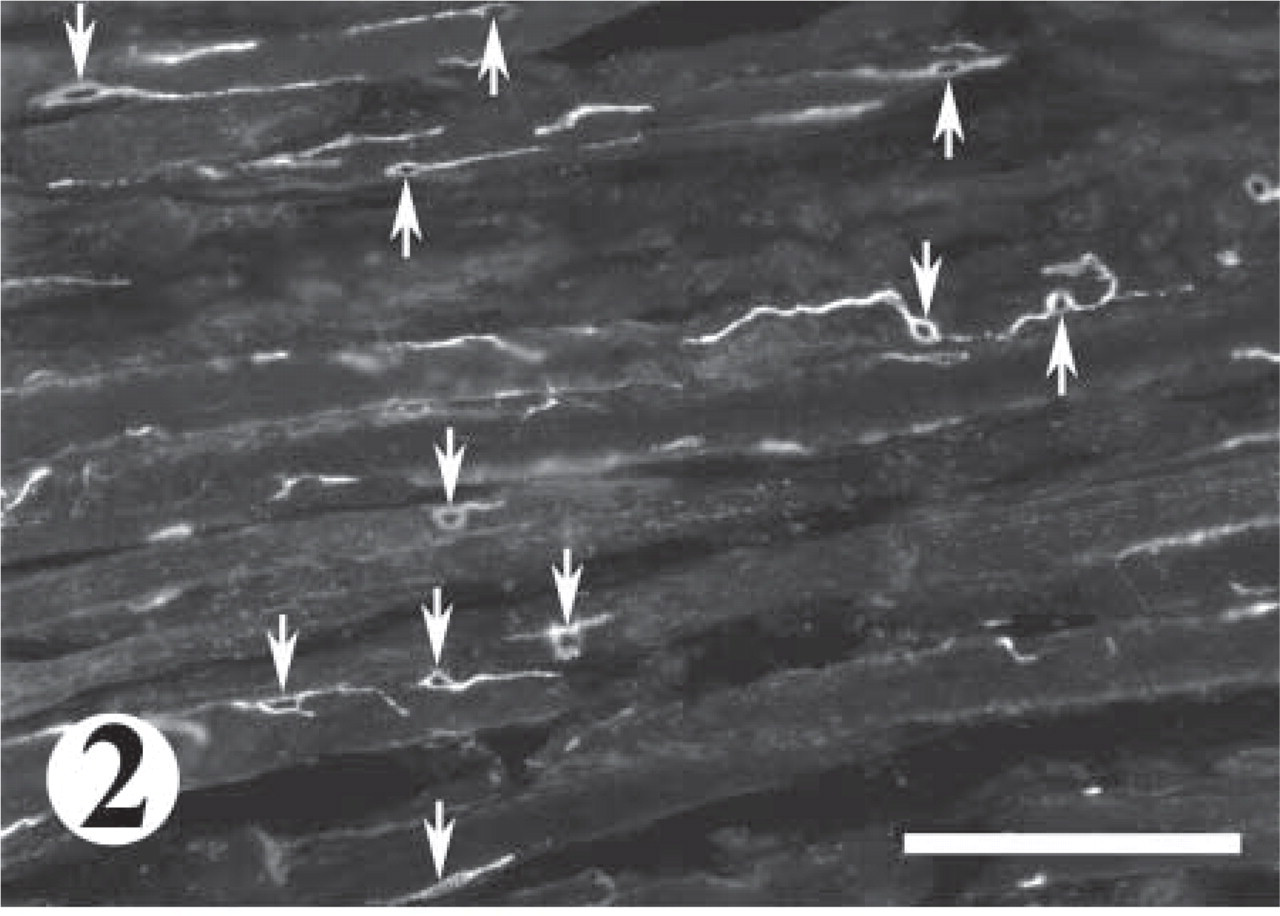
Immunofluorescent staining with an anti-M-cadherin antibody showing SC distribution (arrows) on the surface of fibers in 2-month denervated TA muscle from a 26-month-old rat. SCs demonstrate an irregular distribution along muscle fibers. Bar = 125 μm.
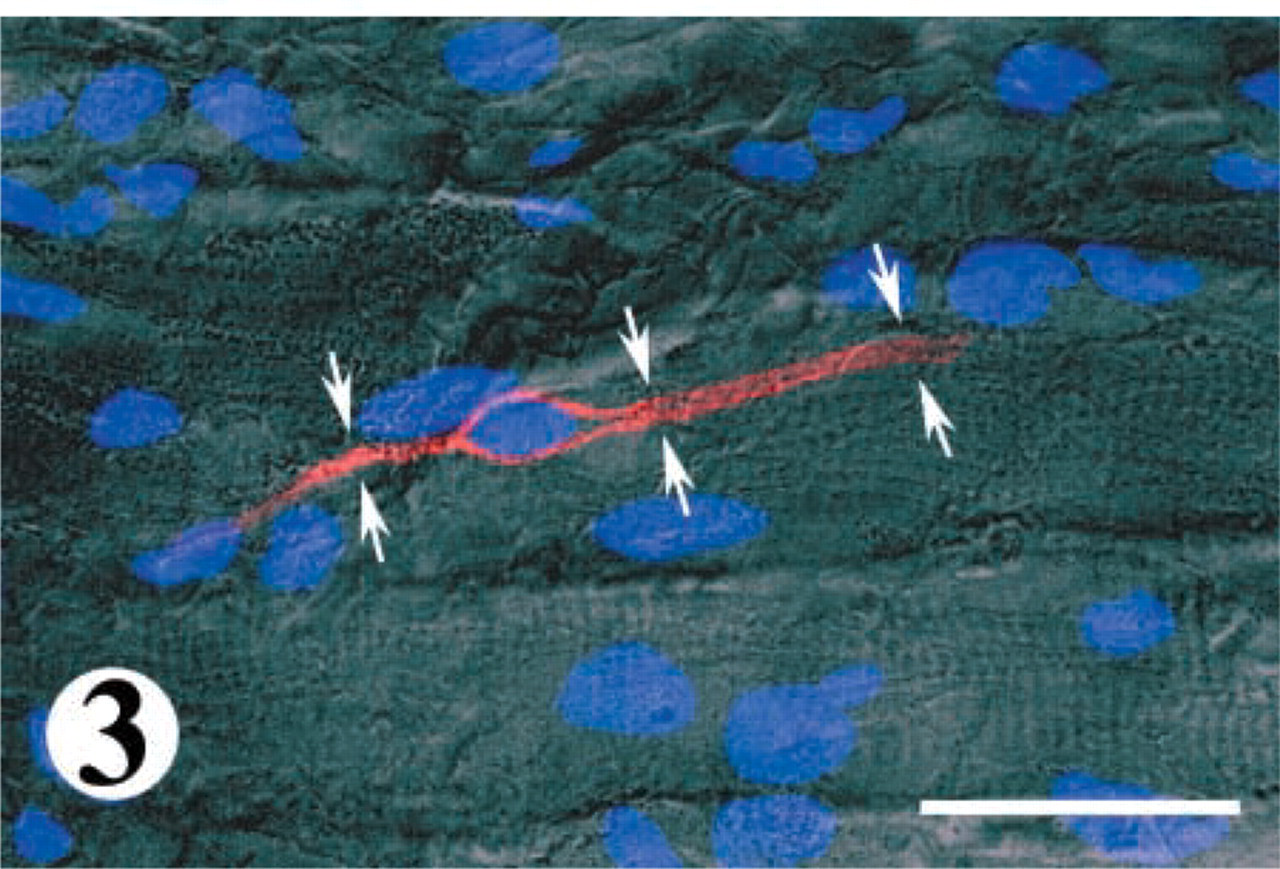
Immunofluorescent labeling demonstrates an M-cadherin-stained SC (red) stretched along the surface of a muscle fiber in 2-month denervated TA muscle from a 26-month-old rat. The underlying muscle fiber is visualized by differential interference contrast optics, whereas the nuclei of the muscle fibers and the SC are labeled with DAPI (blue). The SC has an enlarged nuclear region and two extensions of cytoplasm (arrows) that expand along the long axis of the fiber. Bar = 32 μm.
The fact that for calculating SC number laminin staining was mandatory on each muscle section labeled made it impossible to simultaneously immunostain the same section for both adhesion molecules. In addition, because SCs, particularly in a denervated muscle, stretch along fibers for a long distance, only SCs cut only through the nuclear region, as verified by the presence of a DAPI-labeled nucleus, were counted. These limitations made the separate application of anti-M-cadherin and anti-NCAM antibodies on adjacent serial cross-sections necessary. This technique at least allowed the discrete counting of the two “sub-populations” of SCs, which were stained positively for either M-cadherin or NCAM proteins in the same regions of the muscles (Figure 5).
The calculation of SC numbers, which was carried out on adjacent serial cross-sections, revealed that in both young rats and old rats the numbers of M-cad+ SCs were always larger than those of NCAM+ SCs for both control and denervated TA muscles (Figure 6). The percentages of M-cad+ SCs in control TA muscles from 6-month-old and 26-month-old rats were 5.6 ± 0.5% and 2.3 ± 0.3%, respectively, whereas the percentages of NCAM+ SCs in the same muscles were 1.4 ± 0.2% and 0.5 ± 0.1%, respectively. These results confirmed the reduction of the SC population in old compared with young muscle. In addition, these showed that the antibody against M-cadherin protein was able to detect a larger number of SCs than was the antibody against NCAM protein.
Despite the fact that the numbers of M-cad+ and NCAM+ SCs were always greater in young control muscles than those in old control muscles (Figure 6), 2 months after chronic denervation the number of SCs in both cell “subpopulations” demonstrated significant increases and reached a relatively similar level among young and old rats. Specifically, the percentages of M-cad+ and NCAM+ SCs in 2-month denervated TA muscles from 6-month-old rats were 16.2 ± 0.9% and 7.5±0.5%, respectively, compared to 15.9 ± 0.7% and 10.1 ± 0.5% of those cells, respectively, in 2-month denervated TA muscles from 26-month-old rats. Therefore, these data showed that advanced age did not restrain the capacity of SCs to become activated and to grow on living fibers in response to muscle denervation.
Discussion
In this study, we demonstrated that (a) the expression of M-cadherin protein allows one to recognize a larger number of SCs in control and denervated skeletal muscles from both young and old rats than does the expression of NCAM protein, (b) the number of M-cad+ and NCAM+ SCs in control TA muscle from young rats exceeds that in old rats, and (c) 2 months after permanent denervation of the TA, the muscle numbers of M-cad+ and, to a lesser degree, NCAM+ SCs achieve a significant increase to levels that are comparable between 6-month-old and 26-month-old rats.
Is It Proper to Use M-cadherin or NCAM Expression as a Solitary Marker of Quiescent and Activated Satellite Cells in Adult Murine Skeletal Muscle?
Since skeletal muscle SCs were discovered, the standard and most precise method for quantitative detection of these cells has been to electron microscopy (Hanzlikova et al. 1975; Snow 1977, 1983; Gibson and Schultz 1982, 1983; Schultz 1984; Schmalbruch and Lewis 1994; Viguie et al. 1997; Dedkov et al. 2001). On the other hand, the intensive experimental analyses of adult SCs that have been performed over the past two decades have uncovered a number of molecular markers that can be successfully applied to identify these cells (Hawke and Garry 2001). However, it has been demonstrated that only two of them, M-cadherin and NCAM, permitted topographical detection of both quiescent and activated SCs in muscle fibers (Covault and Sanes 1986; Bornemann and Schmalbruch 1994; Irintchev et al. 1994). In agreement with these results, our data show that, in both control and denervated TA muscles from young and old rats, immunostaining with antibodies against M-cadherin and NCAM allows a clear distinction between SCs and associated muscle fibers. Nevertheless, on the basis of published data, it appears that no studies have yet attempted to compare the effectiveness of M-cadherin and NCAM in calculating the number of SCs in adult rat skeletal muscle by light microscopy.
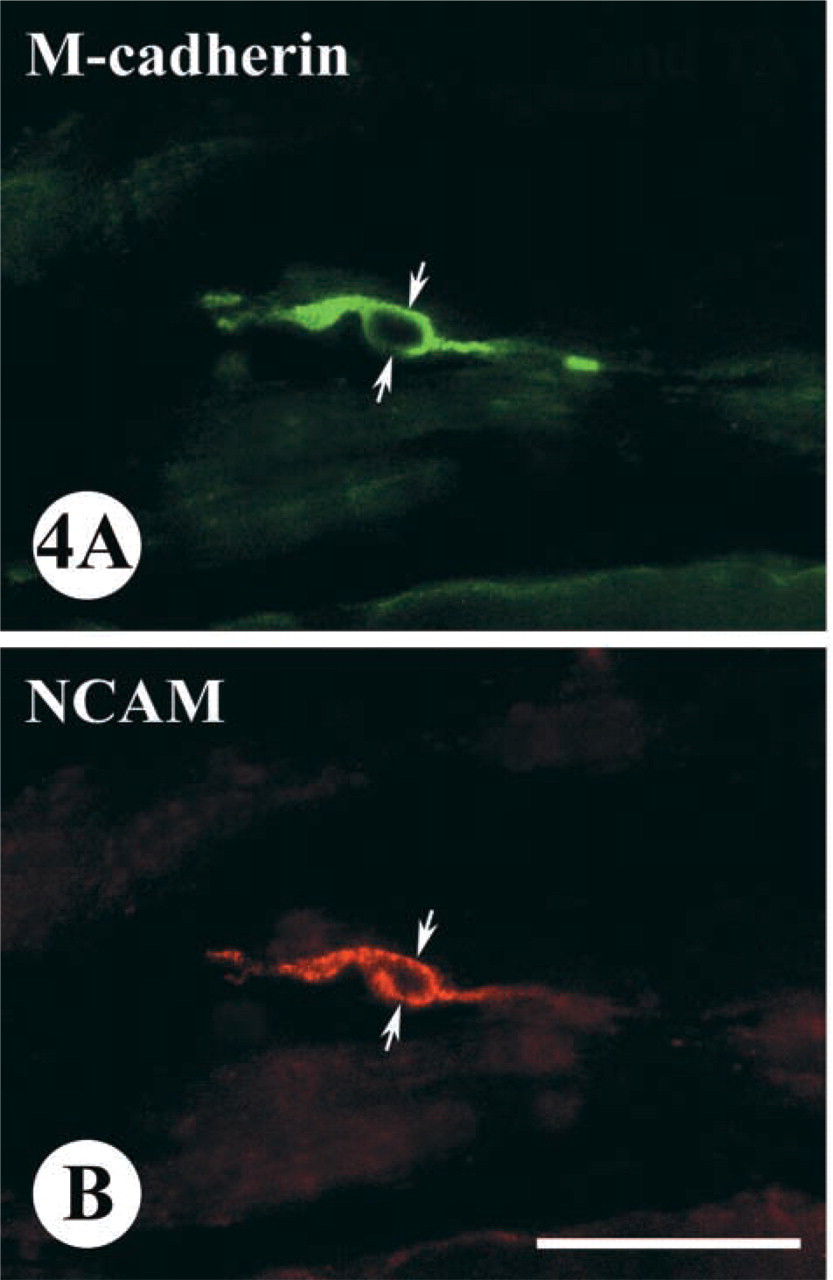
Immunofluorescent staining showing that the same SC (arrows), located on a longitudinally sectioned fiber from a 2-month denervated TA muscle of 26-month-old rat, can co-express both M-cadherin (
Immunofluorescent staining on two adjacent serial cross-sections from a 2-month denervated TA muscle of 26-month-old rat showing the separate labeling of SCs in the same microscopic area with antibodies against M-cadherin (
M-cadherin and NCAM are two distinct transmembrane glycoproteins that mediate homophilic cell adhesion in skeletal myogenesis (Covault and Sanes 1986; Cifuentes-Diaz et al. 1995). Experimental data suggest that Ca2+-dependent M-cadherin binding might be crucial for initiating a signal, transmitted from cell adhesion sites to cytoskeleton-associated proteins, to control the proper alignment of myoblasts during fusion (Kaufmann et al. 1999). At the same time, despite the fact that NCAM is also involved in myoblast interaction during fusion (Covault and Sanes 1986; Knudsen et al. 1990), it is considered that this Ca2+-independent molecule might also affect the efficiency of other adhesion proteins as well as cell mobility by modification of its own binding competence (Rutishauser et al. 1988).
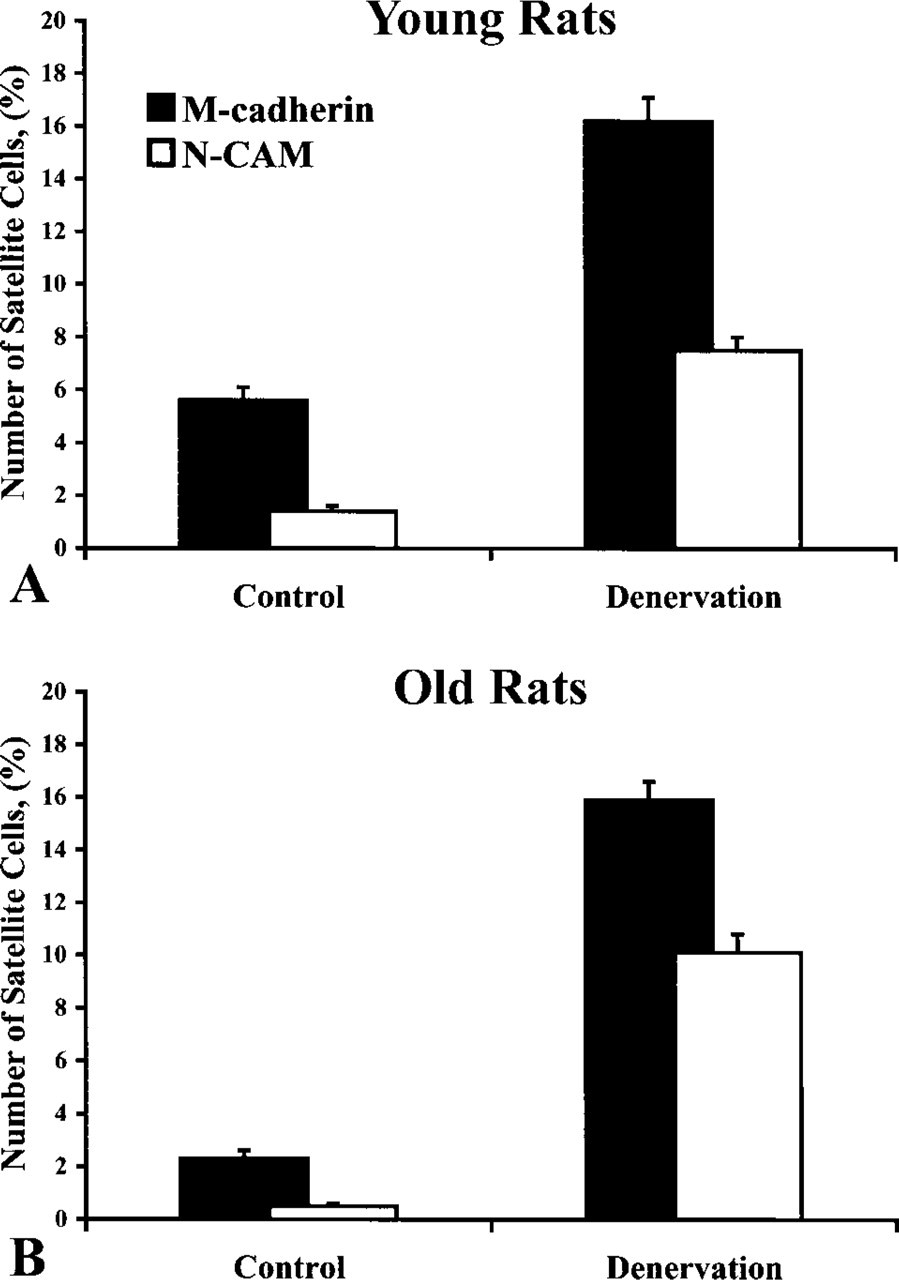
Comparison of percentages of M-cad+ and NCAM+ SCs (number of SCs/number of muscle fibers × 100) in control and 2-month denervated TA muscles from young (
Although the functions of M-cadherin, and NCAM, have been methodically studied in myotube formation in vitro and during myogenesis in vivo, their role in SCs of adult muscle remains poorly elucidated. This thought raised the question of whether each of these two cell adhesion molecules would identify the same quiescent and activated SCs in mature skeletal muscle.
According to our results and those of other authors (Irintchev et al. 1994), at least some SCs in denervated skeletal muscle co-express M-cadherin and NCAM proteins. Unfortunately, because of methodical difficulties, in our experiments we were not able to estimate the number of SCs that co-expressed both cell adhesion molecules. However, our data conclusively showed that the numbers of M-cad+ SCs always exceeded the number of NCAM+ SCs in both control and denervated skeletal muscles. These data suggest that at least some part of the SC population expresses exclusively M-cadherin, whereas other SCs may produce either both adhesion proteins or may express NCAM alone.
Ultrastructural evidence previously obtained in denervated skeletal muscles has demonstrated that some activated SCs could be deeply embedded in muscle fibers (Hanzlikova et al. 1975). In our study of 2-month denervated TA muscles, we have found that some NCAM+ cells (presumably activated SCs) were also deeply submerged into muscle fibers (Figure 7). We have never seen M-cad+ cells in a similar position. We speculate that such a circumstance might precede incorporation of such cell into a muscle fiber, but a complete understanding of this phenomenon remains to be elucidated. Fusion of SCs with denervated muscle fibers has been confirmed as a mechanism that allows the insertion of new myonuclei into atrophied fibers to compensate for a significant loss of myonuclei (Schmalbruch and Lewis 2000). However, the involvement of such submerged SCs in development of nascent daughter myotubes also cannot be ruled out (Snow 1983). Regardless of the further fate of these cells in a muscle fiber, it could be suggested that NCAM, rather than M-cadherin, most likely plays a key role in promoting the process of SC submerging.
Furthermore, taking into account the fact that NCAM on the surface of the cell is competent to alter cell mobility (Rutishauser et al. 1988), the appearance of the NCAM expression in SCs that were stretched out along the surface of the denervated fibers, but yet expressing M-cadherin, might be considered as a sign of their ability to migrate. Schultz et al. (1985) have shown that after muscle fiber damage the activated SCs are able to migrate along the muscle fibers to the area at which the regenerative process is occurring. As a result, SCs have an irregular pattern of distribution when cells are numerous in the area near the site of injury, whereas the undamaged part of a muscle fiber is almost devoid of SCs. These results agree with our data showing that, on fibers from 2-month denervated TA muscles, SCs were distributed irregularly, with frequent areas of accumulation and reduction. However, because the denervated muscles lack sites of actual fiber damage, the pattern of SC accumulation appears to be unsystematic throughout the muscle and might rather be dependent on the local microenvironment.
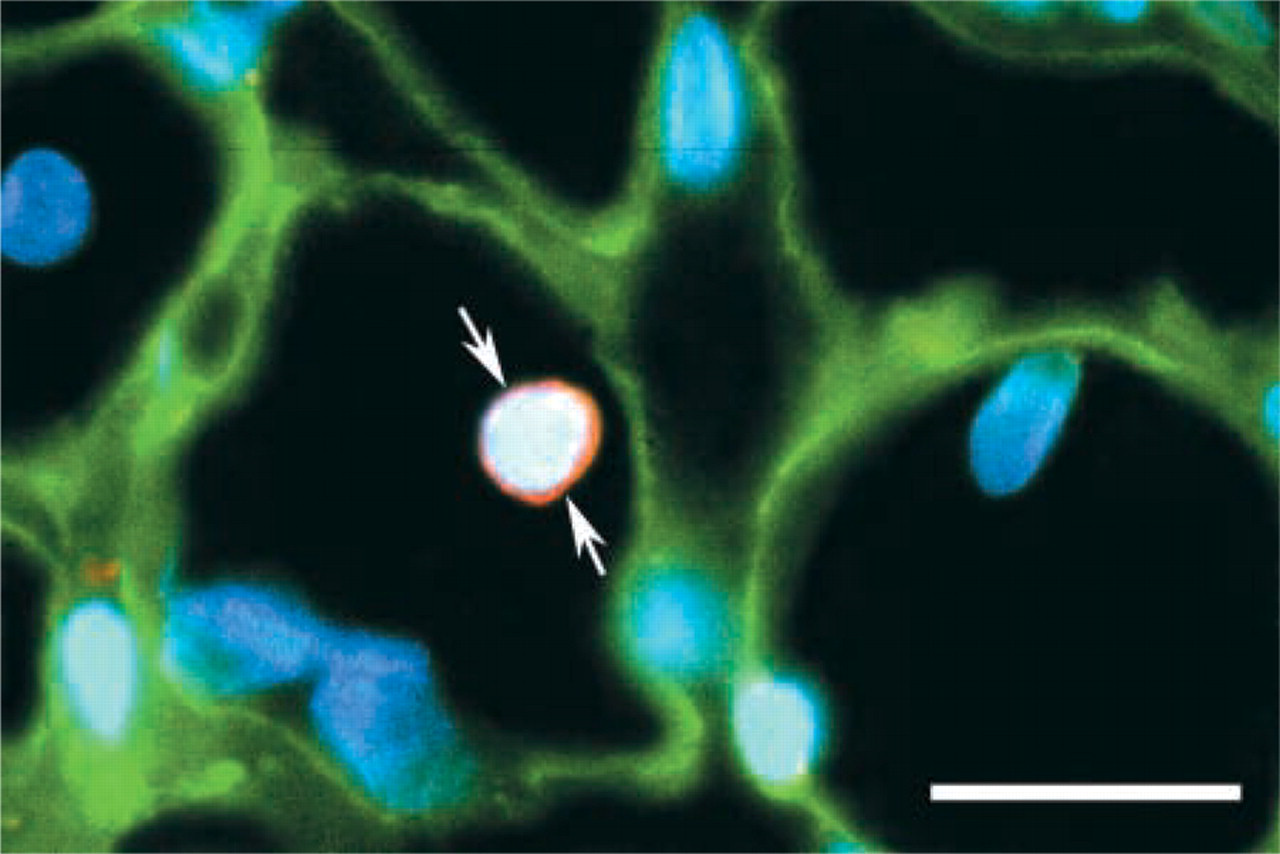
Double-label immunofluorescent staining showing an NCAM+ cell (arrows) deeply embedded in a muscle fiber outlined by a laminin-positive basal lamina (green) on a cross-section from a 2-month denervated TA muscle of a 26-month-old rat. Expression of N-CAM protein is seen as a red circle surrounding the part of a cell (presumably activated SC) that included a DAPI-positive nucleus (blue). Bar = 25 μm.
M-cadherin itself most likely contributes to the attachment of quiescent and activated SCs to the surface of muscle fibers, supporting their alignment along the longitudinal axis of normal and denervated fibers. This idea is supported by data of Irintchev et al. (1994), who showed in mice that, irrespective of whether SCs were quiescent, activated, or replicating, they expressed M-cadherin. Furthermore, according to results from our (Borisov et al. 2001) and other laboratories (Hess and Rosner 1970), activated SCs and newly formed daughter myotubes were always extended along the length of the associated maternal fibers in denervated muscle. In agreement with this result, our data demonstrating the elongated shape of M-cad+ SCs and their relatively linear accumulation in some areas of 2-month denervated fibers suggest that M-cadherin might assist SCs with proper alignment in the event that their fusion is necessary to develop a myotube. However, we did not detect newly formed oligonuclear myotubes positively stained for M-cadherin on longitudinal sections of 2-month denervated TA muscles.
Despite the fact that we could identify SCs that were positively stained with either anti-M-cadherin or NCAM antibodies, the question remains whether the entire SC population in normal and denervated skeletal muscles can be distinguished by this technique. It has been definitely shown by studies of Rantanen et al. (1995) and Molnar et al. (1996) that the population of SCs in rat skeletal muscle is not homogeneous and contains a few distinct cell subpopulations, which are different at least in the growth rate and the sequence of cell events such as proliferation and myogenic differentiation. This agrees with the original concept of Jones et al. (1990), who demonstrated that neonatal murine muscle cultured in vitro developed at least two distinct population of myogenic cells, those that expressed NCAM and were adherent to the dish and those that did not bear NCAM and remained in suspension. Furthermore, according to the analysis of mRNA expression in adult SCs collected on mouse muscle fibers that were plated in vitro, only a small fraction of examined quiescent cells expressed M-cadherin mRNA, whereas activated SCs in their majority showed the presence of M-cadherin mRNA transcripts (Cornelison and Wold 1997). At the same time, Kuschel et al. (1999) reported that a large portion of activated SCs associated with a rat muscle fiber plated in vitro remained unstained with anti-M-cadherin antibody even though they expressed myogenin. It should be noted, however, that Kuschel et al. (1999) used a different polyclonal antibody against M-cadherin from that used in our study. There is considerable variation in the percentage of SCs stained with different anti-M-cadherin antibodies. Therefore, the results of the above mentioned authors are not directly comparable with those of the present study. Nevertheless, it is becoming increasingly apparent that SCs are subdivided into subpopulations that could have different characteristics (Zammit and Beauchamp 2001). Although studies on single muscle fibers in the mouse indicate a near 100% staining of SCs with the M-cadherin antibody used in this study, similar investigations have not been published for the rat. Therefore, one cannot exclude the possibility that in this study not all SCs were detected with this antibody. On the basis of these data, it is possible that some portion of the quiescent and activated SCs in both control and denervated skeletal muscles of adult rats could remain unlabeled with either anti-M-cadherin or anti-NCAM antibody.
Taking into consideration our results and those of other authors, we suggest, that without further verification, immunostaining with antibodies against either M-cadherin or N-CAM cannot be assumed to be solitary markers to demonstrate the entire SC population in either normal or denervated skeletal muscles in the rat. We also propose that expression patterns of M-cadherin and NCAM proteins detected in an individual SC most likely reflect the momentary instant functional status in a cell that is dynamically able to change in response to novel local or systemic demands. Nevertheless, we suggest that the simultaneous examination of these cell adhesion proteins with the goal of SC counting would be justified if it is used to compare the number of M-cadherin and/or NCAM “cell subpopulations” calculated in different muscles under similar experimental conditions.
Does Aging Have a Profound Impact on a Population of SCs: from a Decline in Number to an Essential Alteration in Growth Potential?
According to our results and those of other authors (Snow 1977; Gibson and Schultz 1983), the number of SCs decreases in hindlimb skeletal muscles of aged rodents. Furthermore, data obtained in vitro provide clear confirmation that SCs harvested from skeletal muscles of young and old rats respond differently under similar conditions (Schultz and Lipton 1982; Dodson and Allen 1987; Chakravarthy et al. 2000). Despite these authors’ concurrence that in cultured rat SCs the latent period before mitoses (lag phase) becomes longer with aging, controversy concerning the rate of proliferation remains. In studies of Schultz and Lipton (1982) and Chakravarthy et al. (2000), a decline in the replication rate of SCs with increasing age was shown. In contrast, Dodson and Allen (1987) reported that the rate of proliferation in SCs did not appear to be depressed with advanced age, and these authors suggested that cells from old animals might rather be less responsive to agents that activate them. In agreement with the latter idea, data obtained on cultured SCs from mice of different ages also indicate the existence of progressive reduction in the rate of proliferation in response to different mitogens with aging (Mezzogiorno et al. 1993).
These results raise the question of whether the decrease of SCs is a reflection of the influence of a deteriorating microenvironment at the tissue and organ levels or if it may be the execution of an unavoidable age-associated intercellular program. In our study we made no attempts to methodically distinguish between these two options, but we specifically designed our experiments to compare the capacity of distinct SC populations from young and old rats to respond to a similar stimulus (2 months of denervation) under different (young and old) local and systemic environments.
Previous experimental results from our (reviewed by Carlson 1995, 1997) and other laboratories (reviewed by Grounds 1998) have demonstrated that, despite the fact that the proliferative response of SCs is retarded with aging, the intrinsic regenerative potential is not impaired in old muscles. It has been shown that when muscles were allowed to regenerate after bupivacaine injection in aged rats, they regained the force and muscle mass roughly equal to values in control muscles (Carlson et al. 2001). Furthermore, the results obtained during cross-age transplantation experiments (Carlson and Faulkner 1989; Carlson et al. 2001) have supported the view that factors inherent in the environment provided by the body of aged animals determine much of the success of regeneration, whereas the in vivo limit of intrinsic regenerative potential displays no differences between young and old muscles regenerating under the same conditions.
However, the regenerative response of SCs in these experiments has always occurred in response to the degeneration of muscle fibers that would be obligatorily associated with an enormous release of mitogens (Bischoff 1986). Therefore, the lack of restrained contacts with the plasmalemma of living muscle fibers (Bischoff 1990) and action of proliferation-stimulating mitogens released by skeletal muscle itself (Johnson and Allen 1993) might create a very favorable environment that stimulates comparable growth between young and old SC populations even in circumstances when a relatively small number of cells may survive.
The question has arisen what conditions may permit SCs to become activated in the absence of death of the associated muscle fibers. It has been clearly shown that SCs situated on living muscle fibers leave their quiescent status and become activated in response to muscle denervation (Hess and Rosner 1970; Ontell 1974; Hanzlikova et al. 1975; McGeachie and Allbrook 1978; Snow 1983; Viguie et al. 1997). However, these studies have generated some controversy concerning the timing of increases of the number of SCs in denervated muscles. Despite the fact that several authors reported a marked increase in the number of SCs during the first week following denervation (Hanzlikova et al. 1975; McGeachie and Allbrook 1978), a few other studies demonstrated such increases between 2 and 4 weeks after nerve transection (Ontell 1974; Snow 1983). These findings are in contrast to those obtained in our laboratory. The analysis by Viguie et al. (1997) demonstrated that the number of SCs reached its highest point 2 months after muscle denervation, followed by a steady reduction of the SC population (Dedkov et al. 2001). Considering our previous results and to examine and compare SC populations at the maximum peak of their activation, 2-month denervated muscle was chosen as the final point for analyses in our study.
The data of Ontell (1974) showed that in both 200-g (presumably young) and 800-g (presumably old) rats SC numbers increase above control levels 2 and 3 weeks after denervation and that the increase in the large (old) rats was relatively less than that in the small (young) rats. However, it is not certain that the data were collected at a period representing the maximal SC response to denervation. In contrast, our study showed that despite the fact that the numbers of M-cad+ NCAM+ SCs in old skeletal muscle were significantly smaller than those in young muscle, the markedly increased number of M-cad+ SCs in 2-month denervated muscles was almost similar between young and old rats. Concurrently, the number of NCAM+ SCs was also comparable between young and old muscles, but the absolute increase was less.
In conclusion, our data suggest that even though aging affects the number of SCs and probably their initial response to an activating stimulus, the intrinsic overall growth potential of the entire SC population after denervation remains comparable between young and old skeletal muscles, regardless of their local and systemic environment. These results on the reaction to denervation correspond to an earlier report by Carlson and Faulkner (1996) that, in the absence of innervation or in the presence of full innervation, the regenerative response of young and old rat limb muscles is comparable.
Footnotes
Acknowledgements
Supported by NIH grant PO1 AG-10821 and by a grant from the European Union.