
Abstract
In this study we investigated the relationship between thymidylate synthase (TS) protein expression, evaluated by Western blotting analysis and by immunohistochemistry (IHC), and growth rate in human colon xenograft tumors in nude mice. Human colon cancer cell lines were used to induce xenograft tumors and the tumor mass growth rate was calculated by measuring tumor size variations over time. TS 106 monoclonal antibody was used for both Western blotting and IHC TS detection. Tumor cell growth fraction was measured by Ki67/MIB1 immunolabeling and tumor cell growth rate by evaluating the mean nucleolar size in silver-stained sections. TS Western blotting values were related to tumor mass growth rate (p<0.001) and cell growth rate (p=0.002) but not to cell growth fraction (p=0.676). The degree of the IHC staining showed only a trend to be associated with TS protein expression measured on Western blotting, and was not related either to tumor mass growth or cell proliferation rate. Tumor xenografts were also characterized for TS promoter tandem repeat and p53 status. No relationship was observed between these variables and TS expression evaluated by both Western blotting and IHC analysis. Our results demonstrate that TS expression evaluated by Western blotting analysis is directly related to the tumor mass growth rate and question the use of the IHC approach to obtain precise quantitative information on TS expression in tumor samples.
Keywords
T
Precise quantification of TS can be carried out either by evaluating the enzyme catalytic activity, by the [3H]-FdUMP enzyme binding analysis, by RT-PCR, or by Western blotting. However, these methods are difficult to use in routine tumor pathology because tumor samples frequently contain normal cells and TS values are dependent on the purity of the samples. Moreover, these methods need fresh frozen tissue and can not be applied to archival material. These drawbacks can be surmounted by immunocytochemistry (IHC), which permits discrimination between tumor and normal cells and the use of routinely fixed and embedded tissue samples. On the other hand, quantitative IHC is far from being a reliable standardized procedure. TS quantification by IHC is performed by evaluating the intensity of the staining reaction, which is subject to variables linked to the staining reaction per se, to subjective operator evaluation, and to subjective comparative evaluation. Nevertheless, the IHC approach is still the most widely used method for TS quantification in routine tumor pathology.
In a previous study (Derenzini et al. in press), we have investigated the relationship among TS protein expression (evaluated by Western blotting analysis), TS enzyme activity, and cell kinetic parameters in human cancer cell lines. TS expression and activity appeared to be strictly related only to cell doubling time. The greater the TS values, the more rapid the cell proliferation rate. The aim of the present study was first to ascertain whether the relationship between TS expression (evaluated by Western blotting analysis) and the cell proliferation rate was also maintained in tumor masses growing in vivo and, second, to compare Western blotting with IHC data to obtain information on the reliability of IHC for TS quantitative evaluation. For this purpose we used, as an experimental model, human colon cancer xenografts growing in nude mice, whose doubling time was calculated by measuring the size variations of the tumor masses over time. We also evaluated the tumor cell growth fraction by the MIB1/Ki67 labeling index and the tumor cell growth rate by measuring the nucleolar size after silver staining specific for the nucleolar proteins. The TS 106 monoclonal antibody (MAb) was used for both Western blotting and IHC. Factors that might influence TS expression, such as TS promoter tandem repeat (Kawakami et al. 2001) and p53 status (Lee et al. 1997; Lenz et al. 1998), were also evaluated. We found that TS expression measured by Western blotting analysis was strictly related to the tumor mass growth rate and to the rapidity of cell proliferation. No significant relation was found between TS expression evaluated by IHC and tumor mass kinetic parameters, and between IHC and Western blotting TS values.
Materials and Methods
Cancer Cell Lines
Six established human colon cancer cell lines were used for the experiments: SW 480, SW 948 FL (a clone from SW 948; Dall'Olio et al. 1991), SW 620, Colo 205, SW 48, and LoVo. Cell lines were maintained as a monolayer culture in L15 medium (with the exception of LoVo cells, which were cultured in Ham's medium) supplemented with non-essential amino acids, 100 U/ml penicillin, 100 μg/ml streptomycin, and 10% FCS.
TS Tandem Repeat Polymorphism Determination
DNA was extracted from the six cancer cell lines used for the study by a salting out-based method (Lahiri et al. 1992). PCR was performed as described previously (Villafranca et al. 2001). Briefly, 200 μg of DNA from each cell line was subjected to the polymerase chain reaction (PCR). The reaction was performed in a volume of 50 μl with 40 pmol of each primer (forward 5'-GTG GCT CCT GCG TTT CCC CC-3’ and reverse 5'-CCA AGC TTC GCT CCG AGC CGG CCA CAG GCA TGG CGC GG-3'), 2.5 U Taq polymerase in the appropriate buffer furnished by the manufacturer (Takara Shuzo; Shiga, Japan), and 1.5 mM MgCl2. Thirty cycles (94C 1 min, 60C 1 min, 72C 2 min) of amplification were performed. PCR products were electrophoresed in a 3% agarose gel. Using this method, amplification bands of molecular weights of 220 and/or 248 bp are detected corresponding to alleles with two and three repeats, respectively.
Xenografting Procedure
The six cell lines were xenografted in female athymic Swiss mice (nu/nu genotype; Charles River, Calco, Italy). Monolayer cultured cells were detached by trypsinization, washed in PBS, and counted. Approximately 10 × 106 cells were resuspended in 0.1 ml PBS and inoculated intradermally in the flanks of mice. Three animals per cell line were inoculated. The mice were maintained under specific pathogen-free conditions at constant temperature (24–28C) and humidity (30–50%). Sterilized food and tapwater were given ad libitum. The animals were examined daily for tumor growth and sacrificed by cervical dislocation after general anesthesia. The protocols used were approved by the Local Animal Care Committee. Immediately after sacrifice the formed tumors were removed and cut in two. One half was frozen in liquid nitrogen and stored at −80C, and one half was fixed in 4% buffered formalin and routinely paraffin embedded. From each paraffin block five consecutive sections were cut, which were stained with hematoxylin and eosin, silver nitrate, and MAbs anti-TS, anti-Ki67, and anti-p53.
Evaluation of Tumor Mass Doubling Time
The tumor mass doubling times (DTs) were derived by calculating the tumor volume variations over a defined period of time and applying the formula proposed by Swhartz (1961):

where t is the time interval between measurements and V0 and V1 are the tumor mass volumes calculated 10 days after cancer cell inoculation and before sacrifice, respectively. The estimated volumes of the developing tumors were obtained by measuring the two main diameters with a caliber and applying the following formula:

Preparation of Protein Extracts for SDS-PAGE
Tumor specimens were treated by lysis buffer (KH2PO4 0.1 M, pH 7.4, 1% Igepal CA 630; Sigma Chemical, St Louis, MO) at 4C and immediately homogenized. Lysates were then incubated for 10 min on ice and then centrifuged for 45 min at 20,000 X g. The supernatant was then directly added to Laemmli buffer and boiled for 5 min. All steps were performed at 4C and all solutions contained a cocktail of complete protease inhibitors (Roche Diagnostics Italia; Milan, Italy).
Protein concentration of each lysate was assessed in triplicate by the Lowry method on aliquots collected before the adding of Laemmli buffer. Twenty micrograms of proteins from each sample were electrophoresed in 12.5% SDS-PAGE. Size standards from 200 to 29 kD, purchased from Sigma, were included in each gel. Polypeptides were electrotransferred to reinforced cellulose nitrate membranes (Hybond C Extra; Amersham, Poole, UK).
Immunoblotting
After electroblotting, filters were stained with Ponceau solution (Sigma) and then saturated with 5% non-fat dry milk, 1.5% BSA in TBS (20 mM Tris-HCl, 137 mM NaCl, pH 7.6)–0.1% Tween-20 (TBS = T; Sigma) for 1 hr at room temperature (RT). Nitrocellulose membranes were then rinsed in TBS-T and incubated for 1 hr at RT with MAb TS 106 (Chemicon International; Temecula, CA) diluted 1:400 and anti-β-actin (Santa Cruz Biotechnology; Santa Cruz, CA) diluted 1:100 in 5% non-fat dry milk, 1.5% BSA TBS-T. Membranes were washed once for 15 min and twice for 5 min in TBS-T to remove unbound antibody, and were incubated for 1 hr in the presence of horseradish peroxidase (HRP)-labeled anti-mouse antibody (Santa Cruz Biotechnology). After several washings, the HRP activity was detected using an Enhanced Chemoluminescence kit (Amersham) and was revealed on Hyperfilm ECL (Amersham). Autoradiographs were acquired with a scanner (DUOSCAN; Agfa, Morstel, Belgium) and signals quantified using a specific densitometric software (Gel-Pro analyzer, version 3.0; Media Cybernetics, Silver Spring, MD).
Immunohistochemistry
Four-μm-thick consecutive sections were cut from formalin-fixed, paraffin-embedded tissue blocks, collected on 3-ethoxy-aminoethyl-silane-treated slides, and allowed to dry overnight at 37C. Sections were waxed in xylene and rehydrated through graded concentrations of ethanol to distilled water. Sections were then immersed in 10 mM citrate buffer (pH 6.0) and processed in a thermostatic water bath for 40 min at 98C for antigen retrieval. Anti-TS (clone TS 106; Chemicon International, dilution 1:100) and anti-Ki67 (clone MIB1; BioGenex Laboratories, San Ramon, CA, dilution 1:100), and anti-p53 (clone BP53–12.1; BioGenex Laboratories, dilution 1:1800) MAbs were applied on three slides for each case, and incubations were performed overnight at RT in a humidified atmosphere. IHC was performed according to a slightly modified SABC (stretavidin-biotinperoxidase complex) method (Santini et al. 1993) with 3–3’ diaminobenzidine tetrahydrochloride (DAB) development and hematoxylin counterstaining. Negative control sections were stained without the primary antibody. TS immunostaining was evaluated independently by two observers (MD and CC) and scored from 1+ to 3+. Sample evaluation was blind in that the observers had no knowledge of any data about the tumor xenografts. MIB1 and p53 immunostaining was quantified by image cytometry using Cytometrica software (C & V; Bologna, Italy) as previously detailed (Faccioli et al. 1996), and was expressed as labeling index (LI).
Nucleolar Silver Staining and Morphometric Analysis
Nucleolar silver staining was performed according to the guidelines of the International Committee on AgNOR Quantitation (Treré 2000). Slides were removed from water to heat-resistant plastic Coplin jars, fully immersed in 10 mM sodium citrate buffer (pH 6.0), and autoclaved at 120C for 20 min. After cooling at RT in the sodium citrate buffer, slides were stained with silver for 11 min at 37C in the dark, using a solution of 1 volume 2% gelatin in 1% aqueous formic acid and 2 volumes of 50% silver nitrate. Sections were finally dehydrated and mounted in Canada balsam without any counterstaining. Morphometric analysis of silver-stained nucleolar areas was performed using a computer-assisted image analysis system (Image-Pro Plus, version 3.0.2; Media Cybernetics). At the end of each case, a basic statistical analysis of all recorded data was automatically obtained by the software. For each sample at least 200 cancer cells were evaluated.
Statistical Analysis
Correlations between variables were tested using the Spearman correlation analysis. Differences between groups were evaluated by ANOVA. A p value below 0.05 was considered significant.
Results
Colon Cancer Cell Lines
The six colon cancer cell lines used were characterized by different cell doubling times, ranging from 30 hr (SW 480 cell line) to 66 hr (SW 48 cell line). A previous study (Derenzini et al. in press) demonstrated that the TS expression of these cell lines, evaluated by Western blotting analysis, was inversely related to their doubling time.
TS Tandem Repeat Polymorphism
PCR analysis was performed to define TS promoter tandem repeat status. There is evidence that the homozygous status for triple repeat (3/3) in the promoter of the gene is associate with a higher TS protein expression than the heterozygous (2/3) and the homozygous (2/2) status for tandem repeats (Villafranca et al. 2001). According to the molecular weight of the PCR products, the following TS promoter tandem repeat genotypes were detected in the six studied cell lines: 2/2 in SW480, SW948, SW620, and Colo cell lines; 2/3 in SW48 and Lovo cell lines (Figure 1). TS protein expression of tumors derived from cell lines characterized by the 2/3 genotype was not higher than that of those derived from cell with 2/2 genotype.
Xenografts
Each of the six cell lines was inoculated intradermally in the flanks of three different animals, for a total number of 18 mice. One mouse (xenografted with LoVo cells) died before the development of a tumor mass. Therefore, only 17 xenografts were available for the study. In two cases (xenografted with SW 480 cells) the tumor tissue was sufficient only for protein extraction.
TS Protein Expression by Western Blotting Analysis
TS protein expression was determined by immunoblotting using MAb TS 106. This antibody is the most extensively used for the quantification of TS by Western blotting analysis, resulting in values strongly related to TS activity or TS mRNA expression (Johnston et al. 1991,1992,1995). The immunostaining resulted in specific bands corresponding to the expected molecular weight of 36 kD (Figure 2). The same filters used for TS detection were subsequently revealed using an anti-β-actin antibody in order to obtain a quantitative internal control (Figure 2). The integrated optical density (IOD) values were standardized by those of β-actin. The TS/β-actin values showed a fivefold variability ranging from 1052.6 in a xenograft derived from the SW 620 cell line to 200.6 in a xenograft derived from the SW 48 cell line. The mean TS/β-actin values of the seventeen tumors was 520.48 ± 285.78 (SD) (Table 1).
TS Protein Expression by IHC
TS protein expression was also determined by IHC on formalin-fixed, paraffin-embedded tissue sections, using the same MAb employed for immunoblotting (TS 106). As reported by Van Triest et al. (2000a), an antigen retrieval pretreatment in citrate buffer was necessary to obtain positive staining in all sections. After this retrieval step, immunostaining was localized in both the nuclear and the cytoplasmic compartment of cancer cells. The intensity of the staining reaction was evaluated independently by two observers and graded as low (1+), intermediate (2+), or high (3+). The interobserver agreement was very good because the results obtained by the two observers were totally superimposable: five tumors were 3+, six tumors 2+, and the remaining four tumors 1+ (Table 1). Figure 3 shows four histological sections immunostained with TS 106 MAbs. Figures 3a and 3b show the IHC TS staining of two xenografts characterized by a similar staining pattern but a markedly different growth rate. Note that, despite the relevant difference in the tumor mass DTs (13.78 days for the SW 48/a xenograft reported in Figure 3a and 2.88 days for the SW 480/a xenograft reported in Figure 3b), both histological sections present a very intense TS immunostaining (scored 3+), localized in both the nucleus and the cytoplasm of all cancer cells. The same discrepancy is evident in Figures 3c and 3d, in which two xenografts are shown, both characterized by less intense TS immunostaining (scored 1+) but a very different tumor mass DT (2.9 days for the SW 948 FL/c xenograft reported in Figure 3c and 8.43 days for the Colo/c xenograft reported in Figure 3d). In these two cases many cells appear negative, and the positive ones disclose only weak immunostaining, mainly localized in the nuclear compartment.
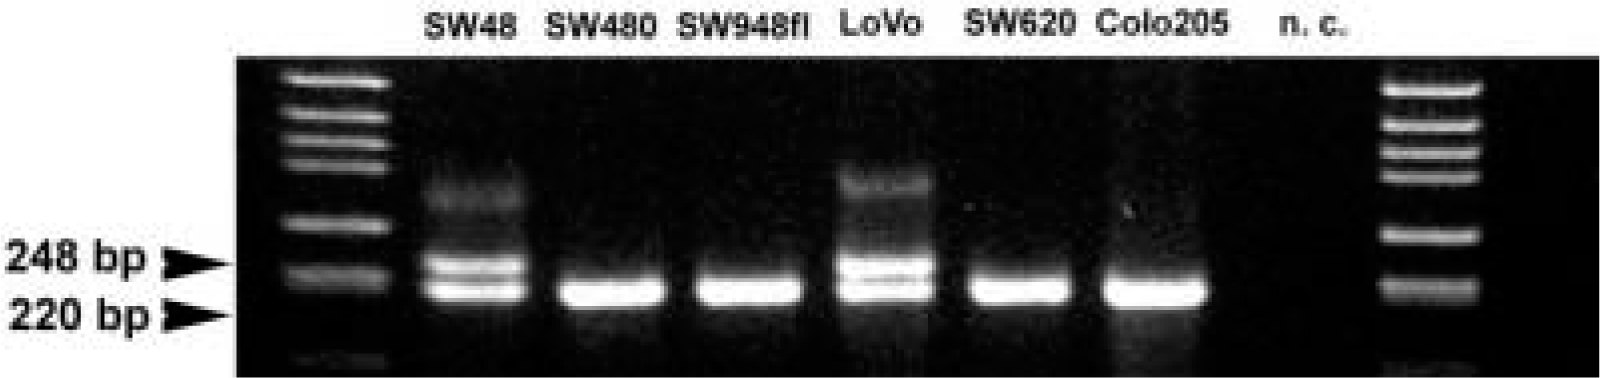
PCR analysis of the TS promoter tandem repeat status relative to the six colon cancer cell lines. The genotype was heterozygous 2/3 in SW48 and LoVo cell lines, and homozygous 2/2 in SW480, SW948 FL, SW 620, and Colo 205 cell lines. n.c., negative control.
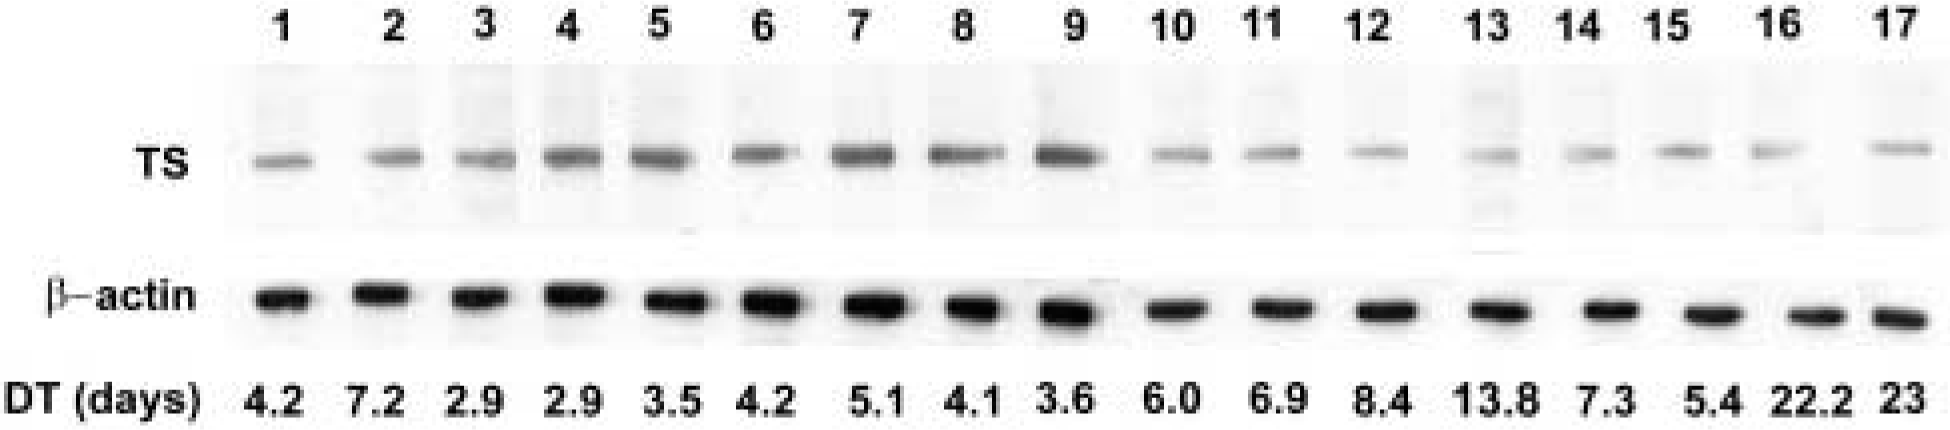
Western blots of xenografted tumor extracts originating from SW 948 FL (Lanes 1–3), SW 480 (Lanes 4–6), SW 620 (Lanes 7–9), Colo 205 (Lanes 10–12), SW 48 (Lanes 13–15), and LoVo (Lanes 16,17) cell lines, with TS 106 and β-actin antibodies. DT, doubling time.
Immunohistochemical TS values appeared not to be significantly related to TS protein expression evaluated by Western blotting analysis. The mean Western blotting TS value progressively decreased from the 3+ (666.26 ± 305.89; range 200.6–1008.4) to the 2+ (428.5 ± 313.69; range 222.69–1052.6) and 1+ (363.84 ± 137.30; range 202.17–523.28) groups. However, the differences between groups did not reach the statistical significant level of 5% (3+ vs 2+, F=1.60 and p=0.24; 2+ vs 1+, F=0.15 and p=0.71; 3+ vs 1+, F=3.30 and p=0.11).
Doubling time (DT), TS expression, Ki67 labeling index (LI), and nucleolar area in 17 tumor xenografts a
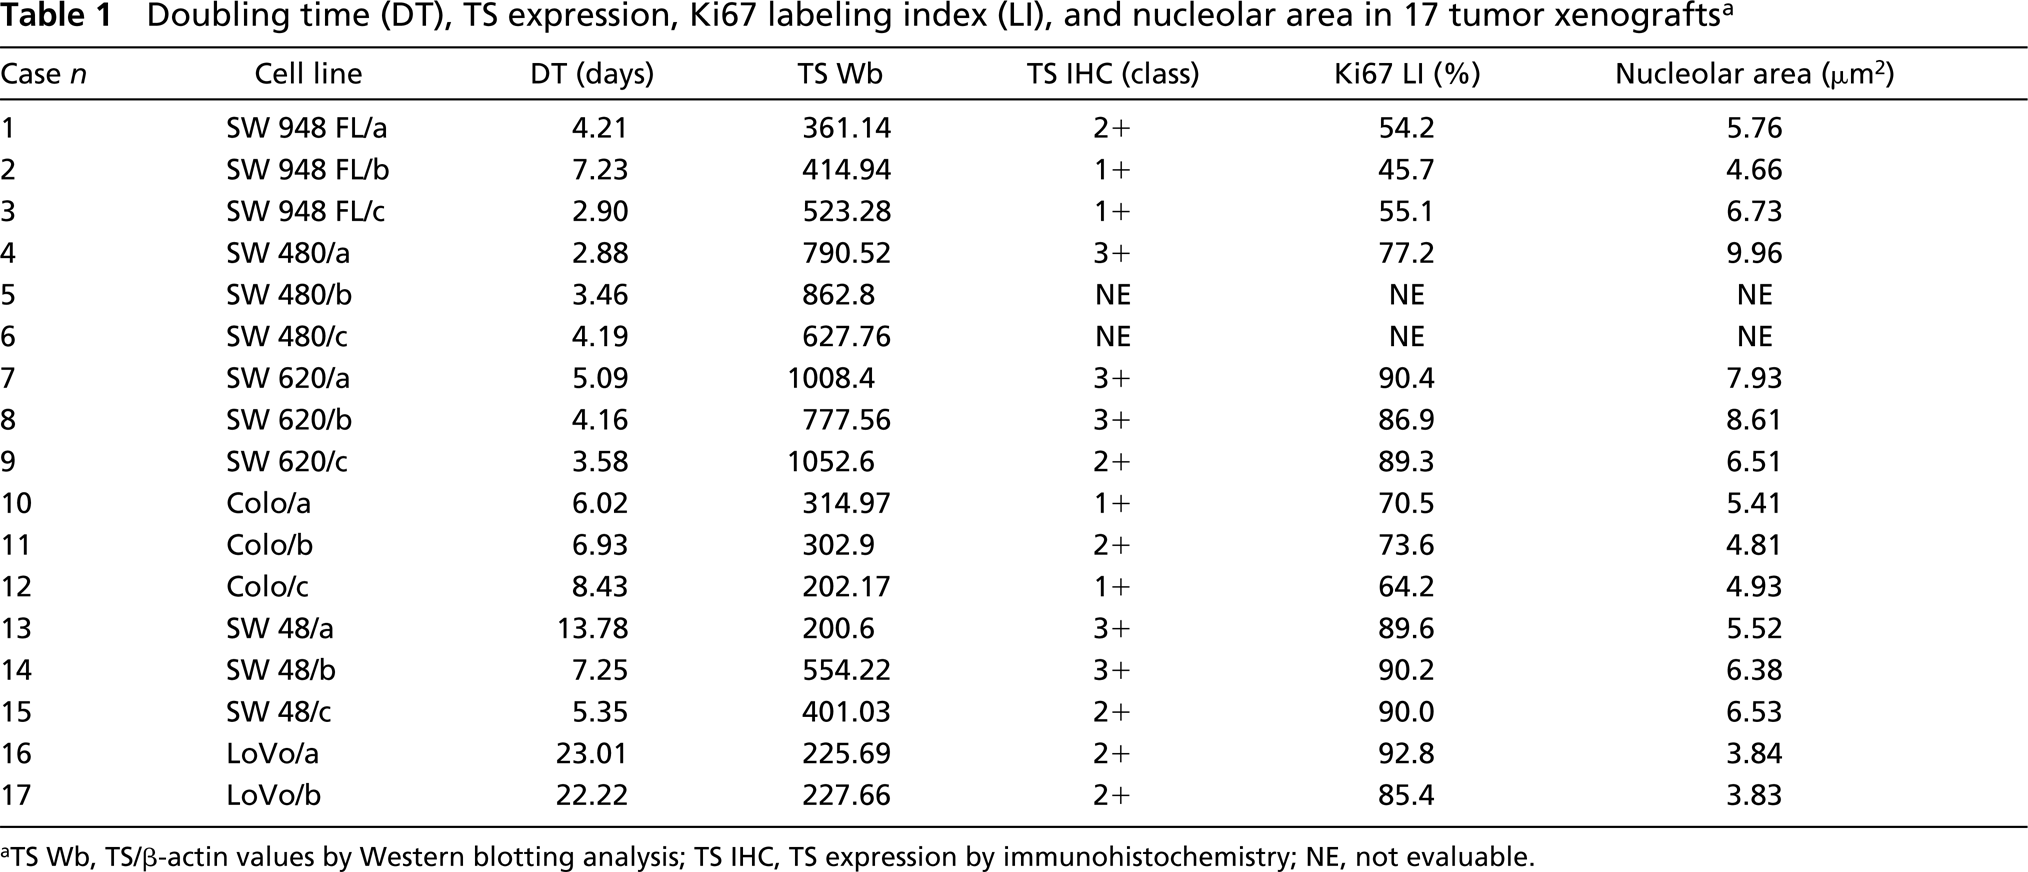
aTS Wb, TS/β-actin values by Western blotting analysis; TS IHC, TS expression by immunohistochemistry; NE, not evaluable.
p53 Immunohistochemistry
p53 LI ranged from 4.3% to 100%. The p53 variable was dichotomized according to a cut-off value of 10%, as reported by most of the studies in the literature (Esrig et al. 1994). Of the 17 xenograft tumors evaluated, five (corresponding to the xenografts derived from LoVo and SW48 cell lines) showed a p53 LI lower than 10%, while the remaining 12 (corresponding to the xenografts derived from SW 620, SW 948, Colo, and SW480 cell lines) presented nuclear accumulation of p53 (LI ≥10%). Xenograft tumors with p53 accumulation were characterized by a greater TS protein expression evaluated by Western blotting analysis than xenografts with no p53 accumulation (574.84 ± 308.77 vs 321.84 ± 152.54). However, the difference between the two groups was not statistically significant (p=0.111).
Evaluation of Cell Kinetic Parameters
The tumor mass DTs of the 17 xenografts had a mean value of 7.69 ± 6.21 (SD) days, ranging from 2.8 days in a xenograft derived from the SW 480 cell line to 23 days in a xenograft derived from the LoVo cell line. We have quantitatively evaluated the two main variables that influence the tumor mass growth rate: the percentage of cycling cells and the speed of cell proliferation. The assessment of cycling cells was obtained by MIB1 immunostaining. The MIB1 LIs of the 17 xenograft tumors had a mean value of 77 ± 15.7% (SD), ranging from 45.7% to 92.8% (Table 1). No significant correlation was found between the MIB1 LIs and the corresponding mass DTs (r=0.257; p=0.335) indicating that in this experimental model the tumor growth rate was independent on the number of cycling cells. Figure 4 shows the MIB1-immunostained sections of two xenografts characterized by the same growth rate (7.25 days for the SW 48/b xenograft reported in Figure 4a and 7.23 days for the SW 948 FL/b xenograft reported in Figure 4b) but by a different percentage a cycling cells (90.2% in the case reported in Figure 4a and 45.7% in the case reported in Figure 4b).
The rapidity of cell proliferation was evaluated by measuring the size of the silver-stained nucleoli, which represents a well-established marker of cell growth rate (Derenzini et al. 1998,2000). The mean nucleolar areas of the xenograft tumors ranged from 3.83 to 9.96 μm2 (Table 1), with a mean value of 6.09 ± 1.72 (SD) μm2. The mean nucleolar area values were found to be inversely related to the corresponding tumor mass DTs (r=-0.829; p<0.001). Figure 5 shows two histological sections selectively stained with silver from a slowly growing (LoVo/b xenograft, DT 23.01 days) and a rapidly growing (SW 948 FL/c xenograft, DT 2.9 days) tumor. Note the smaller silver-stained nucleolar area in the cells of the slowly growing tumor mass (Figure 5a) compared with that of the rapidly proliferating one (Figure 5b).
Correlation Among TS Expression and Kinetic Parameters
TS Western blotting values were found to significantly correlate with both the tumor mass DT and to the mean nucleolar size (r=-0.784; p<0.001 and r=0.743; p=0.002, respectively), whereas no significant correlation was demonstrated between TS values and MIB1-LIs (r=0.118; p=0.676).
TS immunostaining was not related to the tumor mass DT. The mean DT values were 6.63 ± 4.30 days in the 3+ group, 10.88 ± 9.16 days in the 2+ group, and 6.14 ± 2.38 days in the 1+ group, with the following ANOVA values: 3+ vs 2+, F=0.90 and p=0.37; 2+ vs 1+, F=0.99 and p=0.45; 3+ vs 1+, F=0.04 and p=0.84.
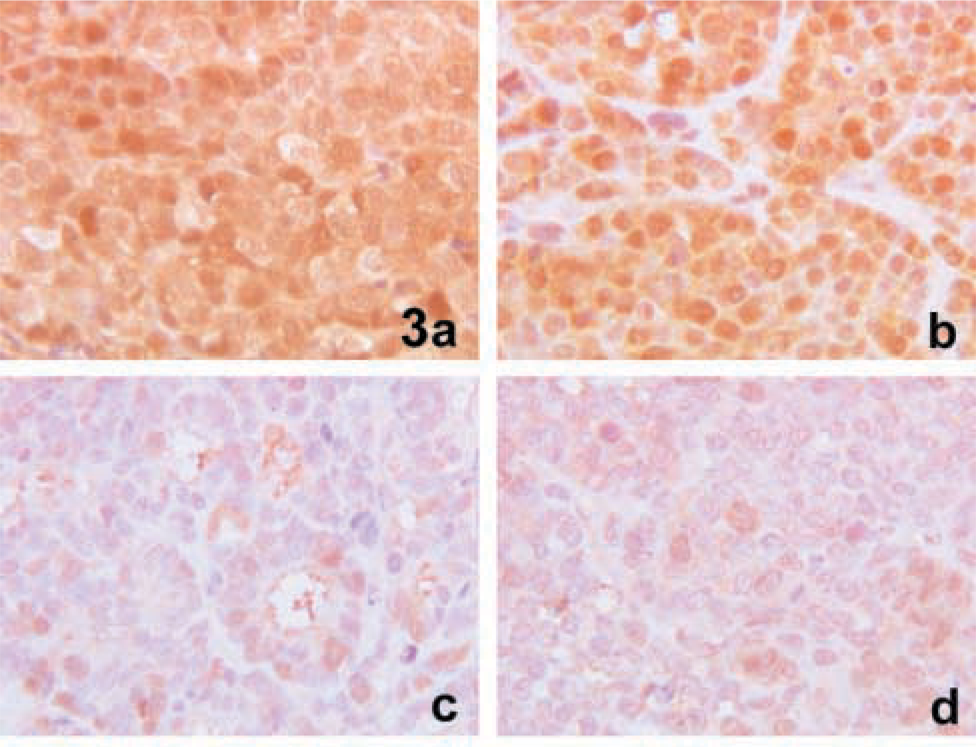
TS immunostaining of histological sections from four xenograft tumors. The cases in
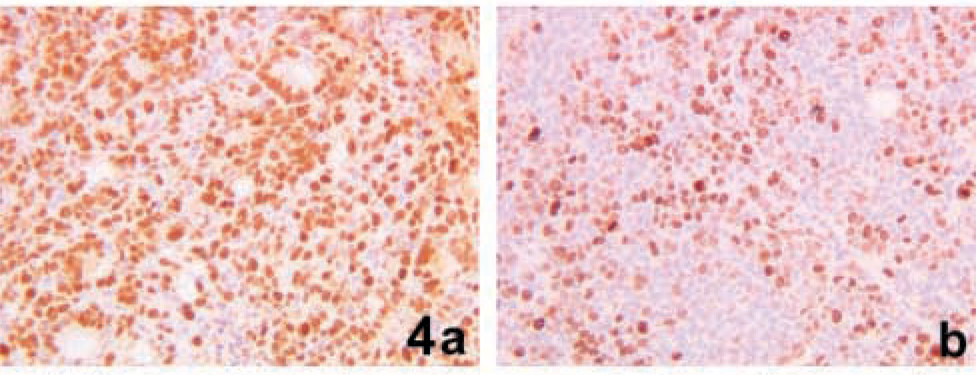
Immunohistochemical staining of Ki67 antigen in two xenograft tumors characterized by very similar tumor mass DTs. Note the greater MIB1-LI in
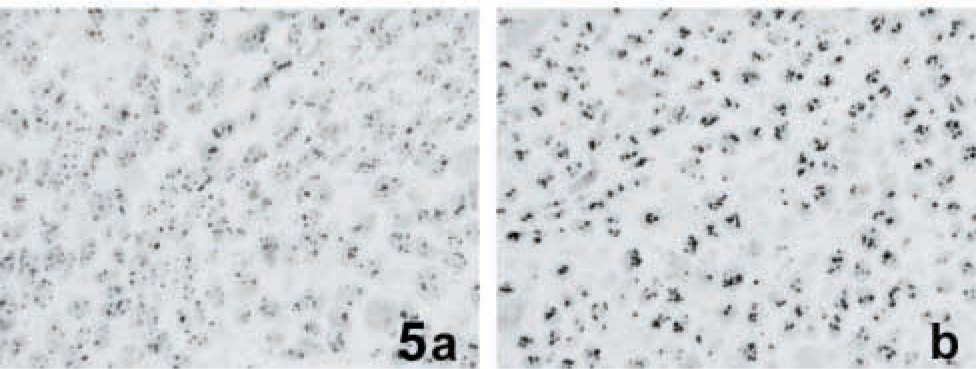
Silver-stained histological sections from two xenograft tumors characterized by a different growth rate. Cancer cells of the slowly proliferating tumor mass (
Discussion
The present results demonstrate that TS protein expression, as evaluated by Western blotting analysis, was related to the tumor mass growth rate in human colon carcinoma xenografts in nude mice. This relationship was not found when TS protein expression was evaluated by IHC. In both technical approaches, the specific TS 106 MAb was used.
Regarding the Western blotting analysis, the TS integrated OD values of the autoradiographic signals corrected by β-actin values directly correlated with the tumor mass growth rate. Because tumor mass growth rate depends mainly on the number of cycling cells (cell growth fraction) and the rapidity of cell proliferation (cell growth rate), we also investigated the relationship between TS protein expression and these two parameters of tumor mass growth rate. First, the possibility that the TS value variations observed in our experimental model might have been related to differences in the number of cycling cells was considered. Indeed, remarkable quantitative changes of TS protein expression have been reported to occur when non-proliferating cells are stimulated to proliferate or when proliferating cells are induced to pass from the exponential to the confluent growth phase (Navalgund et al. 1980). Measurement of the percentage of cycling cells in the histological sections of the tumors by the MIB1/Ki67 antibody suggested that TS protein expression was not greatly influenced by the cell growth fraction. Similar results were reported in a study carried out in primary and metastatic human colorectal cancers (Wong et al. 2001). Conversely, a good relationship was observed between TS protein expression and the speed of cell proliferation evaluated by measuring the nucleolar size in histological sections after selective silver staining for the AgNOR proteins. This staining procedure allows the nucleolar structures to be clearly visualized in routinely processed tissue samples (Ploton et al. 1986) and thus precisely measured by computer-assisted morphometric analysis. There is evidence that the nucleolar size represents a morphological parameter of the cell proliferation rate in continuously proliferating cells both in vitro (Derenzini et al. 1998) and in vivo (Derenzini et al. 2000). The greater the nucleolar size, the more rapid the cell proliferation. Our data demonstrated that TS expression was related to the nucleolar size in tumor samples (r=0.743; p=0.002). We can therefore conclude that TS protein expression evaluated by Western blotting analysis is related to the speed of cell proliferation in human cancer xenografts in nude mice. These data are consistent with previous results obtained in vitro using asynchronously growing human cancer cell lines of different origin. A strict relationship was observed between TS protein expression evaluated by Western blotting analysis and TS enzyme activity evaluated by catalytic assay. Both parameters were related to cell proliferation rate; the higher the TS protein expression and activity, the shorter the cell doubling time (Derenzini et al. in press).
The possibility has been considered that the different TS protein quantitative expression observed in the xenograft tumors might be related either to TS gene promoter status (Kawakami et al. 2001) or to p53 mutations (Lee et al. 1997; Lenz et al. 1998). Our results indicated that no relationship was present between TS gene promoter status and TS protein expression, probably because no cell line was characterized by the 3/3 homozygous genotype which is associated with higher TS protein expression levels (Kawakami et al. 2001). Regarding p53 status, we found that xenograft tumors with p53 accumulation (indicating a p53 gene mutation) exhibited a greater TS protein expression than those with no p53 accumulation (indicating a wild-type p53). However, the difference between the two groups was not statistically significant.
The demonstrated strict relation between TS protein expression, as evaluated by Western blotting analysis, and cell proliferation rate enabled us to use the human colon cancer xenografts, whose growth rate was precisely measured, for assessing the reliability of IHC to obtain information on TS protein expression in tissue sections. TS IHC analysis is the method most commonly used for the evaluation of TS expression in routine tumor pathology to obtain information on the prognosis of tumor disease and, in the case of gastrointestinal cancers, indication of clinical response to 5-FU-based chemotherapy. However, contradictory results on the relationship between TS expression, evaluated by IHC, and tumor prognosis and response to chemotherapy have been produced on the same type of cancer lesions (Van Triest and Peters 1999; Tsujitani et al. 2000; Choi et al. 2001; Allegra et al. 2002; Edler et al. 2002). Paraffin-embedded tissue sections immunostained with the TS 106 MAb showed a highly variable intensity of the staining reaction in the 15 tumors examined, five exhibiting a high, six an intermediate, and four a low intensity. TS immunostaining was reproducible without interobserver variability regarding the staining intensity of tumor sections within the high, intermediate, and low intensity groups. No statistically significant difference was observed between the TS protein expression evaluated by Western blotting analysis and the intensity degree of the staining reaction of the three groups, even if the mean TS Western blotting value of the three groups progressively decreased from the most to the least intensely stained group, indicating a trend for the two parameters to be associated. This does not exclude the possibility that great differences in quantitative TS expression may be detected by both IHC and Western blotting analysis, as has been reported to occur in 5-FU-sensitive and -resistant HS30 colon carcinoma cell lines (Johnston et al. 1991). The intensity of the staining reaction was also not related to the DT of the tumor masses. The absence of a significant relationship between TS immunostaining intensity and TS Western blotting values may be due to the small number of samples analyzed in the present experiments. On the other hand, it is worth noting that in the same number of samples TS Western blotting values were linearly related to the tumor mass growth rate. Our observations are consistent with those reported by Van Triest et al. (2000b) on the relationship between TS IHC values and enzyme levels in cancer tissue demonstrating that in 32 patients with colon cancer the relationship only tended to be significant (p=0.07). Moreover, other studies, carried out in a larger series of cancer lesions, failed to demonstrate a correlation between TS expression evaluated by IHC examination and either the mRNA expression or the enzymatic activity of TS (Fujiwaki et al. 2000; Miyamoto et al. 2001).
Footnotes
Acknowledgements
Supported by grants from the Ministero della Ricerca Scientifica e Tecnologica (MURST) 40% and 60%, Pallotti's Legacy for Cancer Research, and University of Bologna (funds for selected research topics).