
Abstract
Tumor necrosis factor-α (TNFα) induces apoptosis in hepatocytes only under transcriptional arrest induced by galactosamine (GalN). In this study we demonstrated the shuttle of the transcription factor NFκB (nuclear factor-kappa B) in the liver tissue of mice within 30 min-4.5 hr hours after GalN/TNFα treatment. NFκB translocation from cytoplasm to the nucleus is initiated by its separation from the inhibitory IκB proteins which include lIκBα, IκBβ, and IκB∊. Thirty minutes after GalN/TNFα administration, NFκBp65 in hepatocellular nuclei becomes increasingly detectable and reaches its highest level after 2.5 hr. Then export back into cytoplasm begins but, surprisingly, approximately 30% of NFκB remains in the nuclear fraction and appears as an immunoprecipitate in the nuclei of apoptotic hepatocytes. Non-apoptotic hepatocytes do not show any reaction product in the nuclei 4.5 hr after treatment. Correspondingly, the amount of dissociated IκBβ decreases in the cytoplasm up to 2.5 hr and increases again afterwards, although it does not reach the level of the control samples. No evidence of IκBβ in the nuclei was found either immunocytochemically or biochemically. Caspase-3 activity, which is responsible for apoptosis, increases significantly after 3.5 hr. At that time, apoptotic hepatocytes can occasionally be observed and, 4.5 hr after GalN/TNFα treatment, constitute approximately 30% of the hepatocytes.
T
After injection of TNFα, apoptotic liver cell death is observed only under transcriptional blockade (Leist et al. 1995) because NFκB would also activate the transcription of genes that encode cytoprotective proteins (Beg and Baltimore 1996; Chu et al. 1997; Wang et al. 1998; Schümann and Tiegs 1999). In contrast to the transcriptional blockade induced immediately after GalN injection, there is a time lag of approximately 2 hr until protein synthesis is suppressed in the liver (Leist et al. 1995). After injection of GalN or TNFα, neither specific DNA fragmentation (Leist et al. 1995) nor any morphological alteration in mitochondria and nucleus can be observed (Angermüller et al. 1998).
The decrease in protein synthesis implies that apoptosis is caused by molecules that exist in an inactive form in the cell, and that death-triggering receptors such as TNF-R1 can activate this latent mechanism through a protein interaction cascade (Wallach 1997). The family of cysteine aspartate-specific proteases, termed caspases, is involved in this event (Cohen 1997). Caspases are single-chain precursors containing an NH2-terminal pro-domain together with one large (∼20 kD), and one small subunit (∼10 kD). Activation involves proteolytic cleavage into subunits that form heterotetramers with two large and two small subunits (Cohen 1997; Thornberry and Lazebnik 1998; Salvesen and Dixit 1999). Most activated caspases can process their own and other caspase zymogens. Distinct members of the caspase family are involved in either the initiation or the execution phase of apoptotic cell death. Initiator caspases are caspase-8 and caspase-9. Clustering of the death receptor TNF-R1 at the cell surface activates the initiator caspase-8 (Salvesen and Dixit 1999). Initiator caspase-9 is activated by the formation of the Apaf-1/caspase-9 complex (apoptotic protease activating factor-1) in the presence of dATP and cytochrome c, which is released from mitochondria into the cytoplasm (Liu et al. 1996; Li et al. 1997; Zou et al. 1997; Green 1998). Activated initiator caspases stimulate the executioner caspase-3 (Stennicke et al. 1998), sometimes also caspase-7 and caspase-6 (Salvesen and Dixit 1999). Caspase-3 cleaves polypeptides that are involved in genome function such as poly(ADP)ribose polymerase, DNA-dependent protein kinase, and ribonucleoproteins, and it cleaves proteins that are involved in regulatory functions of the cell cycle (Nicholson et al. 1995; Cohen 1997; Enari et al. 1998).
The purpose of this study was to investigate the shuttle of NFκB up to the time when multiple apoptotic hepatocytes can be demonstrated after injection of TNFα into GalN-sensitized mice. The corresponding decrease and increase of IκBβ, which belongs to the inhibitor IκB proteins of NFκB, was examined. Furthermore, we investigated whether the first appearance of apoptotic hepatocytes corresponds to the significant increase of caspase-3 activity.
Materials and Methods
Recombinant murine TNFα was generously provided by Dr. G.R. Adolf (Boehringer Institute; Vienna, Austria).
Animals
This study was performed in compliance with the German Animal Protection Law under a permit issued by the state government (Karlsruhe, Germany). Male BALB/c mice (∼25 g) obtained from the animal facility of Charles River Laboratories (Sulzfeld, Germany) were kept on a standard laboratory diet with free access to water. Food was withdrawn 16 hr before the beginning of the experiments.
GalN (700 mg/kg) (Roth Chemicals; Karlsruhe, Germany) was given IP in a volume of 200 μl saline. Recombinant murine TNFα (5 μg/kg) was injected into the tail vein in a volume of 300 μl saline containing 0.1% HSA 15 min after GalN administration. Injection of TNFα alone or GalN alone served as a negative control for the induction of apoptosis. The mice were anesthetized IP by xylazine hydrochloride 10 mg/kg (Rompun 2%; Bayer, Leverkusen, Germany) and ketamine hydrochloride 200 mg/kg (Ketamine 10%; WDT, Garbsen, Germany). Livers were harvested 0.5 hr, 1.5 hr, 2.5 hr, 3.5 hr, or 4.5 hr after treatment.
Fixation and Embedding
For immunohistochemical studies, the livers were fixed via the portal vein with a fixative containing 4% paraformaldehyde in 100 mM Pipes (piperazine-N,N'-bis [2-ethanesulfonic acid]) buffer at a pH value of 7.4 for 5 min. For light and electron microscopic studies, the livers were fixed with 0.25% glutaraldehyde in 100 mM Pipes buffer containing 2% sucrose at a pH value of 7.4 for 5 min. Fifty-μm sections of the fixed liver were postfixed with aqueous osmium tetroxide, dehydrated in graded ethanols, and embedded in Epon 812. LR White-embedded tissue did not obtain a postfixation.
Immunohistochemistry
Five-μm sections were obtained from paraffin-embedded blocks. Two commercial polyclonal antibodies were used: anti-NFκBp65 (goat clone C-20; Santa Cruz Biotechnology; Santa Cruz, CA) and anti-IκBβ (rabbit clone Ab-1; Oncogene Research, Boston, MA). The best results were obtained with heat pretreatment in an electric pressure cooker set containing 10 mM sodium citrate buffer, pH 6, for 2 min. After the endogenous peroxidase was quenched with 3% aqueous H2O2, sections were transferred to a protein blocking serum for 1 hr, followed by incubation in a humid chamber at 4C overnight with (a) anti-NFκB p65 diluted 1:500 or (b) anti-IκBβ diluted 1:200. For visualization of NFκB, sections were incubated with a biotinylated secondary antibody donkey anti-goat IgG complex (Santa Cruz Biotechnology) diluted 1:20 for 30 min. For visualization of IκBβ, sections were incubated with HRP-conjugated goat anti-rabbit IgM complex (DAKO Diagnostika; Hamburg, Germany) for 90 min. Specific binding of NFκB was amplified using the ABC staining system of Santa Cruz. Sections were stained with peroxidase substrate for about 5 min without counterstaining. For negative controls, slides were incubated with TNB blocking buffer instead of the primary antibody.
(
Preparation of Cytoplasmic and Nuclear Extracts
For biochemical studies, livers were rinsed with saline via the portal vein, excised, weighed, and homogenized in a Potter-Elvehjem homogenizer (Braun; Melsungen, Germany) with a loose-fitting Teflon pestle at 1000 rpm with eight up-and-down strokes in ice-cold homogenization medium (250 mM sucrose, 5 mM MgCl2, 10 mM Tris-HCl, pH 7.4), called buffer A. After filtration, the homogenate was centrifuged at 600 X g for 10 min at 5C in a Beckman TJ-6 centrifuge (Beckman Instruments; Munich, Germany). To prepare the cytoplasmic extract the obtained supernatant was centrifuged at 100,000 X g at 4C for 30 min in a Beckman L5–65B ultracentrifuge (swinging-bucket rotor).
The nuclear extract was prepared according to a modified method of Rickwood et al. (1997). The pellet obtained by the first centrifugation was resuspended in buffer A and again centrifuged at 600 X g at 5C for 10 min. This pellet of crude nuclei obtained after the second centrifugation was resuspended in 9 volumes of buffer B (2.2 M sucrose, 1 mM MgCl2, 10 mM Tris-HCl, pH 7.4), homogenized, and centrifuged at 70,000 X g at 4C for 80 min in a Beckman L5–65B ultracentrifuge. The purified nuclei were resuspended in buffer A.
Preparation of the Nuclei for Electron Microscopy
A part of the resuspended nuclei was immediately fixed with 1.5% glutaraldehyde in 100 mM Pipes buffer, pH 7.4, overnight. After centrifugation in an Eppendorf centrifuge for 3 min the pellet was embedded in 1.5% agar. This agar pellet was cut into small samples, postfixed with osmium tetroxide, dehydrated, and embedded in Epon 812. Ultra-thin sections were counterstained with lead citrate for 1 min and examined in a Philips EM 301 electron microscope.
Western Blotting Analysis
The protein quantity of cytoplasmic and nuclear extracts was performed using Bradford reagent (Biorad; Munich, Germany). Five μg protein for detection of NFκBp65 and IκBβ separated in SDS-10% polyacrylamide gels were transferred to polyvinylidine difluoride membranes (Millipore; Eschborn, Germany) by electroblotting. Membranes were washed in PBS/Tween buffer (PBS containing 0.05% Tween-20) and incubated in blocking buffer containing a mixture of one part PBS/Tween-20 and one part non-fat milk (0.3% fat), followed by washing and incubation with the primary antibody which had been diluted (1:1000) in the same buffer overnight. Immunocomplexing was performed using the same primary antibodies as described for immunohistochemistry. The immunocomplexes were detected by using horseradish peroxidase-labeled donkey anti-goat antibody (Santa Cruz Biotechnology), or, respectively, goat anti-rabbit antibody, using the enhanced chemiluminescence (ECL) Western blotting detection system (NEN; Boston, MA). The intensity of immunoreactive bands was quantified by densitometry using NIH-Image software (version 1.59; National Institutes of Health, Bethesda, MD).
Measurement of Caspase-3 Activity
Caspase-3 activity was determined according to the method of Stennicke and Salvesen (1997). Caspase buffer contained 20 mM Pipes, 100 mM NaCl, 10 mM dithiothreitol, 1 mM EDTA, 0.1% CHAPS, and 10% sucrose, pH 7.2. Pre-incubation was carried out in a medium containing 150 μg protein of the cytosolic sample and 1 ml assay buffer at 37C for 0.5 hr, followed by incubation with 10 μl fluorogenic substrate AcDEVD/AMC (Asp-Glu-Val-Asp/7-amino-4-methyl-coumarin) (BD Pharmingen; Heidelberg, Germany). Active caspase-3 cleaves the substrate into D and AMC, releasing the fluorogenic AMC. AMC fluorescence was quantified by spectrofluorophotometry (RF-5301 PC spectrofluorophotometer; Shimadzu, Kyoto, Japan) using an excitation wavelength of 380 nm. Emission wavelength ranged between 420 and 460 nm. For control, the specific inhibitor AcDEVD-CHO blocks cleavage of the fluorogenic substrate. We added 10 μl of AcDEVD-CHO to the incubation medium.
Light, Fluorescence, and Electron Microscopy
To investigate the typical morphological signs of apoptosis (the crescents of condensed heterochromatin along the nuclear envelope), we stained LR White-embedded semithin sections with hematoxylin for 10 min, followed by eosin for 1 min, or we stained with DAPI (4',6-diamine-2'-phenylindole dihydrochloride) in an aqueous dilution of 1:10,000 for 15–30 min. DAPI-stained tissue was examined in the Zeiss/Axiophot and photographed on Kodak Elitechrome 400. For electron microscopic studies sections were treated as described above.
In Situ Cell Death Detection of DNA Strand Breaks by Fluorescence Microscopy
For in situ labeling of DNA strand breaks in nuclei we used LR White-embedded semithin sections of the livers of mice that had been treated with GalN/TNFα for 4.5 hr, and applied the method of Gavrieli et al. (1992) using the In Situ Cell Death Detection Kit, Fluorescein (Roche; Mannheim, Germany). The incubation of semithin sections started with 20 μg/ml proteinase K in Tris-HCl at 37C for 7 min. Sections were rinsed with PBS and incubated in a humid chamber at 37C for 60 min with the TUNEL [terminal deoxynucleotidyl transferase (TdT) mediated dUTPnick end labeling] reaction mixture containing TdT and fluorescein dUTP. For controls, (a) semithin sections of a control liver were incubated with the whole reaction mixture, or (b) semithin sections of the liver of a treated animal were incubated with fluorescein dUTP only. After rinsing in PBS, sections were coverslipped with Mowiol, examined in the Zeiss/Axiophot, and photographed on Kodak Elitechrome 400.
Quantification of Apoptotic Cells
We counted the nuclei of hepatocytes in HE-stained semithin sections of the liver of mice (n=3) 4.5 hr after treatment with GalN/TNFα. A total of 300 nuclei were randomly counted and the percentage of the nuclei that exhibited condensed crescent-shaped chromatin along the nuclear envelope was calculated.
Statistical Analysis
The results were analyzed by one-way ANOVA followed by the Dunnett Multiple Comparisons Test of the control against all other groups using the program InStat (Graph Pad Software; San Diego, CA). All data in this study were expressed as mean ± SEM. p≤0.05 was considered significant.
Results
Purity of the Nuclear Fractions
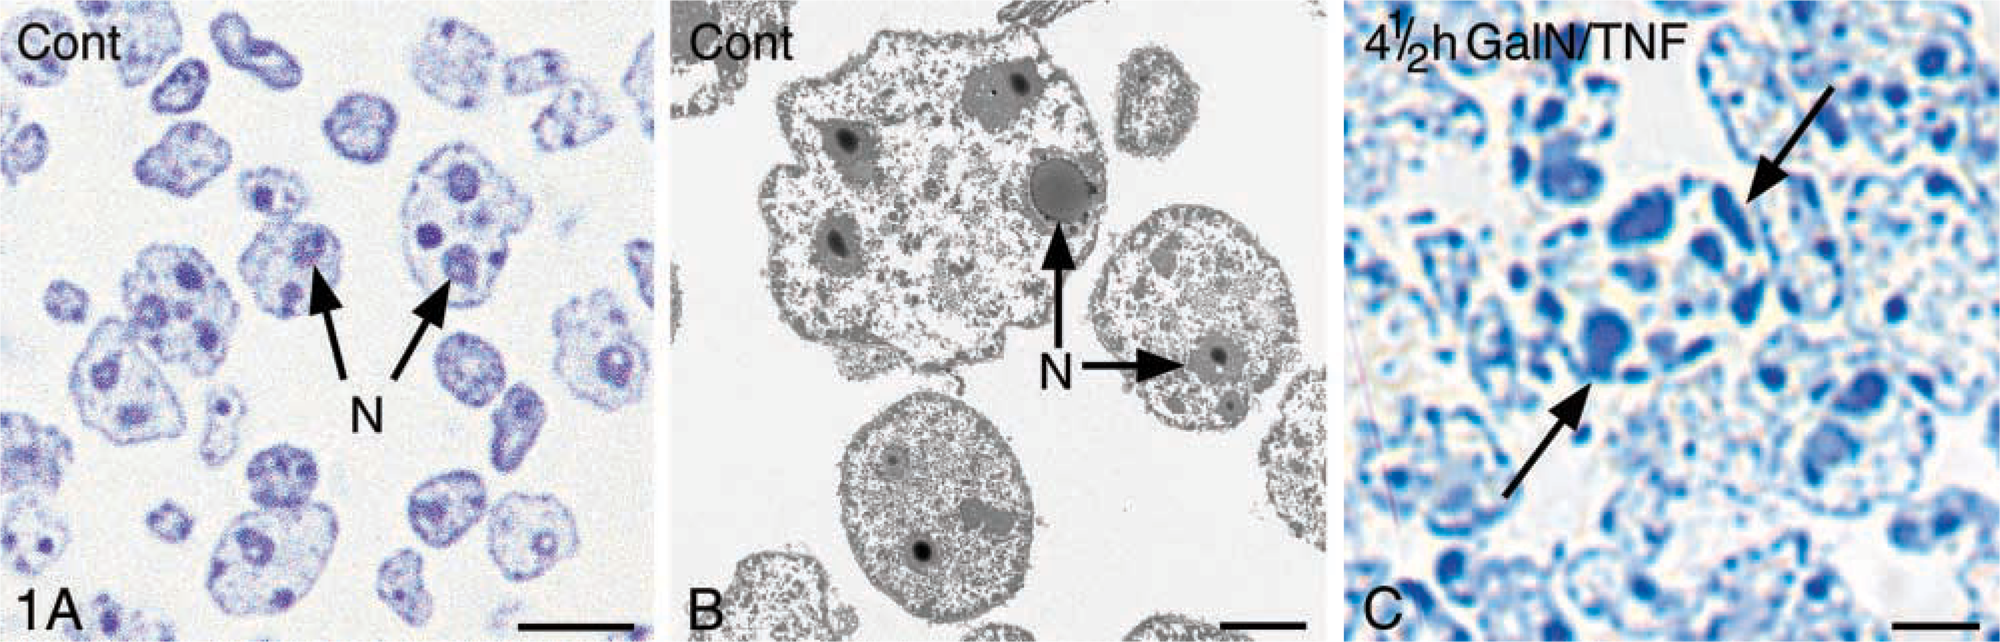
The purified nuclear fractions of control livers exhibited good light and electron microscopic preservation without cytoplasmic contamination (Figures 1A and 1B). Some nuclei of the fractions prepared 4.5 hr after GalN/TNFα treatment revealed the typical apoptotic chromatin condensation (Figure 1C). Biochemically, we did not detect any NFκB in the control nuclear fractions (Figure 5). IκBβ was detected neither in the control nuclear fractions nor in the nuclear fractions resulting from GalN/TNFα treatment (data not shown). This may confirm the purity of the nuclear fractions. We have used this preparation procedure for the biochemical nuclear investigations.
NFκB
The shuttle of NFκB was demonstrated by immunohistochemistry and Western blotting analysis, including quantitative analysis of the protein level based on the density of immunoreactive bands of Western blots of cytosolic and nuclear fractions.
Immunohistochemistry. In the liver of control animals, the incubation with anti-NFκB revealed immunoreactivity only in the cytoplasm of hepatocytes (Figure 2A). Replacement of the primary antibody by the blocking buffer TNB was used as a control for specific labeling. No reaction product was found in the cytoplasm of hepatocytes (Figure 2B). The translocation of NFκB into the nucleus began 30 min after GalN/TNFα administration (Figure 2C). Surprisingly, 4.5 hr after treatment immunoreactivity was observed in the heterochromatin of nuclei of apoptotic hepatocytes whereas, conversely, the reaction product could not be found in the nuclei of non-apoptotic hepatocytes. Diffuse staining of the cytoplasm showed the shuttle of NFκB back to the cytoplasm after 4.5 hr (Figure 2D).
Western Blotting Analysis and Quantitative Analysis of Labeling Density. Western blotting analysis and quantitative analysis of the labeling density revealed a decrease of NFκB in the cytoplasm, with the lowest level 2.5 hr after treatment. NFκB increased again but did not reach the level of the control fractions (Figure 4). Correspondingly, the NFκB content in the nuclear fractions reached its maximum 2.5 hr after GalN/TNFα treatment and decreased to approximately 30% 4.5 hr after treatment. In the nuclear fractions of control livers, NFκB could not be determined (Figure 5).
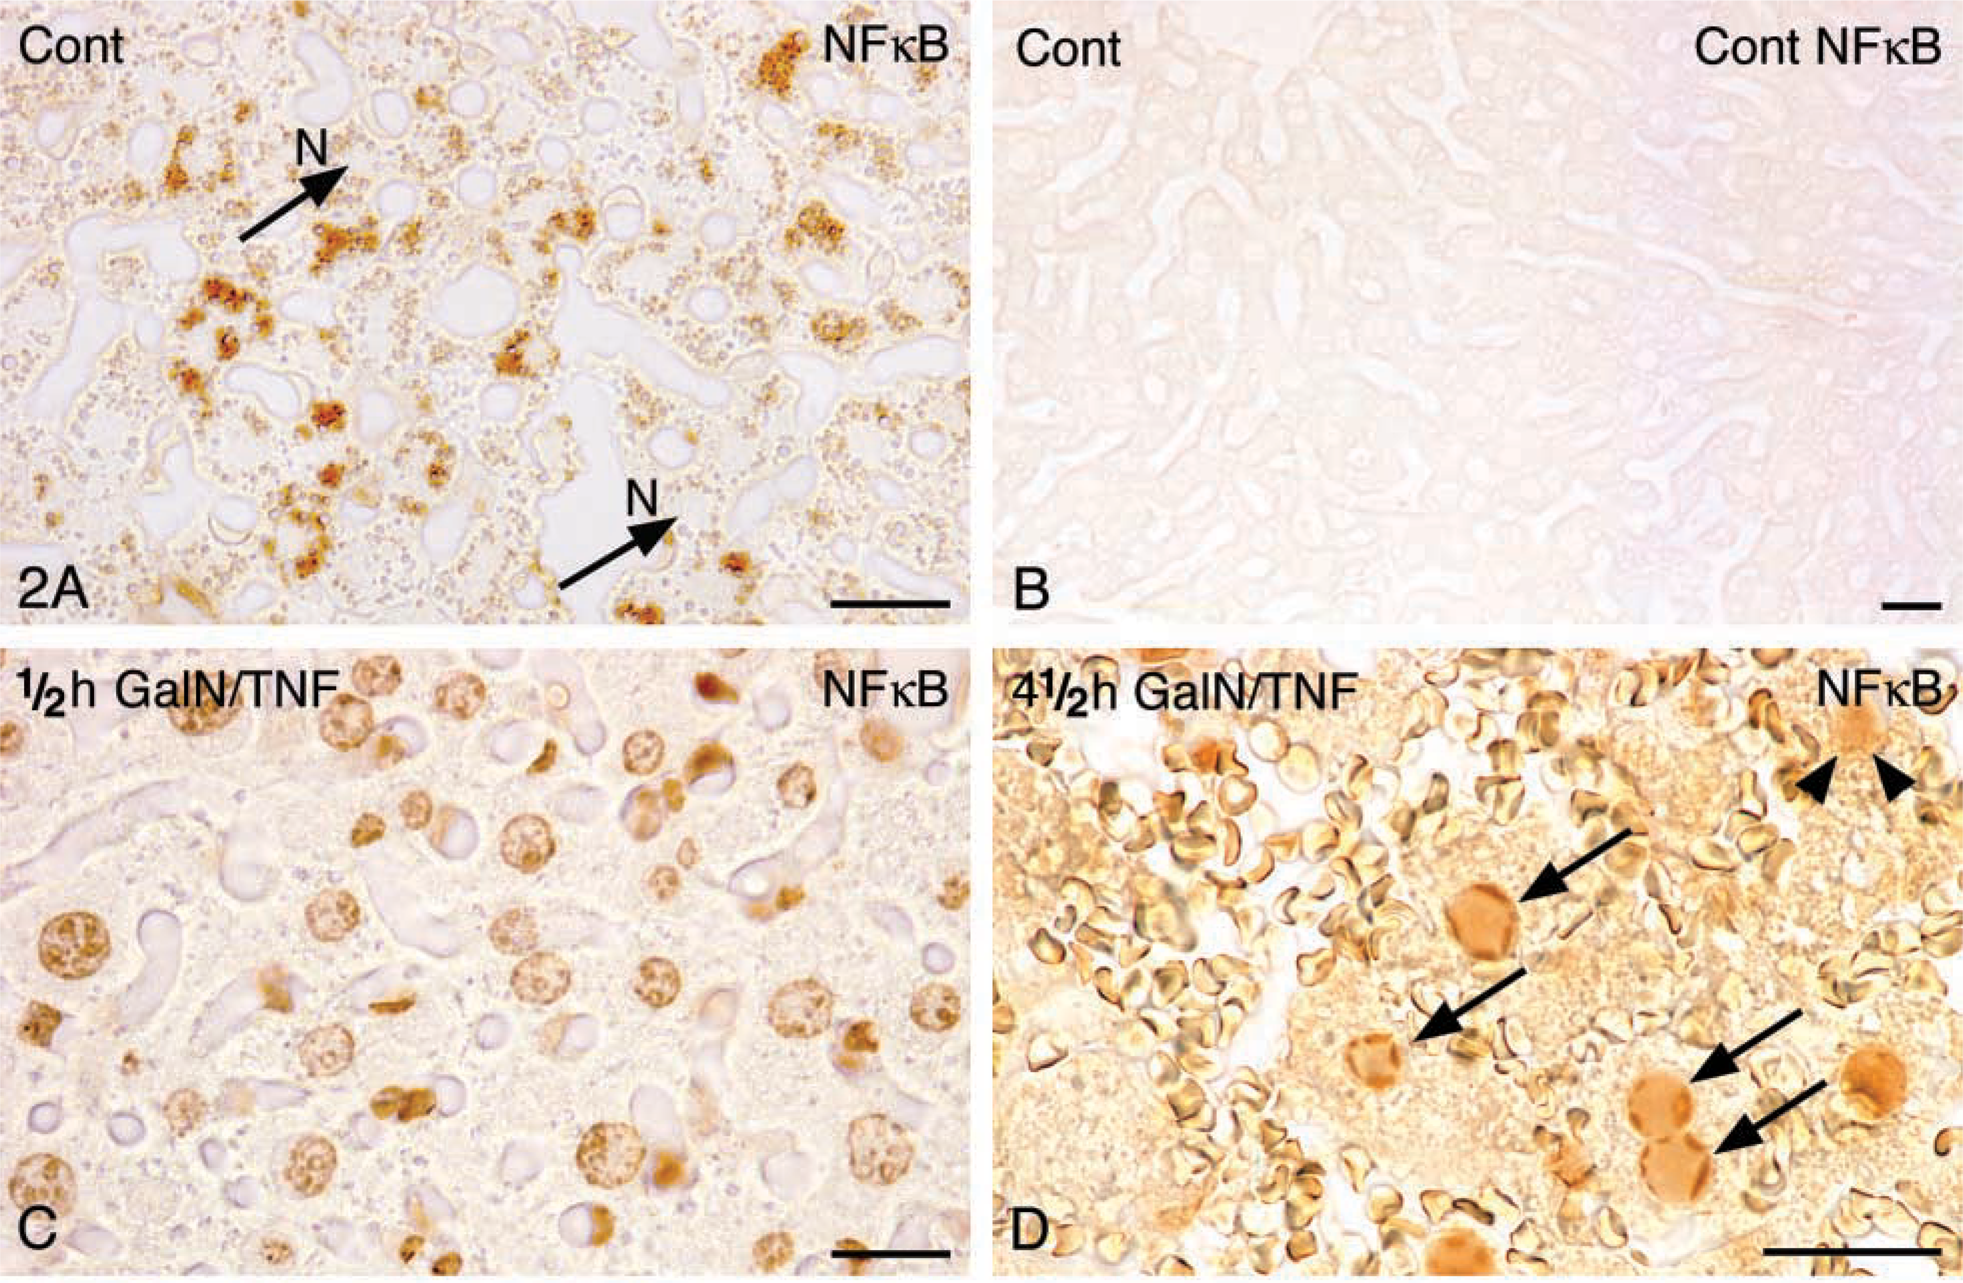
Immunohistochemical staining of NFκBp65 in mouse liver paraffin sections. (
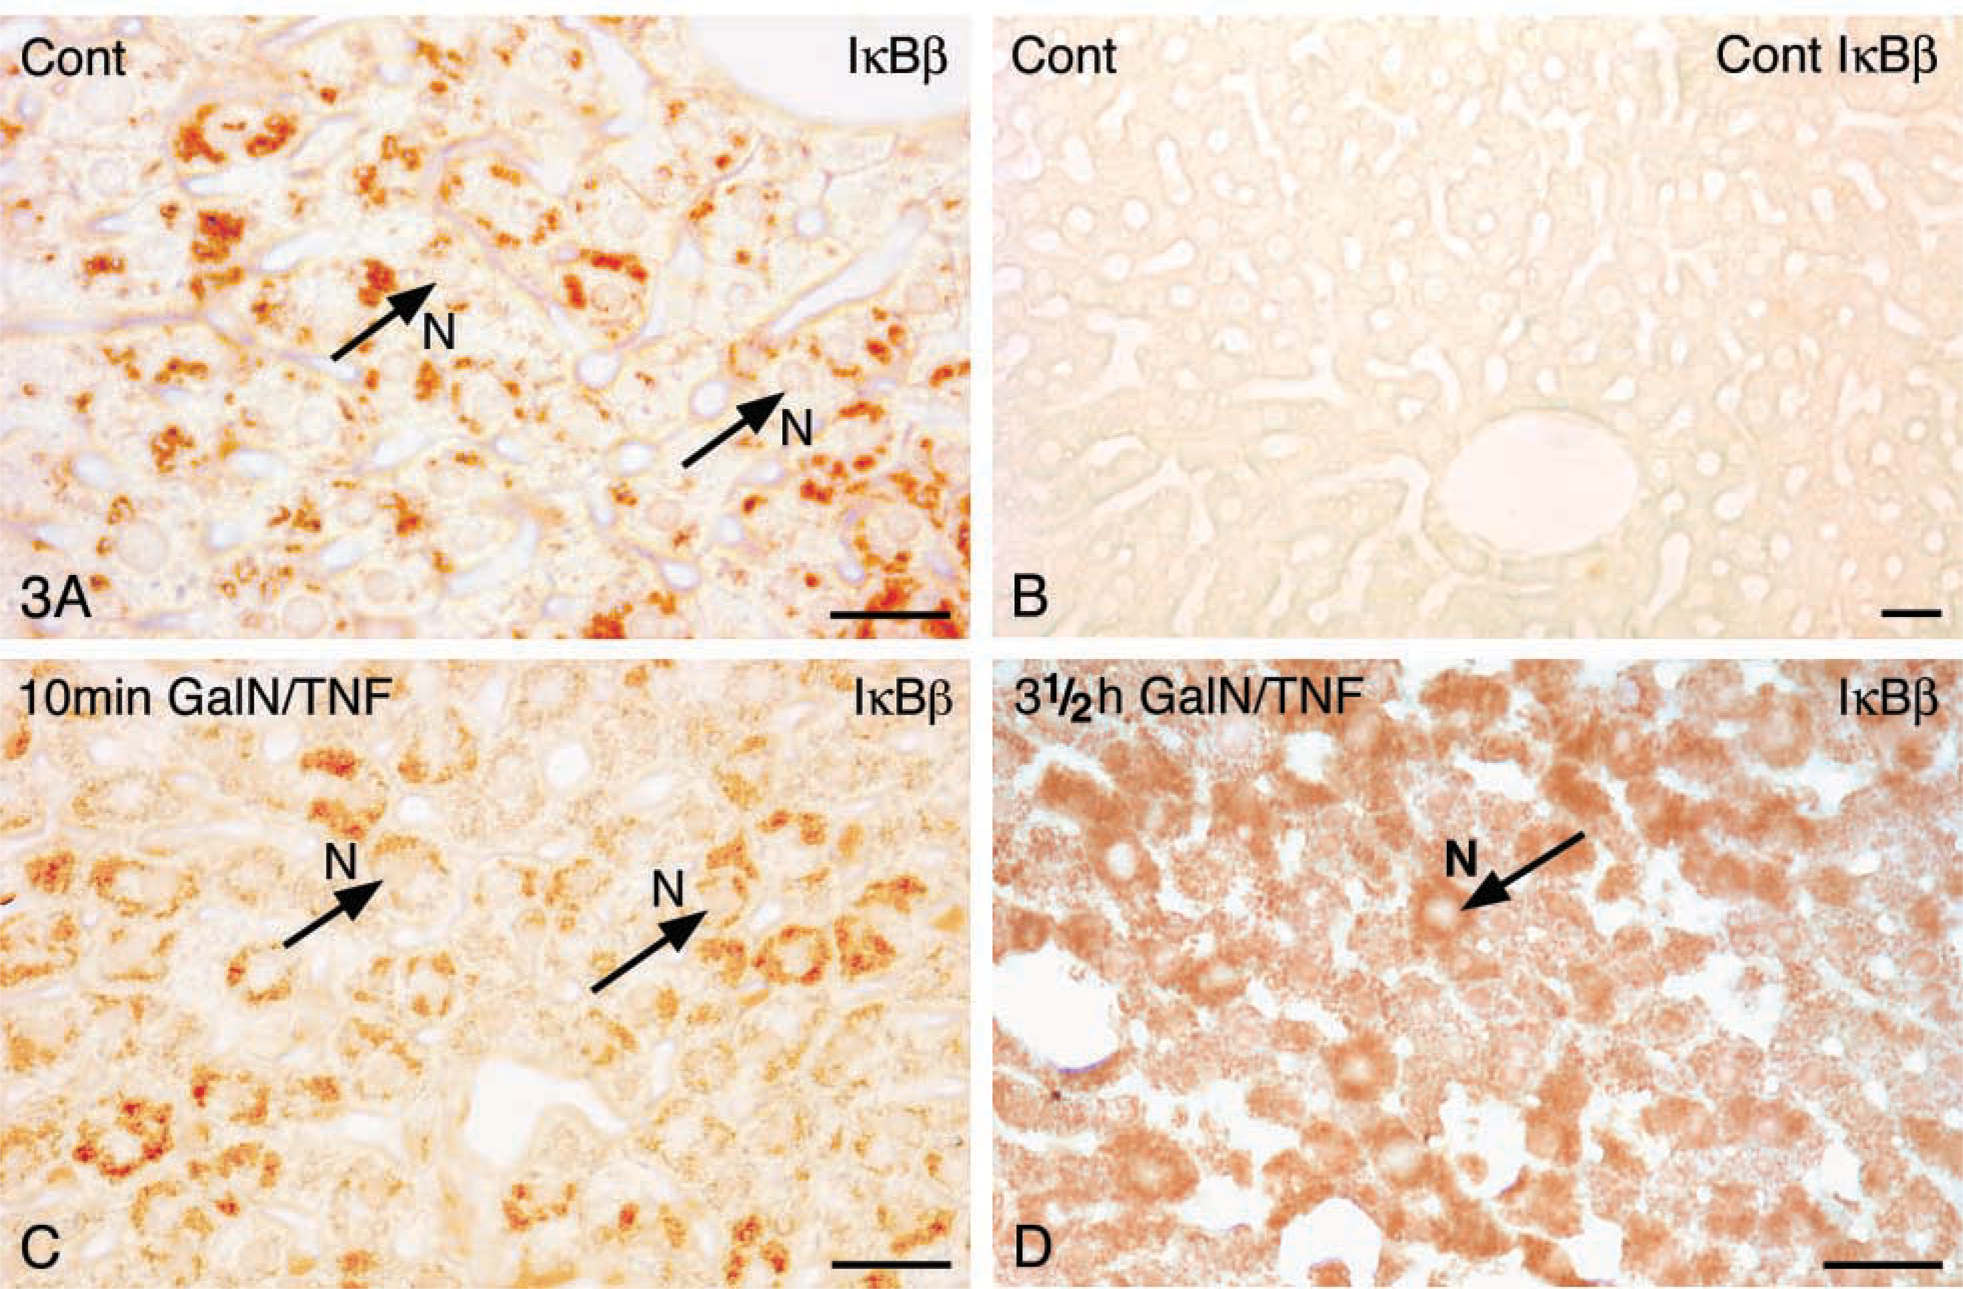
Immunohistochemical staining of IκBβ in mouse liver paraffin sections. (
IκBβ
NFκB is sequestered in the cytoplasm by the inhibitory IκB protein family, which includes IκBα, IκBβ, and IκB∊. We investigated IκBβ, which did not participate in the shuttle of NFκB.
Immunohistochemistry. We documented the expression of IκBβ in the liver of control animals as a strong immunoreactivity in the cytoplasm of hepatocytes (Figure 3A). Replacement of the primary antibody by blocking buffer TNB was used as a control for the specific labeling. No reaction product was found in the cytoplasm of hepatocytes of control liver (Figure 3B). Ten min after stimulation the reaction product was still observed in the cytoplasm (Figure 3C) but could no longer be detected within 30 min-2.5 hr after GalN/TNFα treatment (data not shown). However, 3.5 hr after stimulation IκBβ was found again in the cytoplasm (Figure 3D).
Western Blotting Analysis and Quantitative Analysis of Labeling Density. At 42.5 hr after treatment, Western blotting analysis and quantitative analysis of the labeling density showed a decrease of the cytosolic IκBβ protein level to approximately 50% in comparison with the protein quantity of the control fractions. After this time the protein level increased again but did not reach the quantity of the control fractions (Figure 6). IκBβ was detectable neither in the nuclear fractions nor in the nuclei of tissue sections, indicating that IκBβ was not involved in the NFκB shuttle.
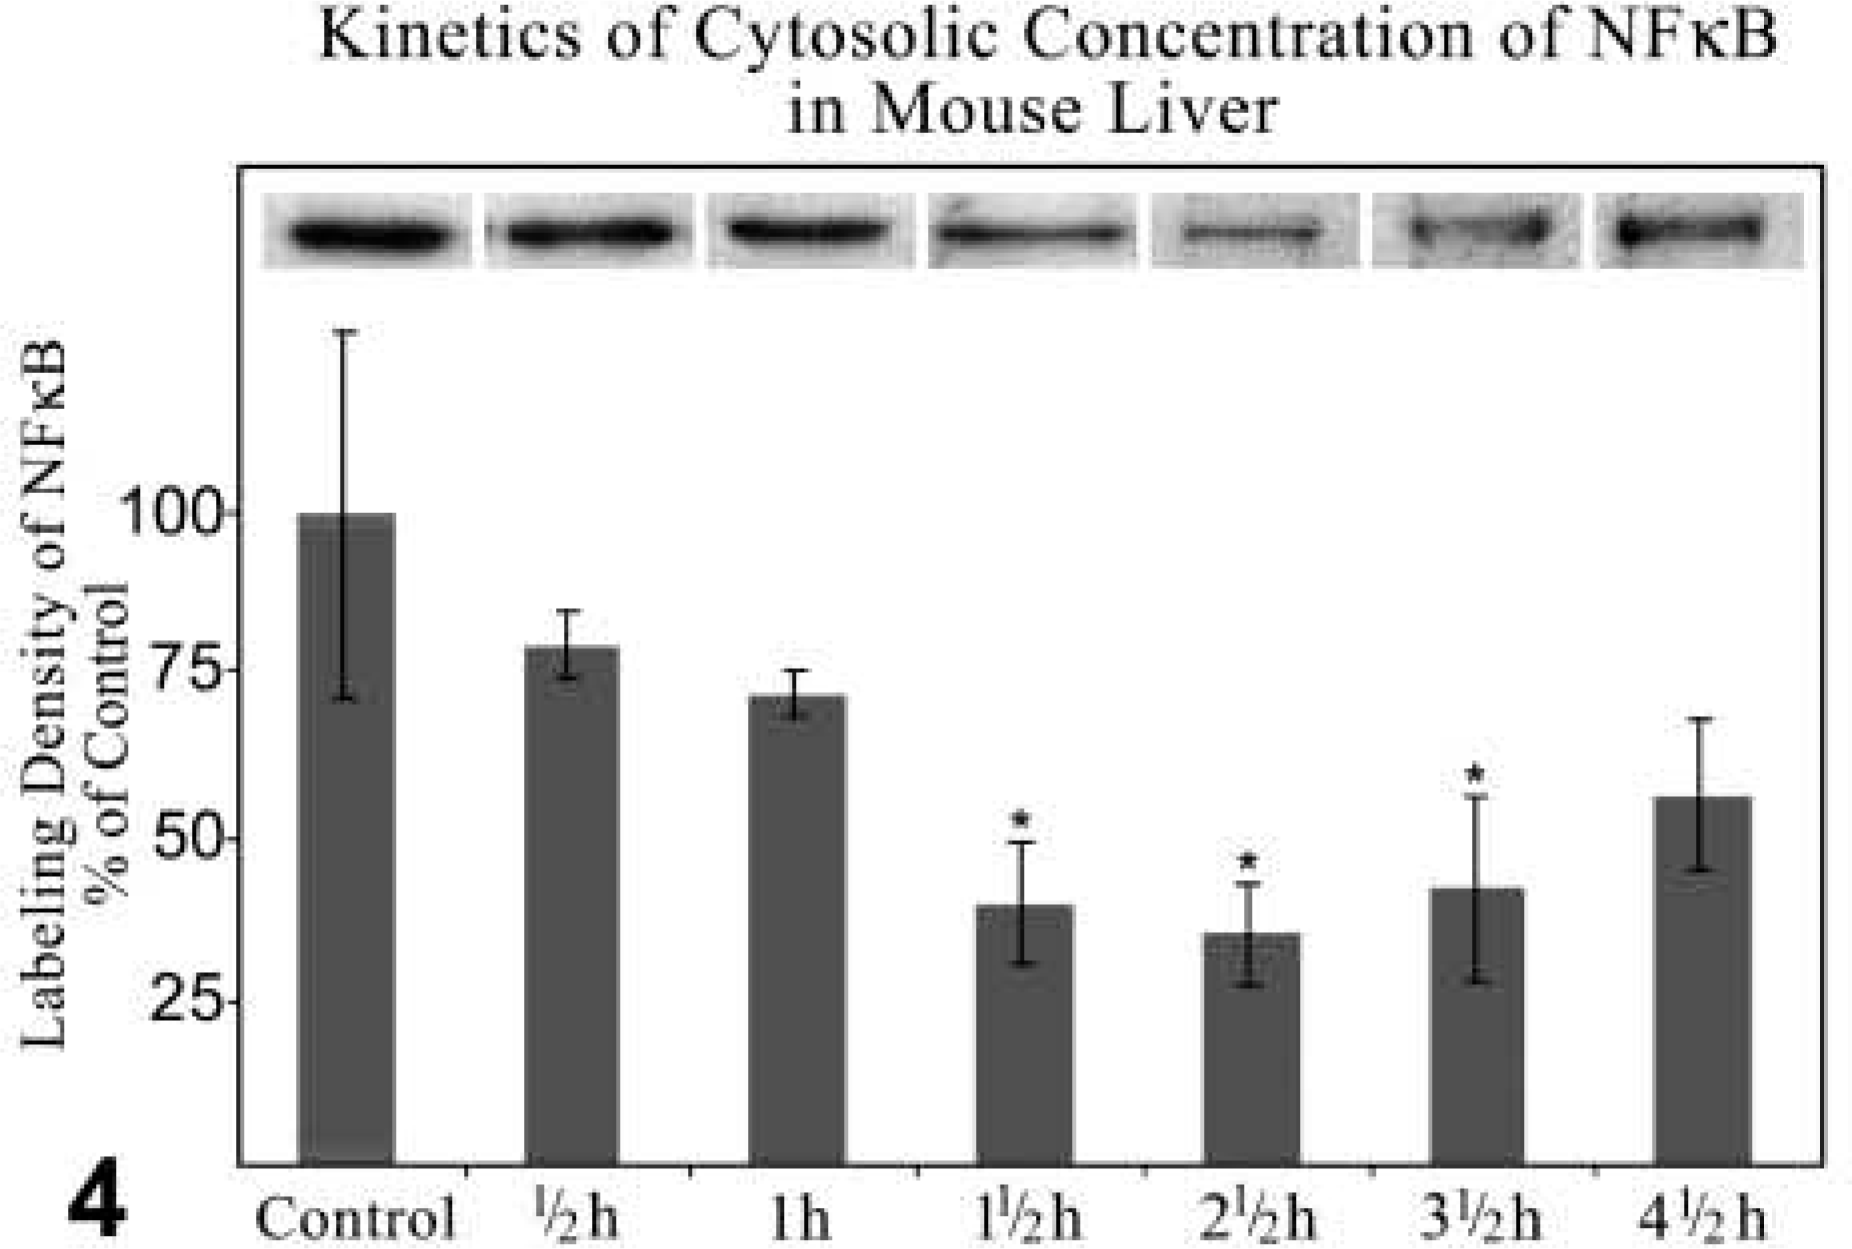
Kinetics of Western blotting analysis together with quantitative analysis of labeling density of NFκBp65 expression in cytosolic fraction of the liver of control and GalN-sensitized TNFα-treated mice. Incubation with anti-NFκBp65 diluted 1:1000. Immunocomplexes of NFκBp65 detected by ECL. The values of labeling density are normalized to 100 using the control value as reference. Data are expressed as mean values ± SEM. p≤0.05 vs control; n=3.
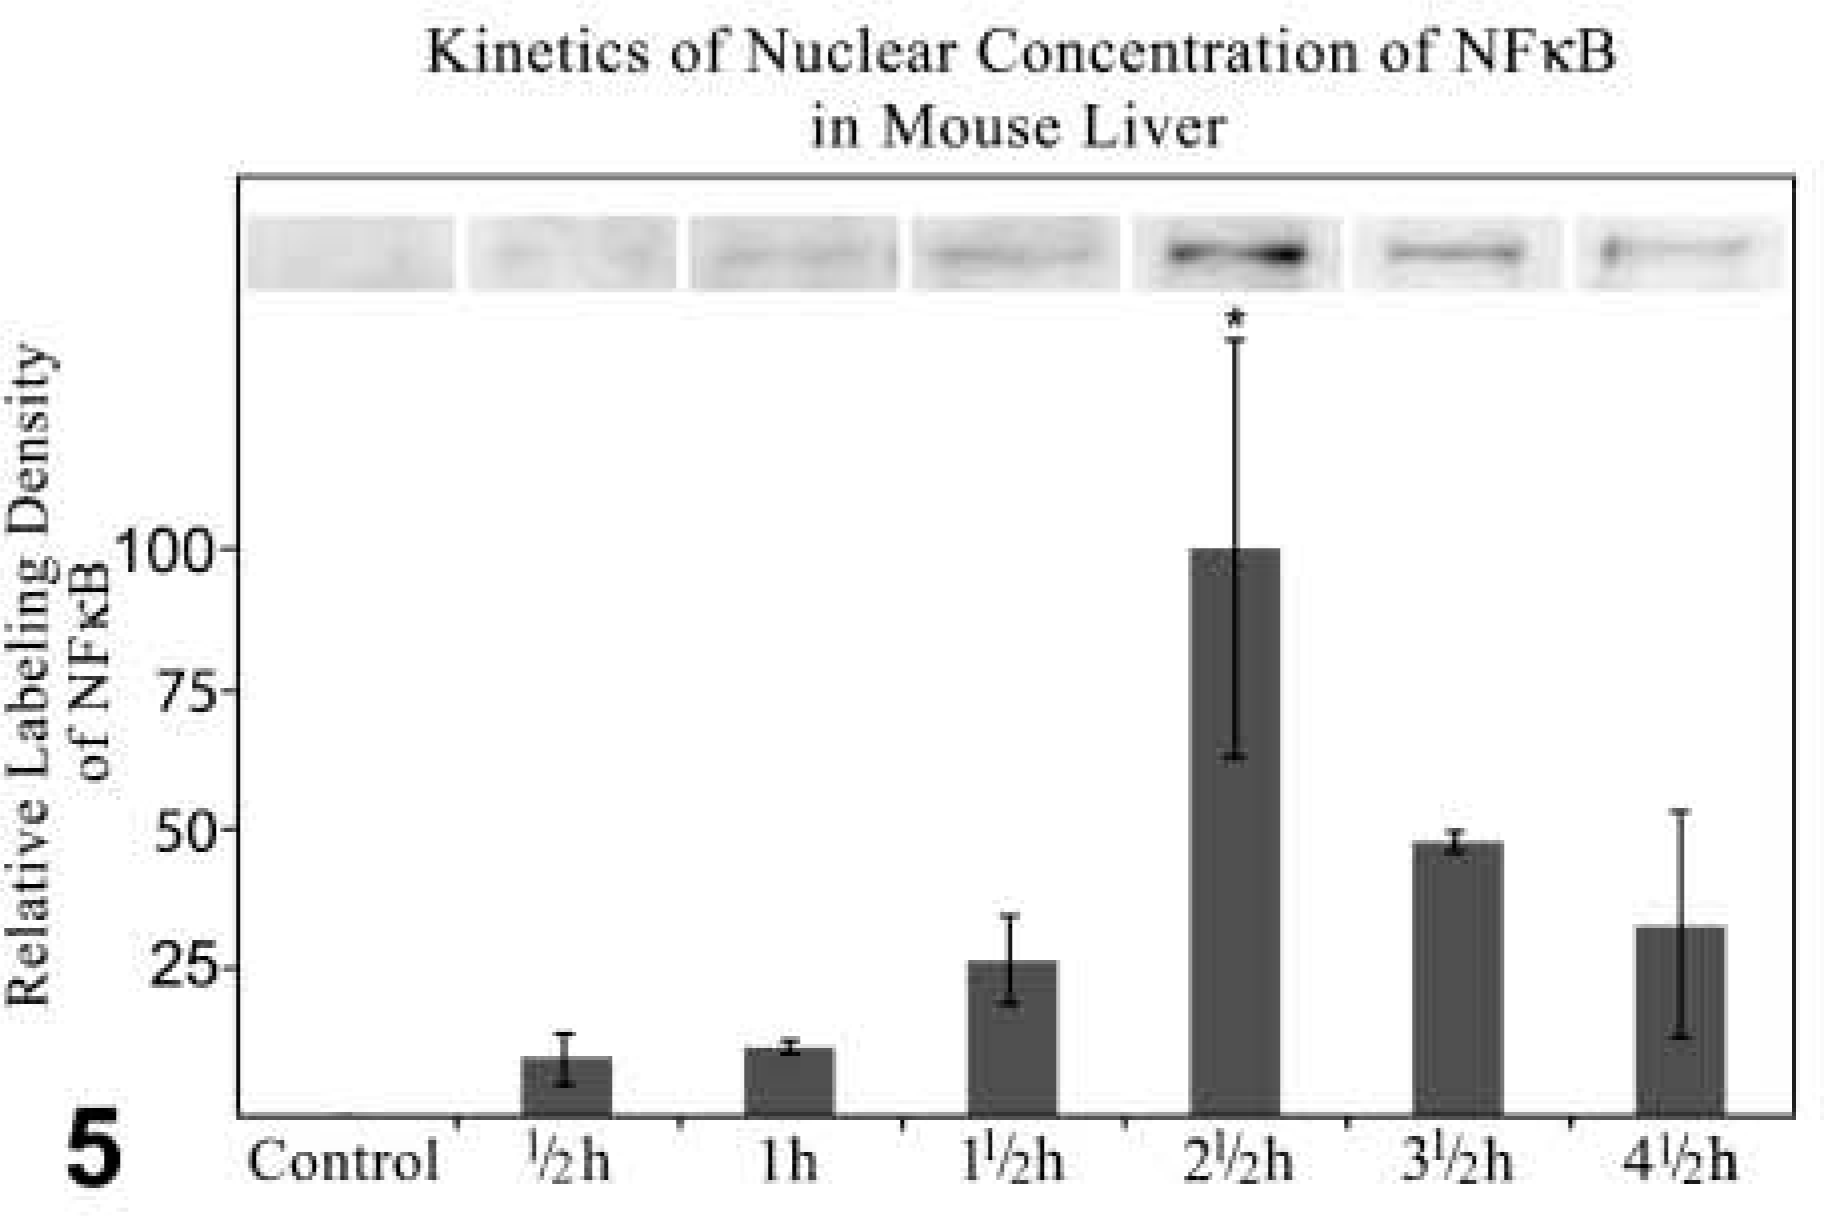
Kinetics of Western blotting analysis together with quantitative analysis of labeling density of NFκBp65 expression in nuclear fraction of the liver of control and GalN-sensitized TNFα-treated mice. Incubation with anti-NFκBp65 diluted 1:1000. Immunocomplexes of NFκBp65 detected by ECL. The values of the labeling density are normalized to 100 using the value of the nuclear fraction prepared 2.5 hr after treatment. Data are expressed as mean values ± SEM. p≤0.05 vs control; n=3.
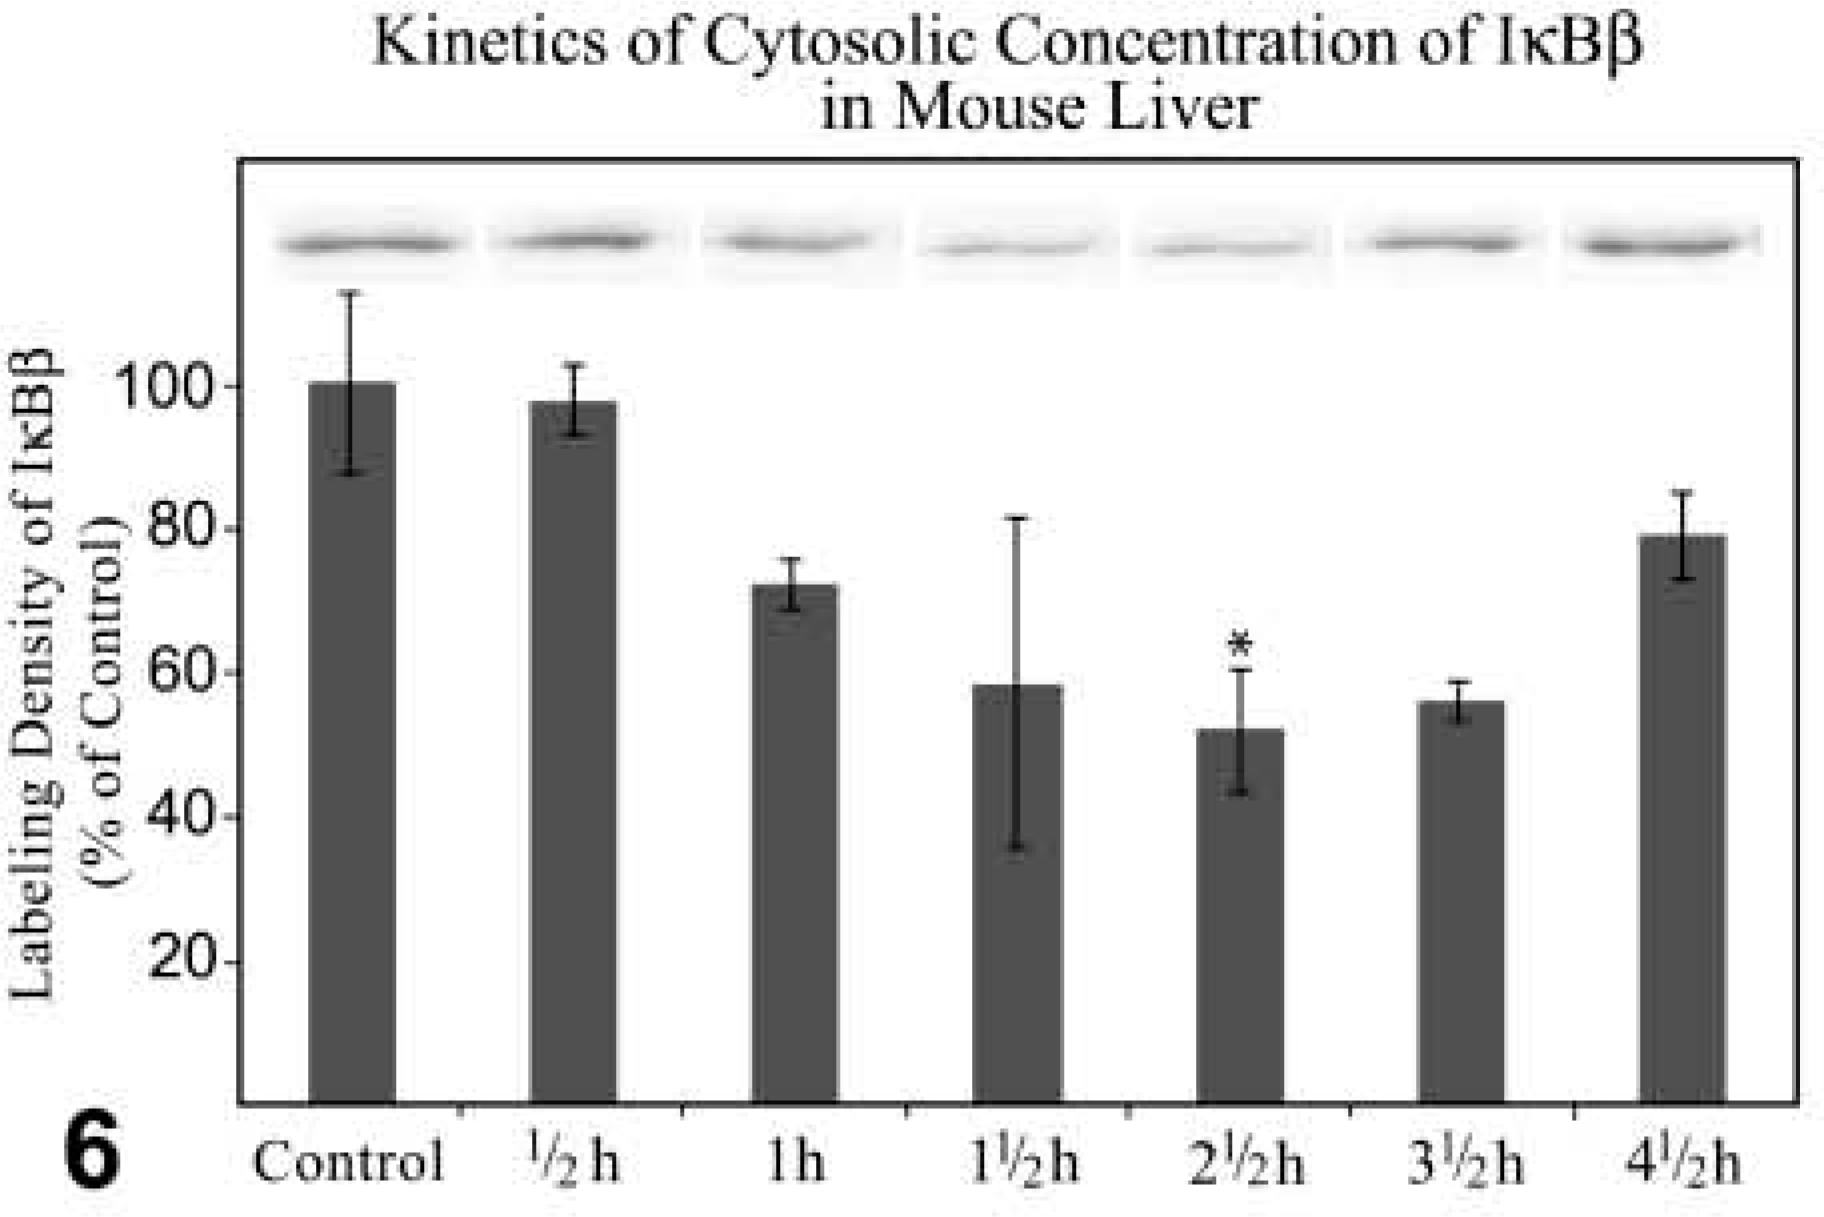
Kinetics of Western blotting analysis together with quantitative analysis of labeling density of IκBβ expression in cytosolic fractions of the liver of control and GalN-sensitized TNFα-treated mice. Incubation with anti-IκBβ diluted 1:1000. Immunocomplexes detected by ECL. The values of the labeling density are normalized to 100 using the control as reference. Data are expressed as mean values ± SEM. p≤0.05 vs control; n=3.
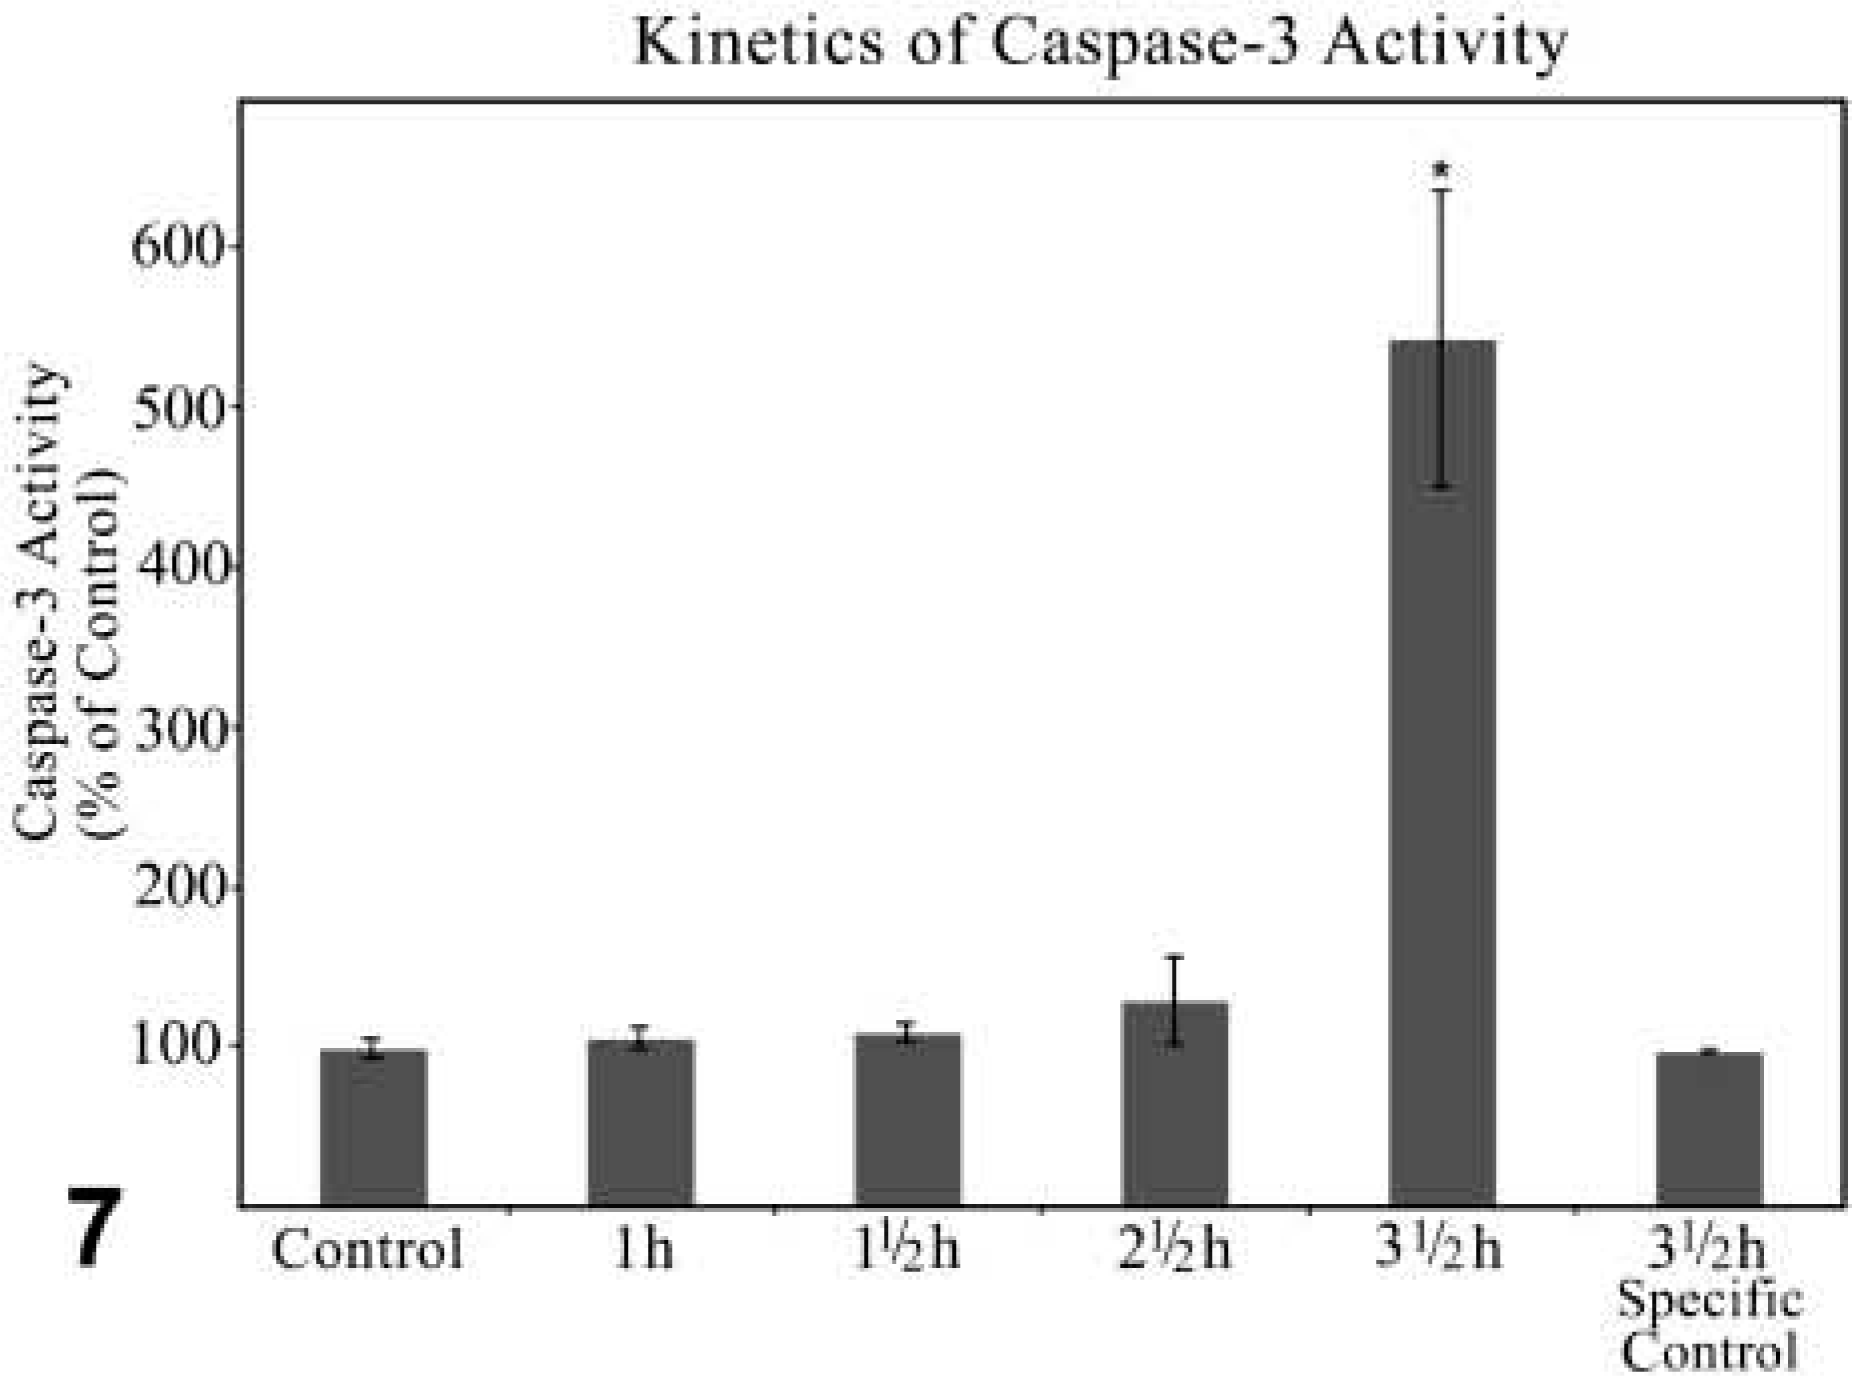
Kinetics of caspase-3 activity in cytosolic fractions of the liver of control and GalN/TNFα-treated mice. Specific control: caspase-3 activity measured 3.5 hr after GalN/TNFα treatment was prevented by the specific inhibitor AcDEVD-CHO (right lane). The values of caspase-3 activity are normalized to 100 using the control as reference. Data are expressed as mean values ± SEM. p≤0.05 vs control; n=3.
Caspase-3 Activity
Reduced synthesis of protective proteins by injection of GalN induced apoptotic cell death in hepatocytes of mice treated with TNFα. Key mediators that initiated the apoptotic program were members of the caspase family. AMC fluorescence, the indication of caspase-3 activity measured by spectrofluorophotometry, increased perceptibly 2.5 hr after treatment and was more than 5 times higher 3.5 hr after treatment compared to the fluorescence measured in control fractions. 4.5 hr after stimulation, fluorescence increased to such an extent that it could no longer be measured. Peptid aldehyde, like DEVD-CHO, binding strongly to the caspase-3 active site and blocking the cleavage of the AMC group was used as specific control. This inhibitor reduced the activity, as measured 3.5 hr after treatment, to the level demonstrated in the control fractions (Figure 7).
Histological and Electron Microscopic Findings
We used LR White-embedded liver tissue for the morphological studies of apoptosis. In contrast to eponembedded material, LR White-embedded semithin sections of liver tissue were regarded as appropriate for hematoxylin/eosin and for DAPI staining. Apoptotic cell death is very rare in healthy adult mouse liver (Figure 9A). Approximately one to five apoptotic cells/10,000 hepatocytes are found in untreated mice (for review see Schulte-Hermann et al. 1995). Although GalN sensitizes mice to the effects of TNFα, it was hardly toxic in the applied dose (Leist et al. 1995). Neither injection of 700 mg/kg GalN nor of 5 μg/kg TNFα induced hepatocellular apoptosis 4.5 hr after administration (Figures 9B and 9C). Administration of GalN produced uridine diphosphate hexosamine complexes (Keppler et al. 1970), which could be seen as various amounts of dark-red precipitates in the individual hepatocytes of HE-stained LR White-semithin sections (Figures 9C and 9D). In the apoptotic hepatocytes large amounts of these complexes were found.
Activated executioner caspase-3 led to apoptotic cell death. In accordance with the enormous increase of caspase-3 activity 3.5 hr after treatment, apoptotic hepatocytes appeared occasionally. These apoptotic cells were still surrounded by morphologically intact liver tissue. The typical shrinkage of the apoptotic cell, together with the well-known heterochromatin condensation along the nuclear envelope, is shown in Figure 8. The electron micrograph revealed mitochondria in which the outer membrane was scarified and the inner membrane had expanded through this gap, forming a herniated structure. Approximately 30% of the hepatocytes quantified in semithin liver sections 4.5 hr after treatment exhibited apoptotic characteristics (Figure 9D).
In Situ Cell Death Detection
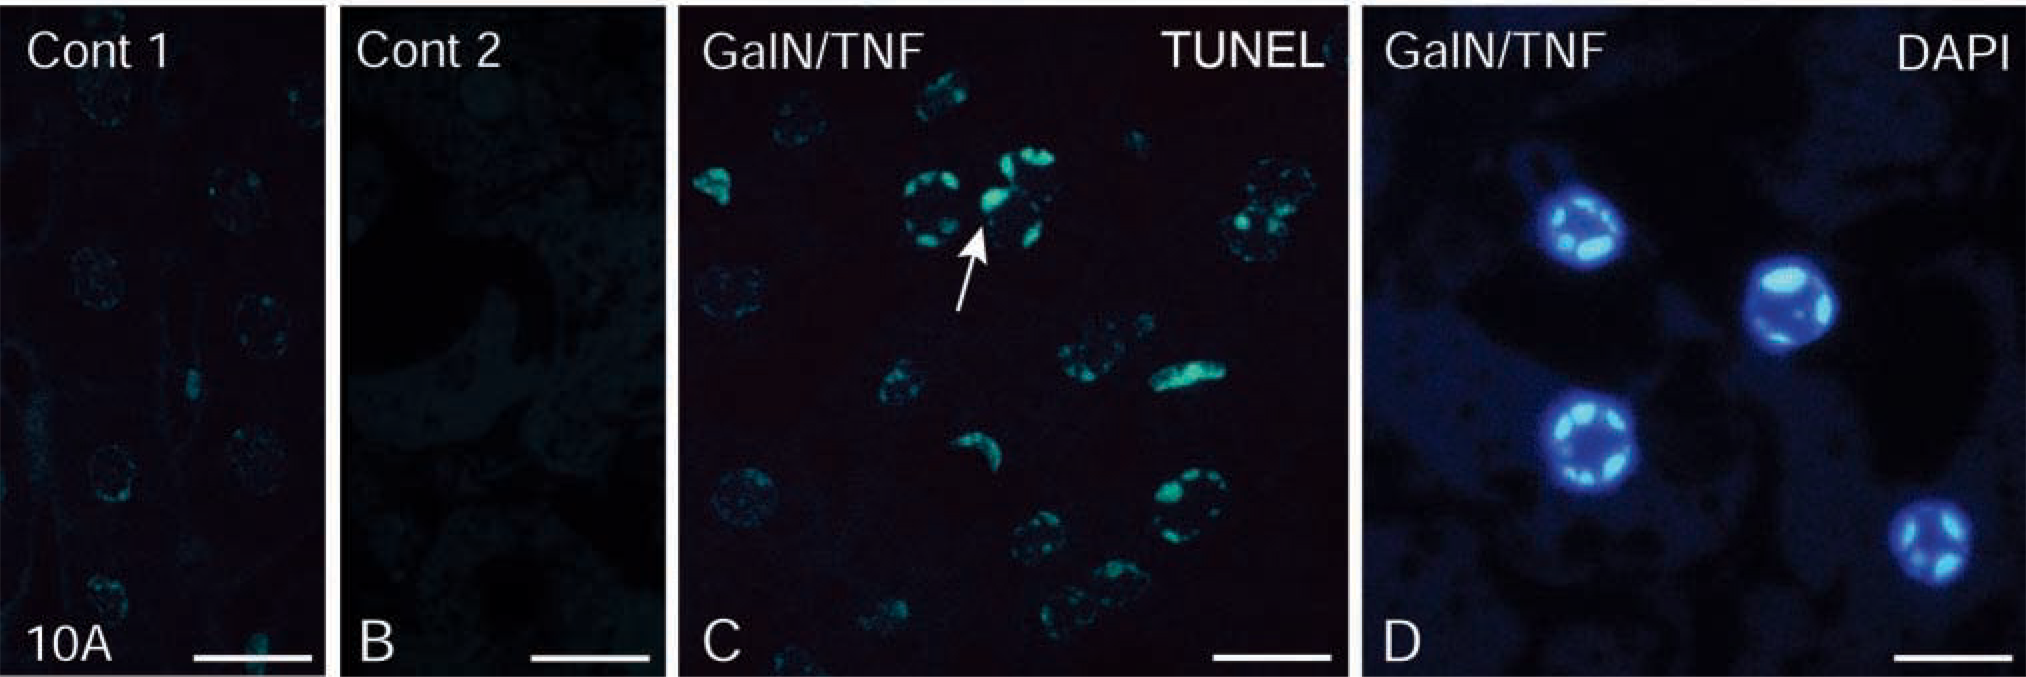
The widely used TUNEL method end-labeled double-stranded, low molecular weight DNA fragments and single-strand breaks in high molecular weight DNA. The polymerization of dUTP to the 3'-hydroxyl end of fragmented DNA resulted in a fluorescent reaction product, which was detected in the apoptotic nuclei of hepatocytes of LR White-embedded semithin sections (Figure 10C). For controls, the negative control of an untreated animal (control 1) and the specificity control of a treated animal (control 2) did not reveal any reaction product (Figures 10A and 10B). Apart from the TUNEL reaction, DAPI staining of tissue sections, embedded in LR White was also very useful for detection of apoptotic hepatocytes (Figure 10D).
Discussion
In a previous study we showed evidence of apoptosis in hepatocytes 4.5 hr after injection of TNFα into GalN-sensitized mice (Angermüller et al. 1998). But what happens in the parenchymal cells before these morphological signs of pre-apoptosis and apoptosis can be detected? Cytokines such as TNFα activate NFκB by releasing it from the cytoplasmic inhibitor protein IκB. Activated NFκB translocates into the nucleus, where it plays an important role in the regulation of genes that play a role in the immune response and in inflammatory processes (for review Ghosh et al. 1998). NFκB also activates cytoprotective genes of the IAP (inhibitor of apoptosis) family, which act as anti-apoptotic factors and support cell survival (Beg and Baldwin 1993; Wang et al. 1998; Schümann and Tiegs 1999). In this study we investigated the shuttle of NFκB between cytoplasm and nucleus and the decrease and increase of its inhibitor IκBβ in the cytoplasm of hepatocytes within 30 min-4.5 hr after injection of TNFα into GalN-sensitized mice. In addition, we have shown that the first appearance of apoptotic hepatocytes is accompanied by a significant increase in caspase-3 activity.
NFκB is sequestered in cytoplasm by the inhibitor protein IκB family, which includes IκBα, IκBβ, and IκB∊. IκBβ has a high affinity towards NFκB dimers by binding to the nuclear localization signals (NLS) of both NFκB subunits, whereas IκBα contacts only the NLS of the transcriptionally active p65 subunit of the p50–p65(relA) heterodimer (Malek et al. 2001). IκB∊ appears to sequester p65 and/or c-rel in cytoplasm (Whiteside et al. 1997; Tam and Sen 2001). In general, IκBα is rapidly degraded, whereas IκBβ and IκB∊ are degraded with slower kinetics (Simeonidis et al. 1999). In our experiments, the decrease of IκBβ in the cytoplasm is less (45%) than the reduction of NFκB in cytoplasm (65%). This suggests that NFκB bound to the other IκB molecules, such as IκBα and IκB∊, was also released from these inhibitors. Activated NFκB leads to the transcription of the IκBα gene, followed by a rapid re-synthesis of this protein. Newly synthesized IκBα enters the nucleus, combines with NFκB, and transports the transcription factor back to the cytoplasm (Arenzana-Seisdedos et al. 1995,1997; Tam and Sen 2001). In contrast, IκBβ mRNA is not upregulated by NFκB (Thompson et al. 1995). Furthermore, IκBβ and IκB∊ do not participate in the shuttle of NFκB (Malek et al. 2001; Tam and Sen 2001). In our purified nuclear fractions we could not determine IκBβ, confirming that IκBβ is purely cytosolic.
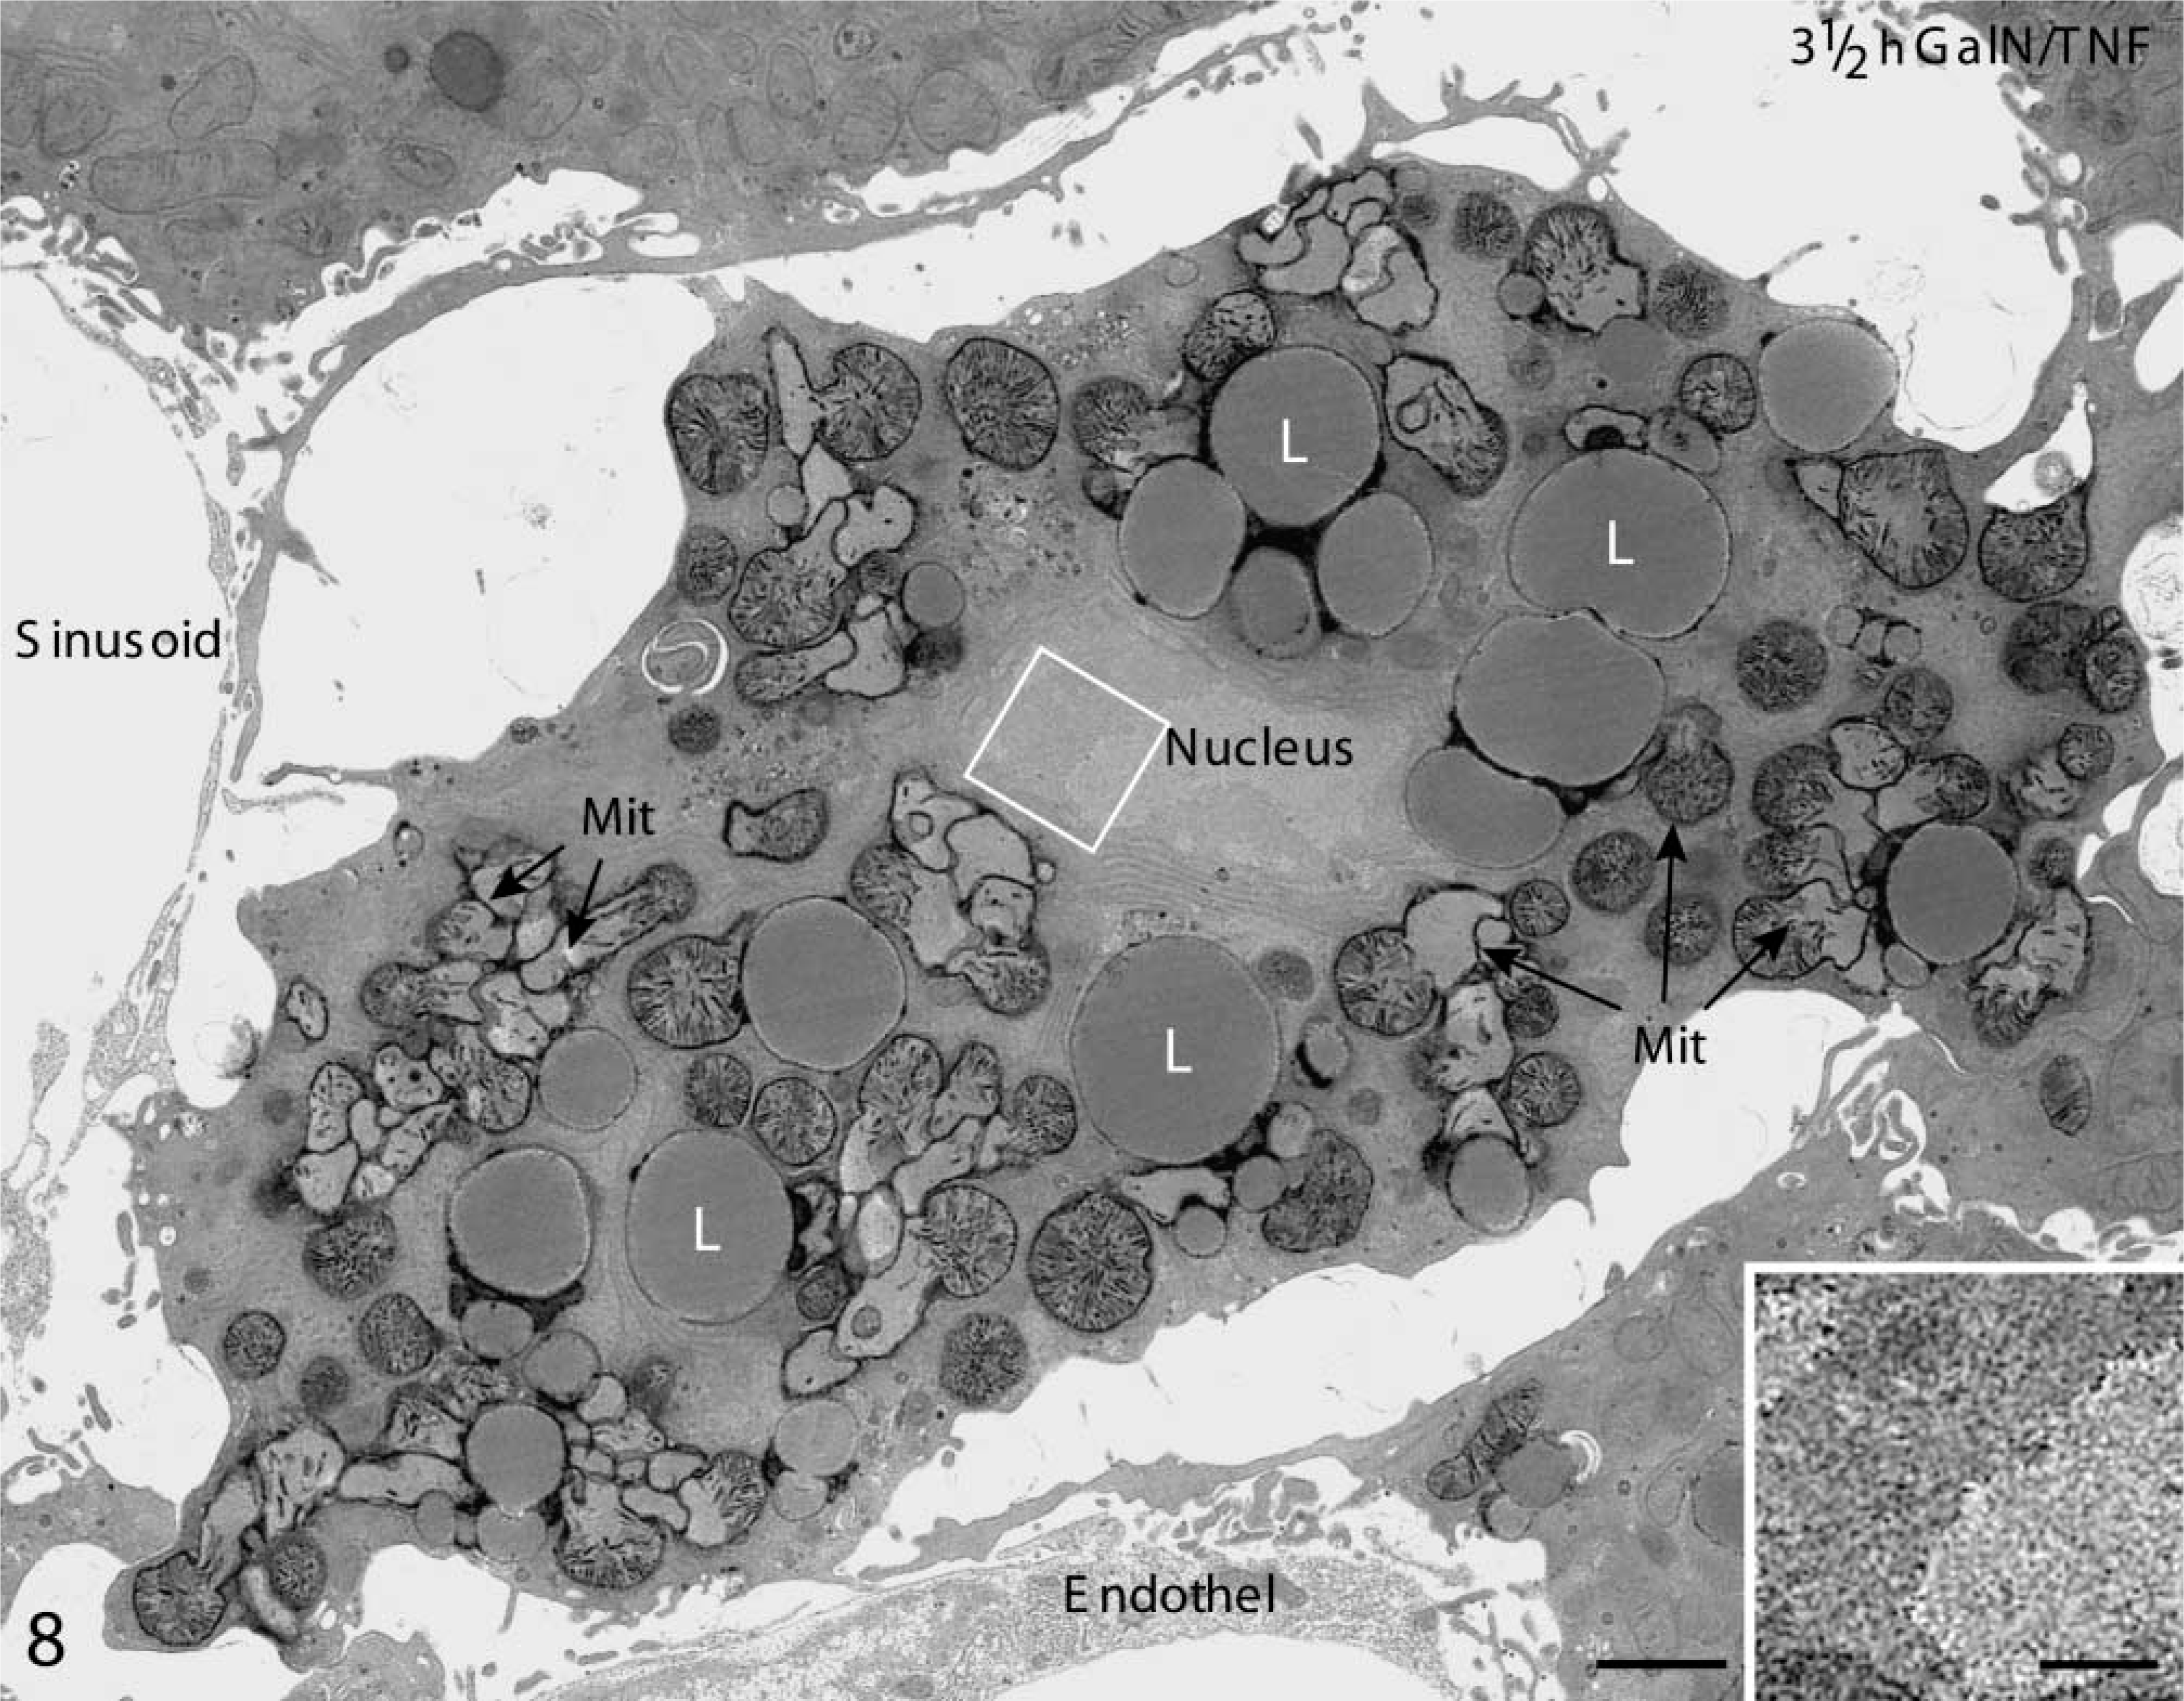
Electron micrograph of mouse liver 3.5 hr after GalN/TNFα treatment. Note the typical shrinkage of the apoptotic hepatocyte, which is surrounded by intact liver tissue. The outer membrane of mitochondria (Mit) is scarified and the inner membrane has expanded through this gap, forming a herniated structure (arrow). L, lipid. Bar = 1 μm. (
Nagaki et al. (2000) demonstrated the translocation of NFκB into nuclei of hepatocytes 1 hr after treatment with GalN/TNFα, and a decrease of NFκB in the nuclei 5 hr after treatment. We determined NFκB in nuclei just 30 min after treatment. The maximal protein level in the nuclear fractions is reached 2.5 hr after GalN/TNFα administration, followed by an incomplete shuttle back to the cytoplasm after 4.5 hr. Approximately 30% of NFκB remained in the nuclear fractions. Immunohistochemical investigation revealed that NFκB was left in the nuclei of apoptotic hepatocytes. The quantification of apoptotic hepatocytes showed that about 30% of the parenchymal cells were apoptotic. It is likely that the inhibition of the protein synthesis after GalN injection also concerns the re-synthesis of IκBα. Therefore, in some hepatocytes a part of NFκB could not be transported back into the cytoplasm by IκBα. Whereas these hepatocytes were predestined for apoptotic cell death, the transport of NFκB back to cytoplasm rescued hepatocytes that survived. It should be noted that NFκB could not be found in the nuclei of non-apoptotic hepatocytes 4.5 hr after GalN/TNFα treatment. GalN depleted hepatic uridine nucleotides and formed uridine diphosphate hexosamine complexes (Keppler et al. 1970). Two hours after GalN injection the decrease of the intracellular uridine triphosphate concentration leads to a reduction in liver protein synthesis of about 40%. A return of the translational activity to control values was observed 5 hr after treatment (Leist et al. 1995). Uridine diphosphate hexosamine complexes were heterogeneously distributed in hepatocytes (Figure 9C), but large aggregates were seen in apoptotic hepatocytes (Figure 9D), showing that the transcriptional blockade affected apoptotic hepatocytes much more than non-apoptotic hepatocytes.
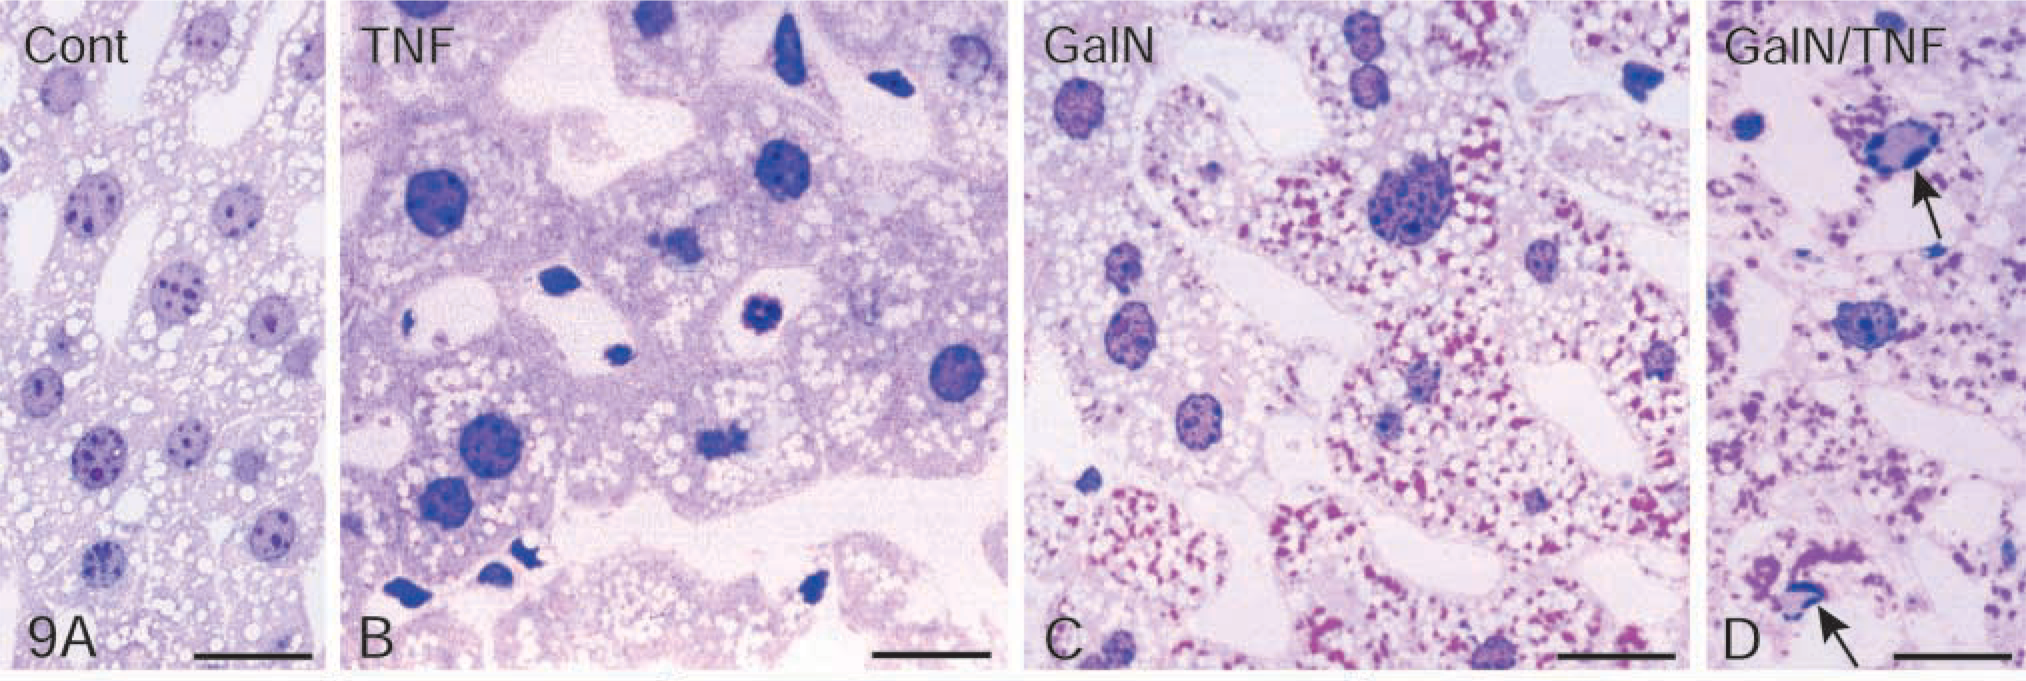
LR White-embedded semithin sections of liver tissue stained with hematoxylin/eosin. (
LR White-embedded semithin sections of liver tissue. (
Apoptosis is caused by activation of the initiator caspases-8 and caspase-9, which trigger executioner caspase-3 (Salvesen and Dixit 1999; Deveraux and Reed 1999). The activation of caspases is post-translational (Martin et al. 1998). If c-IAP2 is bound to caspase-3, which is the substrate of caspase-8 (Stennicke et al. 1998), the cascade of proteolysis leading to apoptosis is inhibited. If the gene expression of c-IAP2 is disturbed by the inhibition of NFκB activity, apoptosis takes place (Wang et al. 1998; Deveraux and Reed 1999). In our mouse model the synthesis of these protective survival proteins, encoded by NFκB, appeared to be disturbed because the caspase cascade was initiated 2.5 hr after GalN/TNFα administration, as documented by the increasing AMC fluorescence that indicates caspase-3 activity. At this time apoptotic hepatocytes could not yet be found in liver sections. Similar to the study of Nagaki et al. (2000), caspase-3 activity increased strongly 3.5 hr after GalN/TNFα treatment and apoptotic hepatocytes could occasionally be seen. Caspase-3 activity furthermore increased enormously, so that approximately 30% of the hepatocytes were apoptotic 4.5 hr after stimulation. This remarkable increase in caspase-3 activity was probably caused by an amplification loop in which caspase-3 cleaves and activates pro-caspase-9 molecules (Srinivasula et al. 1998).
In summary, we demonstrated that the shuttle of NFκB back to the cytoplasm is disturbed after GalN/TNFα treatment. Approximately 30% of NFκB remained in the nuclear fractions and could be observed in the heterochromatin of the nuclei of apoptotic hepatocytes. We suggest that the re-synthesis of IκBα was blocked in hepatocytes in which large amounts of uridine diphosphate hexosamine complexes are contained. We found that the appearance of apoptotic hepatocytes was correlated to the enormous increase of caspase-3 activity. The interaction between c-IAP2 and caspase-3 may be disturbed and free caspase-3 can then display its activity.
Footnotes
Acknowledgements
Supported by the grant An 192/2–1 by the Deutsche Forschungsgemeinschaft, Bonn Bad-Godesberg.
We thank Prof Dr A. Völkl, Prof Dr W. Plaga, and Dr Renate Bang for helpful discussions. The excellent technical assistance of Ms Annette Stradtmann is gratefully acknowledged.