
Abstract
We describe a novel high-resolution method to detect F-actin at the light and electron microscopic levels through the use of the actin-binding protein phalloidin conjugated to the fluorophore eosin, followed by photo-oxidation of diaminobenzidine. This method possesses several key advantages over antibody-based labeling and structural methods. First, phalloidin binding to F-actin can tolerate relatively high concentrations of glutaraldehyde (up to 1%) in the primary fixative, resulting in good ultrastructural preservation. Second, because both eosin and phalloidin are relatively small molecules, considerable penetration of reagents into aldehyde-fixed tissue was obtained without any perme-abilization steps, allowing 3D reconstructions at the electron microscopic level. By employing a secondary fixation with tannic acid combined with low pH osmication, conditions known to stabilize actin filaments during preparation for electron microscopy, we were able to visualize individual actin filaments in some structures. Finally, we show that fluorescent phalloidin can be directly injected into neurons to label actin-rich structures such as dendritic spines. These results suggest that the fluorescent phalloidin is an excellent tool for the study of actin networks at high resolution.
S
Phalloidin has been primarily used in studies of F-actin in cultured cells using light microscopy. We have adapted the phalloidin staining technique for studies of F-actin in slices of brain tissue at the light and electron microscopic level through the use of the fluorescent tag eosin and fluorescence photo-oxidation. Although fluorescent molecules are not in themselves visible under the electron microscope, they can be used to drive the oxidation of diaminobenzidine (DAB) to create a reaction product that can be rendered electron dense (Deerinck et al. 1994; Hand et al. 2000). This technique, known as fluorescence photo-oxidation (Maranto 1982; Sandell and Masland 1988; Deerinck et al. 1994), works by exploiting the reactive oxygen generated when certain fluorescent compounds are excited by high-intensity photon illumination. Eosin is a potent generator of reactive oxygen while still possessing moderate fluorescence (Deerinck et al. 1994).
We have used eosin-phalloidin/photo-oxidation to study the distribution of actin-rich structures in the rat central nervous system at the electron microscopic level (Capani et al. 2001) and have found that it possesses several key advantages over traditional methods of localizing actin. Chief among these was the ability to use high concentrations of glutaraldehyde (up to 1%) in the primary fixative, which resulted in vastly improved ultrastructural preservation compared to immunocytochemical methods. Using this approach, we determined that F-actin was concentrated in only a subpopulation of dendritic spines and we were able to derive some detailed observations on the organization of actin filaments in the spine head (Capani et al. 2001). Here we provide detailed methods for localizing F-actin using eosin-phalloidin and fluorescence photo-oxidation.
Materials and Methods
Materials
Eosin-phalloidin and rhodamine-phalloidin, phalloidin-Alexa-488, and Alexa568 were obtained from Molecular Probes (Eugene, OR). 3,3′-Diaminobenzidine tetrahydrochloride (DAB), coldwater fish gelatin, and the anti-β actin antibody were purchased from Sigma (St Louis, MO). Paraformaldehyde, EM grade glutaraldehyde, sodium cacodylate, and Durcupan ACM resin were obtained from Electron Microscopy Sciences (Ft Washington, PA). Special glass bottom-welled tissue culture plates were obtained from MatTek (Ashland, MA). Cell-Tak adhesive was obtained from Collaborative Research (Bedford, MA).
Tissue
We used seven adult male Sprague-Dawley rats in this study. Briefly, intracardiac perfusion was performed under deep anesthesia (containing 50 mg/kg ketamine, 1 mg/kg rhompun, and 5 mg/kg acetopromazine in sterile saline) with normal rat Ringer's at 35C, followed by fixative. For light microscopic analyses, rats were perfused with 4% formaldehyde (made fresh from paraformaldehyde) in cacodylate buffer, pH 7.2. For β-antibody studies the animals were perfused with 4% paraformaldehyde, 0.1% glutaraldehyde. The brains were removed and fixed for 2 additional hours in the same solution at 4C. For electron microscopic studies, a range of fixative strengths was evaluated, containing either 2% or 4% formaldehyde or 0.5%–2.5% glutaraldehyde. The tissue was postfixed for 2 hr in the same fixative. After removal of the brain from the skull, coronal or sagittal sections through neostriatum, cerebellum, and hippocampus were cut at a thickness of 50–80 μm on a Leica Vibratome, model VT 1000E.
Cultured Cells
As a control, we also labeled cultured bovine aortic endothelial cells (BAECs) fixed using the same conditions as above. These cells possess characteristic bundles of actin filaments called stress fibers. Details about culturing methods are given in Deerinck et al. (1994).
Staining Sections with Phalloidin
Vibratome sections were washed with 50 mM glycine-PBS containing 0.5% coldwater fish gelatin to block nonspecific binding. After 30 min of washing, sections were incubated with agitation in a solution of 4 U eosin-phalloidin and 0.5% coldwater fish gelatin-50 mM glycine-PBS for 2 hr. For light microscopic studies, phalloidin conjugated to rhodamine was also used because of its superior fluorescent quantum yield. As a negative control, the eosin-phalloidin was omitted.
Immunolabeling
After repeated rinsing in 0.1 M PBS, sections were blocked for 30 min in PBS containing 1% normal donkey serum, 1% bovine serum albumin, 1% coldwater fish gelatin, and 0.2% Triton X-100. Sections were placed in the primary antibody against β-actin (dilution 1:100) in 0.1 × strength blocking buffer (working buffer) and incubated on a rotator overnight at 4C. After several washes in working buffer, a secondary antibody conjugated to FITC was applied for 1 hr at room temperature. For electron microscopic studies, an immunoperoxidase procedure was employed. After incubation in the primary antibody, the tissue was washed in PBS and incubated for 1 hr in biotinylated anti-mouse IgG (1:200; Vector Laboratories, Burlingame, CA). The tissue was washed and then incubated for 1 hr in the avidin-biotin-horseradish peroxidase complex (Vector) according to the manufacturer's instructions. The antigen was visualized by reaction with DAB, postfixed with 1% osmium tetroxide for 20 min, dehydrated in ascending alcohols, and flat-embedded in Durcupan (Fluka; Milwaukee, WI). Ultrathin sections were observed on a JEOL 100CX electron microscope.
Procedures for immunolabeling cultured cells for tubulin using secondary antibodies conjugated to eosin, followed by photo-oxidation, can be found in Deerinck et al. (1994).
Confocal Microscopy
Fluorescent microscopy was performed on a Zeiss Axiovert 35 M inverted light microscope using either a ×63 1.4 NA or ×40 1.3 NA objective lens. Fluorescent and transmitted light images were recorded using a laser scanning confocal attachment (MRC-1024; Bio-Rad Laboratories, Cambridge MA) and a krypton-argon laser.
Photo-oxidation
The procedure for photoconversion described here follows that of Deerinck et al. (1994) and Capani et al. (2001). Just before a confocal imaging session, the following solutions were prepared: 2.8 mM DAB containing 6 mM potassium cyanide in cacodylate buffer and 100 mM glycine buffer, all chilled to 4C. The potassium cyanide is used to minimize photoconversion of DAB by mitochondria, which contributes to nonspecific background in the sample.
Tissue sections labeled previously with eosin-phalloidin were washed several times with cacodylate buffer and then mounted on glass-welled tissue culture dishes (see above) pretreated with Cell Tak adhesive. Slices were fixed again for 2–5 min with 2% glutaraldehyde in 0.1 M cacodylate buffer, rinsed in buffer for several minutes, and placed in 50 mM glycine. The appropriate areas were located with transmitted light and the pattern of fluorescent labeling was recorded using the confocal attachment at a low laser power setting. The samples were immersed for 10 min in the DAB solution at 4C bubbled with pure O2 and then irradiated under conventional epifluorescence using a 75-W Hg lamp and a fluorescein filter set. The DAB solution was changed every few minutes while the reaction proceeded. During this process, the fluorescence faded quickly and brownish reaction product began to appear in place of fluorescence. The reaction was followed using transmitted light. When brown reaction product first began to appear (usually between 6–8 min after beginning irradiation), the reaction was stopped by blocking fluorescence excitation.
Preparation of Samples for Electron Microscopy
After photo-oxidation, the samples were rinsed in 0.1 M sodium cacodylate buffer several times and incubated in 1% osmium tetroxide in 0.1 M sodium cacodylate, pH 7.4, for 30 min. Some sections were fixed for 1 hr in 2.25% glutaraldehyde in cacodylate buffer with 0.2% tannic acid added. Osmication was done with 0.75% OsO4 in cacodylate buffer, pH 6, for 1 hr on ice according to the procedure described by Pollard and Maupin (1982). After several washes with ddH2O, slices were dehydrated in an ascending ethanol series, infiltrated with Durcopan ACM resin, and polymerized for 24 hr at 60C.
Electron Microscopy
Thin sections (80–100 nm) and thick sections (0.5–1 μm) were cut with a Reichert Ultracut E ultramicrotome using glass knives. Thin sections were examined using a JEOL 100CX electron microscope at 80–100 keV and thick sections were observed using a JEOL JEM-4000EX intermediate voltage microscope (IVEM) at 400 keV. One set of thin sections was post-stained with a combination of uranyl acetate and lead citrate. Methods for 3D reconstruction using serial sections and electron tomography can be found in Capani et al. (2001).
Injection of Fluorescent Phalloidin into Single Cells
Three male Sprague-Dawley rats were anesthetized and perfused transcardially with Ringer's solution followed by 4% paraformaldehyde in PBS. The brain was postfixed in toto at 4C for 3 hr in the same fixative. The cerebellum was cut into 100-μm-thick sagittal vibratome slices. The slices were stored in ice-cold PBS until they were used. The slices were viewed in cold PBS with an Olympus BX50WI infrared differential interference contrast/epifluorescent microscope (Olympus; Melville, NY) using a ×60 water immersion objective. Sharp glass micropipettes were pulled on a vertical pipette puller (David Kopf Instruments; Tujunga, CA) using Omegadot capillary tubes (OD 1.00 mm, ID 0.58 mm; resistances ranged between 100 and 400 MΩ). Purkinje cells were selected on the basis of appearance and filled with a solution containing both 10 mM phalloidin-Alexa488 and Alexa568 in 200 mM potassium chloride using a glass micropipette controlled by Narishige micromanipulators by applying a 0.5-sec negative current pulse (1 Hz). Once the Purkinje cells were filled, as determined by epifluorescent illumination, the tissue slices were fixed in 4% paraformaldehyde for 10–15 min. The slices were then mounted on glass slides and coverslipped in Gelvatol. Dual channel z-series were obtained of Purkinje cells containing phalloidin-Alexa using a Biorad laser scanning confocal microscope (×63 Zeiss oil immersion, 1.4 N, 0.319 μm pixel size, 0.18–μm z-step). The confocal data sets were processed, merged, and analyzed using the Imaris visualization package (Bitplane; Zurich, Switzerland).
Results and Discussion
Distribution of F-Actin in the Rat CNS
Because eosin possesses only 20% the fluorescence quantum yield of more conventional fluorophores, such as fluorescein and rhodamine, we first compared the overall fluorescence pattern obtained with phalloidin conjugated to eosin, rhodamine, and Alexa488 (Figure 1). Although the overall fluorescence was weaker, the patterns of staining obtained with the eosin conjugates were similar to those of the other fluorophores (Figure 1C vs Figure 1D).
In tissue fixed with 4% paraformaldehyde, we observed the strongest staining in brain areas known to be rich in dendritic spines (Figure 1). In these brain regions, phalloidin labeling appeared as a dense background of bright punctate staining. As we reported in our previous study (Capani et al. 2001), these punctate structures correspond to individual dendritic spines, the small protuberances found on the dendrites of many types of neurons in the CNS. Spines are the major sites of excitatory synaptic input in the CNS and possess among the highest concentrations of actin of any structure in the mature rat brain (Fifkova and Delay 1982; Matus et al. 1982; Cohen et al. 1985). The selective concentration of F-actin in dendritic spines was also observed in Purkinje cells injected with fluorescent phalloidin in fixed slices of cerebellum (Figure 2). In these preparations, dendritic spines stood out against a more lightly labeled dendritic shaft (Figure 2B). The selectivity in staining revealed many more spines emanating from the large-caliber dendrites than are typically visible with intracellular injection of nonspecific fluorescent dyes, such as Lucifer Yellow, and may prove useful for visualizing dendritic spines on individual neurons using light microscopy. Unfortunately, we were unable to inject eosin-phalloidin using the same protocol, even with various injection currents and vehicles. We attribute this lack of success to the fact that the eosin-phalloidin conjugate may not possess sufficient charge for iontophoresis. We are now investigating other methods for delivery.
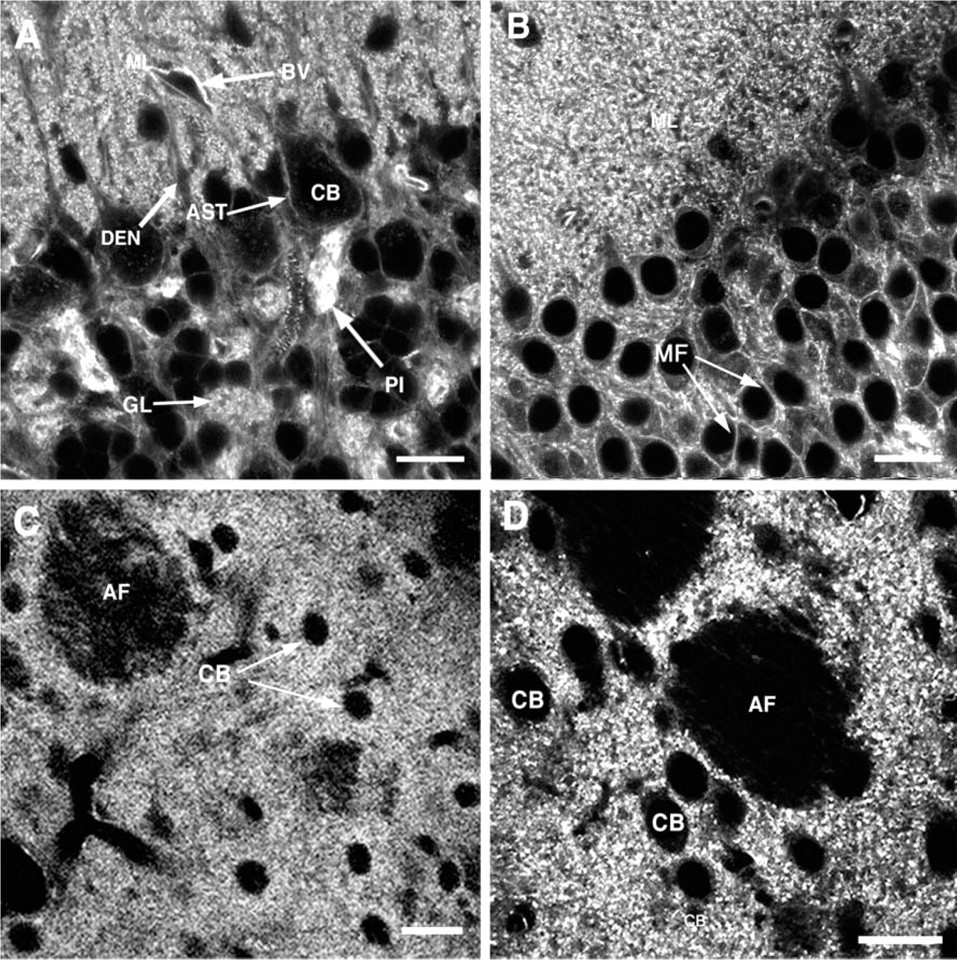
Light microscopic images of phalloidin labeling in regions of rat brain with high concentrations of dendritic spines. (
Although staining was most concentrated and consistent in dendritic spines, we also observed intense and consistent staining in a subset of additional structures in the CNS, including the cerebellar glomeruli, certain axons and dendrites, and in some astrocytic processes (Figures 1 and 3). Many of these structures also were stained with an antibody against β-actin (Figure 3), although the pattern of staining was not identical between the two methods. For example, in the cerebellum labeling of glial cells was much more prominent in the immunolabeled material, whereas perivascular labeling was more notable in the phalloidin tissue (Figure 3). Differences between phalloidin and antibody labeling should be expected because phalloidin is specific for F-actin, whereas antibodies usually do not distinguish between F- and G-actin (Fifkova 1985). Antibodies also usually recognize only a single isoform, whereas phalloidin does not distinguish among isoforms (Fifkova 1985). The brain contains both β- and γ-actin, which are differentially distributed in some structures (Micheva et al. 1998).
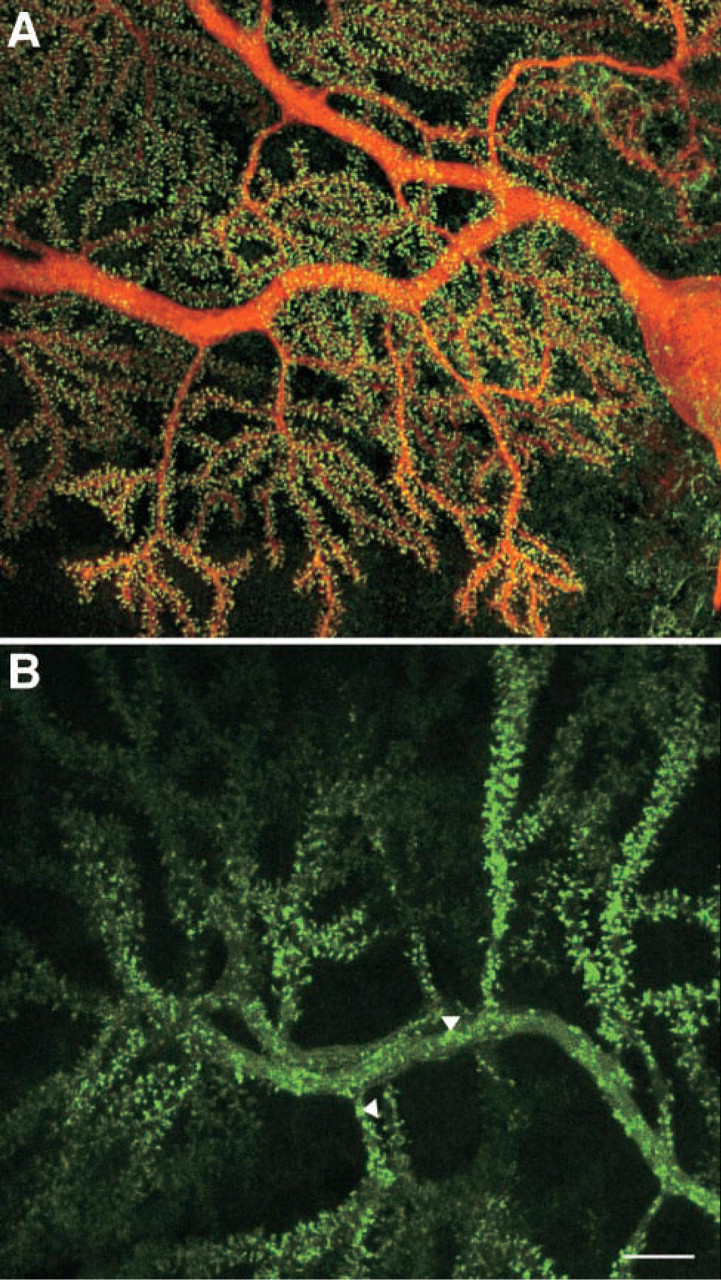
Confocal images of individual Purkinje neurons injected with a combination of Alexa568 and phalloidin conjugated to Alexa488. (
Fixation
Using the pattern of staining obtained with 4% paraformaldehyde as a baseline, we then tested a range of fixative strengths to determine the effect of fixation on the pattern of staining and the penetration of phalloidin into the tissue. Concentrations of glutaraldehyde up to 1% in 4% paraformaldehyde did not alter the overall pattern of staining and did not interfere with the penetration or fluorescence signal of phalloidin into the tissue, as evaluated by optical sectioning using the confocal microscope. A vertical section through the molecular layer of a 70-μm-thick hippocampal slice stained with eosin-phalloidin is shown in Figure 4. Note the uniform punctate staining observed through the thickness of the section, even without the addition of detergents in the incubation solutions. Tissue fixed with higher concentrations of glutaraldehyde required twice as long to photo-oxidize, leading to a decrease in structural preservation.
Photo-oxidation of Eosin-Phalloidin
Regions exhibiting a moderate to intense fluorescent signal with phalloidin-eosin readily photoconverted in the presence of DAB. As a test system for the sensitivity and resolution of the technique, we labeled cultured BAECs with phalloidin-eosin. As shown in Figure 4, the stress fibers are clearly labeled, as is the subcortical actin at the LM level. Figure 4C shows an electron micrograph taken with intermediate voltage electron microscopy of a 0.5-μm-thick section through the same cell pictured in Figure 4B after photo-oxidation. The photo-oxidized image shows a faithful correspondence (arrows in Figures 4B and 4C) to the LM image with additional detail visible because of the higher resolution. A thin section through a heavily labeled actin bundle (arrow) is shown in Figure 4D. As we have reported previously (Deerinck et al. 1994), the resolution of the photo-oxidation reaction product is quite good, with minimal diffusion of reaction product away from the actin bundles. In BAECs either labeled with phalloidin-eosin or immunolabeled with anti-tubulin and detected with eosin-conjugated antibodies and photo-oxidation, labeling of actin bundles and microtubules was clearly distinguishable. In phalloidin-labeled material, bundles of actin filaments were distinctly labeled (arrow in Figure 4D) and nearby microtubules (arrowhead in Figure 4D) were unlabeled, whereas in the tubulin-immunolabeled material, microtubules were labeled strongly and actin bundles coursing through the cytoplasm were not (Figure 4E). We attribute the excellent resolution to the use of high concentrations of glutaraldehyde in the primary fixative and before photo-oxidation. The extensive crosslinking of the tissue may limit the spread of reaction product.
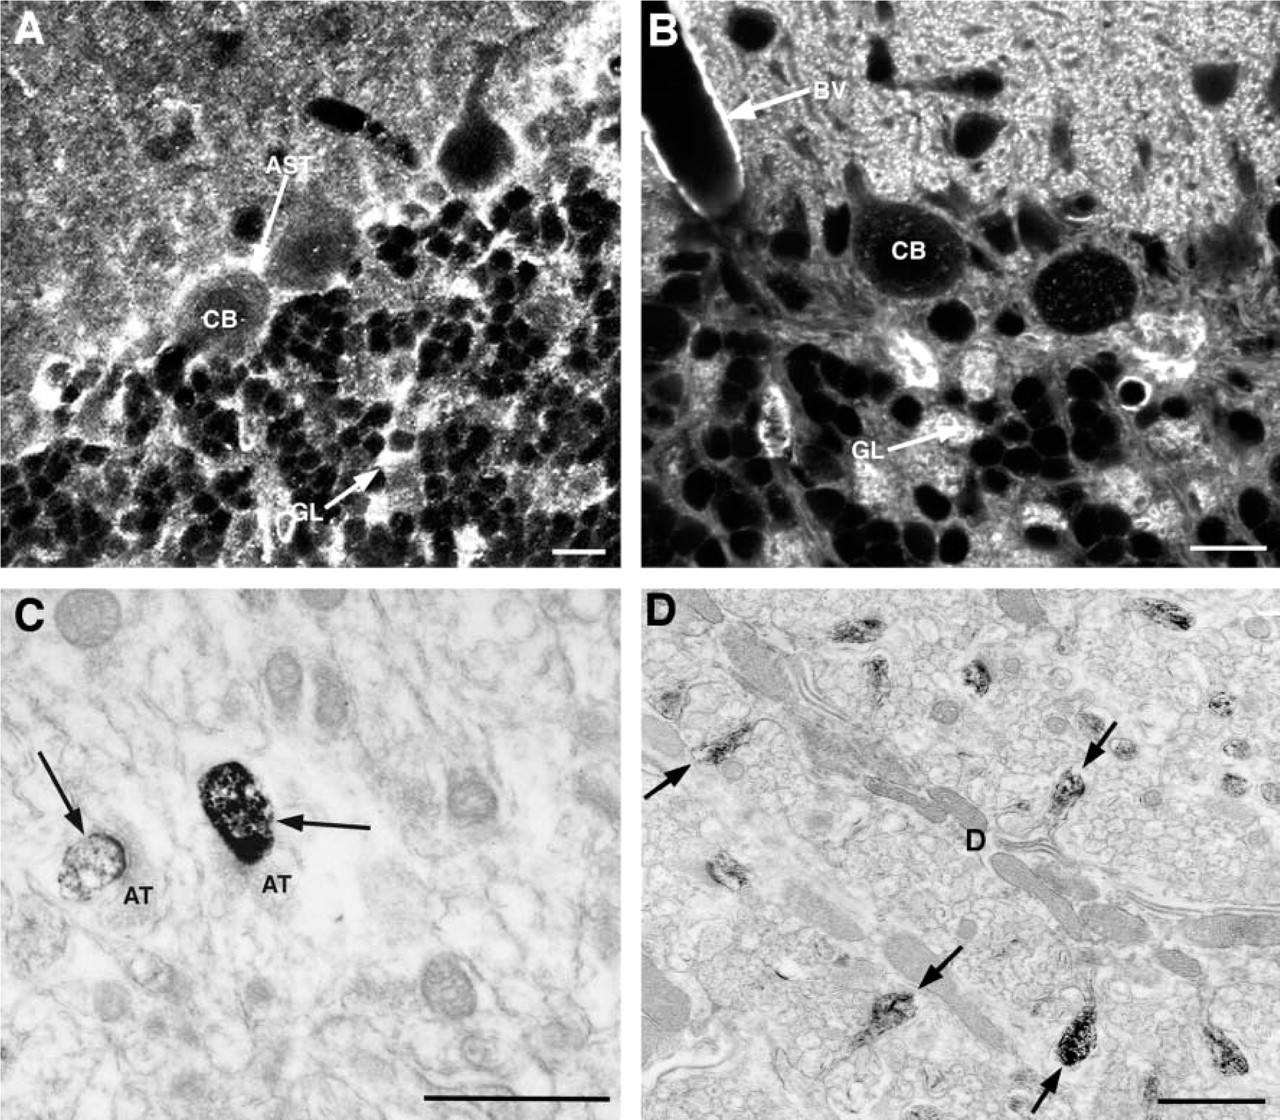
Light and electron microscopic comparison of cerebellum labeled with an antibody against β-actin (
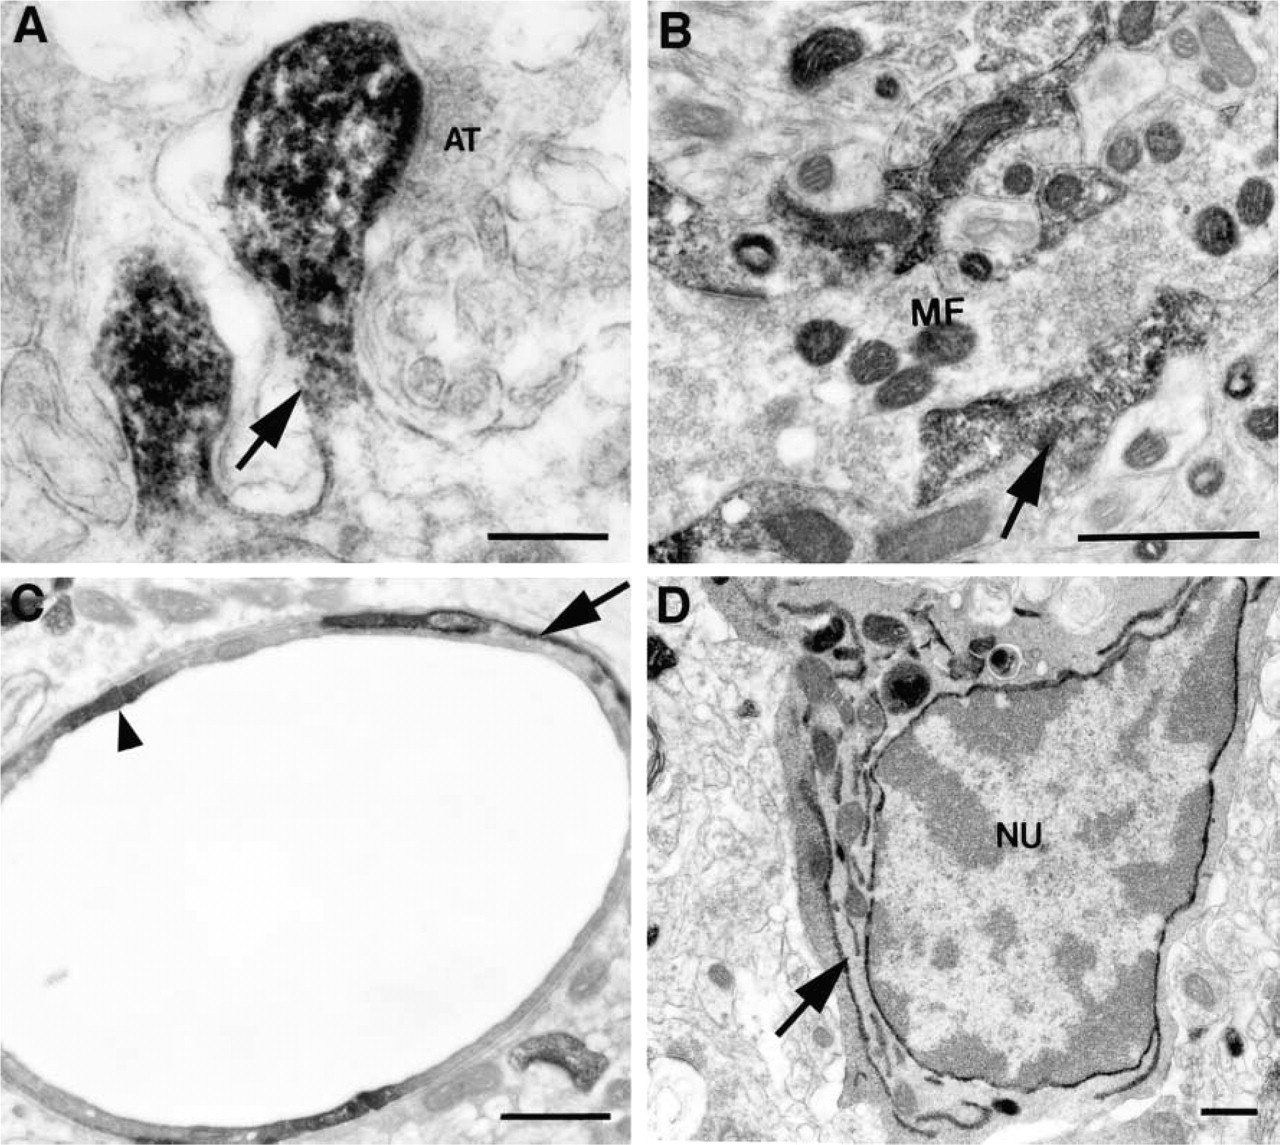
In sections of brain tissue, we also found a good correspondence between the light and electron microscopic images. As described above, in a given brain region only a subset of structures showed appreciable labeling with phalloidin. For example, in the cerebellar cortex, the most intense labeling was observed in dendritic spines in the molecular layer and in the mossy fiber glomeruli and pinceau region in the granule cell layer and surrounding the vasculature (Figure 1A). Astrocytic processes surrounding the Purkinje cell soma were detectable at the LM level but were more weakly stained than these other structures (AST in Figure 1A), whereas the main dendrites of Purkinje cells and the cell somas of interneurons in the molecular layer showed only diffuse light labeling. The intensity of labeling at the LM level affected the consistency and intensity of photo-oxidation reaction product at the EM level. The most intensely stained structures, e.g., dendritic spines and cerebellar glomeruli, photoconverted readily and were observed in every section examined (Figures 5A and 5B). Structures displaying only light diffuse labeling, such as major dendrites, did not show detectable labeling under the electron microscope (Figures 3D and 5A).
The overall distribution of F-actin agreed well with reports from structural and immunocytochemical studies (Fifkova and Delay 1982; Matus et al. 1982; Micheva et al. 1998). In brain, dendritic spines are reported to have the highest concentrations of actin, and this was clearly reflected in the pattern of phalloidin staining. One curious finding was the presence of photo-oxidation reaction product within the lumen of the endoplasmic reticulum and between the double nuclear membrane in microglial cells (Figure 5D). Microglia were consistently labeled in all brain regions examined but, within the cell soma, the labeling was always concentrated in the endoplasmic reticulum, particularly between the double nuclear membrane. Although F-actin has been clearly associated with the endoplasmic reticulum, actin filaments are not known to be concentrated in the lumen (Zapun et al. 1999). However, LM studies of cultured microglia labeled with phalloidin have reported that phalloidin is concentrated in a perinuclear zone in these cell types (Cross and Woodroofe 1999). Our results suggest that this perinuclear staining is associated with the nuclear membrane. Phalloidin binds to F-actin by intercalating between actin monomers (Cooper 1987). Unless the ER of microglia contains F-actin, the photo-oxidation results suggest that phalloidin may bind to other classes of molecules in very limited circumstances.
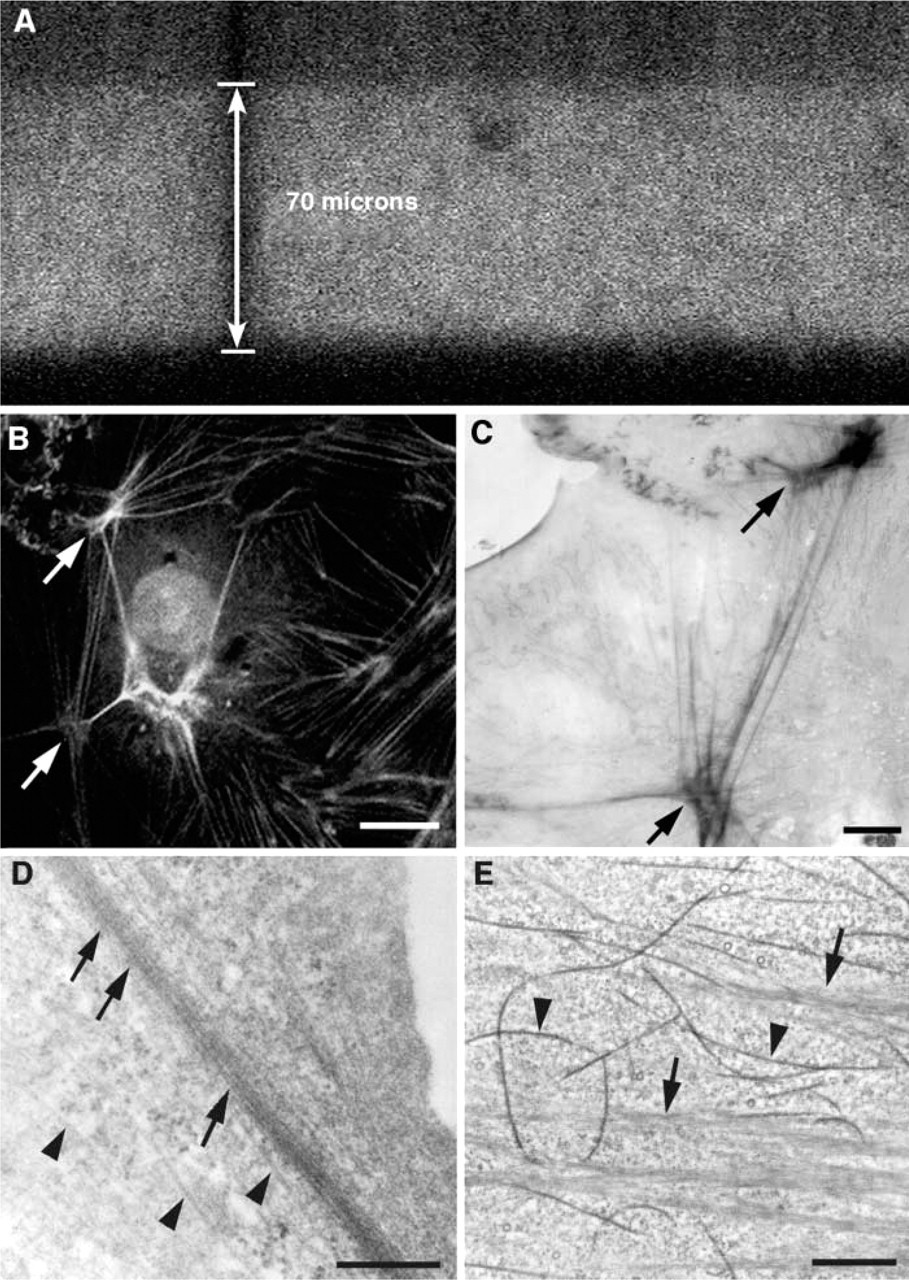
Light and e ectron microscopic images demonstrating penetration and specificity of phalloidin staining-photo-oxidation. (
The use of phalloidin-eosin plus photo-oxidation is very helpful in EM identification structures rich in actin filaments because LM examination can be used to identify such structures before sectioning for EM. Using purely structural methods to identify relatively sparse F-actin-rich structures at the EM level would be very difficult in a complex tissue such as brain. However, although we could determine which structures were rich in F-actin by the presence of photo-oxidized DAB, we could not resolve individual actin filaments in labeled structures in brain tissue. Actin filaments are sensitive to osmium fixation, which can destabilize actin filaments even after glutaraldehyde treatment (Maupin and Pollard 1978). Phalloidin itself stabilizes the actin filaments, but apparently not to the extent that the actin filaments can survive the embedding procedure. To protect actin filaments during osmication and subsequent dehydration, we employed a secondary fixation with tannic acid after the photo-oxidation and then osmicated the tissue at pH 6 (Fifkova and Delay 1982; Pollard and Maupin 1982). With this approach, we were able to detect bundles of actin filaments in dendritic spines between the lamellae of the spine apparatus (Figures 6A-6C) and in Purkinje cell spines, associated with the endoplasmic reticulum and postsynaptic density (Figure 6D). In the cultured cells, actin filaments were readily visible, even without pretreatment with tannic acid (Figure 4), perhaps due to the use of a cytoskeletal stabilizing buffer during primary fixation (see Deerinck et al. 1994 for details).
Electron microscopic localization of phalloidin in rat brain structures after photo-oxidation. (
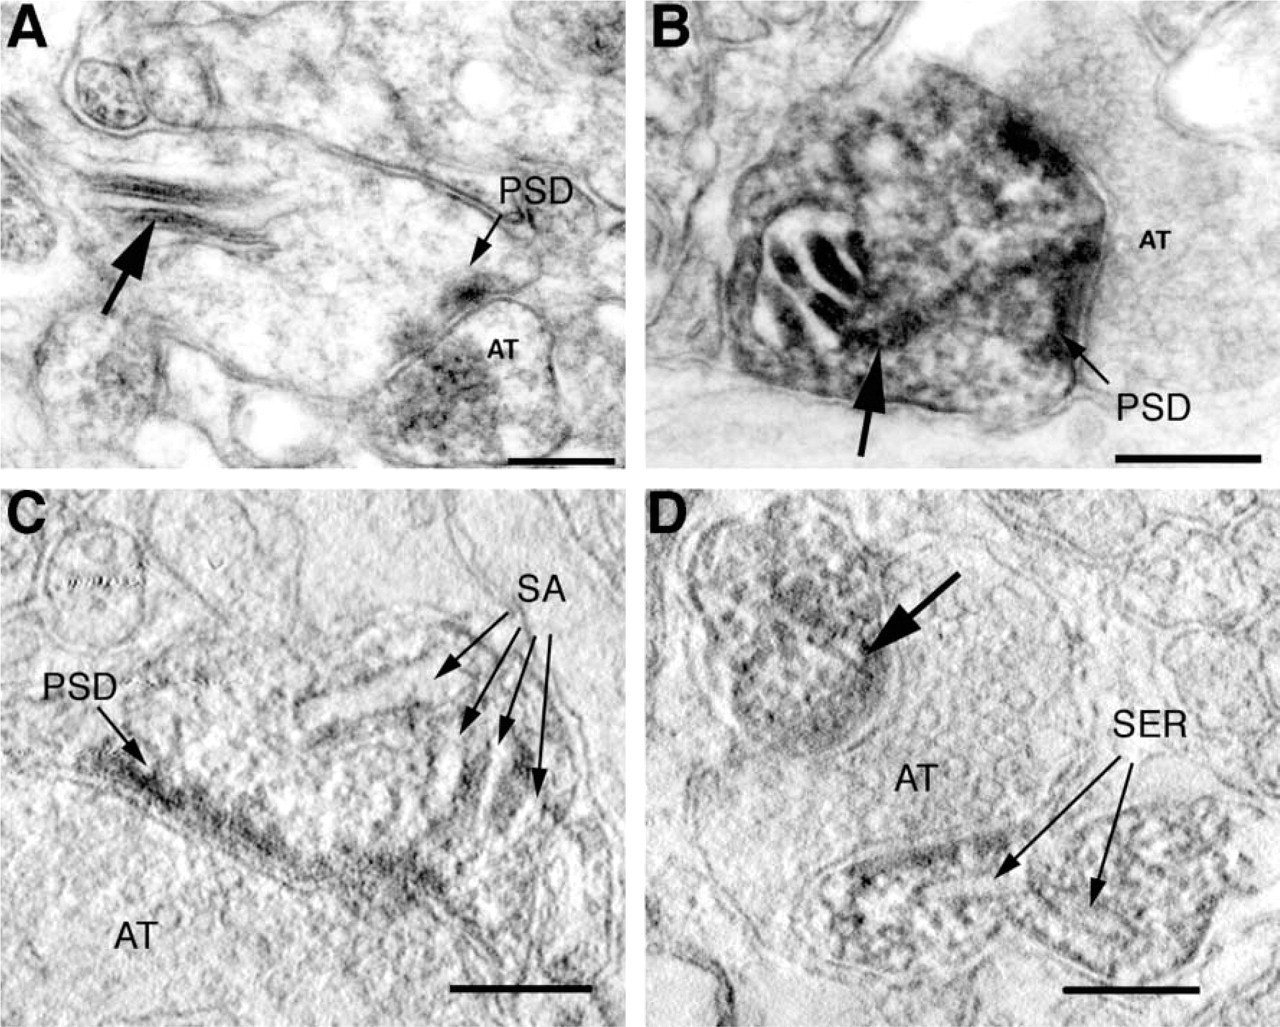
High-magnification electron micrographs of phalloidin labeling in dendritic spines illustrating the effect of stabilization of actin filaments before dehydration. (
3D Reconstructions at the EM Level
At the LM level we observed penetration of phalloidin-eosin through the entire depth of the tissue without detergent pretreatment. However, photo-oxidation appeared to be restricted to the surface of the section and did not extend beyond 8–10 μm or so into the tissue. Photo-oxidation is dependent on the generation of reactive oxygen species (Deerinck et al. 1994), and therefore the lack of photo-oxidation in the depths of the tissue may have been due to lack of oxygen. It also may be due in part to attenuation of the illumination level within the depths of the tissue. Nevertheless, the depth of labeling was sufficient to study the 3D morphology of most labeled structures using serial section reconstruction. Serial section analysis was aided by the excellent membrane preservation due to the high concentration of glutaraldehyde and the lack of detergent pretreatments. Using this technique, Capani et al. (2001) found that F-actin was concentrated in only subpopulations of dendritic spines in the hippocampus, striatum and dentate gyrus. Spines exhibiting intense F-actin staining in these brain regions were distinguished by their large size and expanded head (Figures 7A-7D).
Three-dimensional reconstructions were also performed at higher resolution using electron tomography. We employed tomography to study the organization of actin networks in material prepared with tannic acid (see above) and photo-oxidation. Electron tomography has the advantage of producing computed slices through the volume which are thinner than can be prepared using physical sectioning (see discussion in Lenzi et al. 1999). Examples of such computed slices are shown in Figures 6C and 6D, in which a dense web of filamentous structures surrounded by reaction product is visible in the heads of spines. Although it was very difficult to follow individual filaments because of their small size and the density of the labeling in the spine head, labeled filaments were seen radiating from the spine apparatus in hippocampal spines (Figure 6C) and from the endoplasmic reticulum in Purkinje cell spines (Figure 6D). As we have described in Capani et al. (2001), reconstructions from the tomographic volumes clearly demonstrated the continuity of the actin bundles between the lamellae of the spine apparatus with the postsynaptic density.
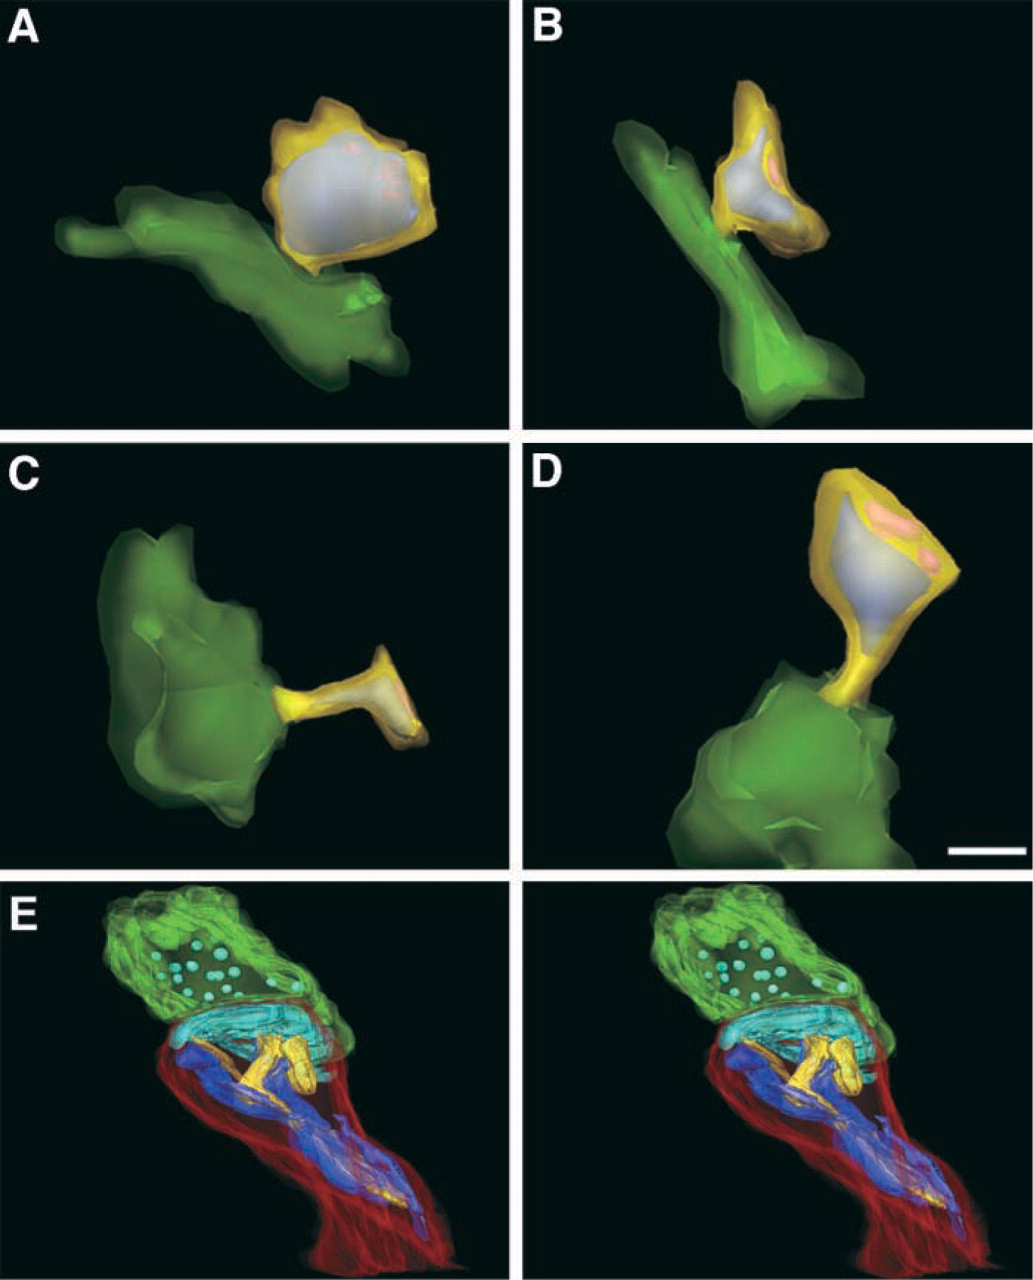
Three-dimensional reconstructions of F-actin distribution in dendritic spines using either serial sections (
Conclusions
Phalloidin-eosin is a useful method for studying structures rich in F-actin at both the light and electron microscopic levels. This technique has several advantages over antibody- and structure-based methods including (a) the ability to perform correlative light and electron microscopy studies, (b) excellent ultrastructural preservation due to the use of high concentrations of glutaraldehyde and the lack of detergent pretreatments, (c) the good spatial resolution of EM labeling compared to peroxide-based methods, and (d) its compatibility with 3D electron microscopic techniques. Phalloidin-eosin photo-oxidation thus offers a relatively simple technique for gaining additional information about actin-rich structures at high resolution using electron microscopic analysis.
Footnotes
Acknowledgment
Supported by NIH grants RR04050, DC03192, and DA02854.