
Abstract
Two types of NADP-dependent isocitrate dehydrogenases (ICDs) have been reported: mitochondrial (ICD1) and cytosolic (ICD2). The C-terminal amino acid sequence of ICD2 has a tripeptide peroxisome targeting signal 1 sequence (PTS1). After differential centrifugation of the postnuclear fraction of rat liver homogenate, approximately 75% of ICD activity was found in the cytosolic fraction. To elucidate the true localization of ICD2 in rat hepatocytes, we analyzed the distribution of ICD activity and immunoreactivity in fractions isolated by Nycodenz gradient centrifugation and immunocytochemical localization of ICD2 antigenic sites in the cells. On Nycodenz gradient centrifugation of the light mitochondrial fraction, ICD2 activity was distributed in the fractions in which activity of catalase, a peroxisomal marker, was also detected, but a low level of activity was also detected in the fractions containing activity for succinate cytochrome C reductase (a mitochondrial marker) and acid phosphatase (a lysosomal marker). We have purified ICD2 from rat liver homogenate and raised a specific antibody to the enzyme. On SDS-PAGE, a single band with a molecular mass of 47 kD was observed, and on immunoblotting analysis of rat liver homogenate a single signal was detected. Double staining of catalase and ICD2 in rat liver revealed co-localization of both enzymes in the same cytoplasmic granules. Immunoelectron microscopy revealed gold particles with antigenic sites of ICD2 present mainly in peroxisomes. The results clearly indicated that ICD2 is a peroxisomal enzyme in rat hepatocytes. ICD2 has been regarded as a cytosolic enzyme, probably because the enzyme easily leaks out of peroxisomes during homogenization. (
Keywords
I
Both isozymes have been purified from several mammals and their cDNA sequences were determined (Plaut et al. 1983; Haselbeck et al. 1992; Huh et al. 1993; Jennings et al. 1994; Loftus et al. 1994; Yang et al. 1996; Nekrutenko et al. 1998). ICD1 and ICD2 are homodimers encoded in the nuclear genome (Loftus et al. 1994). NAD-dependent ICD catalyzes a key step in the tricarboxylic acid cycle, whereas the physiological roles of ICD1 and ICD2 are not clearly understood. When rat liver homogenate is separated into particulate and cytosolic fractions by differential centrifugation, 76% of ICD activity is recovered in the cytosolic fraction and only 24% of the activity is detected in the particulate fraction (Leighton et al. 1968). ICD was shown to be distributed in peroxisomes by isopyknic centrifugation analysis of the light mitochondrial fraction of rat liver. Many peroxisomal matrix proteins have two types of peroxisomal targeting signals; a tri-peptide signal (A/SKL) at the C-terminus (PTS1), and a nonapeptide (R/K)(L/V/I)X5(H/ Q)(L/A) at the N-terminus (PTS2) (Subramani 1993). ICD2 of eukaryotic cells has PTS1 (Nekrutenko et al. 1998), suggesting that ICD2 might be imported to peroxisomes rather than remaining in the cytosol. In the case of rat liver catalase, approximately 60% of the activity is associated with the particular fraction and 40% with the cytosol when homogenization is performed in 0.25 M sucrose in appropriate buffer solution (Holmes and Masters 1972). However, immunoenzyme and immunoelectron microscopy showed that rat liver catalase was distributed exclusively in the peroxisomes but not in the cytoplasmic matrix (Yokota and Fahimi 1981; Yokota 1990). However, in some animals, such as monkey and guinea pig, liver catalase was cytochemically detected in the cytoplasmic matrix and nucleoplasm and in peroxisomes (Roels et al. 1977). It is likely that ICD2 is also distributed in both the peroxisomes and the cytoplasmic matrix.
The peroxisomal membrane is very fragile, and therefore catalase, as well as other soluble enzymes, can leak out of peroxisomes into the cytosol during homogenization (Alexson et al. 1982). Therefore, it is likely that ICD2 detected in the cytosolic fraction has leaked out from peroxisomes, although the amounts of leaked ICD2 are much greater than those of catalase. In a biochemical study, human ICD2 was reported to be a cytosolic and peroxisomal enzyme in the liver, despite an AKL signal sequence at its C-terminus (Geisbrecht and Gould 1999). In some cell types that have only small numbers of peroxisomes, ICD2 was shown to be biochemically localized in the cytosol (Jennings and Stevenson 1991; Sun et al. 1999). Therefore, subcellular distribution of ICD2 is dependent on the methods used for analysis and the tissues examined. Although immunoelectron microscopic localization of ICD2 in plant cells has been reported (Gálvez et al. 1996), in mammals the localization of ICD2 has not yet been studied at the electron microscopic level. In this study we investigated the biochemical and immunocytochemical localization of ICD2 in the rat liver. The results clearly showed that the enzyme is distributed mainly in the peroxisomes in rat liver.
Materials and Methods
Animals
Male Wistar rats, weighing 180–200 g, and Japanese White rabbits, weighing 3–4 kg, were fed on standard diets for each animal and water ad libitum until use. The animal experiments were performed in accordance with the Guidance for Animal Experiments, Yamanashi Medical University.
Purification of ICD2 from Rat Liver
ICD2 was purified from rat liver homogenate according to a slight modification of the method of Seelig and Colman (1976). Frozen rat liver (100 g) was thawed, minced with a razor blade, and added to 260 ml of cold homogenization solution, consisting of 18 mM Tris-citrate buffer (pH 7.0), 1 mM manganese sulfate, 0.3 mM sodium sulfate, and 10% glycerol. The tissue was homogenized in a Hitachi blender in an ice bath for 2 min. The homogenate was centrifuged at 100,000 × g for 30 min at 4C in a Hitachi ultracentrifuge using an RP50 rotor. The precipitate was discarded. Solid ammonium sulfate was added to the supernatant to 90% saturation. The mixture was allowed to stand for 45 min at room temperature (RT), and then centrifuged at 20,000 × g for 20 min at 20C. The supernatant was discarded and the precipitate was dissolved in the homogenization solution. The enzyme solution (about 150 ml) was dialyzed for 24 hr against 1 liter of 1 mM Tris-citrate buffer (pH 7.0) containing 10% glycerol, with six changes of buffer. The dialyzed solution was applied to a DEAE–Sephacel (Pharmacia Japan; Tokyo, Japan) column equilibrated with 1 mM Triscitrate buffer (pH 7.0) containing 10% glycerol and eluted with the same buffer. Flow-through fractions containing about 90% of the applied enzyme were then applied to a Blue Dextran–Sepharose (Pharmacia Japan) column equilibrated with the same buffer, and the column was then washed with 18 mM Tris-citrate buffer (pH 7.0) containing 10% glycerol. The enzyme was eluted with the same buffer containing 1 mM NADP and 10% glycerol and concentrated by ultrafiltration with an ultrafiltration membrane (Amicon; Danvers, MA) to about 10 ml. The enzyme solution was then gel-filtered on an Ultrogel AcA 44 column (LKB; Uppsala, Sweden). Fractions with the enzyme activity were collected. The overall purification was approximately 530-fold.
Antibodies
Rabbit antibody to ICD2 was prepared as follows. Two ml of purified ICD2 solution containing 4 mg was emulsified with the same volume of Freund's complete adjuvant. The emulsion containing 400 μg ICD2 was injected four times at intervals of 2 weeks into the back of Japanese White rabbits. Two weeks after the last injection, blood was collected and tested for immunoreactivity with the enzyme. Guinea pig anti-rat liver catalase antibody and rabbit anti-rat liver catalase antibody were prepared as described previously (Yokota and Fahimi 1981). Rabbit antibody to acyl-CoA dehydrogenase was a gift from Dr. Hashimoto (Shinshu University School of Medicine). Alexa 549-labled goat anti-guinea pig IgG was obtained from Molecular Probes (Eugene, OR). Cy2-labeled goat anti-rabbit IgG was obtained from Jackson ImmunoResearch Laboratories (West Grove, PA).
Protein A–Gold and IgG–Gold Probes
Two kinds of colloidal gold (15 nm and 8.5 nm in diameter) were prepared by the method of de Roe et al. (1987). Protein A (Pharmacia Japan) was conjugated with 15-nm colloidal gold and affinity-purified rabbit anti-mouse IgG was conjugated with 8.5-nm colloidal gold (Slot and Geuze 1984). The colloidal gold probes were finally mixed with 40% glycerol–PBS and stored at −20C.
Differential Centrifugation
Ten percent rat liver homogenate (W/V) in 0.2 M mannitol + 10 mM HEPES–KOH (pH 7.4) + 0.2% ethanol was prepared in a Potter–Elvehjem homogenizer with a Teflon pestle. The homogenate was centrifuged at 1900 × g for 10 min with a Kubota Centrifuge 1710 (Kubota; Tokyo, Japan) using an RA228J rotor to remove cell debris and nuclei. The supernatant was centrifuged at 22,000 × g for 20 min. The resulting pellet was gently suspended in homogenization solution and used as light mitochondrial fraction. The supernatant was centrifuged at 100,000 × g for 60 min with a Hitachi ultracentrifuge (Hitachi; Tokyo, Japan) using an RP50 rotor. The resulting pellet was referred to as the microsomal fraction and the supernatant the cytosolic fraction. Each fraction was stored at −70C until use.
Nycodenz Gradient Centrifugation
The method used was based on that described by Osmundsen (1983). The light mitochondrial fraction (1 ml) isolated as described above was loaded onto 22 ml of pre-centrifuged Nycodenz (Sigma/Aldrich Japan; Tokyo, Japan) gradient + 1 ml of 60% sucrose cushion and centrifuged at 63,000 × g for 30 min using a Hitachi RP50 rotor. The gradient was separated into 24 test tubes by siphoning from the bottom.
Enzyme Assay
Catalase,
Immunotitration
Quantitative precipitation reactions were carried out with the purified ICD2 and a fixed amount of the antibody in the presence of 0.15 M NaCl and 50 mM potassium phosphate, pH 7.5. After overnight incubation at 4C, the mixture was centrifuged at 10,000 × g for 20 min and an aliquot of the supernatant was used for enzyme assay. The precipitate was washed once with PBS, dissolved in 10 mM NaOH, and protein concentration was assayed.
Immunoblotting Analysis
Rat liver homogenate was prepared as described above. The fractions isolated by Nycodenz gradient centrifugation were diluted 10-fold with 20 mM HEPES–KOH buffer, pH 7.4. These samples were mixed with the same volume of sample buffer of SDS-PAGE. The mixture was heated in boiling water for 2 min. After electrophoresis, proteins were transferred onto PVDF membranes (Millipore; Bedford, MA) and stained with a combination of HRP-labeled goat anti-rabbit IgG and DAB reaction.
Other Analytical Procedures
SDS-PAGE was carried out according to Laemmli (1970). Protein concentration was determined by the bicinchoninic acid (BCA) method (Pierce Chemical; Rockport, IL) with bovine serum albumin as a standard.
Immunocytochemical Procedures
Immunofluorescence Microscopy. Rat liver was fixed by perfusion with fixative for 10 min at RT. Fixative consisted of 4% paraformaldehyde, 0.2% glutaraldehyde, and 0.2 M HEPES-KOH buffer (pH 7.4). Small tissue blocks of fixed liver were incubated overnight in antifreeze solution consisting of 20% polyvinylpyrolidone (MW 10,000), 1.8 M sucrose, and 10 mM HEPES–KOH (pH 7.4) at 4C (Tokuyasu 1989). Semi-thin cryosections (1 μm thick) were cut with a glass knife using an FC-4D cryosectioning system in a Leichert Ultracut R and mounted on gelatin-coated glass slides. The sections were then treated with 0.1 M lysine + 0.1 M Tris-HCl buffer (pH 7.4) for 10 min, followed by 10-min incubation with 0.5% BSA. The sections were double-stained for catalase and ICD2. Catalase was detected with a combination of guinea pig anti-rat liver catalase antibody and Alexa 549-labeled goat anti-guinea pig IgG, and ICD2 was detected with rabbit anti-ICD2 antibody, followed by Cy2-labeled goat anti-rabbit IgG. The sections were examined with a Zeiss fluorescence microscope.
Immunoelectron Microscopy Using Thin Cryosections. Tissue samples used were the same as employed in immunofluorescence microscopy. Thin cryosections were cut with the same instrument according to the method of Tokuyasu (1986) and mounted on membrane-coated nickel grids. After treatment with 0.5% BSA, sections were incubated with rabbit anti-ICD2 antibody for 1 hr, followed by protein A–gold probe (15 nm). The sections were stained with uranyl acetate in polyvinyl alcohol (Tokuyasu 1989).
Double-labeling by Postembedding Immunoelectron Microscopy. Fixation of rat liver was performed as described above. Tissue slices of fixed rat liver were cut into small blocks, which were then dehydrated in graded ethanol and embedded in LR White (London Resin; Reading, UK) at −20C. Polymerization of resin was performed overnight under UV light at −20C. Thin sections were cut with a diamond knife using a Leichert Ultracut R. The sections were double-labeled for ICD2 and catalase, using gold probes of two different sizes, and stained with uranyl acetate and lead citrate. All thin sections were examined with a Hitachi H7500 electron microscope.
Quantitative Analysis of Gold Labeling. Thin sections were obtained three tissue blocks and incubated with anti-ICD2 or IgG fraction from pre-immune serum (immunocytochemical control), followed by protein A-gold. Ten micrographs were taken from the sections stained for ICD2 at a magnification of 15,000 and enlarged to positive pictures at a final magnification of × 30,000. Similarly, 10 micrographs were taken from the control sections. A total of 60 micrographs, each of which contained a part of a hepatocyte, were quantitatively analyzed as follows. Areas of peroxisomes and cytoplasm, including ER, were estimated using a digitizer (Sigma Scan; Jandel Scientific, San Rafael, CA) attached to a computer. Gold particles on the peroxisomes and the cytoplasm were counted and labeling density in each compartment was calculated. The labeling density was expressed as gold particles per μm2 of the compartment. In addition, we estimated sharing of gold particles by each compartment in an area of 100 μm2 using the same micrographs that were used for measurement of the labeling density. Sharing was expressed as the percentage of gold particles on the compartments to total gold particles. The labeling density and the sharing were corrected by the corresponding values obtained similarly from the immunocytochemical control sections.
Results
Purification of ICD2 and Specificity of Antibody to ICD2
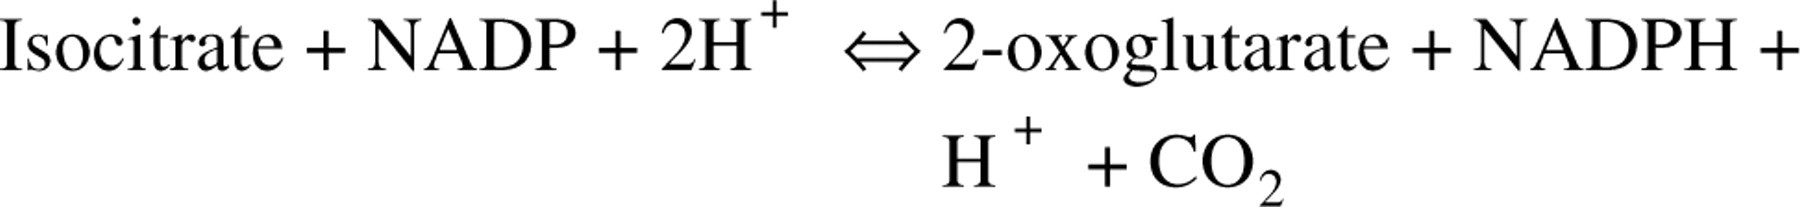
ICD2 was purified 528-fold from 100,000 × g supernatant fraction of rat liver. The recovery was 33% and purified enzyme had a specific activity of 50.1 U/mg. The apparent molecular mass of the native enzyme was determined to be 47 kD by SDS-PAGE (Figure 1A). Antibody to purified ICD2 developed a single band on immunoblotting analysis, which migrated at a position corresponding to 47 kD (Figure 1B), indicating the monospecificity of the antibody.
(
Immunotitration
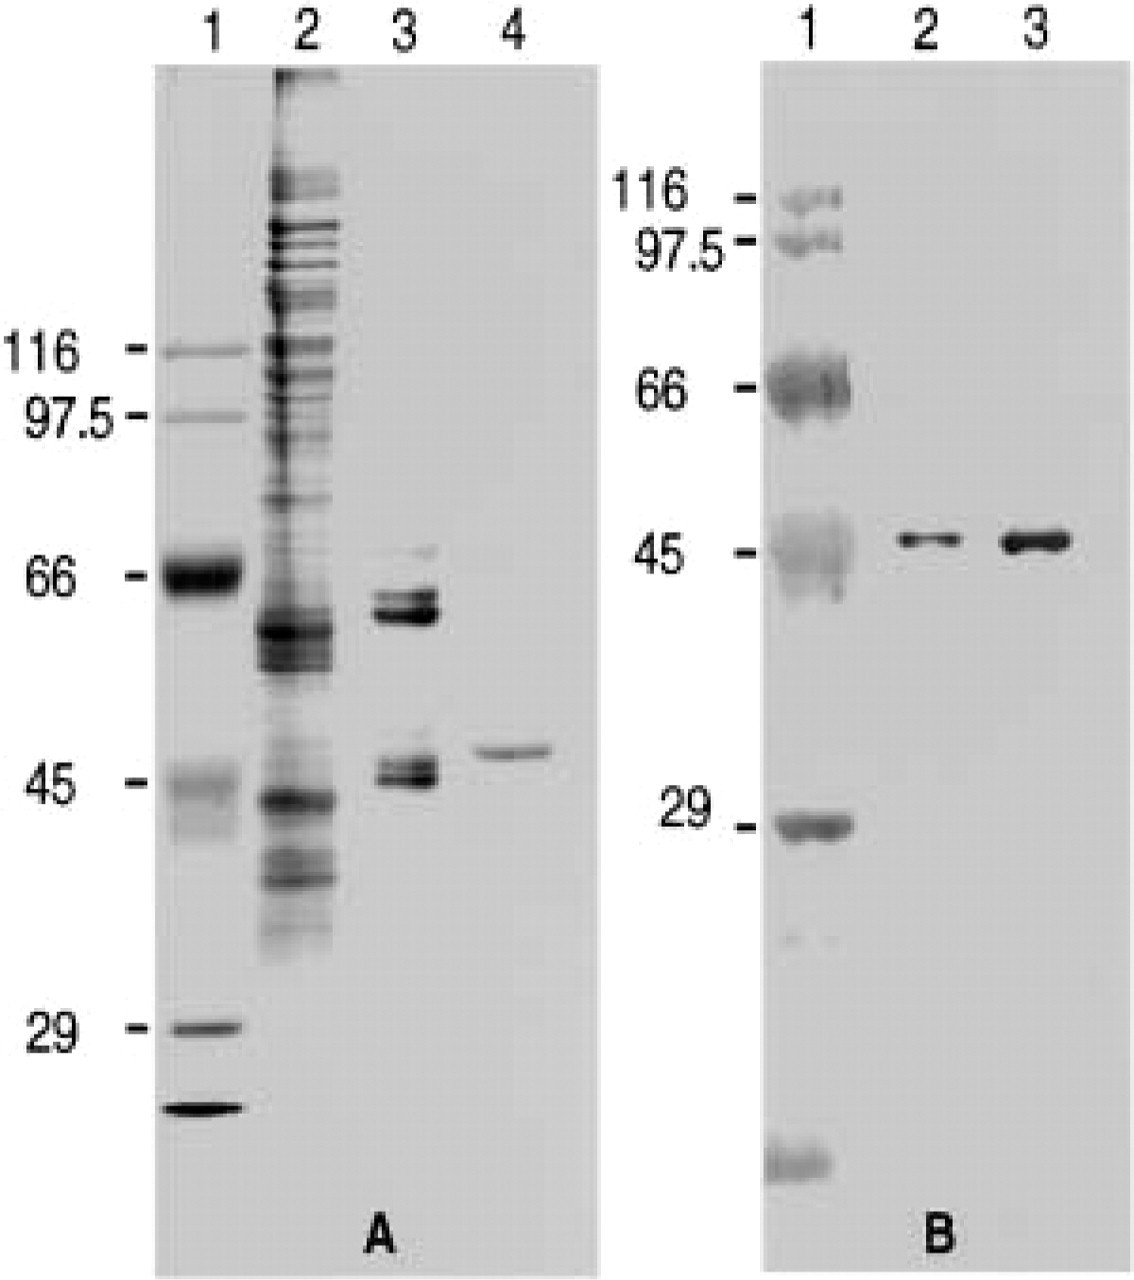
The titration of the purified preparation of ICD2 by its antibody is shown in Figure 2. The antibody reacted with whole ICD2 added within a range of approximately 40 U added and left no enzyme activity of ICD2 in the supernatant after centrifugation. In the presence of an excess amount of antigen, the anti-ICD2 antibody precipitated approximately half of the antigen. These results indicated that our antibody to ICD2 could immunochemically react with ICD2.
ICD Activity Distribution in the Subcellular Fractions Isolated by Differential Centrifugation
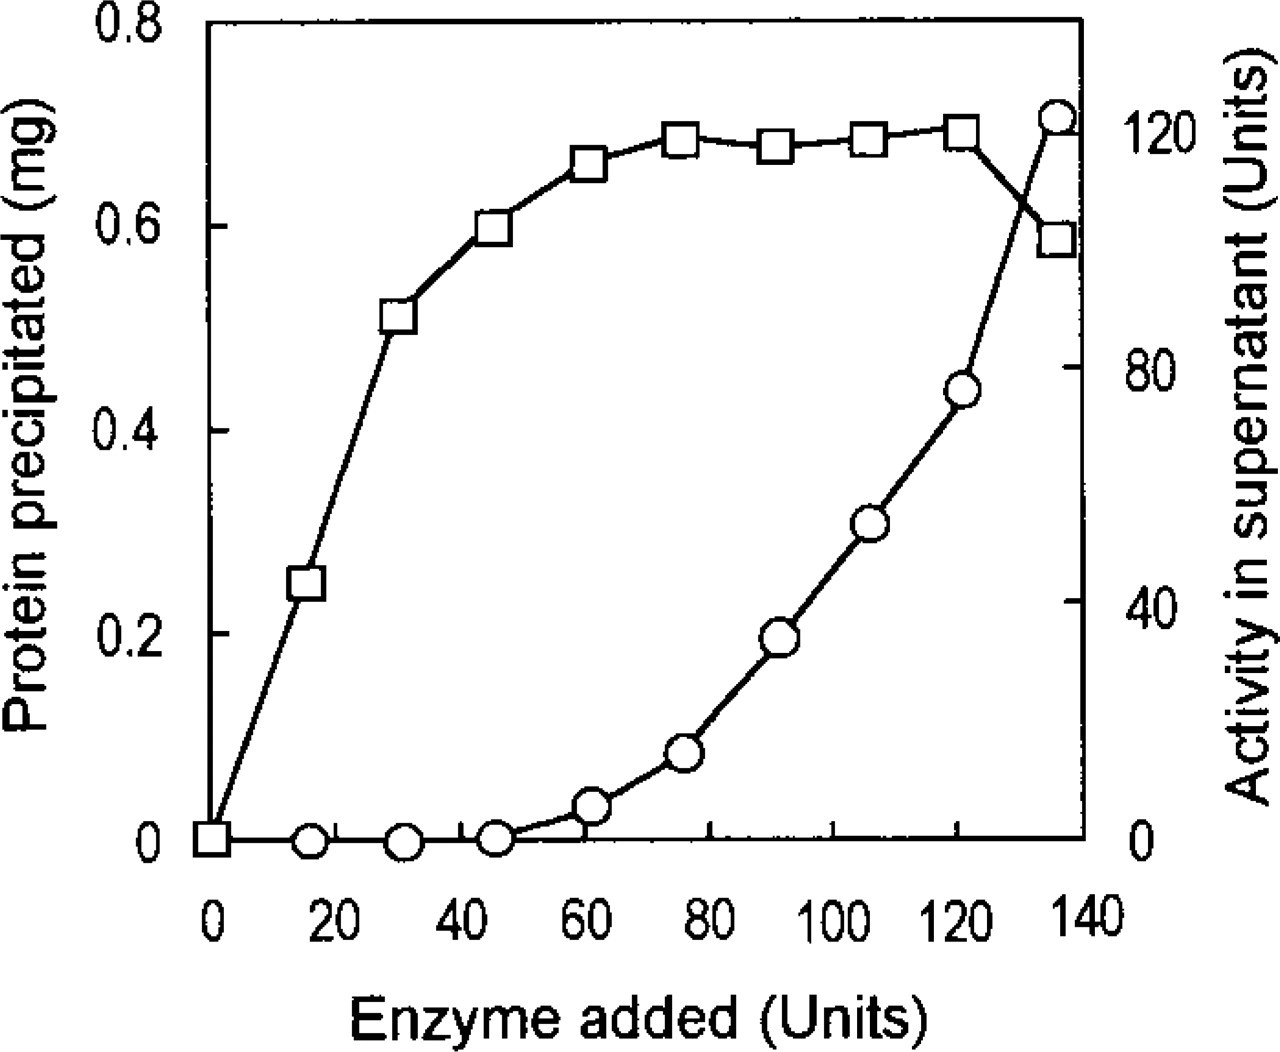
The results are shown in Figure 3. No urate oxidase activity was detected in the cytosolic fraction, with all activity present in the mitochondrial fraction. In the rat liver, this enzyme is contained in the crystalloid core of peroxisomes, which is insoluble at neutral pH. This was the reason why urate oxidase was detected only in the particulate fraction. In contrast, 65% to 50% of
Quantitative precipitation reaction of ICD2. The precipitation reaction was carried out in a final volume of 0.2 ml as described in Materials and Methods. □-□, protein precipitated; ○-○, enzyme activity of ICD2.
Distribution of peroxisomal enzymes in light mitochondrial and soluble fractions isolated by differential centrifugation from rat liver homogenate. Hatched columns and open columns show light mitochondrial fraction and soluble fraction, respectively. UOX, urate oxidase; DAOX, d-amino acid oxidase; CAT, catalase; HOX, L-α-hydroxyacid oxidase.
Isolation of Peroxisomes by Nycodenz Density Gradient Centrifugation of Rat Liver
The results are shown in Figure 4. The separation of peroxisomes from mitochondria and lysosomes was determined by the distribution of marker enzymes on the gradient. The intact peroxisomes, as detected by assay of catalase activity, were separated from the mitochondrial fraction and were located at higher density (left in Figure 4). The mitochondria, as measured by succinate cytochrome C reductase, the lysosomes, as determined by acid phosphatase, and the ER, as measured by esterase, were located at lower density (right in Figure 4). Significant ICD2 activity was detected in fractions 21–24, which contained the cytosolic proteins and proteins released from ruptured peroxisomes or other organelles. Fractions 2–7 (peak of peroxisomal fractions) contained the majority of ICD2 activity (64.3%), whereas lower-density fractions 20–24 included half of this ICD2 activity (32%).
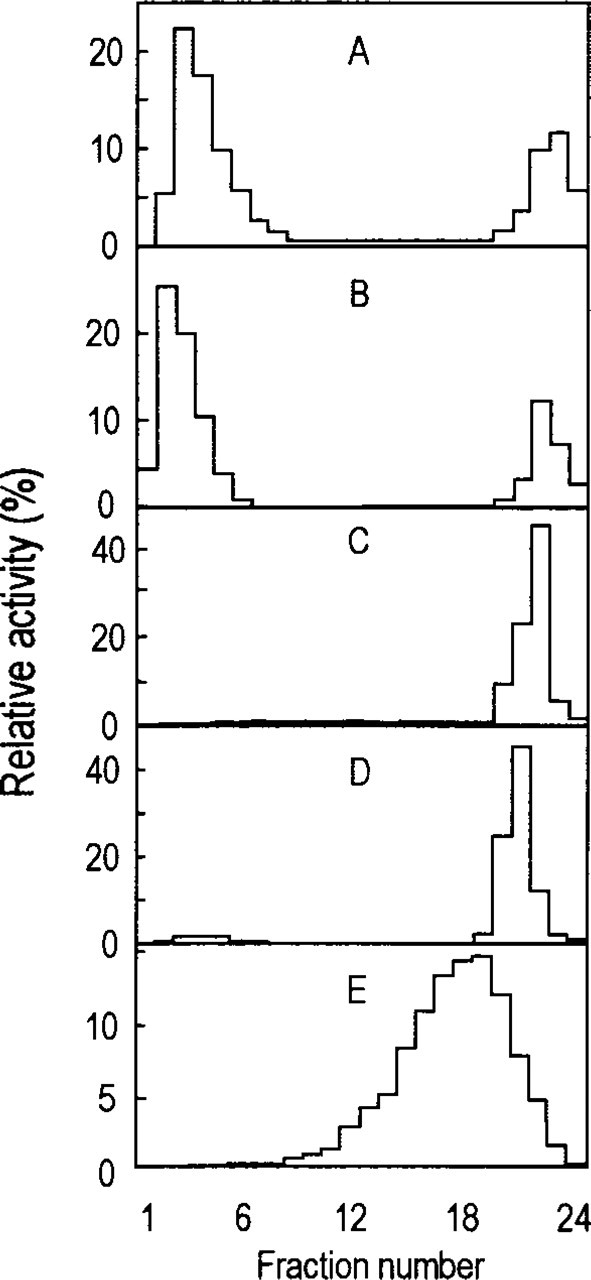
Isolation of peroxisomes from light mitochondrial fraction of rat liver by Nycodenz gradient centrifugation. Density gradient decreases from left to right side. (
Immunochemical Distribution of ICD2 and Organelle Marker Enzymes in Nycodenz Gradients
We analyzed 24 fractions isolated on a Nycodenz gradient by immunoblotting. The results are shown in Figure 5. Strong signals for ICD2 were distributed bimodally in fractions 2–5 and 18–24, where the activity was detected. Signals in the latter fractions were weaker than those in the former. The distribution pattern of catalase signal was quite similar to that of ICD2. Signals for acyl-CoA dehydrogenase, a mitochondrial marker, were present in fractions 20–24 but not in higher-density fractions (fractions 2–5), where catalase and ICD2 were found.
Double Immunofluorescence Staining of ICD2 and Catalase in Rat Liver
The results are shown in Figure 6. Green fluorescence showing ICD2 antigenic sites was localized in the cytoplasmic granules but not in other parts of the hepatocytes. All of the positive granules in the same sections were also stained for catalase (red color), indicating that ICD2-positive granules were peroxisomes.
Immunoelectron Microscopic Localization of ICD2 in Ultracryosections of Rat Liver
Gold particles showing the antigenic sites of ICD2 were observed mainly in peroxisomes, but labeling over the cytoplasmic matrix was never above background levels (Figure 7). In peroxisomes, gold particles were scattered in the matrix surrounding the nucleoid core but were not concentrated in specific areas of the matrix. On immunocytochemical control sections incubated with pre-immune serum, no gold particles were noted on the peroxisomes or other compartments.
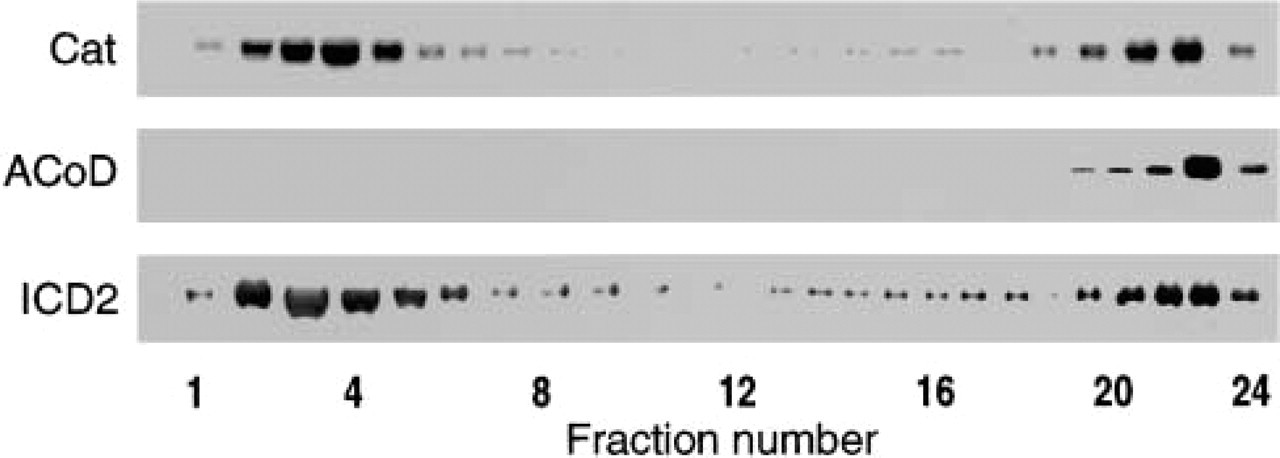
Immunoblotting analysis of enzymes in Nycodenz density gradient. The same fractions described in Figure 4 were analyzed. Cat, catalase; ACoD, acyl-CoA dehydrogenase; ICD2, NADP-dependent isocitrate dehydrogenase (cytosolic type).
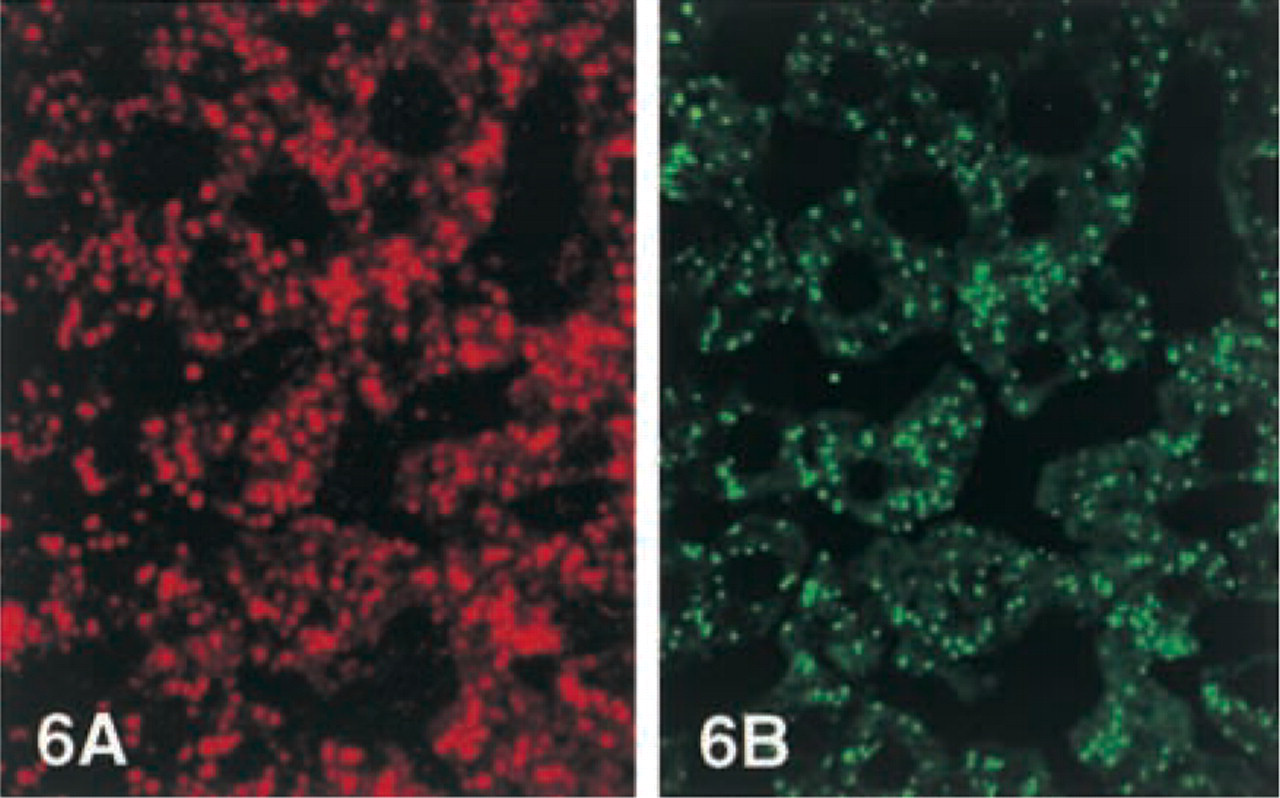
Double immunofluorescence staining of rat liver sections. (
Double-labeling of ICD2 and Catalase by Postembedding Electron Microscopy
There were no differences in the labeling intensity for ICD2 between cryosections and LR White sections. Thin sections of LR White-embedded rat liver were labeled for ICD2 and catalase by the double-labeling technique. Large gold particles (15 nm) showing ICD2 antigenic sites were observed mainly in peroxisomes (Figure 8). The same peroxisomes were also stained with small gold particles (8.5 nm) for catalase, clearly demonstrating that ICD2 and catalase were co-localized in the peroxisomes. No labeling for either antigen was noted in the cytoplasmic matrix.
Quantitative Analysis of Immunolabeling for ICD2
The results are shown inTable 1. Labeling density in peroxisomes was significantly higher than in the cytosolic compartment. When we subtracted background labeling from the labeling density of each compartment, the peroxisomal labeling density was 1354-fold higher than the cytosol. Approximately 99.8% of gold labeling in areas of 100 μm2 was present in peroxisomes and 0.2% was found in the cytosol. In a textbook (Alberts et al. 1994), the relative volumes of the cytosol and peroxisomes in hepatocyte are described as 53% and 1%, respectively. When these values are applied to our data, the cytosol contained 9.2% and the peroxisomes 90.8% of total ICD2 in the hepatocyte.
Discussion
Purity of ICD2 Preparation and Anti-ICD2 Antibody
Specific activity of purified ICD2 was 528-fold higher than that of the starting material, which was similar to the values reported previously (Plaut and Aogaichi 1968; Carlier and Pantaloni 1973). On SDS-PAGE the preparation exhibited a single band with an apparent molecular mass of 47,000 Da, which was similar to the value of 46,681 Da calculated from the amino acid sequence of ICD2 (Jennings et al. 1994; Nekrutenko et al. 1998). The specificity of the anti-ICD2 antibody prepared in this study was confirmed by immunoblotting analysis. The antibody developed a single signal with apparent molecular mass of 47 kD. On immunotitration, the antibody was confirmed to react specifically with purified ICD2.
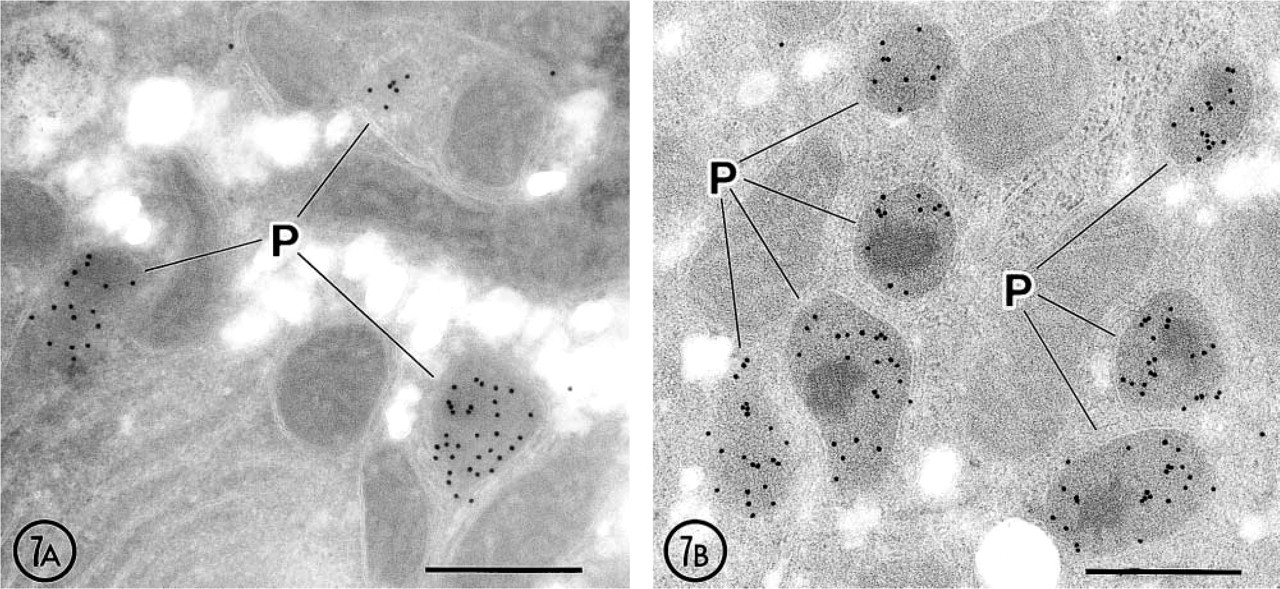
Immunoelectron microscopic localization of ICD2 in rat hepatocytes. (
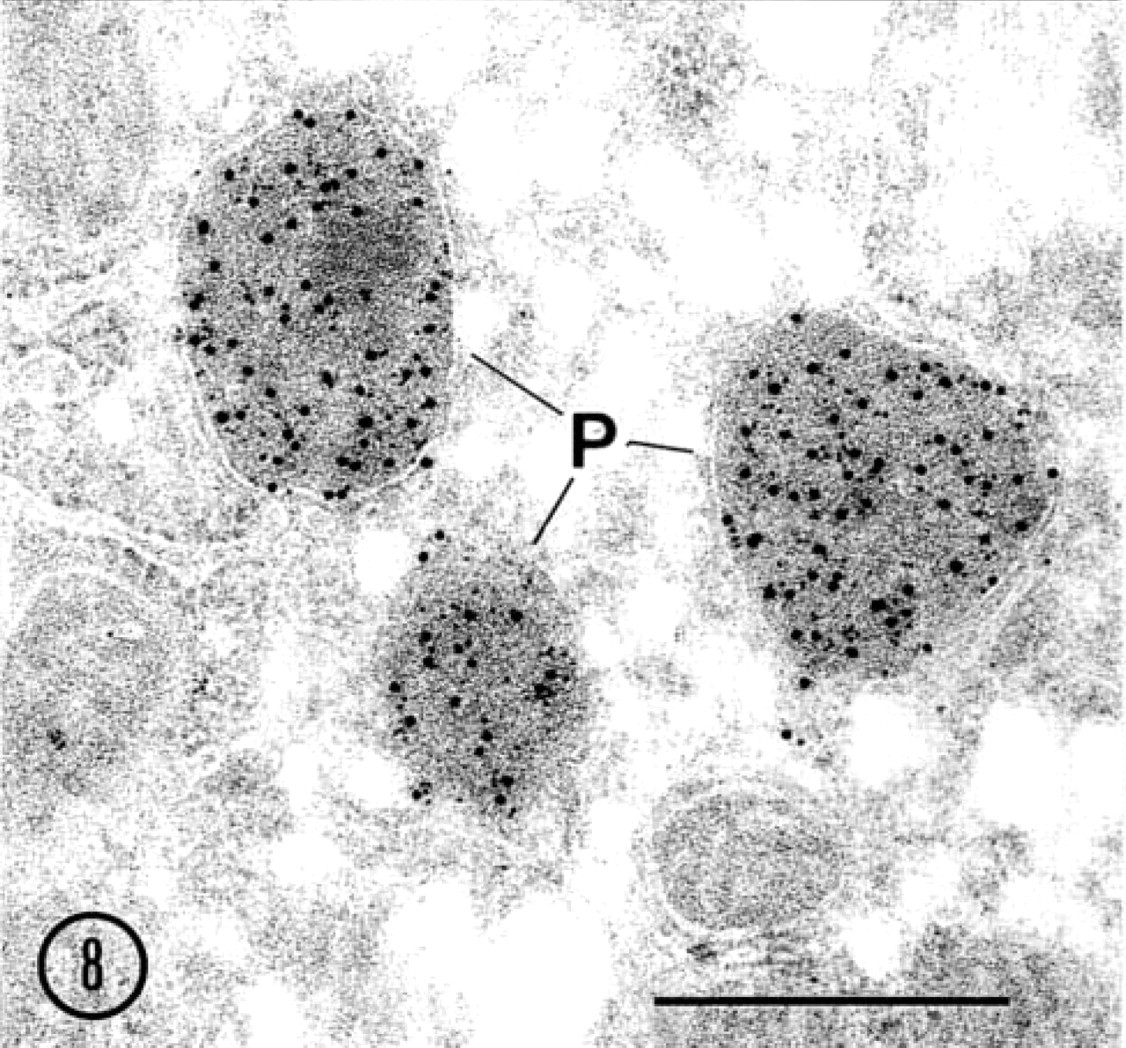
Double-labeling for catalase and ICD2. Large gold particles (15 nm) show ICD2 and small gold particles (8.5 nm) indicate catalase. Both enzymes were mainly co-localized in peroxisomes (P). Original magnification ×57,000.
Distribution of ICD2 in Rat Liver
After differential centrifugation of rat liver homogenate, most of the ICD2 activity (75%) was found in the cytosolic fraction and only 25% of the activity was in the mitochondrial fraction containing peroxisomes. These results strongly suggest that ICD2 is a cytosolic enzyme. The other peroxisomal enzymes (catalase,
Subcellular Localization of ICD2 in Rat Hepatocytes
The enzyme activity of ICD2 was detected in the peroxisomal fractions isolated by Nycodenz gradient centrifugation. Immunoblotting analysis of the same fractions showed that ICD2 was co-localized with catalase but not with acyl-CoA dehydrogenase (a mitochondrial marker). ICD2 was also detected in lower-density fractions in which catalase, succinate cytochrome C reductase, acid phosphatase (a lysosomal marker), and esterase (an ER marker) co-existed. Catalase activity in the fractions may be derived from peroxisomes aggregated with the other organelles and the enzyme released from peroxisomes. These results demonstrated that ICD2 is associated with peroxisomes. Double immunofluorescence staining of ICD2 and catalase showed that these two enzymes were co-localized mainly in peroxisomes. If the enzyme were localized in the cytosol, its levels would be very low. Moreover, immunoelectron microscopic localization of ICD2 determined by two different methods also demonstrated that ICD2 is contained mainly in the peroxisomes. Double-labeling experiments showed that ICD2 and catalase were co-localized in the same peroxisomes but mostly not in the other compartments including the cytoplasmic matrix. Quantitative analysis of the results of postembedding immunoelectron microscopy revealed that ICD2 was localized predominantly in the peroxisomes. Because labeling density mostly reflects the concentration of the antigens in a compartment, our results showed that liver peroxisomes contain ICD2 at levels 1354-fold higher than the cytosol. Moreover, 99.8% and 0.2% of total gold particles found in 100-μm2 areas of tissue sections were present in the peroxisomes and the cytoplasm, respectively. According to a textbook (Alberts et al. 1994), the relative volumes of the cytosol and peroxisomes in hepatocyte are 53% and 1%, respectively. Applying these values to our data, approximately 9% of ICD2 is present in the cytoplasm and 91% is in peroxisomes. Therefore, in rat hepatocytes the major distribution site of ICD2 is the peroxisomes and the cytoplasm is a minor site. The present study clearly demonstrated that in rat hepatocytes ICD2 is contained mainly in the peroxisome.
Labeling density and subcellular distribution of ICD2 in rat hepatocytes
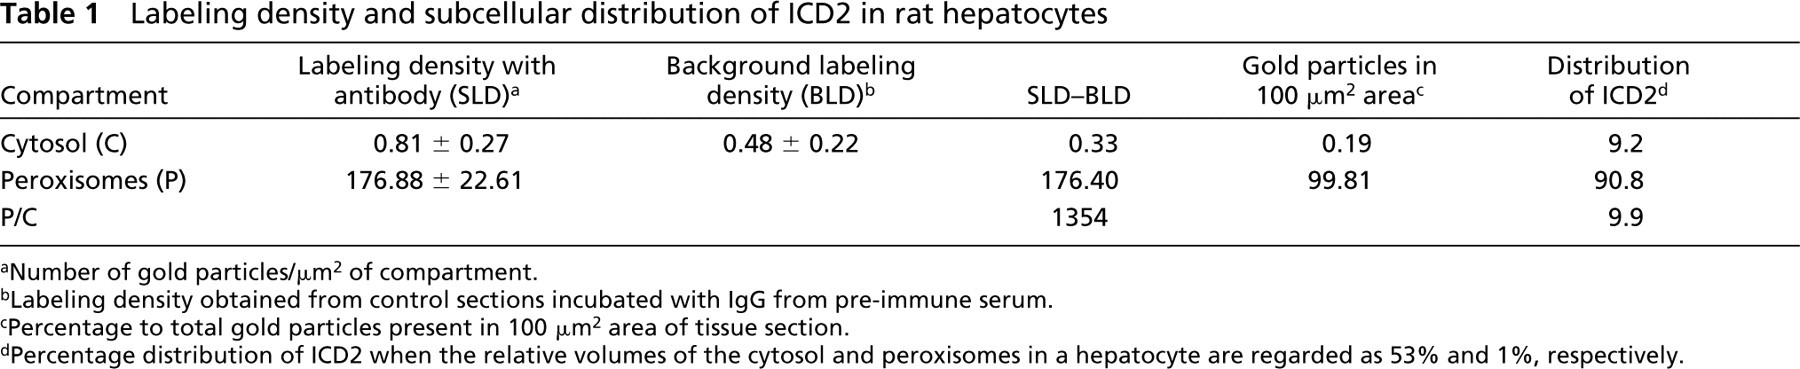
Number of gold particles/μm2 of compartment.
Labeling density obtained from control sections incubated with IgG from pre-immune serum.
Percentage to total gold particles present in 100 μm2 area of tissue section.
Percentage distribution of ICD2 when the relative volumes of the cytosol and peroxisomes in a hepatocyte are regarded as 53% and 1%, respectively.
Isozymes of ICD2 have been found in various tissues (Farrell 1980; Plaut et al. 1983; Jennings et al. 1990). The isozyme in bovine corneal epithelium shows 94% identity to rat ICD2 and has a PTS1 signal. This enzyme constitutes 13% of the total soluble protein and functions as crystallin (Sun et al. 1999). The rat ovary stimulated with gonadotropin has been shown to contain high levels of ICD2 isozyme (Jennings and Stevenson 1991). It is unlikely that peroxisomes of these tissues can accommodate such large amounts of ICD2. Therefore, ICD2 may remain in the cytosol in some cases despite its PTS1. In such tissues, ICD2 is localized in both the peroxisomes and the cytosol. However, this is not the case in the rat liver, as demonstrated in this study.
Function of ICD2 in Peroxisomes
In mammals and yeast, three isozymes of ICD are known: mitochondrial NAD-specific ICD, NADP-specific ICD1 (mitochondria type), and ICD2 (cytosolic type). NAD-specific ICD catalyzes a key step in the tricarboxylic acid cycle, whereas the physiological roles of two NADP-specific enzymes are not clearly understood. It is well known that peroxisomes break down very long-chain fatty acids and unsaturated fatty acids by β-oxidation. In the β-oxidation of unsaturated fatty acids, NADPH-dependent 2,4-dienoyl-CoA reductases and △ 3-cis-△2-trans-enoyl-CoA isomerases are required to remove the double bonds (Hiltunen 1991). Immunocytochemical localization of 2,4-dienoyl-CoA reductase in rat liver peroxisomes has been reported (Yokota et al. 1988). Biochemical studies also showed that this enzyme was present in peroxisomes (Geisbrecht et al. 1999). NADPH produced by ICD2 activity might be used by NADPH-dependent ▴2,▴4-dienoyl-CoA reductase in β-oxidation of unsaturated fatty acids with double bonds at even-numbered carbons. It has been shown that NADPH required in the reaction of NADPH-dependent 2,4-dienoyl-CoA reductases in yeast is provided by peroxisomal ICD (Van Roermund et al. 1998). The peroxisomal membrane is impermeable to NAD(H) and malate dehydrogenase is involved in generation of intraperoxisomal NAD+ in yeast cells (Van Roermund et al. 1995). In mammalian cells, intraperoxisomal NADH is produced by a bifunctional enzyme comprising the β-oxidation system (Hashimoto 1982). The present study indicated that in the rat liver ICD2 is mainly localized in the peroxisomes. These results suggest that the intraperoxisomal supply of NADPH is provided by ICD2. Liver peroxisomes are a major site of β-oxidation of unsaturated fatty acids, and therefore the exclusive distribution of ICD2 in peroxisomes is reasonable.