
Abstract
Cell proliferation and apoptosis indices are important indicators for the prognosis and treatment of a variety of cancers. A method is described using differential absorption color image analysis to measure proliferation and apoptosis in tumor sections using BrdU (5′ bromodeoxyuridine) incorporation and immunohistochemistry and terminal deoxytransferase nick end-labeling (TUNEL). Nuclei were labeled with streptavidin-peroxidase-diaminobenzidine (DAB) secondary detection. The differential absorption method uses a computer-controlled microscope equipped with a tunable filter and digital camera to take advantage of the spectral differences of stained objects of interest. Images collected at defined wavelengths are divided and scaled to form ratio images in which the hematoxylin- or DAB-stained nuclei have intensity ranges far above those of surrounding structures. Using brightness thresholding followed by selection based on nuclear size and shape parameters, binary images were formed of the BrdU/apoptotic-positive tumor and all the tumor nuclei for subsequent counting and calculations of proliferation and apoptotic indices. (J Histochem Cytochem 49:1059–1060, 2001)
P
Color image analysis by the differential absorption method takes advantage of the differences in light absorption of stained objects to isolate or segment these objects for subsequent counting and measurement. Using a light microscope equipped with a liquid crystal tunable filter, digital camera, and image analysis software as previously described (Ornberg et al. 1999), the transmittance of hematoxylin and DAB stains was determined. To isolate both hematoxylin- and DAB-stained nuclei independently for counting (Figure 1A), three images of the same field were acquired at 670, 595, and 470 nm. Using image math, a ratio image formed by dividing the 670 image by the 595 image (Figure 1B) contained bright hematoxylin nuclei while surrounding tissue was dark. Similarly, a ratio image formed by dividing the 670 image by the 470 image (Figure 1C) contained bright DAB-stained nuclei but dark hematoxylin nuclei. Both ratio images are multiplied by a scalar of 3000. By selecting all objects that had an intensity of 300–700 U above the mean intensity (brightness thresholding) and were 100 pixels (3–4 μm) or greater in diameter, the nuclear objects from each image were segmented (Figures 1D and 1E). In some cases, objects in the nuclear image were sorted on the basis of two shape parameters, area and axial ratio, to separate stromal cell nuclei from tumor cell nuclei. The total number of nuclei in an image field was determined by dividing the total area of all objects in the binary nuclear image by the mean area of a single nucleus for the tumor cell in question. This minimized an undercount due to nuclear overlap. To determine the number of BrdU- or TUNEL-labeled nuclei, binary transforms of the nuclear and DAB images were added such that objects present in both images (red objects in Figure 1F) were segmented and counted. This eliminated the possibility of counting DAB/AEC-stained objects that were not nuclei, i.e., contamination. Counts of total nuclei and positive nuclei were then used to calculate a proliferation index or apoptotic index for the image field as a percent of total cells.
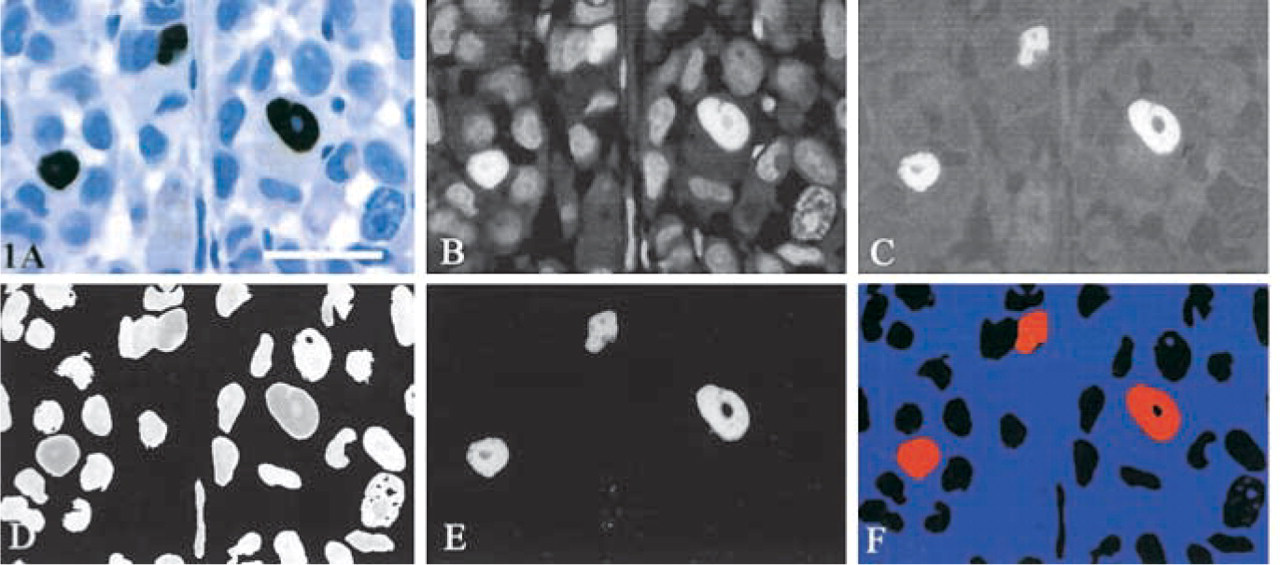
Series of images acquired or calculated that illustrate how the differential absorption method measures total nuclei and labeled nuclei from the same image field. (
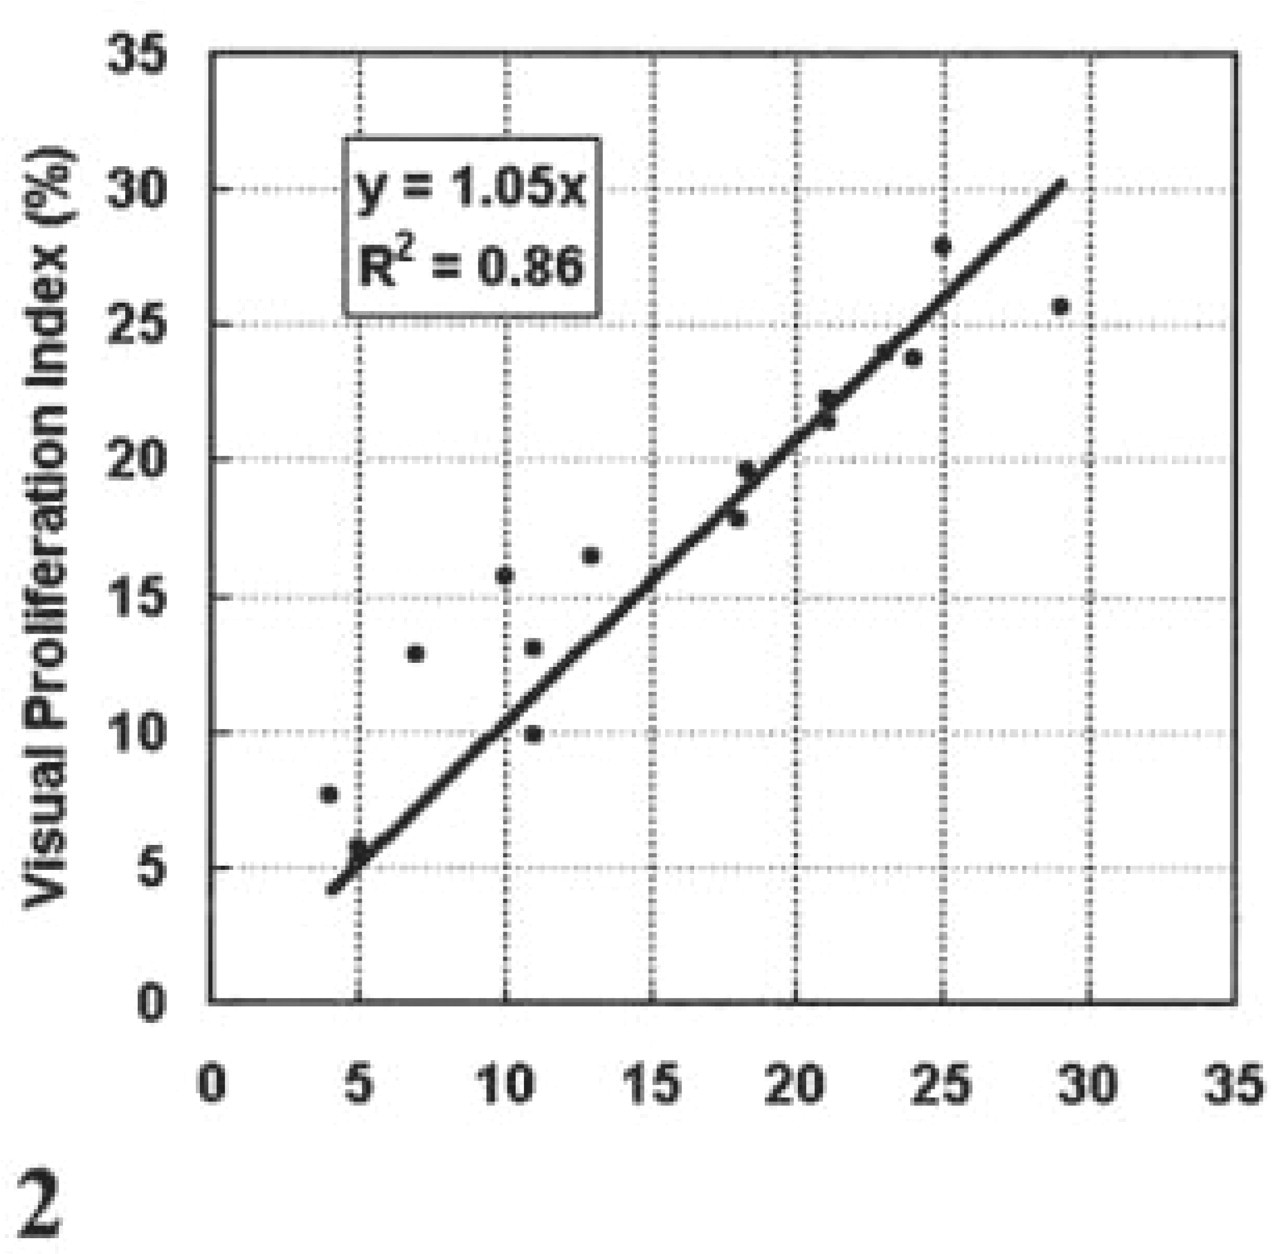
Scatter graph of proliferation indices comparing values determined by differential absorption color image analysis with visual counts of the same image field.
The validity of this method was examined by comparing proliferation indices obtained by image analysis with indices obtained by visual counting of the same image field in regions of tumor tissue having varying degrees of proliferation. As shown in Figure 2, there was a strong correlation between the two methods (correlation coefficient = 0.96) and this correlation was linear (correlation coefficient = 0.86) as expected. A systematic undercount of nuclei by the image analysis method (data not shown) produces the largest variation in the two methods, due in part to the inability to accurately determine a nuclear count when nuclei touch one another. Hence, the image analysis method required thin sections to minimize this problem.
In addition to accuracy, the differential absorption method is rapid and widely applicable. Typically, a study of 100 sections at 10 images each can be analyzed in a few hours. The operator need only select an area, focus, and initiate the program. Any marker that can be labeled with a colored reaction product can be analyzed. To date, the method has been applied to two stain systems. Multistain analysis is currently being developed. With wider use and awareness, differential absorption color image analysis can be a powerful method in modern pathology for providing easy and accurate morphometric analysis of routinely prepared tissue sections.