
Abstract
The appearance of free DNA ends in the chromatin is usually considered an indication of advanced apoptosis. Unexpectedly, the nuclei of non-apoptotic cells derived from mouse thymuses could be specifically labeled by terminal transferase after proteinase K treatment of the fixed, cytocentrifuged samples. Artifactual mechanical or contaminating nucleolytic factors have been ruled out as players in the generation of free DNA ends. The phenomenon was detected in both formaldehyde- and ethanol-fixed specimens, in agarose-embedded fixed cells, and in chromatin spreads. By urea-agarose gel electrophoresis, the average single-strand size of the DNA molecules carrying the free ends was found between 50 and 250 kb. We suggest that ss discontinuities preexisting in the fixed normal cells are unmasked by protease treatment eliciting TUNEL (terminal transferasemediated nick end-labeling) positivity.
D
Loop-size fragmentation was shown to start with single-strand (ss) breaks detectable in apoptotic cells by ss-specific nucleases and in denaturing agarose gel electrophoretic experiments (Walker et al. 1997), although regularly appearing ss discontinuities were recently also demonstrated in deproteinized samples of normal agarose-embedded, non-apoptotic cells (Varga et al. 1999). The ≥50-kb fragments are believed to represent the chromatin loops (Lagarkova et al. 1995). Different enzymes or enzyme pools were suggested to carry out the ≥50-kb and oligonucleosomal fragmentation steps (Pandey et al. 1994; Sun and Cohen 1994). Soluble (Peitsch et al. 1993a, b; Fraser et al. 1996; Khodarev and Ashwell 1996; Pandey et al. 1997; Krieser and Eastman 1998; Mukae et al. 1998) or chromatin-bound nucleases (Fraser et al. 1996; Pandey et al. 1997) were identified in various systems as suspects of the apoptotic DNA degrading activity, where the chromatin-bound enzymes were held responsible for the loop-size degradation phase (Liu et al. 1998b). No uniform picture of the mechanism of DNA fragmentation, which would also require reconciliation of the disparate findings implicating different nuclease activities in the different systems, has emerged thus far (Walker and Sikorska 1997).
Before the changes involving the DNA itself, a cascade of proteolytic events (McConkey et al. 1994; Walker and Sikorska 1997; Raff 1998; Thornberry and Lazebnik 1998) is triggered by the apoptosis-initiating signals. The coupling between proteolytic and nucleolytic events is unclear, apart from the clues that enzymes involved in DNA repair processes (Song et al. 1996) and the soluble inhibitor of one of the nucleases implicated in apoptotic DNA degradation were shown to be substrates for caspases (Enari et al. 1998; Inohara et al. 1998; Liu et al. 1998a, b; Mukae et al. 1998; Sabol et al. 1998; Sakahira et al. 1998). Distinct sets of proteases were implicated in the high molecular weight and oligonucleosomal DNA fragmentation (Sane and Bertrand 1998). Non-caspase proteases were also shown to be involved in eliciting apoptotic DNA degradation (Shimizu and Pommier 1997; Hughes et al. 1998). Here we demonstrate that treatment with proteinase K makes available free DNA ends preexisting in fixed normal cells for TdT labeling. This observation raises the possibility that the endogenous proteases involved in apoptosis may contribute to the initial DNA degradation events in apoptosis by unmasking preexisting nicks for subsequent nuclease attack.
Materials and Methods
Cells
Thymocytes of 3 week-old Balb/c mice were used in the experiments shown. To obtain apoptotic cells, the thymocytes were treated with 1 μM dexamethasone (Sigma–Aldrich; Budapest, Hungary) at 37C in RPMI supplemented with 10% FCS for 6 hr. The cells were washed in PBS, fixed in buffered 1% formaldehyde at 4C for 1 hr, and resuspended in ice-cold 70% ethanol and stored at −20C overnight. In some experiments (see figure legends), only ethanol fixation was applied. In the latter case, the cells were resuspended at a concentration of 107/ml in 1% low melting point agarose gel [Sigma–Aldrich; dissolved in distilled water (ddH2O) and kept at 65C] to prevent cell disintegration under proteinase treatment. Ten μl of this warm gel-cell suspension was smeared as a thin layer onto a slide and the gel was allowed to solidify at room temperature (RT). The formaldehyde-and ethanol-fixed cells were deposited on polylysine-coated slides by a cytocentrifuge (Shandon Southern Products; Pittsburgh, PA).
Chromatin Spreads
The chromatin spreads were isolated according to Schlammadinger (1990). Briefly, from a suspension of mouse thymocytes (106/ml in PBS), 20-μl droplets were pipetted onto Parafilm and then acetone-cleaned slides were placed over the droplets. One minute later the slides were dipped into 2% formaldehyde and kept there for 1 min, then stored in 70% ethanol at 4C until use.
BrdU-TP TUNEL Procedure
Slides with cytocentrifuged cells, the smears of the gelembedded cells, and the chromatin spreads were covered with 0.25% sodium dodecyl sulfate (SDS), 2 mM EDTA, and 1 mg/ml proteinase K [Boehringer Mannheim, Mannheim, Germany, cat. no. 1413 783; recommended also for PFGE (pulsed-field gel electrophoresis)] dissolved in ddH2O and the samples were incubated at 37C in a humidity chamber (HC) for 30 min. In some experiments, molecular biology grade proteinase K or pronase (from Sigma–Aldrich) was used, with similar results). After several washes in PBS and ddH2O at RT, the slides were further incubated in 2 mg/ml PMSF (phenylmethylsulfanyl fluoride; Sigma–Aldrich) at 37C in HC twice for 30 min, to inhibit any residual proteinase. Then, on the PBS- and ddH2O-washed slides, the TdT reaction was performed in 1 × TdT buffer (Promega; Madison, WI), containing 0.125 mg/ml bromodeoxyuridine-triphosphate (Sigma–Aldrich), 50–50 μM deoxy-ATP (GIBCO BRL; Gaithersburg, MD), and deoxy-CTP (GIBCO BRL), and 1 U/μl TdT (Promega) at 37C in HC for 30 min. This was followed by several washes in PBS and denaturation in 0.07 M NaOH at RT for 5 min. The PBS- and ddH2O-washed slides were then dried and incubated with anti-BrdU antibody (DAKO, Carpinteria, CA; diluted 1:20 in PBS +1% bovine serum albumin) at 37C in HC for 30 min, followed by further washes in PBS at RT. After carefully removing PBS with blotting paper, the cells and chromatin preparations were stained with FITC-conjugated goat anti-mouse immunoglobulin (Sigma–Aldrich) used at a titer of 1:150 (in PBS + 1% bovine serum albumin) at 37C in HC for 30 min. The slides were then covered with 50% glycerol + 1 μg/ml propidium iodide in PBS. Control samples included no protease/SDS/EDTA treatment, SDS/EDTA-only treatment, and samples handled without TdT. In the initial experiments, controls in which BrdU-TP or antibodies were omitted were also studied and gave no labeling above background (fixed specimens, no treatment).
The BrdU-TP labeling technique, an early version of TUNEL in essence, was originally introduced to visualize and quantitatively analyze by flow cytometry the DNase I sensitivity of chromatin in fixed nuclei (Szabó et al. 1987). Application of BrdU-TP instead of other nucleotide analogues appears not to have any disadvantage. A BrdU-TP version of the TUNEL has been made available by Biosource (Camarillo, CA).
Microscopy
An Axiovert 135 fluorescence microscope (Zeiss; Oberkochen, Germany) was applied to visualize and photograph the cells and chromatin spreads on Kodak Tri-X-Pan (400 ASA) film (at 50 sec exposition time), using a ×100 oil-immersion objective. The original photos are shown in Figures 1–3.
Preparation of Agarose Plugs with Intact Chromosomal DNA
Mouse thymocytes obtained from young Balb/c mice were washed twice in PBS, then mixed with an equal volume of 1% low melting point agarose (SeaPlaque agarose; FMC BioProducts, Rockland, ME) dissolved in TE (10 mM Tris, 1 mM EDTA, pH 8). The plugs were left to solidify at 4C, then transferred to the lysing solution (0.5 M EDTA, 0.5 mg/ml proteinase K, 1% Sarkosyl, 10 mM Tris, pH 8) and incubated at 54C for 2 days.
Urea–Agarose Gel Electrophoresis
Urea–agarose gel electrophoresis was carried out according to Materna et al. (1998). Agarose gels containing 1 M urea were prepared by melting agarose in 1 × TAE (Tris-acetate, EDTA). When the solution cooled below 60C, urea was added to achieve a final concentration of 1 M. Electrophoresis buffer was also prepared from 1 × TAE containing 1 M urea. Urea sample buffer contained 8 M urea, 10 mM Tris-HCl (pH 7.8), 1 mM EDTA, 1% NP-40, and 0.05% bromophenol blue. Electrophoresis was performed at 6 V/cm in a cold room. In the case of FIGE runs (field-inversion gel electrophoresis), parameters were set to maximize resolution in the 50–500-kb region. Before loading the samples onto the urea gels, one volume of each sample was mixed with 7 volumes of the loading buffer. Samples were loaded either without further treatment (non-denatured DNA) or after incubation at 95C for 5 min (denatured DNA). In working with agarose plugs, the gel blocks were washed three times with loading buffer to equilibrate the samples and then loaded, with or without heat denaturation. Wide-bore pipettes were used for handling all solutions containing DNA to minimize mechanical shearing.
Assay of Endonucleolytic Activity on DNA–PAGE Activity Gels
We followed the method described by McGrew and Green (1990). Samples were loaded without mercaptoethanol and heat denaturation and separated on 10–12% SDS-PAGE gels co-polymerized with 50 μg/ml sonicated, heat-denatured calf thymus DNA. After electrophoresis, the gels were extensively washed in Buffer A (40 mM Tris, pH 9.0, 2 mM EDTA, 1% casein), then in the same buffer without casein. Finally the gels were incubated in Buffer B (40 mM Tris, pH 7.6, 2 mM MgCl2, 2 mM CaCl2) at 37C overnight. The gels were then stained with 0.5 μg/ml ethidium bromide for 30 min and photographed on a UV transilluminator.
Results
Figure 1 shows the results of the TUNEL assay performed on formaldehyde-fixed normal and apoptotic murine thymocytes. Free 3′ OH ends were available for TdT in the apoptotic sample, as expected. Surprisingly, after pretreatment of the fixed samples with proteinase K (in the presence of SDS and EDTA; see 1D and 2D), DNA ends with free 3′ OH were also generated or became accessible for TdT in the chromatin of normal cells. The intensity of labeling depended on the proteinase K concentration applied and on the cell type. Mouse thymocytes required more (0.5–1 mg/ml), cultured cells (e.g., HL60) less (1–10 μg/ml) proteinase K; SDS or EDTA alone did not give rise to increased TdT labeling (not shown). To address the possible role of shearing or fixation artifacts in this unexpected labeling, the above experiment was repeated with ethanol-fixed, agarose-embedded normal thymocytes. Agarose embedding was required to avoid the massive disruption of ethanol-fixed nuclei following proteinase K treatment. As shown in Figure 2D, well-detectable TUNEL positivity appeared after proteinase K treatment of normal cells. In this case, the agarose prevented enlargement of the nuclei in the absence of the embedding step (compare the size of nuclei in Figures 1 and 2). This was similarly observed with proteinase K pretreatment and TUNEL labeling of chromatin spreads, as shown in Figure 3. In these samples, the chromatin fibers appeared to be tightly attached to the slide surface, probably not allowing any significant change in their position during the steps of the treatment.
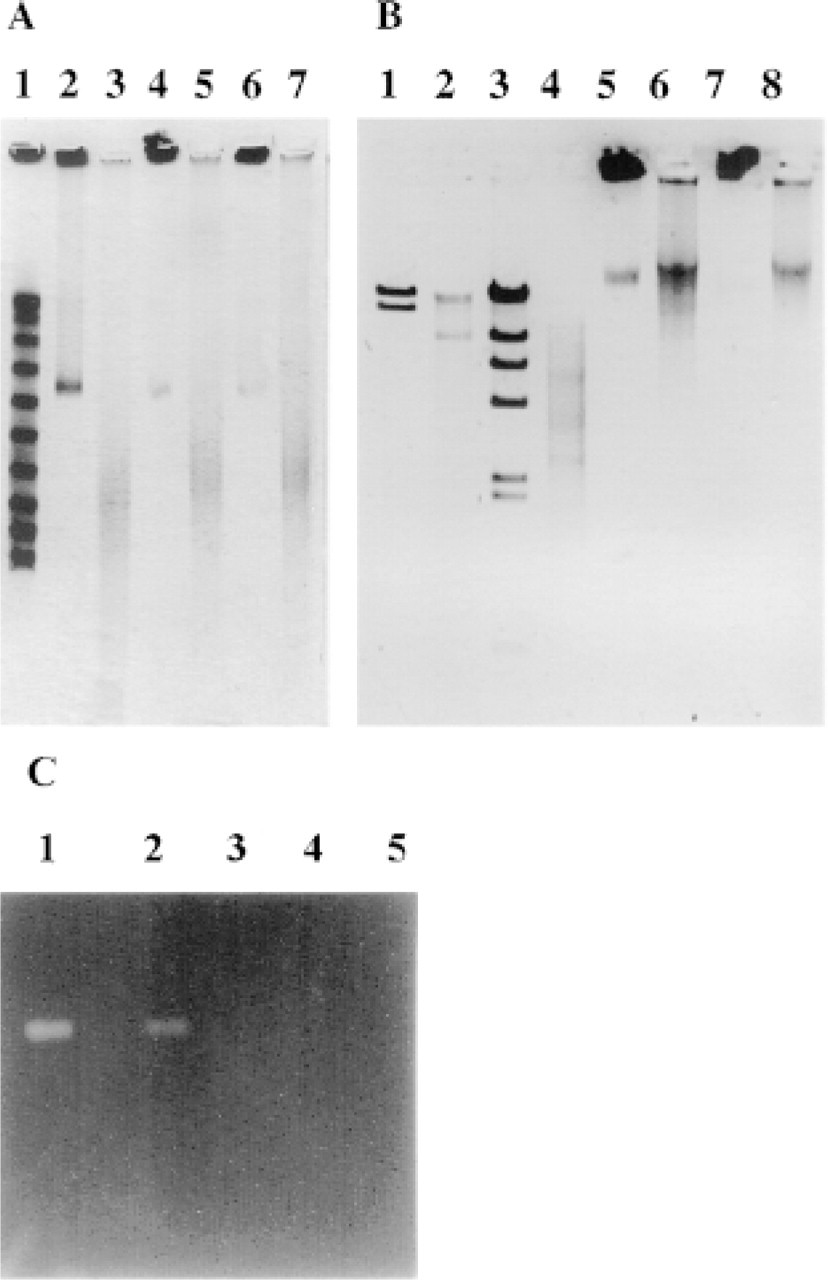
The nature and distribution of the DNA breaks apparently present in fixed normal cells were studied by an agarose gel electrophoretic technique that allowed simultaneous assay of ds (double-stranded) and ss fragments. The deproteinized cellular chromatin embedded in agarose plugs disintegrated into long ss molecules after 5-min incubation at 95C in the presence of 7 M urea (see Figure 4A), indicating that the supposedly intact (chromosome-long) DNA molecules in the plugs actually contain ss discontinuities revealed by heat denaturation. This effect apparently extended to most of the DNA content of the cells. Electrophoresis of plugs prepared from ethanol-fixed cells gave identical results (see Figures 4A, Lanes 6 and 7). The ss size of these fragments is between 50 and 250 kb and appears to be focused around 150 kb. It is noteworthy that size distribution does not differ much in apoptotic and normal cell-derived DNA. The oligonucleosomal ladder generated in the apoptotic cells obviously diffuses from the plugs. When cell lysates were prepared in suspension (without embedding the cells in plugs) in parallel experiments, the ladder was clearly discernible in the case of apoptotic cells but was absent from the non-apoptotic sample (not shown).
The possibility that the proteinase K batches used might have contained nuclease activity was thoroughly investigated. No differences were observed in the ratios of the supercoiled, circular, and linear forms of different plasmid DNA samples after prolonged incubation in 1 mg/ml proteinase K in the absence of EDTA (not shown), nor was any nuclease activity found when the activity gel procedure was applied, using sheared calf thymus DNA as substrate (Figure 4C). No nuclease activity was observed after prolonged incubation (detecting <10 pg of DNase I; not shown).
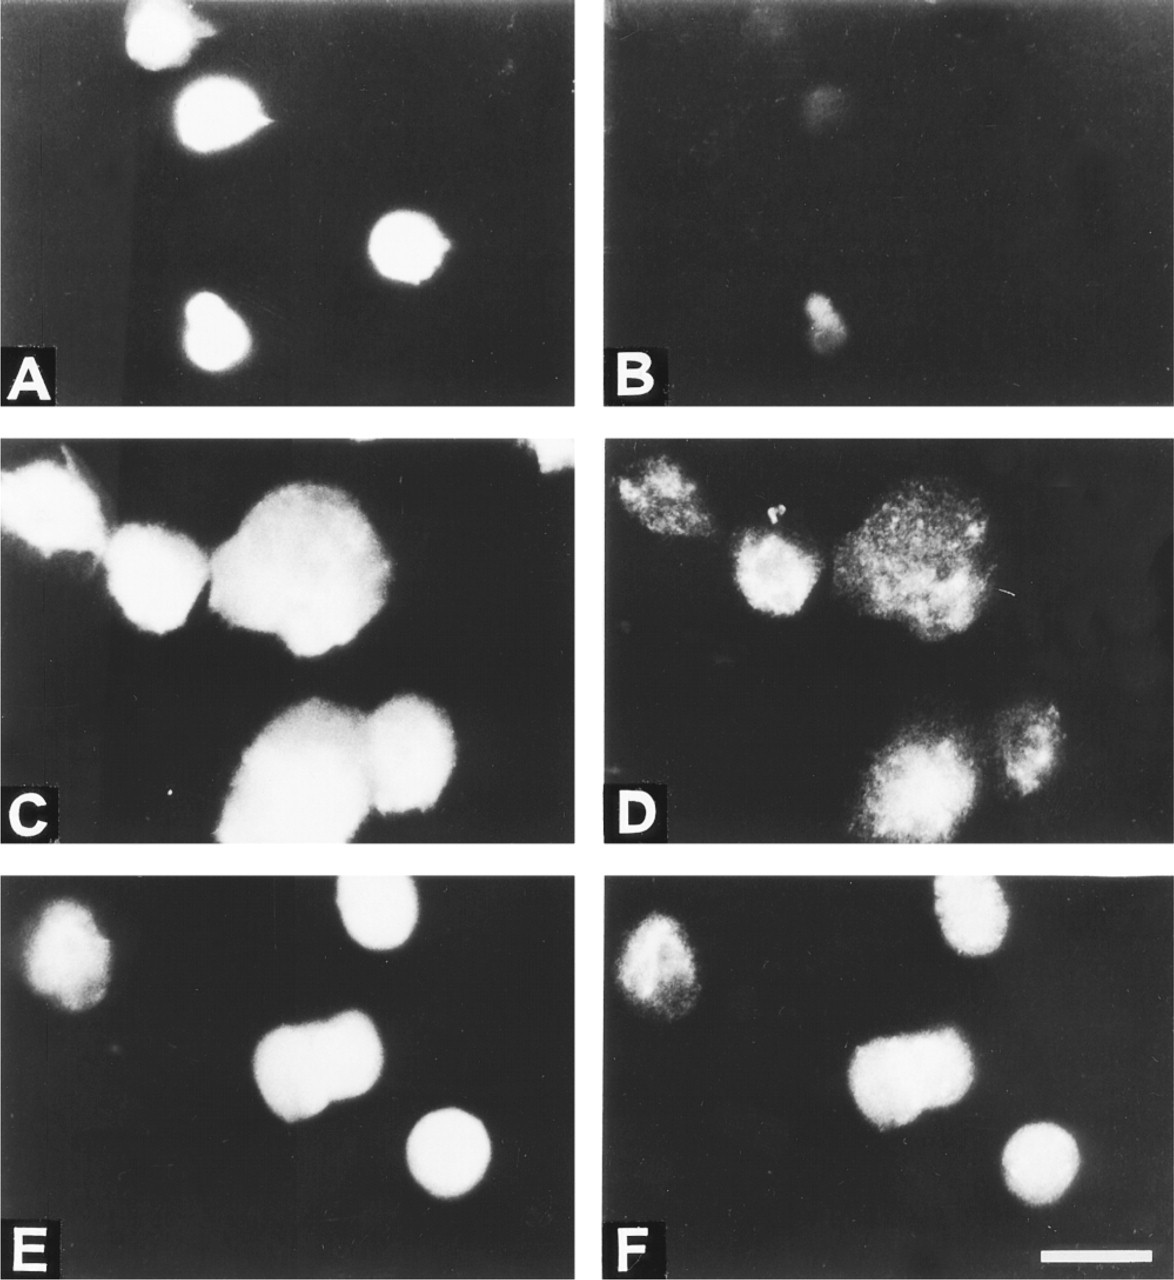
BrdU-TP TUNEL assay performed on formaldehyde-fixed cytocentrifuged samples. (
Discussion
Single-strand discontinuities regularly appearing in deproteinized samples of agarose-embedded cells, in line with the current observation of discontinuities detectable after protease digestion of fixed cells, were recently demonstrated (Varga et al. 1999). The nicks/gaps revealed by protease treatment are not restricted to mouse thymocytes, because similar protease-generated TUNEL positivity has been observed in various human cell lines (HL60, KB-3–1, JY; not shown). Therefore, the phenomenon appears to be general and not restricted to cells committed to apoptotic pathways.
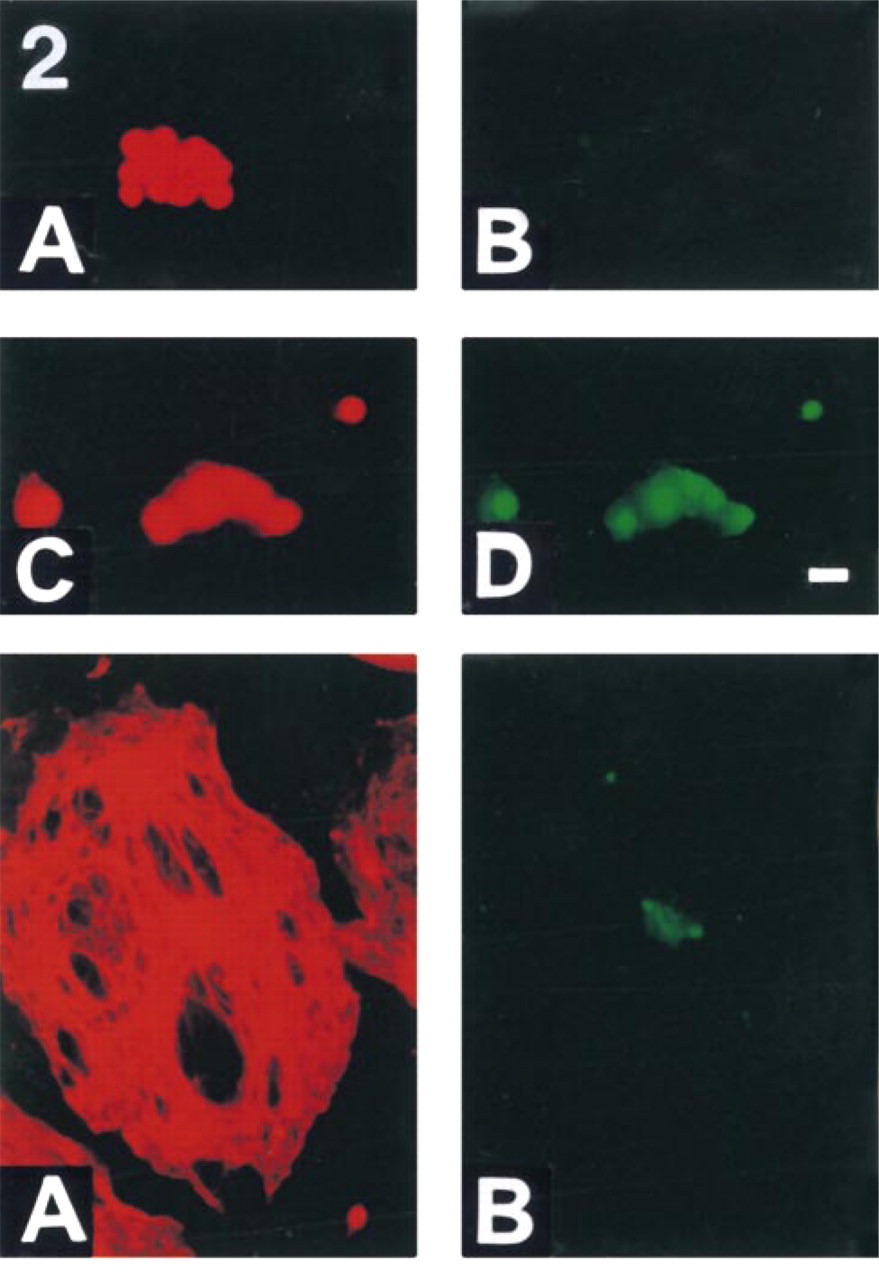
BrdU-TP TUNEL assay performed on cytocentrifuged samples of ethanol-fixed, agarose-embedded cells. (
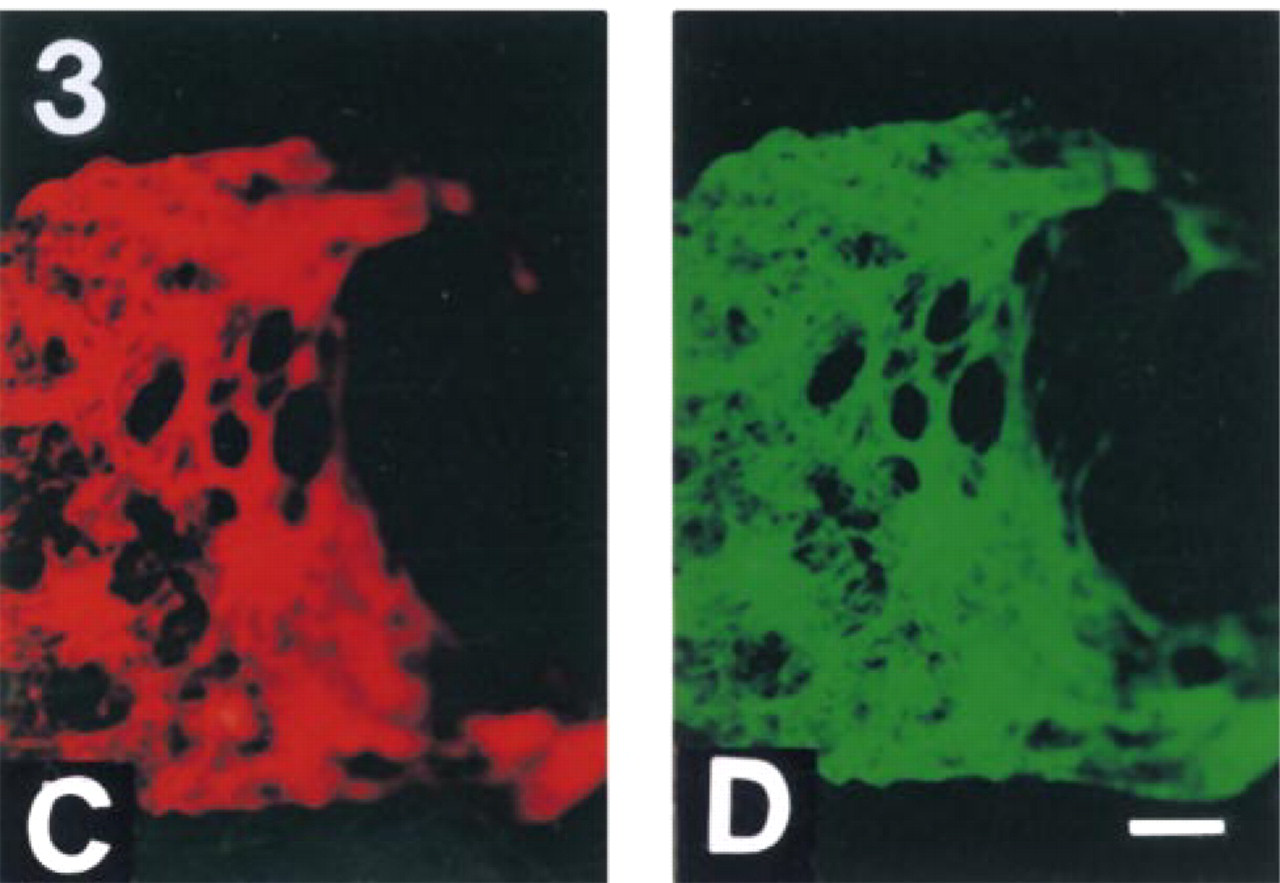
BrdU-TP TUNEL assay performed on chromatin spreads derived from normal non-apoptotic thymocytes. (
(
Without protease pretreatment, the nuclei of most normal formaldehyde- or ethanol-fixed cells were TUNEL-negative, as expected. The lack of labeling without pre-treatment suggests but does not prove that no DNA discontinuities are present in such samples. DNA ends might be present without being accessible until the protein-denaturing treatment makes them available for TdT. We favor this scenario among the possible mechanisms discussed below.
TdT labeling could be a trivial consequence of nuclease contamination in the proteinase K batch used. This possibility, however, is highly unlikely, because the molecular biology grade enzyme was self-digested before use. Several plasmid DNA samples resisted proteinase K digestion and were not even nicked after prolonged incubation with proteinase K (not shown). No nucleolytic activity was detected in the nuclease activity gels (Figure 4C). Furthermore, widely differing proteinase K concentrations were required to elicit TUNEL positivity in different cell types, with as low as 1 μg/ml enzyme concentration in the case of HL60 nuclei (not shown).
Another trivial explanation could be mechanical breakage, e.g., due to abrupt release of torsional stress in the course of the protease treatment. It was indeed observed that after proteinase K treatment the ethidium bromide picture of the fixed cells (nuclei) in the cytocentrifuged samples was conspicuously enlarged, showing massive topological rearrangement of the chromatin fibers. The concomitant spatial dislocation could lead to strand breaks, perhaps even at specific predilection points, providing explanation for a consequent TUNEL positivity in these proteinase K-treated samples. However, a similar degree of labeling followed the proteinase treatment of agarose-embedded fixed cells, in which the volume of the gel-encased nuclei was unchanged after proteinase, a case in point against this mechanism. Proteinase-generated TUNEL positivity was also observed in tightly slide-attached chromatin spreads (Figure 3), despite the fact that no change in the topology of the chromatin fibers was noted after proteinase digestion of these samples.
The distribution of the DNA breaks observed in normal fixed cells was studied by urea–agarose gel electrophoresis performed in the FIGE mode. Analysis of the normal thymocyte-derived samples demonstrated 50–250-kb ss fragmentation (see also Varga et al. 1999). No ds fragmentation was detected under 300 kb. Therefore, nicks or ss gaps and, less frequently, ds breaks (see the bands at 325 kb, in Figure 4A) must be present in the fixed cellular chromatin. Based on the size of the fragments, the frequency of the ss discontinuities is estimated to be on the order of 105 per cell. The absence of the oligonucleosomal ladder in the non-apoptotic sample lysed in suspension (unlike in similar samples derived from apoptotic cells; data not shown), suggests that such small fragments did not contribute to TdT labeling.
Although formaldehyde fixation can generate ss breaks (Saladino et al. 1985), the nicks/gaps labeled by TdT in this case are most likely not generated by the fixatives themselves, because TUNEL-positivity of normal cells after proteinase was also found after ethanol fixation, commonly used in DNA purification protocols.
DNA cleavages might arise during fixation when nucleases find access to the hypersensitive regions of a collapsing chromatin. Such hypersensitive regions were shown to occur at every ∼50 kb in isolated nuclei (Gromova et al. 1995; Szabó 1995). If such regions were accessible to soluble nucleases that survive for some time during fixation, the same regions would be expected to remain available for subsequent labeling with TdT, abrogating the need for protease.
The notion of discontinuities already present in living cells before fixation would be in line with the current finding of ss discontinuities in the genomic DNA detected on rapid alkaline lysis of agarose-embedded living cells (Szabó and Bacsó 1996). These ss discontinuities should then go unrecognized by the repair mechanisms. A topoisomerase-like mechanism (Hsiang and Liu 1989; Berger et al. 1996; Kaufmann 1998) would satisfy this requirement. The fact that protease digestion is necessary to reveal the free ends is compatible with such a model.
In view of the data, the TUNEL positivity of apoptotic cells may be partly related to the proteolytic intracellular environment characteristic of such cells. The proteolytic milieu of an apoptotic cell may open the chromatin at protease-sensitive sites for endogenous nucleases released or activated in the same process, just as proteinase K makes free ends accessible for TdT. Initial cleavage at such sites could then be followed by progressive DNA degradation, provided the appropriate nucleases are present. In line with this hypothesis, alteration of chromatin structure was shown to accompany and perhaps to precede DNA cleavage in various apoptotic systems (Peitsch et al. 1993a; McConkey et al. 1994; Walker and Sikorska 1997; Hughes et al. 1998).
Enhancement of TUNEL positivity of apoptotic cells by proteinase K pretreatment was reported earlier (Gold et al. 1994; Labat–Moleur et al. 1998; Rao et al. 1998), and proteinase K is a standard constituent of several TUNEL assay-based commercial kits, with protease digestion recommended as a step in the accompanying protocols. Apparently, the proteinaseelicited positivity of normal cells escapes detection at proteinase concentrations insufficient for the cell type or fixation protocol used. The difficulties often encountered in the standardization of the TUNEL-related experimental protocols might partly be due to the phenomenon described above.
Footnotes
Acknowledgements
Acknowledgments
Supported by the following grants: ETT 041/98; AKP 98-83 3,3; OTKA T030411, TO32563, and FKFP 1062/1997.
We thank Dr William Phares (Vienna, Austria) for advice on the urea–agarose technique. We gratefully acknowledge the conscientious technical assistance of Ms Enikö T. Pásztor.