
Abstract
Microscopy has become increasingly important for analysis of cells and cell function in recent years. This is due in large part to advances in light microscopy that facilitate quantitative studies and improve imaging of living cells. Analysis of fluorescence signals has often been a key feature in these advances. Such studies involve a number of techniques, including imaging of fluorescently labeled proteins in living cells, single-cell physiological experiments using fluorescent indicator probes, and immunofluorescence localization. The importance of fluorescence microscopy notwithstanding, there are instances in which electron microscopy provides unique information about cell structure and function. Correlative microscopy in which a fluorescence signal is reconciled with a signal from the electron microscope is an additional tool that can provide powerful information for cellular analysis. Here we review two different methodologies for correlative fluorescence and electron microscopy using ultrathin cryosections and the advantages attendant on this approach.
Keywords
T
Some Examples of Correlative Microscopy
Correlative microscopy can provide unique information that is difficult to obtain with a single imaging regimen. A recent example is provided by a study of the cytoskeletal proteins myosin II and tubulin (Svitkina and Borisy 1998). These proteins were fluorescently labeled and microinjected into living cells so that their dynamic behavior could be determined in real time in the fluorescence microscope. Then, the cells were prepared for electron microscopy by which the characteristic morphology of structures containing these proteins could be analyzed. However, most proteins lack distinctive features visible by conventional electron microscopy and therefore must be detected indirectly, usually with antibodies. In some cases, two secondary probes are used, one with a fluorochrome and the other with a gold particle (Tokuyasu et al. 1978; van Dam et al. 1991; Sun et al. 1995). In other cases, the antibody, usually the secondary, bears both tags (Powell et al. 1997; Takizawa et al. 1998; Pombo et al. 1999). Care must be taken to ensure that the fluorescence signal in such probes is not reduced (Goodman et al. 1991) by fluorescence resonance energy transfer to the gold particle (Powell et al. 1998). Metal (e.g., gold) cluster compounds (0.8–1.4-nm diameter) can be used as alternatives to colloidal gold as particulate immunoprobes (Hainfeld and Furuya 1992). They contain a defined number of atoms and can be covalently attached to antibodies. (Proteins bind to colloidal gold electrostatically.) Fluorochromes can be coupled subsequently to generate unique immunoprobes known as FluoroNanogold (FNG). Conjugation of a fluorochrome and a gold cluster compound to generate FNG does not appear to affect the fluorescence intensity (Powell et al. 1998). Advantages and disadvantages of FNG have been reviewed (Robinson et al. 1998, 2000). Photo-oxidation of diaminobenzidine (DAB) has also been used to couple fluorescence and electron microscopy (Maranto 1982; Pagano et al. 1989; Deernick et al. 1994). The use of green fluorescent protein (GFP)-tagged proteins for correlative light and electron microscopy offers exciting opportunities to probe further into the relationship between cell structure and function. Combined live cell fluorescence microscopy of GFP–vesicular stomatitis virus G protein (VSVG) and immunoelectron microscopy for localization of VSVG have been applied to the analysis of transport intermediates from the Golgi to plasma membrane (Polishchuk et al. 2000).
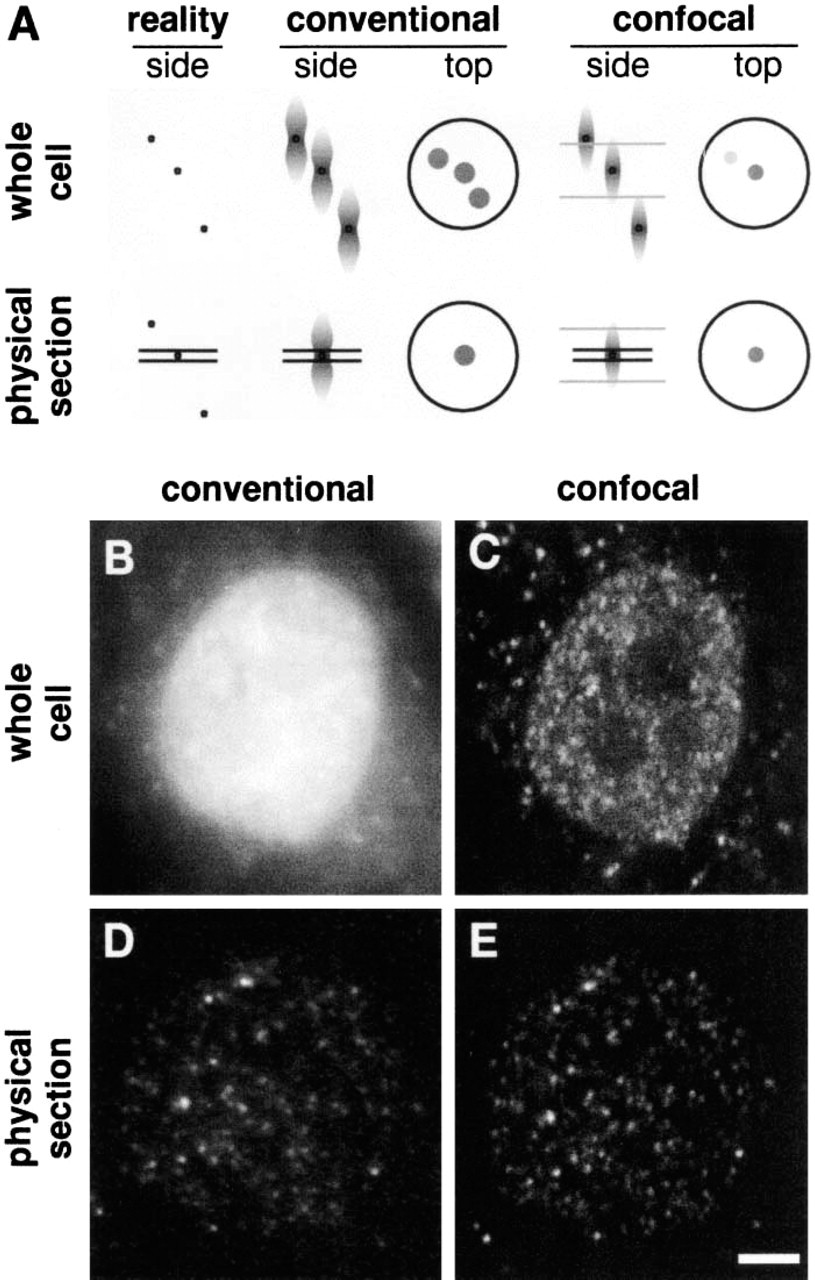
The theoretical basis of the improved resolution obtained when viewing small objects (diameter ~50 nm) within cells and improved resolution in practice using ultrathin cryosections, as illustrated by imaging transcription sites in HeLa cells. (
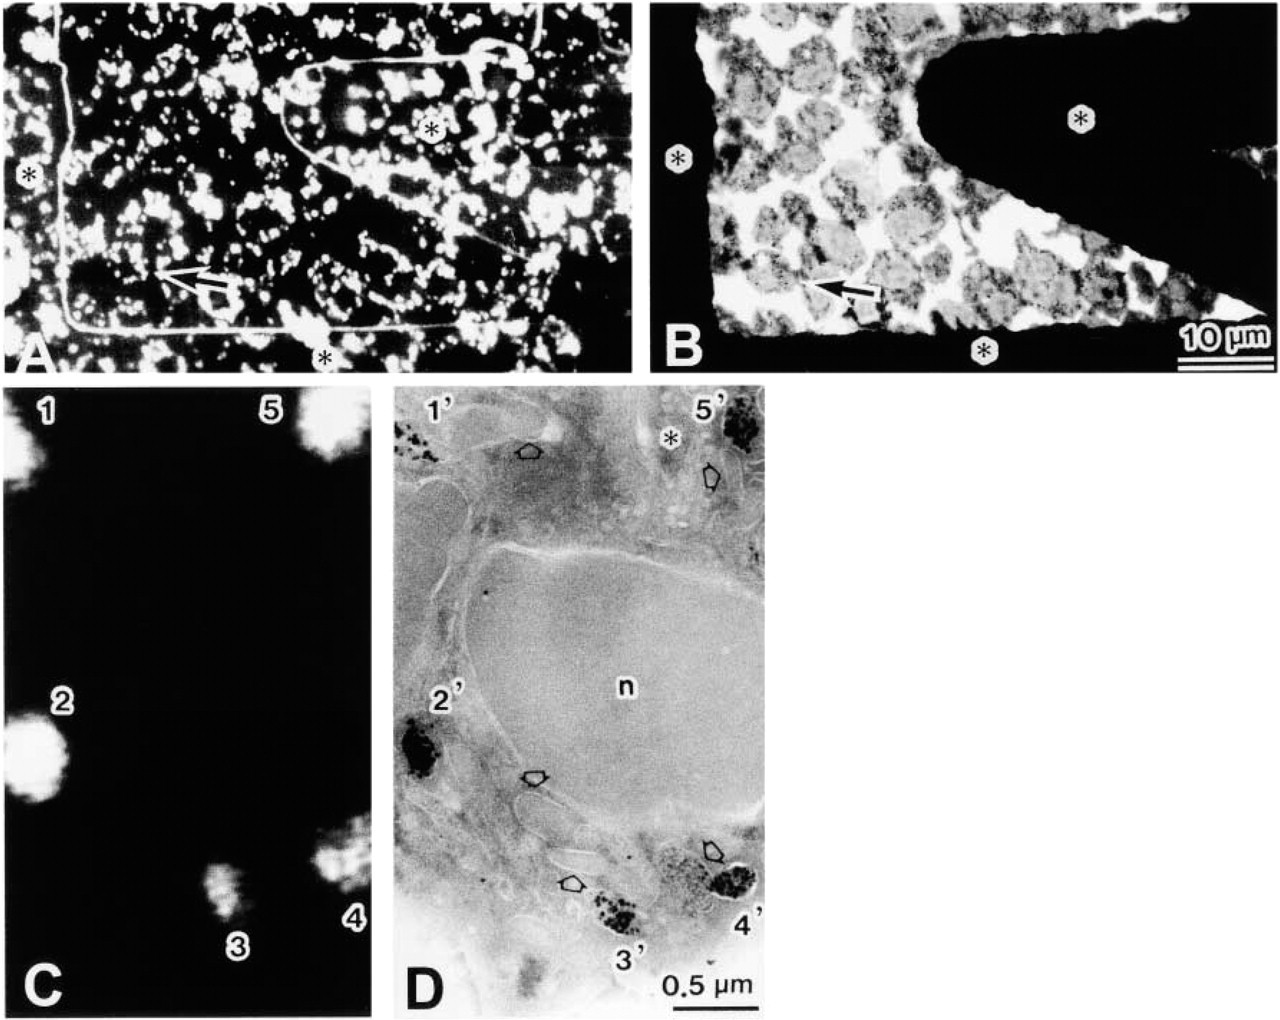
Correlative light and electron microscope level immunolocalization of lactoferrin in ultrathin cryosections (~100 nm) of human neutrophils using FNG as the reporter system. (
Bridging the Resolution Gap with Ultrathin Cryosections
It is often important to section cells and tissues before microscopic examination. However, biological materials are usually fragile and optimal sections cannot be obtained without embedding the sample in a supporting medium. Waxes and resins are often used for this purpose. Alternatively, samples can be frozen before sectioning. Methodology for preparing ultrathin cryosections in which the sample is fixed, frozen, and the vitrified sample is sectioned has been developed (e.g., Bernhard and Leduc 1967; Christensen 1971). This technique proved especially valuable for immunocytochemistry (Tokuyasu and Singer 1976; Tokuyasu 1980).
The resolution of the confocal microscope is typically ~200 nm in the x- and y-axes and ~500 nm in the z-axis (Inoué 1995). The resolving power of the transmission electron microscope is at least two orders of magnitude greater. There are many situations in which improvement in resolution is important in the analysis of supramolecular complexes. The relatively poorer resolution of conventional optical microscopy, particularly in the z-axis, can be improved with the use of sophisticated deconvolution software (Agard and Sedat 1983; Carrington et al. 1995; Scalettar et al. 1996) or confocal microscopy (White et al. 1987). Both approaches have been applied extensively to fluorescence microscopy. The thickness of an optical section (e.g., in the confocal microscope) is governed by optical parameters that are reviewed by Majlof and Forsgren (1993). They describe the thickness of a confocal section (Rd) for the special case of an infinitely small confocal aperture as:
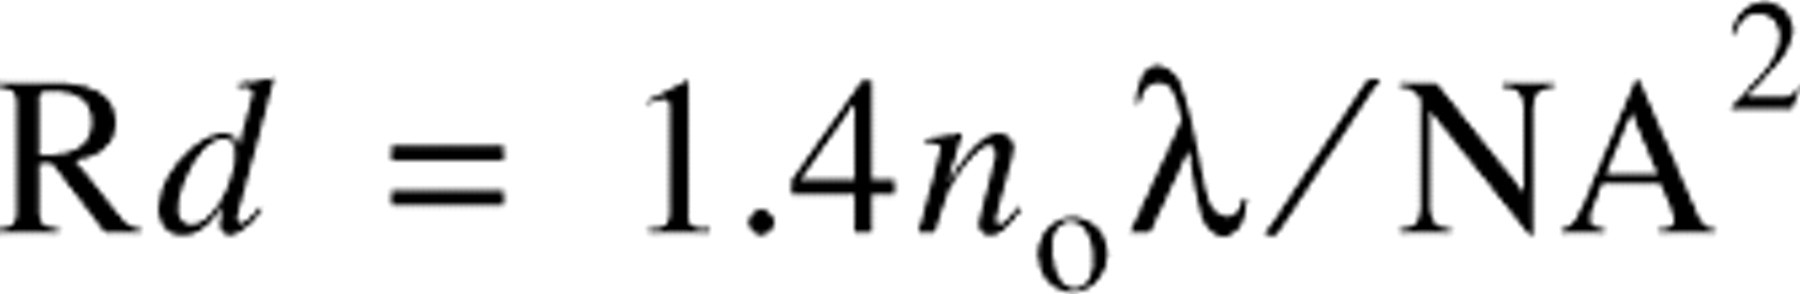
where n o is the refractive index of the immersion medium, γ is the wavelength, and NA is the numerical aperture. In normal microscopy preparations with a wavelength of 500 nm and an NA of 1.4, Rd is ~500 nm.
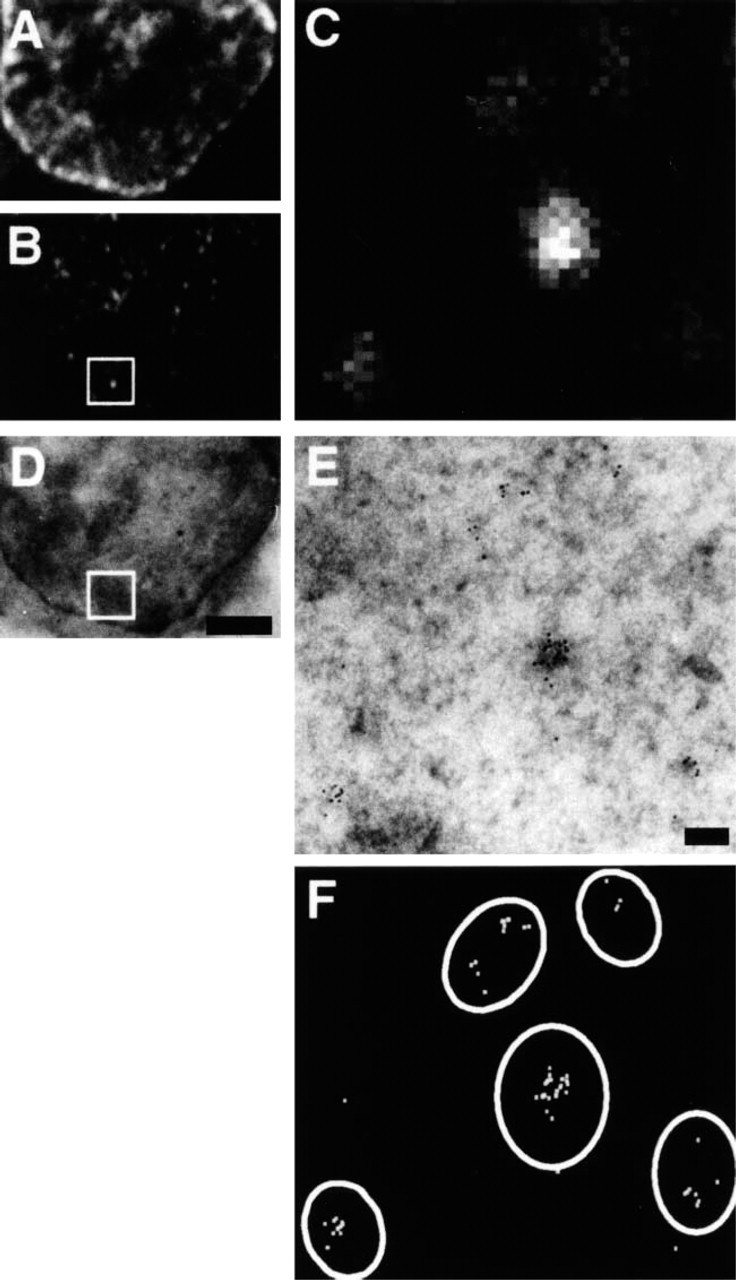
Imaging the same transcription sites by confocal and electron microscopy. HeLa cells were permeabilized, allowed to extend nascent transcripts in Br-UTP for 15 min, fixed, and cryosections (~150 nm) prepared. One cryosection was transferred onto a glass coverslip, Br-RNA indirectly immunolabeled with FITC–protein A adsorbed to 6-nm gold particles, and nucleic acids counter-stained with TOTO-3. Green (FITC; Br-RNA) and far-red (TOTO; nucleic acids) images were collected on the confocal microscope. Then the section was flat-embedded in Epon, and the resulting block resectioned. Finally, the end section (~150 nm) was imaged in the electron microscope. (
In addition to confocal and deconvolution microscopy, one can minimize problems associated with z-axis resolution (i.e., ~500 nm) by imaging thin sections (100–150 nm in thickness) (Ishiko et al. 1998; Takizawa et al. 1998; Pombo et al. 1999). In this case, all fluorescence signals must come from within the thickness of the cryosection (Figure 1). This has the practical effect of improving z-axis resolution. This apparent, or practical, improvement is especially noted when small and numerous objects are imaged.
The use of thin cryosections can also reduce the chromatic aberration inevitably associated with the simultaneous collection of multicolor images. Consider, for example, imaging two different antigens in one multiprotein complex with red and green fluorochromes to determine if they co-localize. Because light of different wavelengths is diffracted to different degrees, the red and green images cannot both be exactly in focus. This chromatic aberration becomes acute when objects lying at different depths in cells (or confocal sections) are imaged. However, it can be minimized simply by using cryosections. An in-focus image of one fluorochrome is collected, filters are switched, the microscope refocused, and an image of the second fluorochrome collected (Pombo et al. 1999). Then both images are in focus, easing comparison.
Correlative Microscopy with Ultrathin Cryosections: Two Applications
Neutrophils display a characteristic range of physiological and biochemical responses on exposure to appropriate stimuli (e.g., phagocytosable particles, chemotactic peptides). Most biochemical studies of stimulus-dependent events (e.g., exocytosis) are carried out on neutrophils in suspension. Lactoferrin has been localized to granules in these rounded cells using rabbit primary antibodies and FNG secondary antibodies (Takizawa et al. 1998). Not surprisingly, it is impossible to resolve individual granules in fluorescence images of whole cells; the cell “glows” as granules in the focal plane are obscured by out-of-focus flare from those lying above and below. Confocal microscopy of whole-cell preparations increases resolution of individual granules (not shown), but those preparations are not directly amenable to subsequent electron microscopy. We therefore employed ultrathin cryosections and FNG as the detection system for immunolocalization. Then, discrete fluorescent granules were observed, while the gold clusters could be seen in the electron microscope after silver enhancement. (Size enhancement of the ultrasmall immunogold is required for routine visualization.) Imaging the same cryosections by light and electron microscopy allows comparison of the two signals (Figure 2). These results illustrate the power and convenience of this methodology.
The visualization of transcription sites provides a second example (Pombo et al. 1999). Permeabilized HeLa cells were allowed to incorporate Br-UTP into RNA. Then nascent transcripts at the site of transcription were indirectly immunolabeled with a primary antibody that reacts with Br-RNA, a secondary antibody, and a protein A–FITC–gold (6-nm) complex (Figure 3). Finally, samples were prepared and imaged in the light and electron microscopes. All sites seen in the light microscope could be detected in the electron microscope and, surprisingly, 83% of the sites were resolved by the light microscope (Pombo et al. 1999).
Benefits of Ultrathin Cryosections for Correlative Microscopy
Immunofluorescence microscopy can allow high throughputs and detection of several different antigens with great sensitivity. The use of ultrathin cryosections brings additional advantages. First, immunolabeling is improved, antigenicity is preserved, and antibodies penetrate more easily deeply into thin sections. Second, images are sharper; z-axis resolution is higher, backgrounds are lower (because out-of-focus flare is eliminated), and one kind of chromatic aberration can be reduced (see above). Third, correlative microscopy is facilitated. This brings additional resolution and, importantly, the ability to confirm that a structure seen by light microscopy is the same as another seen by electron microscopy. The two different preparative procedures we have employed are summarized in Figure 4. Of course, correlative microscopy depends on probes that can be imaged in both light and electron microscopes, and fortunately such probes are now available or can be prepared easily. Although the methods described here are useful for work with single cells, their most important applications may be in the study of tissues, in which correlative microscopy has been more difficult to accomplish.
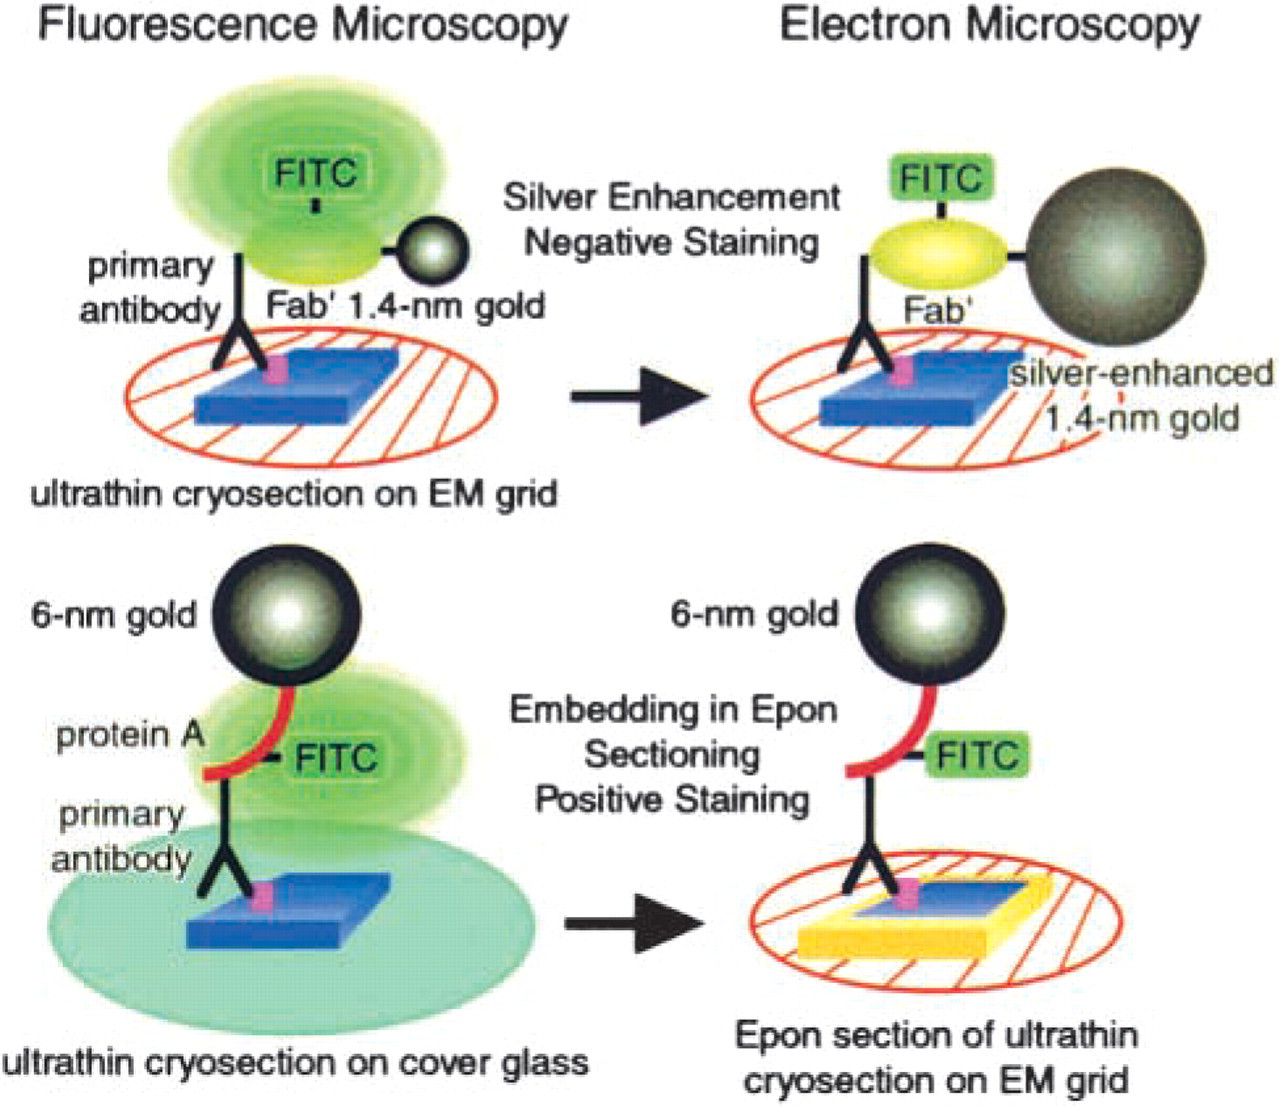
Summary of the preparative procedures used in Figures 2 and 3. The upper portion illustrates the use of FNG as the reporter system for imaging ultrathin cryosections by fluorescent and electron microscopy. In this case, the ultrathin section was collected on an EM grid before immunolabeling. It was subsequently mounted between a microscope slide and a coverslip for light microscopy. The slide preparation was then disassembled and the size of the FNG increased by silver enhancement before electron microscopy. The lower portion of the figure illustrates the second approach. Here the ultrathin section was collected on a glass coverslip before immunolabeling; the reporter system was colloidal gold (6 nm) to which protein A and FITC were conjugated. After observation with the fluorescence microscope, the ultrathin cryosection was embedded in Epon resin. Sections from the Epon block were cut and collected on EM grids, stained, and observed with the electron microscope. In both instances, the same subcellular structures were observed by both fluorescence and electron microscopy.
Footnotes
Acknowledgements
Supported in part by the following grants: NIH HD38764, HD35121, and the American Heart Association (JMR); The Wellcome Trust (PRC), Royal Society (AP), and grants-in-aid for scientific research and project grants of the Center for Molecular Medicine of Jichi Medical School from the Ministry of Education, Science, Sports, and Culture of Japan (TT).