
Abstract
Pancreatic β-cells contain large amounts of zinc. We took advantage of this to try to localize, quantify, and isolate insulin-producing cells from islet preparations. Our study was designed to identify a non-toxic zinc-sensitive fluorescent probe able to selectively label labile zinc in viable β-cells and to exhibit excitation and emission wavelengths in the visible spectrum, making this technique exploitable by most instruments. We tested Newport Green, a probe excitable at 485 nm with a dissociation constant in the micromolar range corresponding to a low affinity for zinc. The loading of the lipophilic esterified form of Newport Green was easy, rapid, specific, and non-toxic to cells. Confocal microscopy highlighted an intense fluorescence associated with secretory granules. Regression analyses showed a good relationship between zinc fluorescence and islet number (r = 0.98) and between zinc fluorescence and insulin content (r = 0.81). The determination of Zn fluorescence per DNA enabled us to assess the quality of the different islet preparations intended for islet allografting in terms of both purity and viability. Cell sorting of dissociated Newport Green-labeled cells resulted in a clear separation of β-cells, as judged by insulin content per DNA and immunocytochemical analysis. This zinc probe, the first able to specifically label living cells in the visible spectrum, appears very promising for β-cell experimentation, both clinically and for basic research.
Keywords
P
Materials and Methods
Human Islet Processing
Human pancreata (n = 11; mean age 35 ± 12 years) were harvested from adult brain-dead donors in accord with French Regulations and with the local Institutional Ethical Committee. Pancreatic islets were isolated after ductal distension of the pancreata and digestion of the tissue with Liberase (Roche Diagnostics; Meylan, France) according to the automated method of Ricordi et al. (1988), with modifications (Kerr–Conte et al. 1994). Semipurification was achieved with Histopaque (Sigma; Saint-Quentin Fallavier, France) discontinuous density gradients using a cell separator (Lake et al. 1989). Islet number and diameter were determined on triplicate samples of each preparation after dithizone (DTZ) staining (Latif et al. 1988) and expressed in islet equivalents (IEs) corresponding to islets with a diameter of 150 μm (Ricordi et al. 1990). Islet viability was assessed in each preparation by microscopic examination after staining with DTZ and trypan blue. Preparations used in this study exhibited an 86 ± 5% viability and an average yield of 2320 ± 420 IE/g. Semipurified islets were cultured for 24 hr at 37C in CMRL 1066 medium with 2% Ultroser G (Gibco BRL; Life Technologies, Cergy–Pontoise, France) and antibiotics.
Cell Culture
Pancreatic β-cells of murine origin, including INS-1 kindly obtained from Dr. Wolheim (Asfari et al. 1992) and β-TC3 from Dr. Efrat (Efrat et al. 1988), were used to ascertain some features of the probe. Culture medium for INS-1 cells consisted of RPMI-1640 containing 10% fetal calf serum (FCS), 1.1 mM sodium pyruvate, 50 μM 2-mercaptoethanol, and antibiotics. For β-TC3 cells, DMEM containing 2.5% FCS, 15% horse serum, and antibiotics was used.
Fluorescence Labeling with Newport Green
Newport Green (Molecular Probes Europe; Leiden, The Netherlands) is available as a salt (potassium form, NG-K) or an ester (diacetate form, NG-Ac). The water-soluble potassium form was used for fluorometric studies designed to determine both binding constants from titration curves of ZnCl2 and specificity from other metal ion solutions. NG-K (6 μM) was added to 96-well microplates and left in the dark for 10 min. Fluorescence was measured at room temperature in a fluorophotometer equipped with microtiter plate accessories (Fluorocount; Packard, Rungis, France). The Newport Green indicator exhibited an increase in fluorescence emission on binding Zn, with a slight shift in wavelength; single excitation and emission spectral peaks were measured at wavelengths of 485 and 530 nm, respectively.
The ester form (NG-Ac) was used for fluorescent studies on living cells. NG-Ac is cell-permeant and can therefore diffuse across cell membranes. Once inside the cells, this ester is cleaved by intracellular esterases to yield a cell-impermeant fluorescent indicator able to bind zinc. Cells in PBS were exposed for 30 min at 37C to 25 μM NG-Ac containing 1.5 μl/ml Pluronic F127 to enhance the penetration of the probe. After washing in PBS, the fluorescence was estimated in microwell plates as described above or analyzed by confocal microscopy or cell sorting. Standardization of fluorescence in spectrofluorometric measures was achieved using a blank consisting of 25 μM NG-Ac in PBS set at a fixed and constant unit of fluorescence.
Cell Distension and Dissociation
Distension of islets was performed for 5 min at 37C in a dispersion buffer consisting of Earle's balanced salt solution without Ca2+ and Mg2+ and supplemented with 10 mM HEPES, 3 mM EGTA, 2.8 mM glucose, and 2.5 mg/ml BSA.
Total dissociation of cells from islet preparations was achieved on islet pellets (200 × g, 3 min) by gentle pipetting for 10 min in 4.5 ml dispersion buffer. An enzymatic dissociation was then performed by the addition of 100 μg/ml trypsin. The reaction was stopped by 2 volumes FCS and 1 volume 0.035% (w/v) trypsin inhibitor (Type 1-S; Sigma) when about 80% of islet cells appeared as single cells. The cell suspension was centrifuged (500 × g, 5 min) and the pellet suspended in F10 medium without Ca2+ and containing 2.8 mM glucose. The cell suspension was then filtered through a 70-μm nylon screen.
Confocal Microscopy
Confocal microscopic analyses were performed using a confocal inverted microcope (Leica TCS-NT; Rueil–Malmaison, France) on dissociated cells or on whole islets plated in Lab-Tek chambers with coverslips (Nalge Nunc International; Naperville, IL) coated with poly-
Cell Sorting
Cell sorting was performed after total dissociation of islet cells. Staining was achieved after a period of 90 min in F10 medium without Ca2+ and containing 2.8 mM glucose.
We used either an Epics XL-MCL or an Epics Elite Coulter flow cytometer equipped with an argon-ion laser (Coultronics; Margency, France). Excitation was performed with the 488-nm blue line of the laser and emission measured through a 530/30 bandpass filter.
Insulin Content and Secretion
Insulin content in human pancreatic islets was measured after cell pelleting by centrifugation and homogenization by sonication (20 Khz, 30 W) for 15 sec in 200 μl Tris-HCl containing 1 mM EDTA, pH 7.4, and frozen-stored at −20C. The islet insulin content was measured by radioimmunometric assay (Bi-insulin; IRMA Diagnostics, Pasteur, France) after an overnight acid–ethanol (0.18 M HCl in 95% ethanol) extraction of 50-μl aliquots of the homogenates at 4C. Insulin secretory responses were studied as follows: 1 hr preincubation in Kreb's buffer containing 3.6 mM glucose followed by three successive incubation periods of 1 hr each with 3.6, 16.7, and 3.6 mM glucose. Incubation media were collected for assay of insulin secretion from the cells. The stimulation indices were calculated by dividing insulin secretion in the presence of high glucose by mean basal insulin secretion levels.
DNA Assay
DNA was assayed in aliquots of homogenates using Pico Green (Molecular Probes) as the fluorescent probe at a 1:200 dilution in PBS containing 20 mM EGTA. After a brief period of contact (15 min), the samples were excited at 485 nm and the fluorescence emission intensity measured at 530 nm.
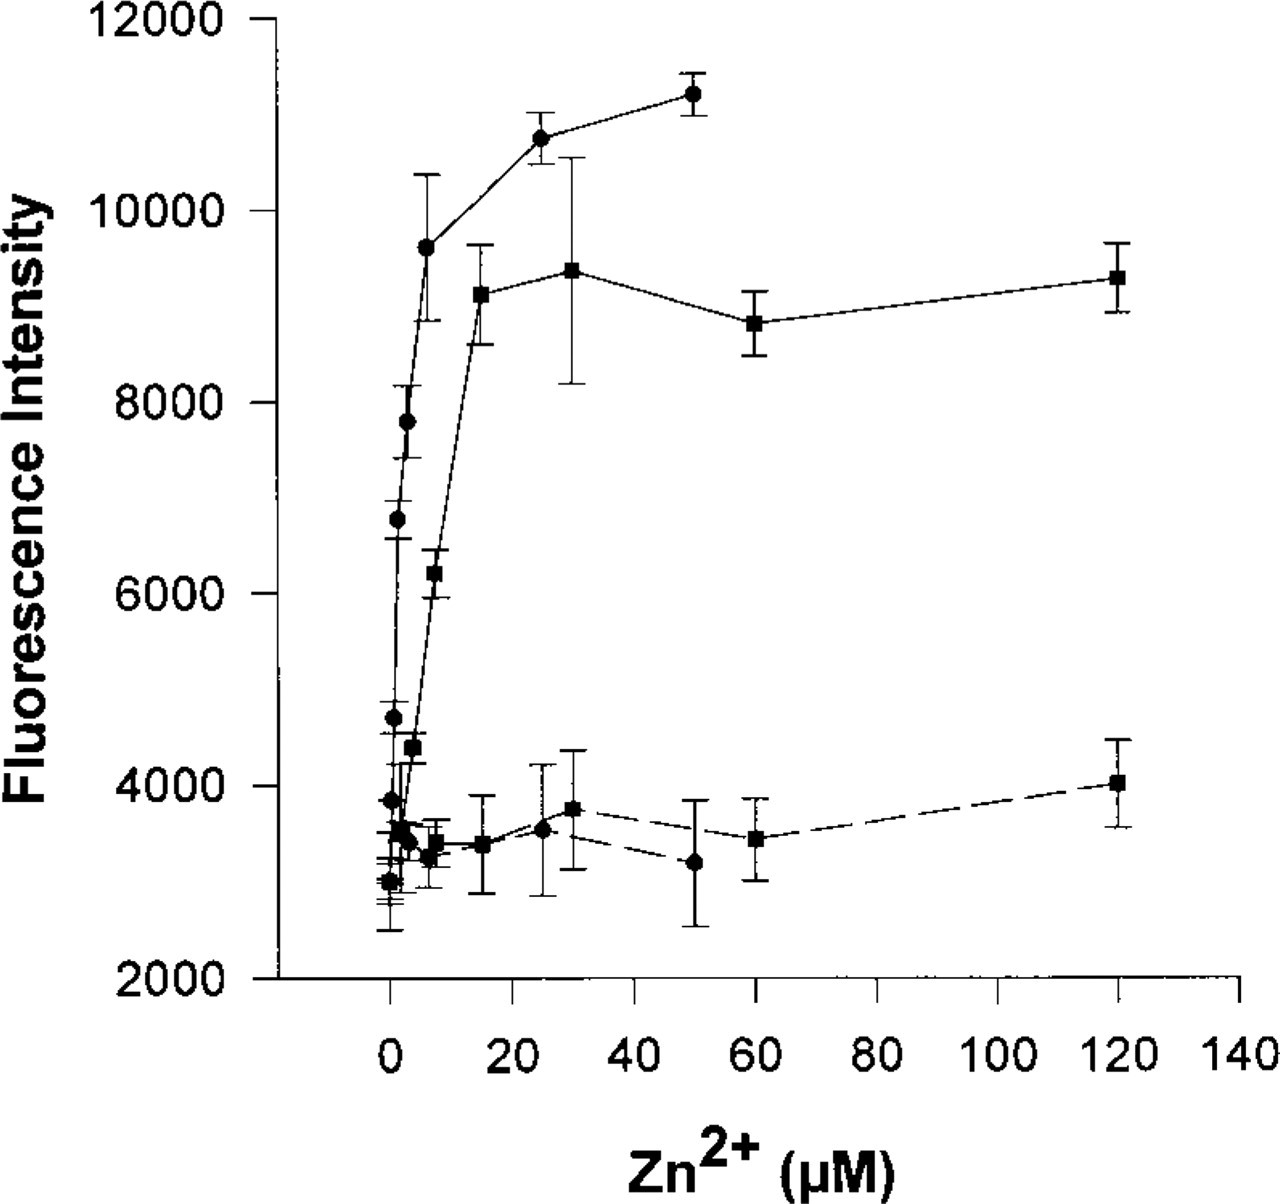
Fluorescence intensity of NG as a function of Zn2+ concentration. •, Zn2+ was in the form of ZnCl2 in 10 mM Tris-HCl; ▪, Zn2+ was in the form of Zn-insulin solution (Actrapid; Novo Nordisk; 40 IU/ml corresponding to 100 μM Zn2+); —, incubation with NG potassium salt solution (NG-K, 6 μM); —, incubation with NG esterified form in PBS (NG-Ac, 25 μM). Values are the means ± SEM of 16 experiments (ZnCl2) or four experiments (Actrapid). Excitation wavelength 485 nm; emission wavelength 530 nm.
Immunocytochemical Analysis
Cells were cultured on glass coverslips, washed with PBS to remove serum, and processed at 4C as described by Brelje et al. (1989). Briefly, they were fixed for 18 hr in Zamboni's fixative (Stefanini et al. 1967) and, after extensive washings in Sorenson's PBS containing 0.1% Triton X-100, they were incubated with 10% normal goat serum in PBS containing 0.1% Triton X-100 (PBS-T) for 4 hr. After washings in PBS-T, cells were incubated for 18 hr with a 1:300 dilution of the primary antibody (monoclonal antibody to insulin/proinsulin; Biogenesis, Newfields, UK). The incubation was stopped by three washings in PBS-T, followed by a second one for 18 hr with either a 1:100 dilution of a fluorescein isothiocyanate-conjugated anti-mouse immunoglobulin (Dako; Trappes, France) or a 1:500 dilution of anti-mouse immunoglobulin revealed with phtaloRed from Kirkegaard & Perry (Gaithersburg, MD). Controls included replacing the primary antobody with PBS containing 1% BSA. Nuclei were counterstained with Carazzi's hematoxylin.
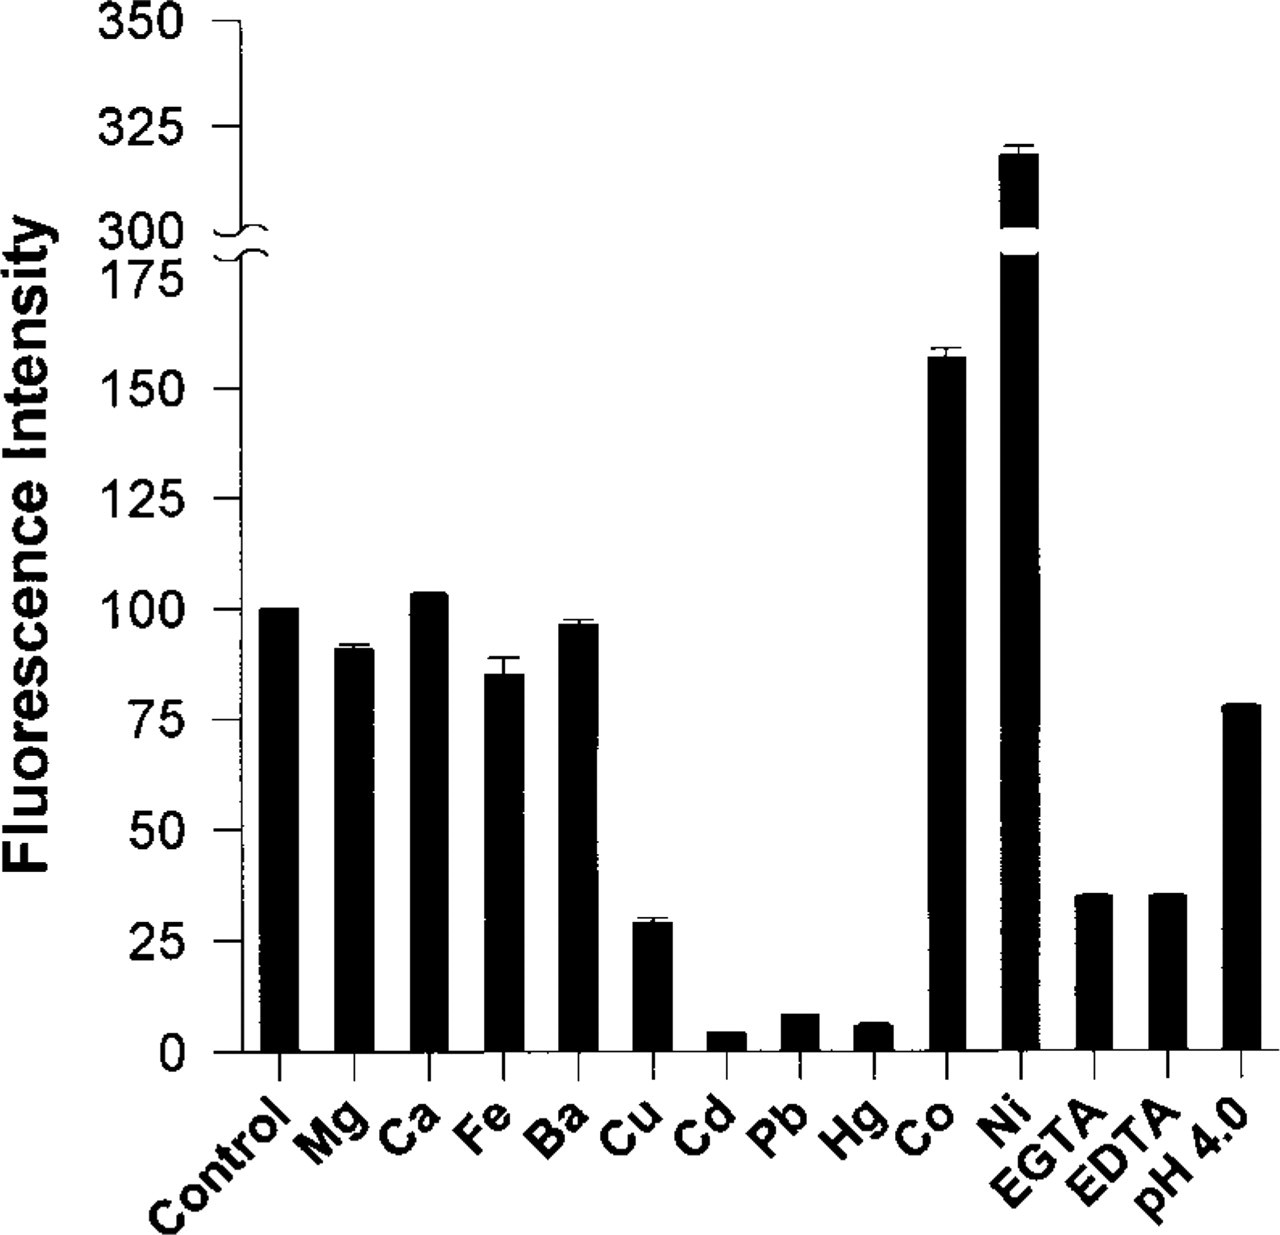
Specificity of NG fluorescence for zinc. Zn2+ (6 μM) was incubated with 2.5 μM NG-K (control). The following competitors were added: Mg2+ and Ca2+ at the final concentration of 1 mM, Fe2+, Ba2+, Cu2+, Cd2+, Pb2+, Hg2+, Co2+, Ni2+ at the final concentration of 100 μM; and EGTA and EDTA at the final concentration of 1 mM. Values are expressed as a percentage of control values and are the means ± SEM of four experiments.
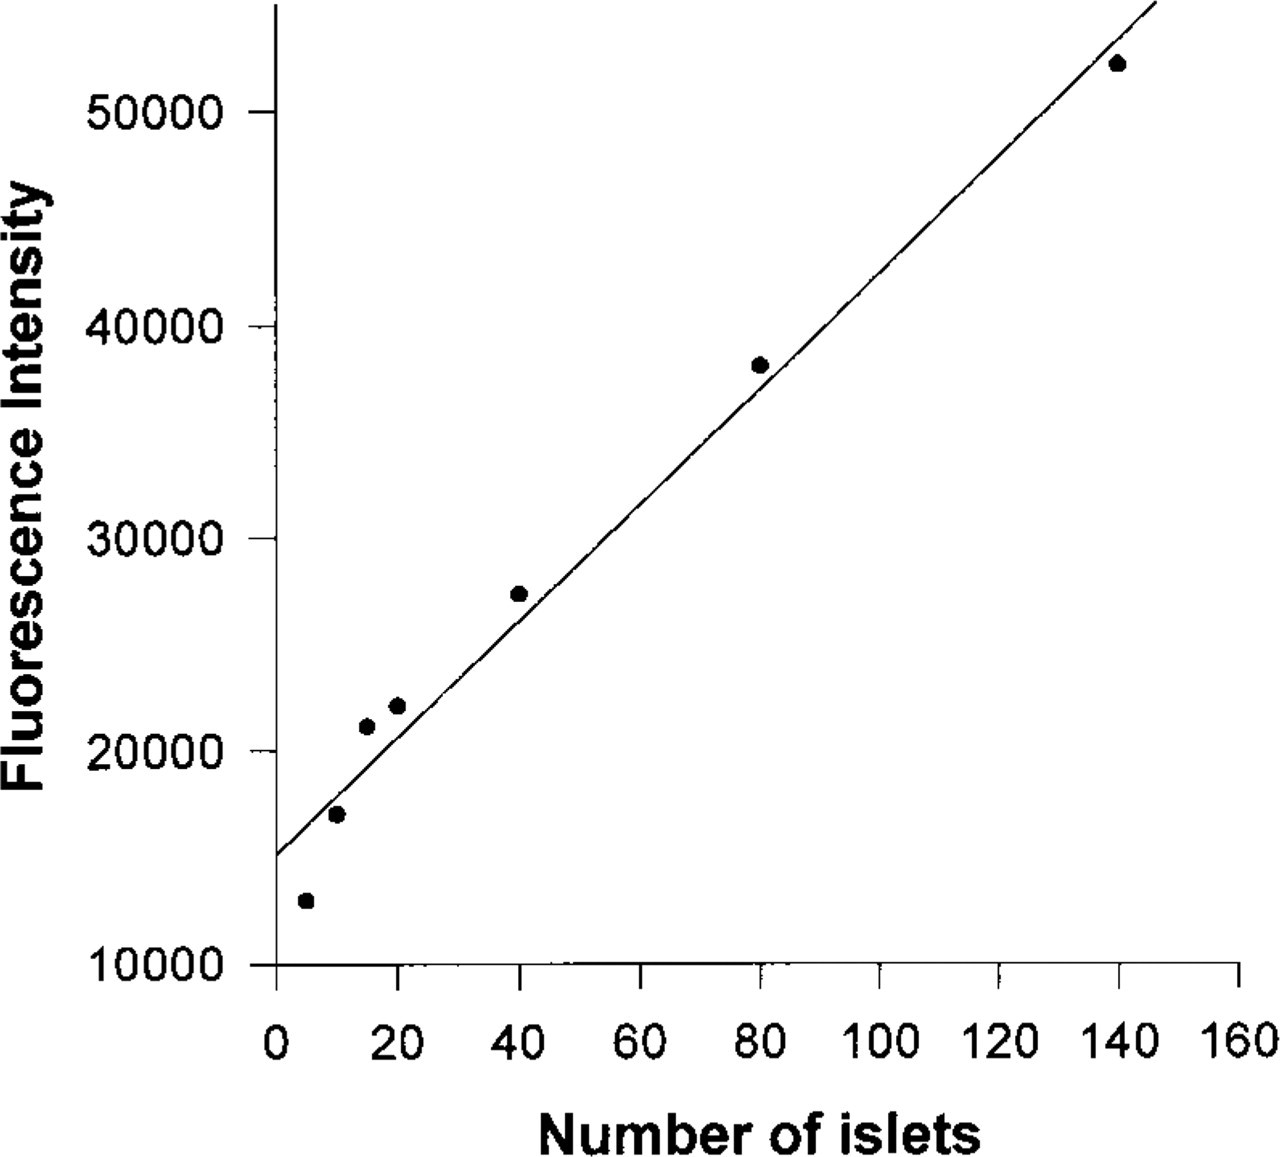
Correlation between NG fluorescence and number of islets. “Handpicked” islets were incubated in 1 ml NG-Ac (25 μM) after distension of cells for 5 min as described in Materials and Methods. The regression equation was y = 272 × + 15, 203; r = 0.989; p < 0.0001.
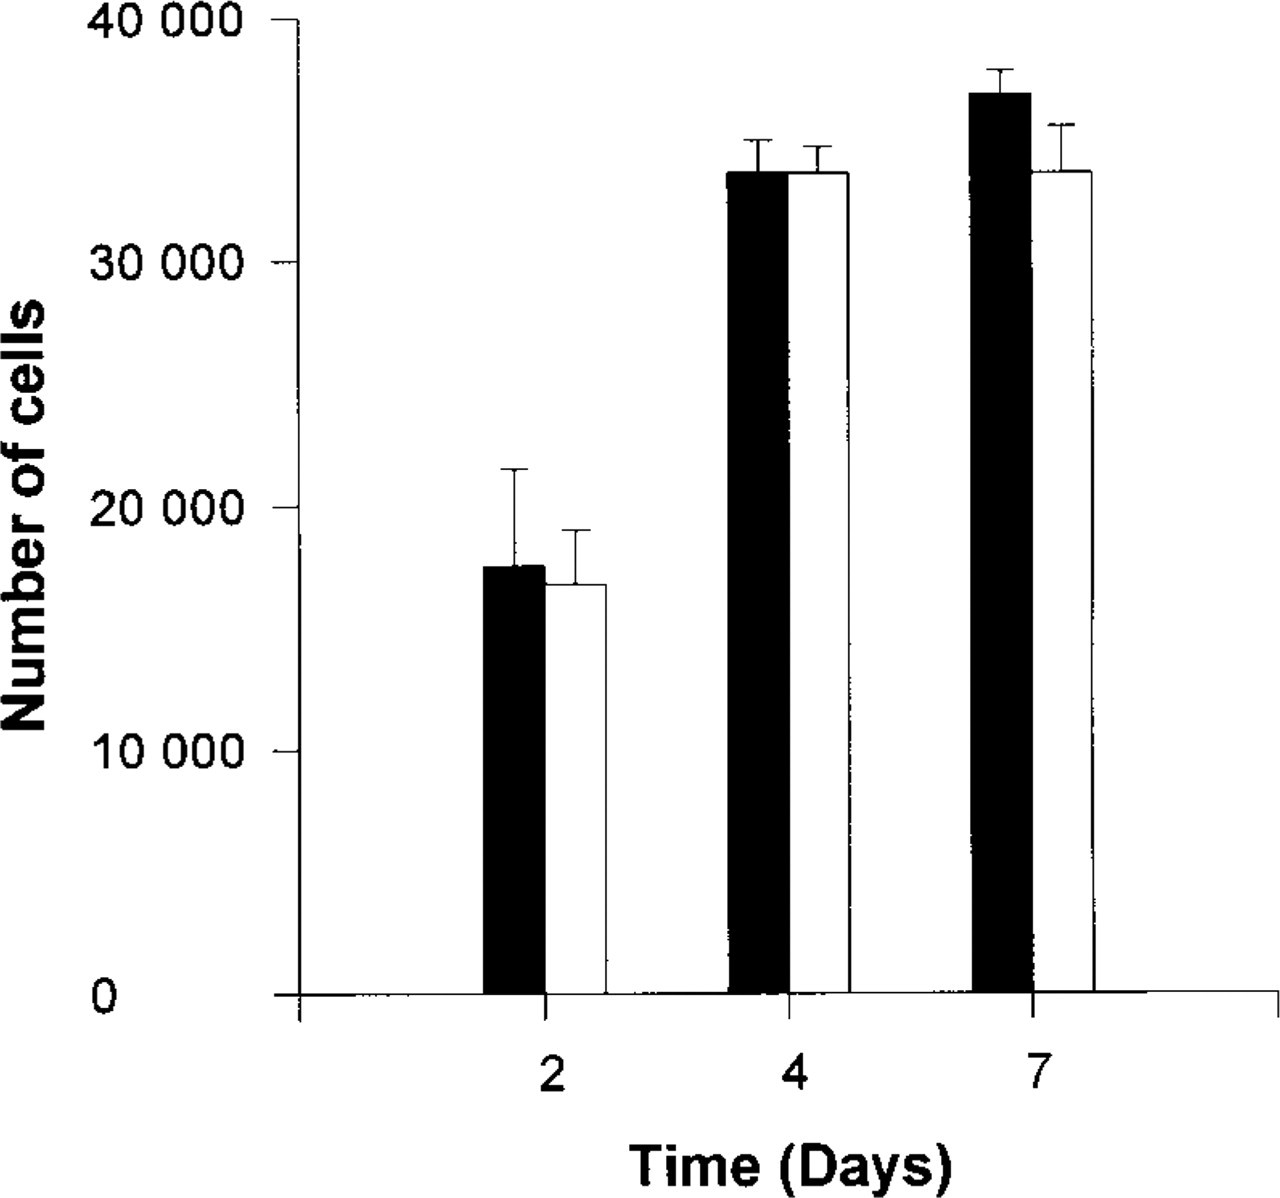
NG cytotoxicity. INS-1 cells were incubated with or without 25 μM NG-Ac for 30 min, then cultured for several days and counted as described in Materials and Methods. Values are means ± SEM of four experiments. Filled columns, control cells; open columns, NG-Ac-treated cells.
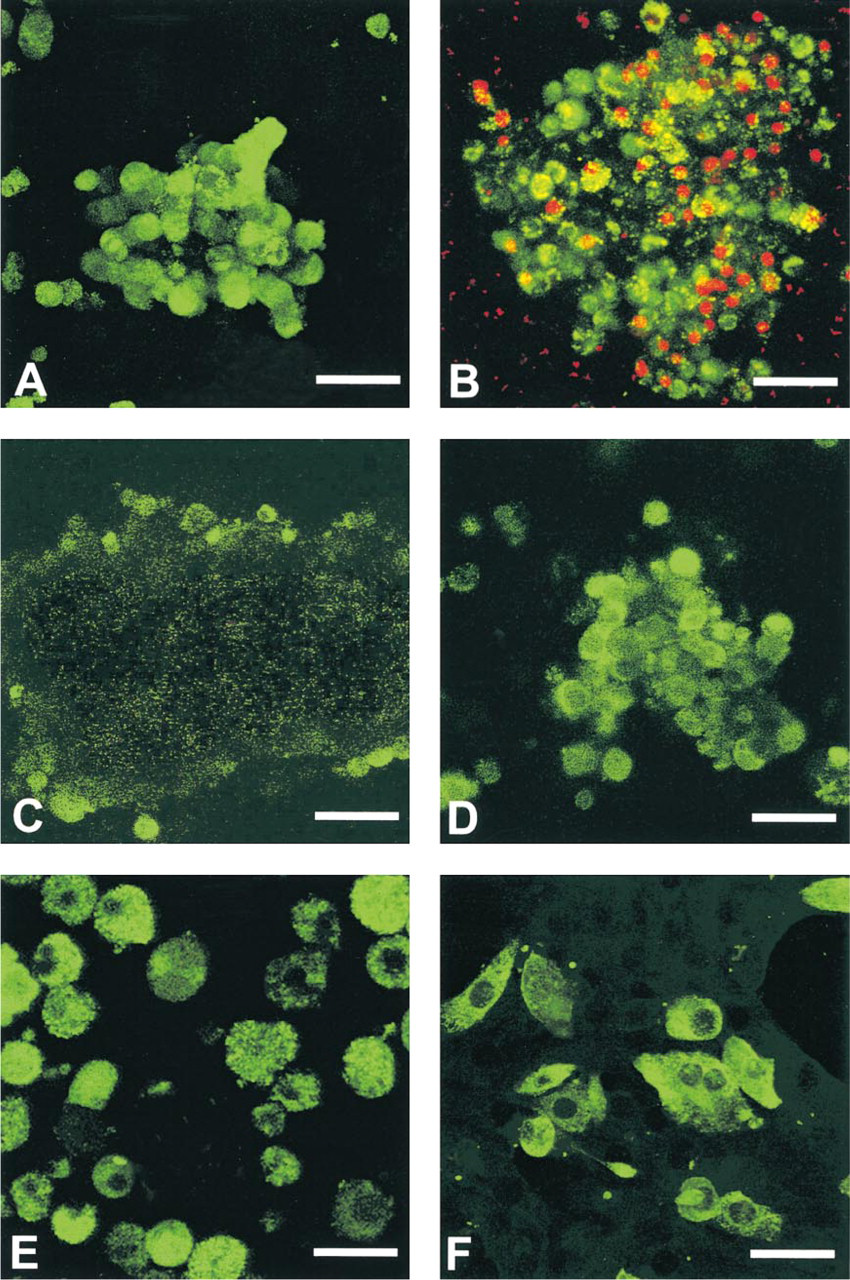
Confocal microscopic examination of stained islets. (
Effect of NG and DTZ staining on glucose-induced insulin secretion in human pancreatic isletsa
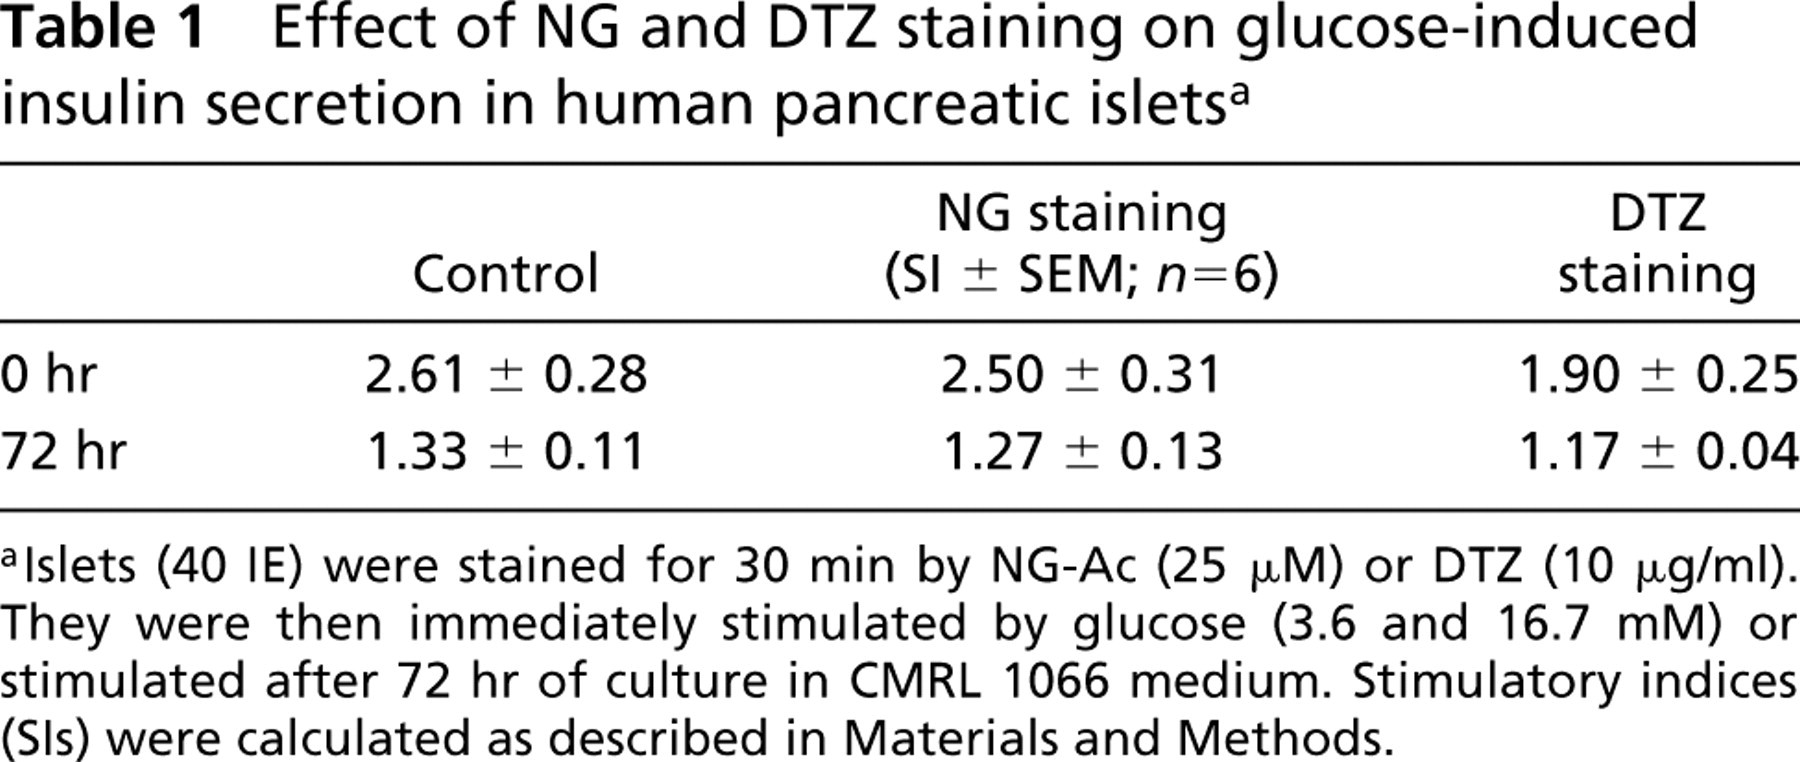
aIslets (40 IE) were stained for 30 min by NG-Ac (25 μM) or DTZ (10 μg/ml). They were then immediately stimulated by glucose (3.6 and 16.7 mM) or stimulated after 72 hr of culture in CMRL 1066 medium. Stimulatory indices (SIs) were calculated as described in Materials and Methods.
Results
Properties of Newport Green
Fluorescence of NG-K (6 μM) in 10 mM Tris-HCl was increased at the micromolar range of Zn2+ in the form of ZnCl2 or crystal insulin (Actrapid) and was saturated at about 10 μM Zn2+. Half-maximal intensity was achieved at a concentration of 2–3 μM Zn2+. Binding studies using NG-Ac confirmed that the ester form was unable to bind zinc (Figure 1).
Zinc-dependent fluorescence of NG-K was unaffected by an excess of the metal ions frequently encountered in living cells, such as Ca2+, Mg2+, or Fe2+ added as salts. Among other metal ions analyzed, Cu2+, Cd2+, and Pb2+ quenched fluorescence, whereas others, such as Co2+ and Ni2+ enhanced Zn fluorescence. Nevertheless, they can be found only as trace elements in living cells. As expected, EDTA, EGTA, and an acidic pH affected Zn fluorescence of NG-K (Figure 2).
Control of Cell Loading
“Hand-picked” islets loaded with 25 μM NG-Ac demonstrated an excellent correlation between fluorescence intensity and islet number (r = 0.99; p < 0.0001) (Figure 3).
Fluorescence intensity was also increased in murine cells cultured in the presence of ZnCl2 (25 μM) and pyrithione (4 μM), a zinc ionophore. The ratios of Zn:DNA in arbitrary units were 2.5- and 12-fold higher in treated INS-1 and in β-TC3, respectively, compared to the control cells.
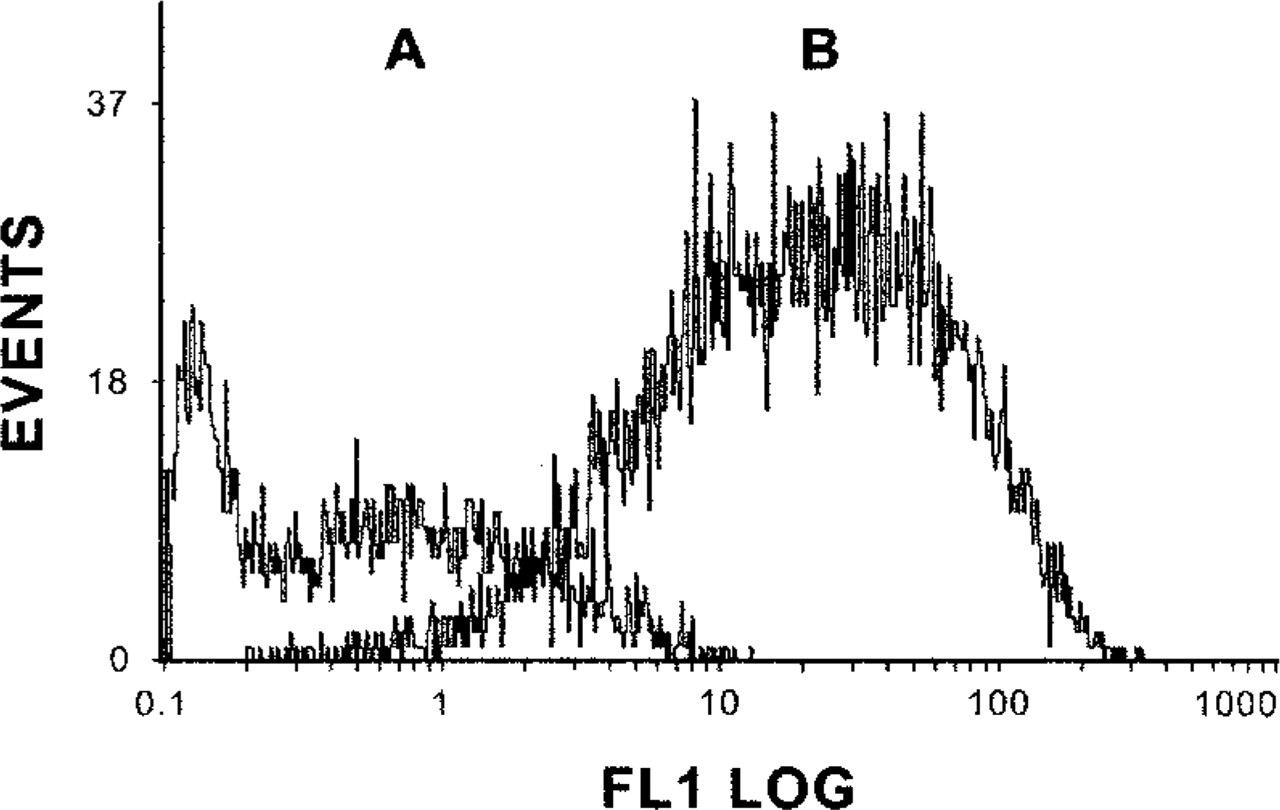
FACS analysis. Overlaid fluorescence histograms of dissociated cells from islet cell preparations. Region A, histogram of autofluorescence; Region B, histogram of NG-Ac-stained cells.
Toxicity Study
INS-1 cells stained with NG-Ac (25 μM) for 30 min and then cultured for 7 days exhibited the same pattern of growth as untreated cells (Figure 4).
As shown in Table 1, human pancreatic islets stained by NG-Ac (25 μM, 30 min) demonstrated the same capacity for glucose-induced insulin secretion as control islets. In contrast, DTZ staining (30 min, 10 μg/ml) resulted in a moderate shift of stimulatory indices.
Cell Imaging
Islet cell staining was visualized by confocal microscopic studies. Cells positively stained by NG appeared green; dead cells stained by propidium iodide (4 μM) appeared red (Figures 5A and 5B). Analyses of individual optical sections of islets indicated a homogeneous staining from the periphery to the center in cases where cells were loosely bound inside the islet (Figure 5D). However, defective penetration of the probe was noticed when islets were particularly compact (Figure 5C). We therefore systematically performed a mild distension of islets for 5 min, as described above, before staining.
Staining of individual cells revealed a heterogeneous intensity of fluorescence with cytoplasmic dots (Figure 5E). Identical pictures were obtained using insulin staining by fluorescein-conjugated antibody to insulin/proinsulin. No nuclear staining was noticed (Figure 5F).
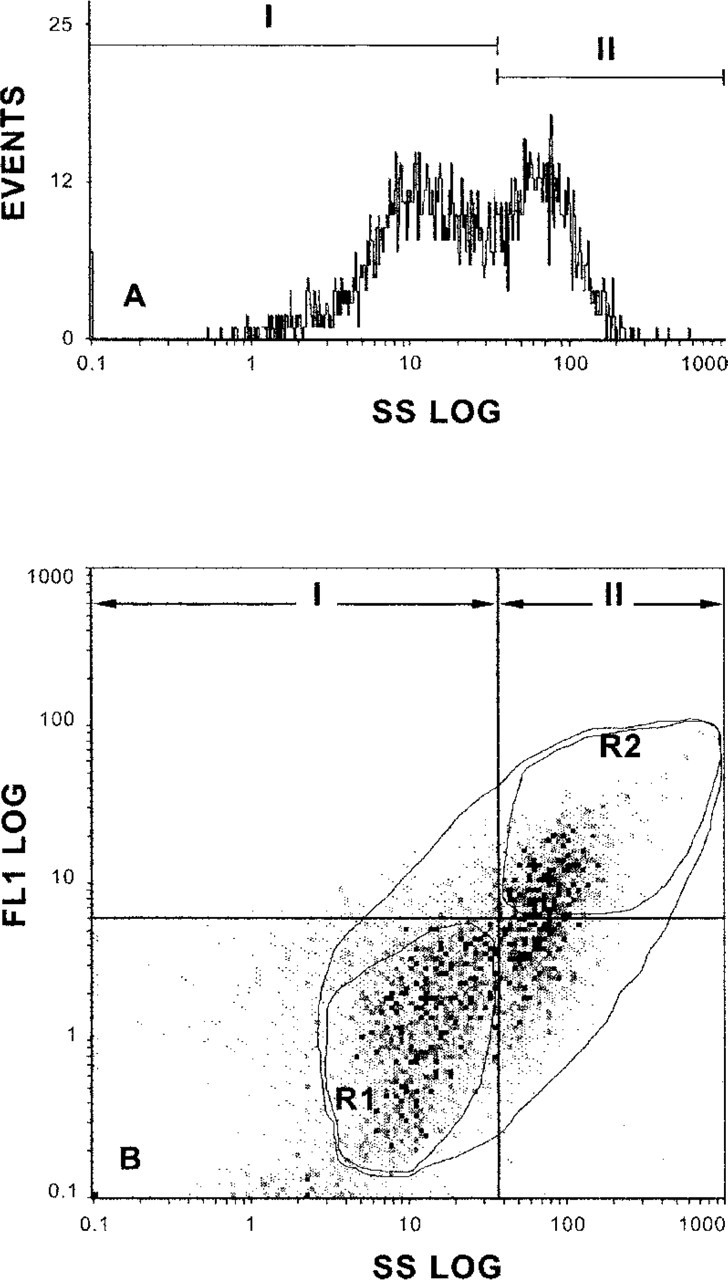
FACS analysis. (
Quantitative Studies
FACS analyses of NG-stained cells from semipurified preparations (containing endocrine β- and non-β-cells contaminated with exocrine cells) demonstrated a large range (about ×300) of relative fluorescence units (RFUs). In comparison, the range of autofluorescence was more limited (about ×10) (Figure 6). The recovery of cells after sorting was always greater than 85%, and viability assessed by trypan blue exclusion was greater than 95%.
Two populations of cells were observed, according to their side scatter patterns (SS) and RFU, and were gated for sorting (Figure 7). The ratios of mean values (±SEM) in the two populations were 10.5 ± 1.8 (n = 5) for SS and 12.1 ± 1.14 (n = 5) for RFU. Insulin content of the sorted cells was analyzed. The ratios of insulin per DNA in the two sorted populations were 30 ± 9.4 (n = 5), proving a clear distinction between β- and non-β-cells. Immunocytochemical analysis of these two sorted cell populations also confirmed the presence of a great majority of insulin-positive cells (red staining) in the most fluorescent sorted population compared to the less fluorescent one (Figure 8). When the cell populations were compared before sorting, therefore containing endocrine plus exocrine cells, vs the most fluorescent sorted population, the enrichment in β-cells, estimated by the ratios of insulin per DNA, was highly variable (from 1.3 to 7; mean 3.2 ± 1.04; n = 5) because it depended on the purity of the starting preparation, i.e., the more pure the starting preparation was, the less the enrichment ratio was.
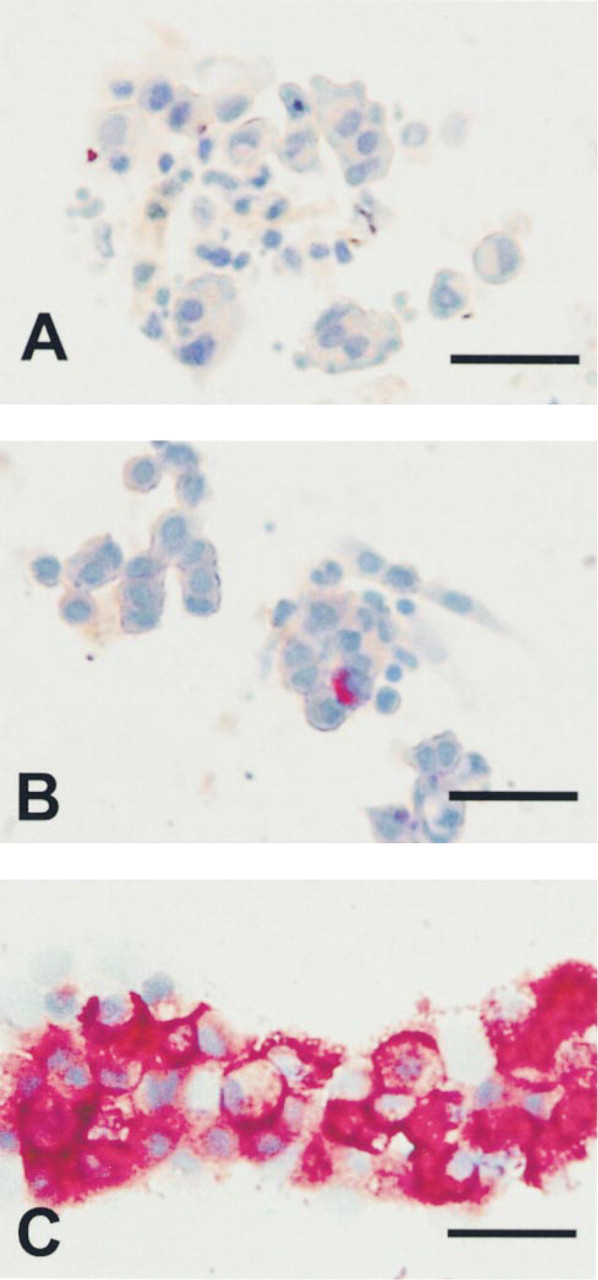
Immunocytochemical analysis of sorted cells. Sorted cells from regions R2 and R1 were plated on poly-
Effect of sorting on β-cell functionalitya
aAfter dissociation from semipurified islet preparations, cells were stained by NG-Ac 25 μM for 30 min. A portion of cells was sorted by FACS as described in Materials and Methods. Control and sorted cells were then plated in 48-well plates (105 cells/well) and cultured for 72 hr before stimulation experiments. Control cells, dissociated and stained unsorted cells.
In terms of function, the dissociated cells plated before and after sorting and cultured for 72 hr exhibited the same pattern of glucose-induced insulin secretion. However, the most fluorescent sorted cells secreted about 10-fold more insulin than the weakest fluorescent cells (Table 2).
The determination of zinc content per DNA unit was investigated in islet preparations from different donors to determine if an index designed to estimate the purity plus viability of these preparations could be established. Staining of cells was performed in six replicates of 40 IEs stained with 25 μM NG-Ac after mild distension of islets. As shown in Figure 9, we observed a wide variability of values among the different preparations. Regression analyses demonstrated fair correlations between Zn:DNA values and purity, qualitatively estimated by the percentage of DTZ-stained cells in the preparation (r = 0.63; p = 0.011, n = 15) and between Zn:DNA values and insulin content (r = 0.81; p = 0.007; n = 9).
Discussion
Pancreatic β-cells contain large amounts of zinc used in synthesis, storage, and secretion of insulin. We therefore screened, among the available fluorescent probes, those able to fulfill two criteria: to selectively label labile zinc in viable cells and to exhibit excitation and emission wavelengths in the visible spectrum so as to be exploitable by most instruments, particularly cell sorters and the confocal microscope.
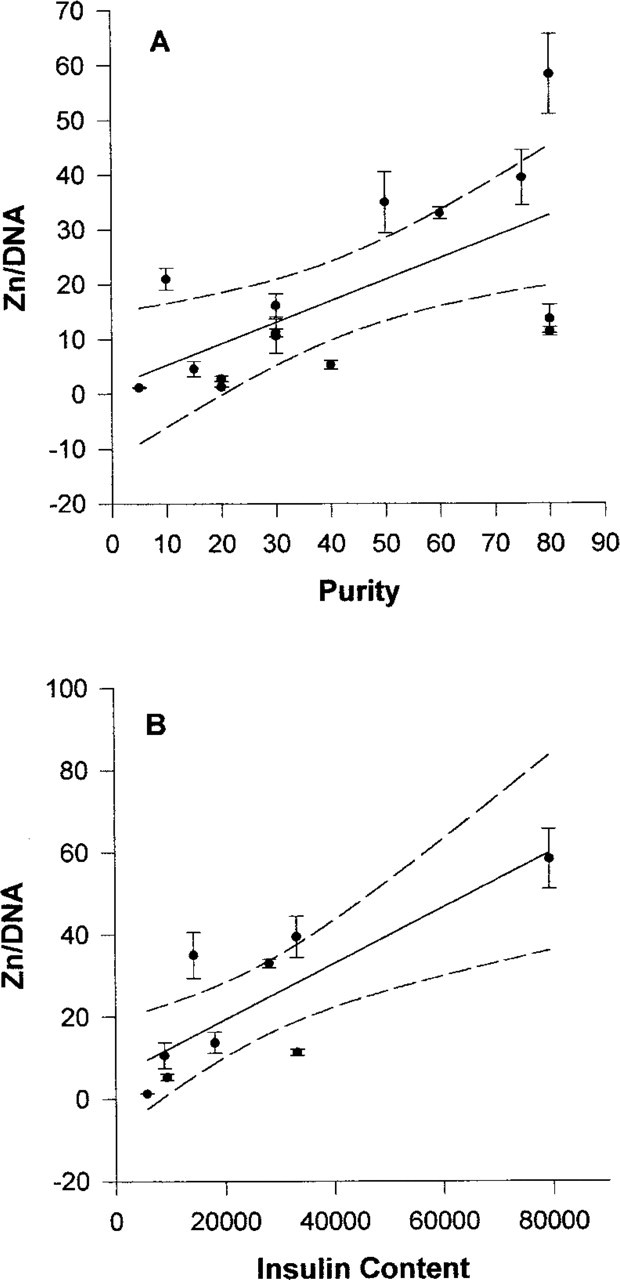
Relationships between Zn:DNA indices and other parameters. Zn:DNA indices, expressed in arbitrary units, were determined as described in Materials and Methods. Values represent means ± SEM of six replicates of 40 IE. (
Among the divalent chelating stains used for islet microscopic examination in vitro, dithizone (DTZ), the most popular, produces bright red islets when viewed by white-light microscopy. DTZ may also produce fluorescence when dissolved in DMSO; however, its fluorescence fades too quickly for reliable sorting. Other probes have been used for staining cellular labile zinc, including quinoline derivatives such as TSQ (N-[6-methoxy-8-quinolyl]-para-toluenesulfonamide (Jindal et al. 1993) and its water-soluble form TFL-Zn (N-[6-methoxy-8-quinoylyl-carboxybenzoylsulfonamide]) (Budde et al. 1997). However, the weak solubility of the former, which requires very alkaline loading buffers, and its difference in fluorescence yield between membrane lipid and aqueous solution, as well as the poor retention of the second within cells, represent major limitations. Zinquin (Δ-methyl-8-p-toluene-sulfonamido-6-quinolyloxy acetic acid) (Zalewski et al. 1993) has also been developed for in vitro staining of living cells and has been successfully employed to examine Zn2+ in thymocytes, human CLL cells, pancreatic islets, and hepatocytes (Zalewski et al. 1994), but its fluorescence has been found not evenly distributed within cells and its loading capacity poor. In addition, these three probes have an excitation wavelength in the UV spectrum. Another approach includes infection of human islet cells with recombinant adenovirus expressing green fluorescent protein under the control of the insulin promoter (Meyer et al. 1998). This elegant technique is nevertheless too long and sophisticated for routine purposes.
Here we tested a recently identified potential Zn2+ indicator, Newport Green (NG) (Haugland 1996), which has been successfully loaded into cortical neurons and exhibited strong responses after addition of Zn2+ plus Na pyrithione, a zinc ionophore (Canzoniero et al. 1997). This probe exists in two forms, an hydrosoluble potassium salt form and a liposoluble diacetate ester form (NG-Ac). This latter form allows staining solely of living cells because enzymatic cleavage by cellular esterases is required for the probes to bind Zn2+. Indeed, zinc enhancement of fluorescence could not be demonstrated using NG-Ac and Zn salt solution. The potassium salt form enabled us to determine the dissociation constant, which was in the micromolar range, i.e., 2–3 μM, corresponding to a low affinity for zinc. Hence, because of their high affinity for zinc, active sites of enzymes and zinc finger transcription factors are not likely to be taken into account by NG, which probably detected only the less tightly bound Zn in cells, including free Zn and Zn loosely associated with cellular proteins and lipids. The specificity of NG for Zn was quite satisfactory since, in particular, a large molar excess of Ca2+, the most abundant and stimulated divalent cation in pancreatic β-cells, did not affect Zn-dependent fluorescence of NG.
Loading of the lipophilic esterified form of Newport Green was easy, rapid, and non-toxic to cells. Examination of its distribution inside the cells by confocal microscopy highlighted an intense NG fluorescence mainly associated with secretory granules, demonstrating that NG competed with insulin for zinc. Moreover, the nucleus was not stained by NG.
Analysis of serial optical sections from confocal microscopic examination revealed a lack of penetration of the probe in the core of the islets when they were particularly big and compact. This drawback could be avoided by systematic mild distension of islet cells before staining. Under these conditions, a linear relationship between fluorescence intensity and islet number could be spectrofluorometrically demonstrated.
FACS analysis of semipurified preparations of islet cells revealed a great range of fluorescence intensities, which were gated for sorting according to the side-scattering (SS) activity of cells. Two populations of particles were isolated, one with the larger light-scattering properties and NG fluorescence corresponding to insulin-containing cells, and the other with smaller values of the two parameters corresponding to non-β-cells. β-cells displayed about a 12-fold higher NG fluorescence than non-β-cells, and their light scatter activity was also 10-fold higher. As a result, a clear distinction between the two populations could be easily achieved for research applications. Moreover, the sorted insulin-containing cells maintained their function in terms of glucose-induced insulin secretion.
For clinical purposes, pancreatic islet transplantation is now recognized as a treatment of choice for patients with Type 1 diabetes mellitus (Shapiro et al. 2000). The quality of the human islet preparations, including a rapid and objective estimation of viable insulin-containing cells in the total cell population, is an important parameter in the appraisal of islet engraftment capability. However, quality is inconstant and depends on many factors, such as duration of cold ischemia, collagenase digestion time of the pancreas, donor body mass index, and age (Lakey et al. 1996). The determination of an index designed to appreciate the purity of the preparations is therefore of paramount importance in the management of islet allografts. The index we defined, expressed as standardized NG-RFU per DNA, took into account the viability of cells and their zinc content, a reflection of insulin synthesis and storage (Figlewicz et al. 1984). At present, the most common method to determine the purity of an islet preparation is the light microscopic examination of dithizone-stained cells. The β-cells appear red and a rough appraisal of their percentage is established. This technique is approximate and subjective. Nevertheless, we found a slight correlation between these percentages and our indices. The discrepancies were particularly obvious in cases of highly fragmented islets, for which microscopic evaluation appeared to underestimate the percentage of stained cells.
As a whole, Zn staining by NG appears to be a valuable method to specifically identify, quantify, and isolate insulin-secreting cells from semipurified preparations of human pancreatic islet cells. This Zn probe, the first able to specifically label living cells in the visible spectrum, therefore appears very promising in β-cell handling for both clinical and research applications.
Footnotes
Acknowledgements
Supported by grants from INSERM CRMD413.
We are indebted to Dr M. Labalette and Ms C. Grutzmacher (Laboratoire d'Immunologie, Faculté de Médecine Lille) for their expertise in cell sorting. We thank the “Service Commun d'Imagerie Cellulaire: IFR 22” for access to the confocal microscope and the fluorophotometer.