
Abstract
The tetrazolium salt 5-cyano-2,3-di-p-toluyl-tetrazolium chloride (CTC), yielding a fluorescent formazan on reduction, was used to measure NAD(P)H oxidoreductase activity. In this study, optimal conditions for the flow cytometric technique were determined empirically with tissue culture cell lines and mouse Ehrlich ascites cells. Applying a coupled reaction procedure, NADH and NADPH as substrates of the oxidoreductases to be measured are generated endogenously by lactate or glucose-6-phosphate dehydrogenase, respectively. The results were evaluated by combining spectrophotometry and flow cytometry. We obtained integral activities for each group of NADH and NADPH oxidoreductases. Furthermore, by counterstaining the DNA with DAPI, followed by bivariate analysis of flow cytometric data, our assay gives a detailed distribution of enzyme activities of all cells, even in subgroups present in heterogeneous cell populations. Therefore, this protocol permits the study of NAD(P)H oxidoreductase activities in ex vivo tumor samples in which mixed cellular populations may be present.
Keywords
T
The natural acceptors of electrons in normal dehydrogenase reactions in vivo are flavine enzymes and/or quinones such as ubiquinone. The cytochemical demonstration of these reactions was made possible by the discovery that the artificial electron carrier phenazine methosulfate could bypass flavine enzymes and transfer electrons directly to the tetrazolium salt (Wohlrab et al. 1979). An NAD(P)H-d is demonstrated in incubations without intermediary electron carriers. When tetrazolium salts are used in histochemical redox reactions, in general, the rate-limiting reaction sequence is measured. To ensure that the actual activity of a coenzyme-linked dehydrogenase is demonstrated, an artificial intermediate electron carrier must be added to the incubation medium (Van Noorden and Tas 1982). Otherwise, the efficiency of the slowest part of the cellular electron transport system is determined, which is mostly an NAD(P)H-d. In Figure 1, these conditions are given in the scheme of reaction pathways. The artificial electron carrier “A” accepts the reducing equivalents in place of the physiological acceptor and, in turn, reduces the tetrazolium salt nonenzymatically. Depending on the substrate added, this system can be used to measure the activity of a specific dehydrogenase. In contrast, the reaction pathways followed during the localization of an NAD(P)H-d are more complex and are generally unknown. In this case a coupled reaction procedure (Stoward and Pearse 1991) must be applied. As shown in the schematic, a substrate, e.g., lactate or glucose-6-phosphate, is oxidized by its specific dehydrogenase to generate NADH or NADPH, respectively, at or near the site of the NAD(P)H-d. In a second step, the reducing equivalents must be transferred by the NAD(P)H-d from the co-enzymes to the next acceptor in the electron transport chain, i.e., flavine enzymes, ubiquinone, or cytochromes. However, in the presence of the tetrazolium salt, this unphysiological compound replaces the natural electron acceptor and is reduced to the colored formazan. Compared with the strong lactate (LDH) and glucose-6-phosphate dehydrogenase (G6PDH) activity in most cells, the activity of NAD(P)H-d is rate-limiting and can be measured, providing that the electron carrier is omitted, as shown in this report.
Materials and Methods
Reagents
Cells and Culture
The permanent endothelial cell line eEnd2 (Montesano et al. 1990), which spontaneously gave rise to a second stem line in long-term cultivation, was used. The cells were grown in 10% fetal calf serum-supplemented F10 medium and passaged twice a week. For experiments, the cells were harvested by trypsinization, washed twice in PBS, and incubated for enzyme activity not more than half an hour later.
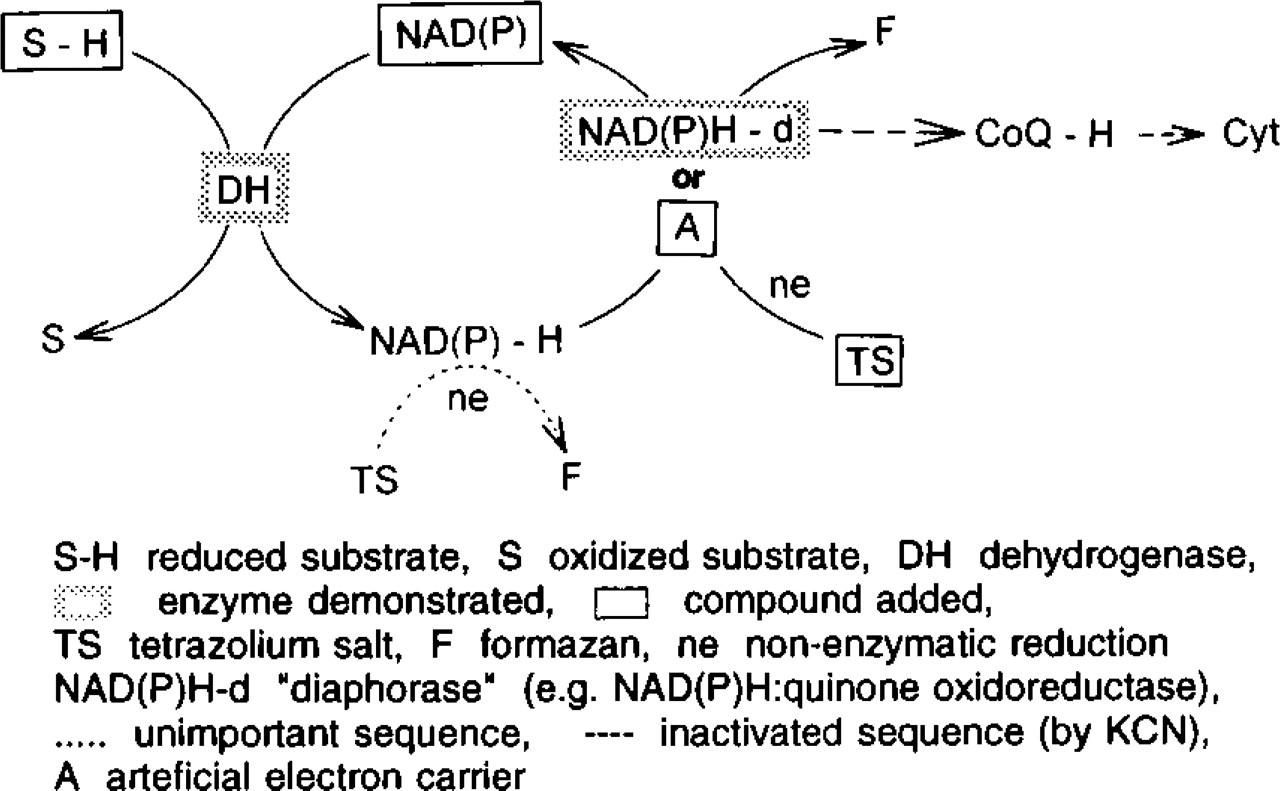
Reaction sequences of the electron transport system in cells incubated for demonstration of enzyme activity by tetrazolium salts.
Cell Incubations for Enzyme Demonstration
Oxygen interferes with CTC formazan production (Kuhlmann et al. 1989). A nitrogen atmosphere is therefore recommended during incubation, but we used KCN for convenience. The results obtained with both techniques are comparable (Kuhlmann et al. 1989).
Assay of Lactate (LDH) and Glucose-6-phosphate (G6PDH) Dehydrogenases. The cell membranes were permeabilized with 0.05% glutaraldehyde for 1 min. The cells were washed then with PBS and centrifuged at less than 100 X g. Two million pretreated cells were resuspended in 0.2 ml PBS and KCN (0.5 mmol/liter, pH adjusted to 7.4) was added to inhibit cytochrome oxidases. The electron carrier PMS or MPMS (0.1 mmol/liter), the co-enzyme NAD or NADP (0.5 mmol/liter), and the substrate lactate (20.0 mmol/liter) or G6P (2.0 mmol/liter) were added, resulting in a working volume of 1 ml. The reaction was started by adding CTC (2.0 mmol/liter). The substrates were omitted in control reactions.
All concentrations are given in final values.
Assay of NAD(P)H-d. Because these enzyme systems may be inhibited by aldehydes (Stoward et al. 1991), the membrane permeabilization was performed with digitonin (0.013 mmol/liter, i.e., 8 μg/106 cells, according to Hämmerle and Löffler 1989) in most experiments. The incubation was similar to that used for dehydrogenases. However, PMS and MPMS were omitted. The groups of NADH- and of NADPHconverting oxidoreductases were determined separately by using the Lac/NAD or the G6P/NADP reaction, respectively. The controls were incubated without NAD and NADP. For DT-diaphorase (Ernster 1967) measurement, both substrates were used in combination. After incubation at 37C for 10 min, the results were monitored by fluorescence microscopy.
Measurements
The cell samples were placed on ice and centrifuged at 100 X g for 5 min. The pellet was resuspended in 1 ml cold PBS and fixed by adding 0.075 ml of 4% paraformaldehyde, pH 7.4, for 1 hr at 4C. Thereafter, the cells were washed again, and 0.5 ml PBS and 0.03 ml of 5% Tween 20 was added, followed by DAPI (10 mmol/liter final concentration) 5 min later. After adding standard fluorescent beads (Polysciences) bivariate flow cytometry applying sequential two-wavelength illumination (Severin and Seidler 1992) was performed within 24 hr after staining. The flow cytometer was a self-made, mercury lamp-equipped (HBO 100 W/2 from Osram, Germany) instrument with an optical part similar to PAS II of Partec (Münster, Germany). The light path for DAPI and formazan excitation, using a dichroic mirror (XF 18 from Omega Optical; Brattleboro, Vermont), was partitioned optically by illuminating slits and appropriate filter sets (Schott; Mainz, Germany), resulting in
The cell numbers in gated subgroups, discernible in the histogram by their DNA content, were counted and their median formazan fluorescence intensities were estimated in relation to those of the fluorescence beads.
In a second step, the amount of formazan in an aliquot of each cell sample was measured in a Zeiss PMQII spectrophotometer (slit width 20 μm, wavelength 450 nm) after elution with ethanol. From the known number of cells that were present in the aliquot before, the median enzyme activity per single cell was calculated according to the Lambert-Beer equation (molar excitation coefficient of CTC formazan: ∊ = 20200) as described earlier (Severin and Seidler 1992). In heterogeneous samples, the enzyme activities of the subpopulations were determined in the same way by combining flow cytometric and spectrophotometric measurements: The overall activity obtained spectrophotometrically was calculated into the flow cytometrically discernible subgroups according to their relative cell number and their relative median cellular formazan content.
Results
Enzyme-positive cells carry bright orange fluorescent formazan crystals (Figure 2), the amount of which depends on the activity of the cellular redox process under investigation (Huang and Severin 1993). Only some control cells contain a few small crystals. Using the number of free formazan crystals in the medium as a criterion, the diaphorase assay is very specific, more specific than the LDH or G6PDH reaction.
The amount of formazan produced in a single cell can be measured flow cytometrically even in heterogeneous samples when cellular DNA is stained with DAPI. The range of enzyme activities in each subgroup is also revealed by this method. An example is given in Figure 3. After prolonged culture, the endothelial cell line eEnd2 produced a transformed subline with short doubling times and high DNA content, which overgrew the original, almost DNA diploid cells (compare top left histogram of Figure 3). The lactate dehydrogenase activity (Row 2), as an example of NAD-reducing potential, and the activity of NADH-d (Row 3) are higher in the faster growing subline (b vs a) by a factor of 1.4, i.e., 44.8 vs 32.2 fmol per average active G0/G1-phase cell for 10 min. This difference, however, does not appear to be related to cell volume (ratio of 2.3:1). On the other hand, the NADPH-d activity of the newly transformed endothelial cells (Row 5, column b, 7.7 fmol) is lower than that of the original subline (Row 5, column a, 13.9 fmol), whereas the G6PDH reaction (Row 4) which supplied the reduced nucleotides for demonstrating the diaphorases in the coupled reaction procedure is stronger in the high DNA subline (30.1 vs. 23.9 fmol per cell for 10 min). These data were calculated from three independent experiments using the Lambert-Beer equation after simultaneously performed spectrophotometry of the cell material as described previously (Severin and Seidler 1992). The NAD(P)H-d activities vary with cell cycle phase. In G2/M-phase, the eEnd2 cells produce about twice as much formazan as in G0/G1 - or early S-phase.
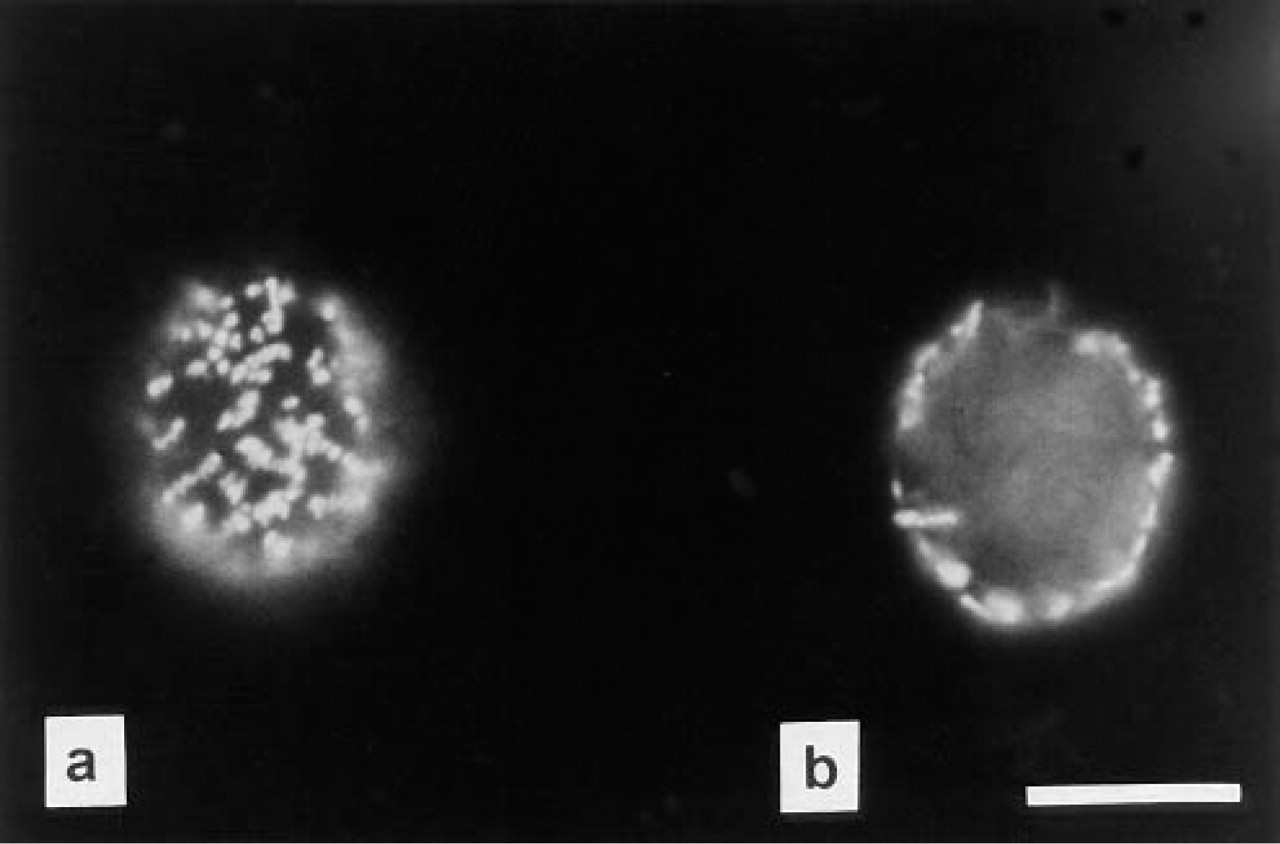
One endothelial eEnd2 cell incubated for NADH-d activity. The microphotograph was focused first on the cell membrane
The group of NADH-d generates more than three times more CTC formazan than that of NADPH-d in cells during log phase growth. No further experiments were undertaken to identify the enzyme actually responsible for NAD(P)H oxidizing activity in our cell lines. Instead, the oxidoreductases were measured only according to their general specifity for NADH or NADPH.
The enzyme activities measured depend on the permeabilization procedure of cell membranes. The activities after digitonin are higher than those after glutaraldehyde because of the release of intracellular compounds into the incubation medium and the consequent production of floating formazan crystals, especially in the LDH reaction. These free crystals were included in spectrophotometric readings but not in flow cytometry. The aldehyde fixation, however, affects the diaphorase activity (data not shown). Therefore, the LDH and G6PDH activity was measured in glutaraldehyde-pretreated cells, whereas all diaphorase measurements were performed with cells treated with digitonin.
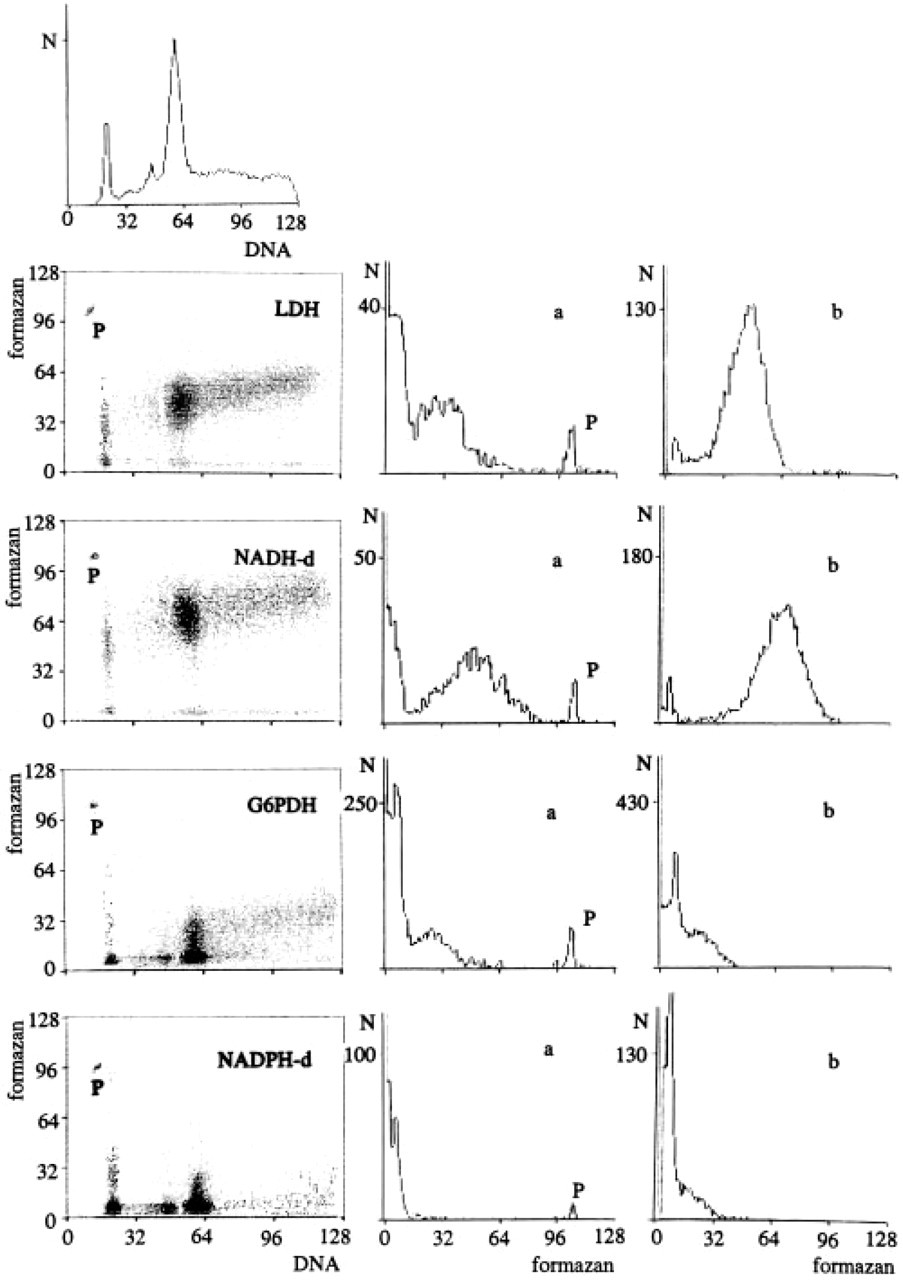
Flow cytometric analyses of endothelial eEnd2 cells for DNA content vs enzyme activity i.e., formazan (dot-plots of first column). Each dot-plot comprises at least 20,000 cells. The first histogram of Column 1 shows the DNA distribution of eEnd2 cells, indicating two sublines. Their G0/G1-phases are registered in channels 18-25 and 52-66, respectively. Column 2 (5 a) represents the distribution of enzyme activity in G0/G1-phase cells of the low DNA subline. Column 3 (5 b) shows the range of gated enzyme activity in G0/G1-phase of the transformed subline having high DNA content. The enzymes measured are LDH, NADH-d, G6PDH, and NADPH-d, registered in Rows 2-5. The axes represent fluorescence intensities in channel units. The formazan axis is a 3-decade log scale divided into 128 channels. DNA is indicated on a linear scale. N, number of cells per channel; P, standard fluorescence beads.
Lecithin, bovine serum albumin, Tween 20, and Triton X-100 were not stimulating in our assays, in contrast to results reported in the literature (Stoward and Van Noorden 1991).
Discussion
Adapting the coupled reaction procedure of histochemistry to flow cytometry, we determined NAD(P)H-d activities in single cells within subgroups of cell samples. In addition, the range of enzyme activities in the subgroups is shown. This is not possible in spectrophotometric assays. In the present study, the tetrazolium salt CTC was used, which produces brightly fluorescent formazan crystals on reduction. This property enables the succesful combination of tetrazolium salt technique and flow cytometry. Previously we measured the activity of several dehydrogenases in ascites cells (Huang and Severin 1993) and in primary human gastrointestinal tumor cell lines (Huang et al. 1994). Along with the calibration method reported earlier (Severin and Seidler 1992), the approach revealed quantitative data expressed in biochemical units of mol hydrogen ·cell-1·time-1 for the NAD(P)H oxidoreductase system on a cell-by-cell basis.
For histochemical demonstration of DT-diaphorase activity, the tetrazolium salts NBT and TNBT were usually used as indicators and the reduced co-enzymes were directly added to generate a one-step reaction (e.g., Macha et al. 1975; Scherer-Singler et al. 1983). Direct measurement is possible providing that the reducibility of the tetrazolium salts is higher than that of CTC (unpublished results) and NT (Seidler 1991), the tetrazolium salt used by Macha et al. (1975) in their coupled reaction procedure. The lesser reducibility of CTC in comparison to NBT favors its enzymatic reduction, thus preventing nonspecific reactions (Seidler 1991). We therefore estimate that not more than 5% of the total amount of CTC formazan is produced nonenzymatically in our experiments.
The final concentrations of reagents in our experiments are in most cases lower than recommended in histochemistry. In modern textbooks, the inclusion of macromolecular additives is demanded, e.g., polyvinyl alcohol or agarose, to prevent leakage of the intracellular compounds out of the tissue sections into the medium, or the interposition of semipermeable membranes. Without these additives few (structurally bound) enzymes are believed to be reliably localizable. However, tissue stabilizers have their limitations, e.g., they show some fluorescence and are difficult to remove because of their high viscosity. Semipermeable membranes are also not advantageous with cell suspensions. Furthermore, they are not necessary in our incubations of whole but slightly permeabilized cells. Therefore, our protocol with low concentrations of co-enzyme and, in dehydrogenase assays, intermediate electron acceptors considerably reduces the problem of unspecific formazan production.
All intact cells produce CTC formazan crystals on their surface by the activities of intracellular or plasma membrane-linked enzymes (Huang and Severin 1993). However, it is necessary to gently permeabilize the cell membrane to enable the added substrate to cross the membrane and interact with the enzyme tested. Under these conditions, any reducing equivalents produced will be transferred by the artificial or physiological electron carriers PMS or NAD(P)H-d, respectively, to the vicinity of the cell membrane, where they can be captured by the tetrazolium salt. This reaction takes place on the cell membrane because it is almost impermeable to the free tetrazolium cation (De Bari and Needle 1978; Stoward et al. 1991). Therefore, no formazan can be observed intracellularly except in cut cells of tissue sections or when cells are heavily damaged.
The formazan amount increases in aerobically incubated cells when cyanide is present (Kuhlmann et al. 1989). We interpret this increase as being due to inhibition of the electron transport chain, which simulates anoxic incubating conditions. In addition, cyanide inhibits the Cu-Zn-superoxide dismutase (Rotilio et al. 1972), resulting in a further increase of formazan production by superoxide radicals. This interpretation is supported by previous studies with KCN added to incubated ascites tumor cells under both oxygen-rich and anoxic conditions. In both conditions, the amount of formazan produced was almost doubled by KCN (Kuhlmann et al. 1989).
The only way to visualize the activity of a specific NAD(P)H-d is the immunocytochemical approach, but no quantitative determination by this method has been published until now. In our opinion, it is not a drawback that we were unable to measure each member of the NAD(P)H oxidoreductases separately but instead obtained the activities of both the groups of NADH or NADPH-oxidizing enzymes, because each enzyme can compensate, at least in part, for the function of the other enzymes in the same group. Therefore, only the integral activity obtained from these enzymes is important for the assessment of cellular efficiency in the detoxification of damaging compounds and in the activation of certain drugs.
Footnotes
Acknowledgements
We are indebted to Ms M. Volkermann for skillful technical assistance and to Dr W. Risau (Bad Homburg, Germany) for providing the endothelial cell line eEnd2. We thank Dr P. Cullen, Münster, for improving the English of the manuscript.