
Abstract
We have studied the expression and localization of several H+ and HCO3 – transporters, whose presence in the rat pancreas is still unclear. The Cl–/HCO3 – exchanger AE2, the Na+/H+ exchangers NHE1 and NHE4, and the 31-kD and 70-kD vacuolar H+-ATPase (V-ATPase) subunits were detected by immunoblotting and immunocytochemical techniques. Immunoblotting of plasma membranes with transporter-specific antibodies revealed protein bands at ≈160 kD for AE2, at ≈90 kD and ≈103 kD for NHE1 and NHE4, respectively, and at 31 kD and 70 kD for V-ATPase. NHE1 and NHE4 were further identified by amplification of isoform-specific cDNA using RT-PCR. Immunohistochemistry revealed a basolateral location of AE2, NHE1, and NHE4 in acinar cells. In ducts, NHE1 and NHE4 were basolaterally located but no AE2 expression was detected. V-ATPase was detected in zymogen granules (ZGs) by immunogold labeling, and basolaterally in duct cells by immunohistochemistry. The data indicate that NHE1 and NHE4 are co-expressed in rat pancreatic acini and ducts. Basolateral acinar AE2 could contribute to Cl– uptake and/or pH regulation. V-ATPase may be involved in ZG fusion/exocytosis and ductal HCO3 – secretion. The molecular identity of the ductal Cl–/HCO3 – exchanger remains unclear.
S
In acinar cells, synthesis of digestive enzymes takes place in the rough endoplasmic reticulum (rER), while processing and sorting occur within the Golgi complex. After maturation of condensing vacuoles to zymogen granules (ZGs), the apically located ZGs exocytose the digestive enzymes into the lumen after hormonal stimulation. Whereas the pH in the rER is near neutral (Kim et al. 1998), the pH of the trans-Golgi network is about 6.0–6.5 (Demaurex et al. 1998) due to active H+ pumping into the organelle by an electrogenic proton-translocating ATPase, the vacuolar-type H+-ATPase (V-ATPase) (Finbow and Harrison 1997). The internal pH of ZGs, however, has been poorly investigated. An acidic pH has been determined in condensing vacuoles, but not in mature granules, by quantifying the partition of a permeant weak base by immunoelectron microscopy (Orci et al. 1987). In another study, the intragranular pH of isolated pancreatic ZGs was estimated at ≈6.5 using the pH-sensitive fluorescent dye BCECF (Gasser et al. 1988). However, the transporter responsible for acidification of ZGs has not been identified. In addition, acinar cells secrete a near-neutral primary fluid by Na+-coupled secondary active Cl– transport (Seow et al. 1986): The cellular Na+ gradient generated by the basolateral Na+/K+-ATPase energizes a basolateral Na+/H+ exchanger. This process raises the cytosolic pH (pHi) and promotes formation of HCO3 – by hydration of CO2, catalyzed by carbonic anhydrase. The HCO3 – thus formed exits to the interstitium via an Cl–/HCO3 – exchanger in the basolateral membrane, which can be activated by alkaline pHi. A recently identified electrogenic Na+ bicarbonate co-transporter (NBC) in the basolateral membrane (Muallem and Loessberg 1990; Thévenod et al. 1999) may additionally contribute to HCO3 – accumulation in acinar cells. By these means, Cl– accumulates in the cell above its electrochemical equilibrium concentration and exits the cell on secretagogue stimulation via Ca2+-sensitive Cl– channels. Na+ enters the lumen by a paracellular pathway to preserve electroneutrality.
The final electrolyte composition of the pancreatic juice is determined by duct secretion of NaHCO3. In the prevailing model, secretion depends on the luminal Cl– concentration. HCO3 – is generated in the cytosol by a process involving Na+/K+-ATPase, an Na+/H+ exchanger, and NBC at the basolateral cell side, cytosolic carbonic anhydrase, and exit into the lumen via an Cl–/HCO3 – exchanger. The activity of the Cl–/HCO3 – exchanger depends on a supply of luminal Cl– delivered to it from the cytosol by a recycling process utilizing an apical cAMP-activated Cl– channel, presumably CFTR. Na+ enters the lumen across cation-permeable intercellular junctions, driven by the lumen negativity (Novak and Greger 1988a, b; Zhao et al. 1994). Although this transport model may explain duct fluid and electrolyte secretion, it is not conclusive, and a number of issues remain unresolved. For example, a recent study suggested AE2 as the apical anion exchanger based on RT-PCR from whole fetal pancreatic tissue (Hyde et al. 1999). However, proof of AE2 expression in duct cells is still missing. In addition, there is increasing evidence that additional transporters contribute to HCO3 – accumulation in pancreatic duct cells, at least in certain species. Apart from the electrogenic NBC expressed in the basolateral membrane of rat and guinea pig pancreatic ducts (Zhao et al. 1994; Ishiguro et al. 1996a, b, 1998), a bafilomycin A1-sensitive transporter, probably a V-ATP-ase, may also contribute to extrusion of H+ across the basolateral membrane during agonist-stimulated bicarbonate secretion in pig and guinea pig (Villanger et al. 1995; De Ondarza and Hootman 1997). Thus far, however, biochemical and immunohistochemical evidence for the presence of a V-ATPase in duct cells is also lacking. Functional studies have provided strong evidence for Na+/H+ exchange activity in rat pancreatic ducts (Zhao et al. 1994). A recent study has confirmed duct expression of NHE1, NHE2, and NHE3, but not of NHE4 mRNA, in the rat (Lee et al. 2000). However, we have previously shown that NHE4 mRNA is expressed in the rat exocrine pancreas, but differs from the published sequence (Anderie et al. 1998).
To address some of the above unresolved issues and to clarify existing models for enzyme, fluid, and electrolyte secretion in rat pancreas, we have studied localization of the Cl–/HCO3 – exchanger AE2, the Na+/H+ exchanger isoforms NHE1, and NHE4, and V-ATPase in the rat pancreas. Our results suggest that AE2, NHE1 and NHE4 are expressed in the basolateral plasma membranes of pancreatic acinar cells, where they may contribute to acid–base transport. V-ATPase is present in ZGs and basolaterally in duct cells. AE2 is not expressed in duct cells, whereas NHE1 and NHE4 are found localized in basolateral plasma membranes of duct cells. The presence of V-ATPase in both ZG membrane and duct cells indicates that V-ATPase may play a role in acinar secretion of digestive enzymes and ductal H+ extrusion.
Materials and Methods
Antibodies
An affinity-purified rabbit polyclonal antibody to the COOH-terminal amino acids 1224–1237 of mouse AE2 has been previously described (Stuart-Tilley et al. 1994). The generation of rabbit polyclonal antibodies against the A and E subunits of vacuolar H+-ATPase has been reported earlier (Roussa et al. 1998). NHE1 polyclonal antibody was raised against a fusion protein constructed with β-galactosidase and the carboxy-terminal 157 amino acids of NHE1 (Goss et al. 1994). An NHE4 polyclonal antibody was raised against the fusion protein of glutathione-S-transferase and the carboxy-terminal 40 amino acids of NHE4 and was used for immunoblotting (Anderie et al. 1998). Both anti-NHE polyclonal antibodies were kindly provided by Dr. S. Grinstein (Division of Cell Biology, Hospital for Sick Children; Toronto, Ont, Canada). An anti-NHE4 mouse monoclonal antibody (11H11) used for immunohistochemistry was generated against a fusion protein construct containing the COOH-terminal amino acids 565–675 of rat NHE4 (Pizzonia et al. 1998) and was generously provided by Dr. P. S. Aronson (Section of Nephrology, Department of Internal Medicine, Yale University School of Medicine; New Haven, CT). A horseradish peroxidase-conjugated goat anti-rabbit IgG (DAKO; Hamburg, Germany) or a donkey anti-rabbit IgG coupled to indocarbocyanin (CY3) (Jackson Immunore-search; Avondale, PA) was used as secondary antibody.
Preparation of Tissue Homogenate and Isolation of Plasma Membranes
Four to six male Wistar rats were anesthetized with ether and perfused via the left ventricle with PBS until the organs was thoroughly blanched. Pancreas or kidney cortex homogenate was prepared by grinding the tissue with 50 strokes of a motor-driven Potter homogenizer in 10 ml of ice-cold homogenizing buffer containing (in mM) 280 mannitol, 10 HEPES, 10 KCl, 1 MgCl2, adjusted to pH 7.0, and a protease inhibitor “cocktail” (10 μM leupeptin, 2 mM benzamidine, and 0.1 mM Pefabloc SC). The homogenate was centrifuged at 50 × g for 5 min and the supernatant was collected. The pellet containing unbroken cells was resuspended in 10 ml of the same buffer and homogenized once more. After centrifugation at 50 × g for 5 min, both supernatants were combined.
To obtain pancreatic plasma membrane fractions, the cleared homogenate was centrifuged for 12 min at 1000 × g and the supernatant was centrifuged at 11, 000 × g for 15 min. The 11, 000 × g pellet was composed of a whitish fluffy upper layer and a yellowish bottom layer, which were separated. The 11, 000 × g fluffy layer was mixed with 2.0 M sucrose buffer to a concentration of 1.25 M, which was layered on 2.0 M sucrose and overlaid with 0.3 M sucrose. The gradient was centrifuged at 140, 000 × g for 90 min, and the whitish band enriched in plasma membranes (PMs) at the upper surface between the 0.3 M and 1.25 M sucrose density layers was collected (Thévenod et al. 1989).
For detection of the 70-kD V-ATPase subunit in pancreas, a modified preparation of tissue homogenate was applied. Pancreas was excised and immediately frozen in liquid N2. Tissue was ground under liquid N2 and suspended in MES (2-[N-morpholino]ethanesulfonic acid) buffer (pH 4.6). Protein concentration was determined according to Bradford (1976) and samples were processed for immunoblotting as described below.
Isolation of ZGs and Purification of ZG Membranes
ZGs from rat exocrine pancreas were isolated as described elsewhere (Anderie et al. 1998). Briefly, pancreatic tissue from male Wistar rats was homogenized by nitrogen pressure cavitation (500 psi) and ZGs were isolated by centrifugation of the homogenate on a self-forming continuous Percoll gradient (40% Percoll v/v at 20, 000 × g for 20 min). ZGs form a distinct dense, whitish band on the bottom of the gradient. For separation from minor mitochondrial contamination, ZGs were washed in an isotonic buffer containing 50 mM K-succinate followed by centrifugation at 1000 × g for 20 min.
For purification of ZG membranes, the protocol described by Thévenod et al. (1992) was used with minor modifications. ZGs were diluted about 20-fold in a hypotonic “lysis buffer” containing 10 mM HEPES, 0.1 mM MgSO4, adjusted to pH 7.0 with Tris, and a protease inhibitor cocktail (10 μM leupeptin, 100 μg/ml trypsin inhibitor, 2 mM benzamidine, 0.2 mM Pefabloc SC). During incubation on ice, the suspension cleared within 45 min and was then centrifuged for 1 hr at 100, 000 × g. The protein concentration of the final pellet containing the ZG membranes was determined according to Bradford (1976). Membranes were stored at −70C until use.
SDS-PAGE and Immunoblotting
Electrophoresis and blotting procedures were performed essentially as described earlier (Thévenod et al. 1994). Briefly, proteins were separated by SDS-PAGE on 7.5% (NHE4), 9% (AE2), or 13% (V-ATPase) acrylamide Laemmli minigels and transferred onto polyvinylidene difluoride (PVDF) membranes. Blots were blocked for 8 hr with 3% non-fat dry milk in Tris-buffered saline containing 0.05% Tween-20 and incubated overnight with the primary antibodies at dilutions of 1:10, 000 for anti-AE2, 1:2500 for both anti-V-ATP-ase antibodies, and 1:2500 for anti-NHE4. For NHE1 detection, membrane proteins were separated by SDS-PAGE on 7.5% acrylamide minigels and transferred to nitrocellulose. Blots were then blocked for 6 hr with 0.2% gelatin in Tris-buffered saline and incubated with the primary polyclonal antibody against NHE1 at a dilution of 1:2500 (Anderie et al. 1998). After incubation with donkey anti-rabbit IgG coupled to horseradish peroxidase secondary antibodies (1:10, 000 dilution), blots were developed in enhanced chemiluminescence reagents and signals were visualized on X-ray films.
Amplification and Cloning of NHE1-and NHE4-specific cDNA
Degenerate oligonucleotides encoding NHE1 or NHE4 peptide sequences were synthesized and used for the RT-PCR. As a template we used cDNA obtained from standard reverse-transcriptase reactions (Sambrook et al. 1989) with RNA, which had been isolated from kidney and pancreas rat tissues by the method of Chomczynski and Sacchi (1987). RT-PCR was carried out using 0.5 μM of degenerate primers, 20 mM Tris-HCl, pH 8.4, 50 mM KCl, 2 mM MgCl2, 400 μM deoxynucleotide triphosphates, 10% dimethylsulfoxide (v/v), and 2.5 U Taq DNA polymerase per reaction. After denaturation at 95C for 3 min, 30 cycles of PCR amplification were performed: denaturation at 95C for 30 sec, annealing at 47C for 30 sec increasing by 2C for each of the first five cycles to 57C, and polymerization at 72C for 30 sec. The last cycle included 10 min at 72C. In certain cases the amplification product was used for a second (nested) amplification with different primers (see Figure 4A). The sequences for the first amplification step of rat NHE 1 were: “for 1”, 5′-CTGTGGAA(C/T)GC(C/T)TT(C/T)TT; “rev 1”, 5′-ATGAC(A/G)AAGGTCCAGTTCCA; for the second (nested) amplification: “for 2”, 5′-CACATCCTGGT(G/C) TTTGGGGA; “rev 2”, 5′-CT(G/C)ACGCTGCTCCACATCTT. The sequences of the primers for the amplification of cDNA encoding the transmembrane domain of rat NHE 4 were: “T-for 1”, 5′-GGGGCCCTGATCAATGCTTT; and “T-rev 1”, 5′-GCCTCCCCGAAGATCATCAT. The sequences of the primers for the first amplification step of cDNA encoding the C-terminal cytosolic domain of rat NHE 4 were: “C-for 1”, 5′-ATCGAGATGGCAGAGACTGG; and “C-rev 1”, 5′-AGCCTTGGCTGTGTCTCTTG; for the nested amplification: “C-for 2”, 5′-AGGATACAGGGAATCAAGCG; and “C-rev 2”, 5′-CACCATGGCCCTGCACAGG. The primers to detect cDNA encoding the transmembrane domain of rat NHE 4 and the cytosolic domain of rat NHE 4 were: “T-for”, 5′-GAGACCCTCATCTTCATCTTC; and “C-rev 2” and “T-for 1” combined with the reverse primer encoding the last 23 oligonucleotides of NHE 4, “C-stop”, 5′-CTAATTCAAGTTTCTACATAATA. The resulting amplification products were ligated in pUC 18 using the Sure Clone kit, and the plasmids were recovered according to the method of Del Sal et al. (1988). DNA inserts were sequenced using the T7 Sequencing kit.
Tissue Preparation for Light Microscopy
Male Wistar rats were anesthetized with pentobarbital (Nembutal) (65 mg/kg IP) and perfusion-fixed with 2% paraformaldehyde/75 mM lysine/10 mM sodium periodate (PLP) as described by McLean and Nakane (1974). Pancreas was removed, cut into blocks, and further fixed in fresh fixative overnight at 4C. PLP-fixed tissue was washed four times for 10 min with PBS and kept in PBS containing 0.02% sodium azide at 4C until further use. Alternatively, animals were sacrificed by cervical dislocation and the pancreas was removed. Pancreatic tissue was fixed by immersion in Bouin's fixative (water-saturated 71.4% picric acid, 23.8% formaldehyde, and 4.76% acetic acid) for 48 hr at 4C, dehydrated through a graded series of isopropanol (80%, 96%, and 100%) and methylbenzoate (100%), and embedded in paraffin.
Immunofluorescence Light Microscopy on Cryosections
Tissue blocks were cryoprotected in 30% sucrose for at least 1 hr and frozen in liquid N2. Indirect immunohistochemistry was performed on 5-μm cryosections. Sections were rehydrated in PBS for 5 min, treated with 1%SDS for 5 min (Brown et al. 1996), washed three times with PBS for 5 min, and blocked with 1% BSA/PBS for 15 min. Slides were incubated overnight at 4C with primary antibody at dilutions of 1:200 for V-ATPase and 1:800 for AE2 in PBS containing 0.02% sodium azide. After incubation with the primary antibody, slides were washed three times with PBS for 5 min and incubated with donkey anti-rabbit IgG coupled to CY3 (1:600 dilution) for 1 hr at RT. Sections were washed three times with PBS for 5 min and mounted with 2:1 Vectashield/Tris-HCl (pH 8.0). Sections were viewed with an epifluorescence microscope (Olympus).
Immunoperoxidase Light Microscopy on Paraffin Sections
For localization of the vacuolar-type H+-ATPase, immunoperoxidase light microscopy was applied as previously described (Roussa et al. 1998). Briefly, 5-μm paraffin sections were deparaffinized, rinsed with water for 20 min, washed three times with 0.05 M Tris buffer (pH 7.4), and incubated with either the antibody against the 31-kD subunit or with the antibody against the 70-kD subunit of vacuolar-type H+-ATPase at a dilution of 1:200 in 0.05 M Tris buffer containing 0.25% gelatin and 0.06% Triton X-100 overnight at RT. Sections were washed three times with Tris buffer for 5 min and incubated with goat anti-rabbit IgG coupled to horseradish peroxidase (1:50 dilution) for 1 hr at RT. Peroxidase activity was visualized with diaminobenzidine and hydrogen peroxide. Sections were dehydrated in a graded series of ethanol concentrations (70%, 80%, 90%, 96%, and 100%), cleared in xylene, and mounted with DePeX mounting medium. Images of labeled sections were recorded with charge-coupled device cameras connected to a frame grabber that was mounted in an IBM-compatible personal computer.
Pre-embedding Immunogold Electron Microscopy
Electron microscopy on isolated rat pancreatic ZGs was performed as described earlier (Anderie et al. 1998) with minor modifications. ZGs were fixed in 2.5% glutaraldehyde in PBS for 1 hr and adsorbed onto poly-
Results
AE2 in Rat Pancreas
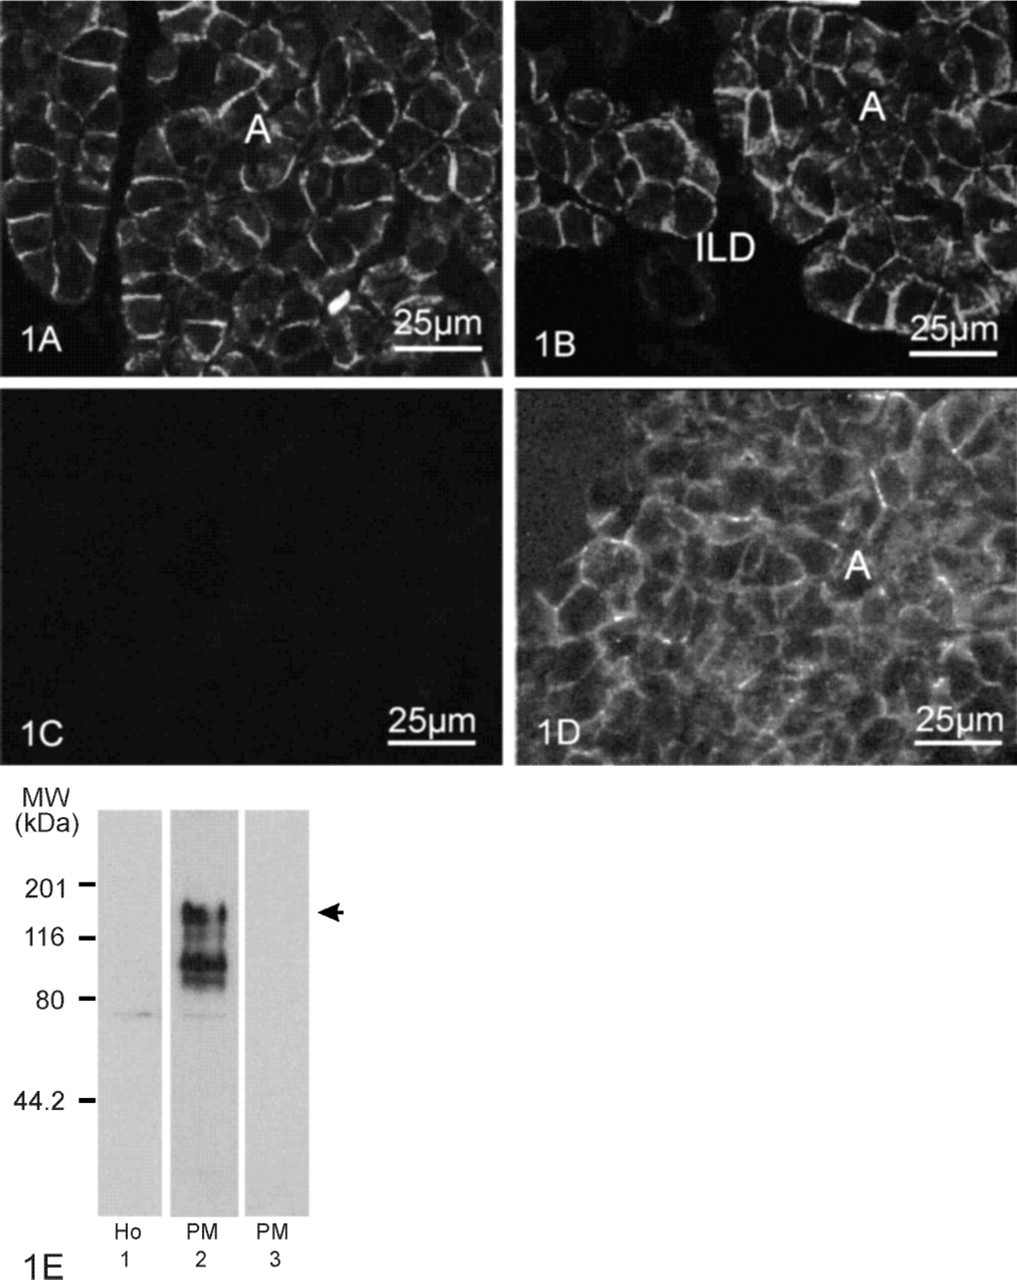
Figures 1A and 1B illustrate the immunofluorescence labeling pattern observed with the antibody against aa 1224–1237 of mouse AE2 (1:800 dilution) on cryosections of PLP-fixed pancreas with epitope unmasking by SDS. Acinar cells (Figure 1A, A) revealed sharp AE2 staining of strong intensity at the basolateral cell sides. In contrast, AE2 immunoreactivity was absent in all cells lining the pancreatic duct segments, i.e., intercalated, intralobular (Figure 1B, ILD), interlobular, and main duct cells. Acinar staining was abolished by pre-incubation of the antibody with an excess of the AE2 peptide antigen (24 μg/ml) (Figure 1C).
Because the anti-AE2 aa 1224–1237 also crossreacts with the COOH-terminal sequence of AE1, competition experiments with AE1 antigen were also necessary to determine labeling specificity. Figure 1D shows that pre-incubation of the antibody with 12 μg/ml AE1 antigen (aa 917–929) did not eliminate acinar basolateral immunostaining, indicating that the acinar labeling is indeed AE2.
AE2 polypeptide expression in rat pancreas was further evaluated by immunoblots on homogenate of whole rat pancreas (Ho) and a plasma membrane fraction (PM). The anti-AE2 antibody (1:10, 000) recognized bands at ≈160 kD (Figure 1E, arrow), ≈110 kD, and ≈90 kD in the plasma membrane fraction (Figure 1E, Lane 2), whereas these bands were not detectable in the tissue homogenate (Figure 1E, Lane 1). In addition, a faint band at ≈75 kD was present in both homogenate and plasma membrane fractions. Labeling of all these bands in the PM fraction was abolished by co-incubation of the antibody with 24 μg/ml peptide antigen, as shown in Figure 1E, Lane 3.
AE2 immunoreactivity in rat exocrine pancreas. Immunofluorescence light microscopy on SDS-treated cryosections (
V-ATPase in Rat Pancreas
Figure 2A shows the immunofluorescence labeling pattern of V-ATPase in rat pancreas using the antibody raised against the 70-kD V-ATPase subunit (1:200 dilution). Acinar cells (Figure 2A, A) exhibited strong, but diffuse V-ATPase immunoreactivity at the apical cell sides. At higher magnification (Figure 2B), labeling appeared localized at the area occupied by the ZGs (arrow). Identical V-ATPase distribution of weaker intensity was observed using the antibody against the 31-kD V-ATPase subunit (not shown). We performed ultrastructural examination to ensure that the distribution observed by light microscopy indeed represents labeling of ZGs. Figure 2C shows the results obtained by electron microscopy with the antibody against the 70-kD V-ATPase subunit on purified rat pancreatic ZGs using a pre-embedding protocol, as described in Materials and Methods. Silver-enhanced immunogold labeling was found with both antibodies, the particles being located at the membrane surface of the granules, which confirms the results obtained by light microscopy. No ZG labeling was observed in control experiments in which primary antibody was omitted, as shown in Figure 2D.
Pancreatic duct cells also exhibited labeling with both antibodies against the 31-kD and the 70-kD V-ATPase subunit. Figures 2E and 2F illustrate V-ATP-ase distribution in pancreatic ducts by immunoperoxidase light microscopy on paraffin sections from pancreas fixed in Bouin's fixative. Intralobular duct cells (Figure 2E, ILD) showed V-ATPase staining of strong intensity at their basolateral cell sides. Occasionally, single cells exhibited staining at the apical cell side, as shown in Figures 2E and 2F (arrows). Labeling in intralobular ducts was similar to that found in interlobular ducts, whereas main duct cells revealed basolateral staining of moderate intensity, with certain cells showing diffuse intracellular V-ATPase distribution (not shown). Labeling in duct cells was absent in the control experiments in which the primary antibody was either substituted by pre-immune serum (not shown), or preincubated with 0.5 mM peptide antigen (Figure 2G).
Functional studies (Villanger et al. 1995; De Ondarza and Hootman 1997) have proposed that, in the pig and guinea pig, resting duct cells exhibit tubulovesicles in their cytoplasm carrying proton pumps, whereas, after stimulation, fusion of such tubulo-vesicles with the basolateral plasma membrane occurs. We therefore looked for differences in V-ATPase distribution in duct cells of fasted rats and rats fed ad libitum. However, no differences in V-ATPase distribution were found (data not shown).
Figure 2H shows an immunoblot analysis of whole rat pancreas homogenate (pHo), plasma membranes (PM), and ZG membranes (ZGM) with the antibody against the 31-kD V-ATPase subunit (1:2500). Rat kidney cortex homogenate (kHo) (Figure 2H, Lane 4) was used as a positive control. Similarly to kidney cortex homogenate, a major immunoreactive band at ≈31 kD (Figure 2H, arrow) was present in pHo (Figure 2H, Lane 1), PM (Figure 2H, Lane 2), and ZGM (Figure 2H, Lane 3). In pHo and PM, weaker bands of higher apparent molecular mass were also present. With the antibody against the 70-kD V-ATPase subunit, a 70-kD band was detected in kHo but no labeling was observed in pHo and ZGM (data not shown). This result was unexpected because both immunohistochemistry and immunogold procedures had revealed labeling with antibodies against both V-ATPase subunits at the ZGM (Figures 2A and 2C) and immunohistochemical staining in duct cells (Figures 2E and 2F). We suspected that the protein was degraded by proteolytic enzymes in pancreatic tissue during the preparation of ZGM, which lasted for several hours. Although both peptide sequences against which the antibodies are raised have multiple cleavage sites for the pancreatic enzymes trypsin and chymotrypsin, it seemed possible that the tertiary structure of the 70-kD V-ATPase subunit makes the cleavage sides particularly accessible to proteolytic enzymes. Indeed, modification of the tissue homogenization protocol (described in Materials and Methods), combining both tissue homogenization under liquid N2 and the use of acidic buffers to prevent activation of proteolytic enzymes, enabled detection of a single immunoreactive band at 70 kD in pHo with the antibody against the E V-ATPase subunit, as shown in Figure 2H, Lane 6. However, this modified protocol using liquid N2 cannot be applied for isolation of ZGs because it does not preserve the integrity of cellular organelles.
V-ATPase expression in rat exocrine pancreas. (
Expression of NHE1 and NHE4 in rat exocrine pancreas. (
NHE1 and NHE4 in Rat Pancreas
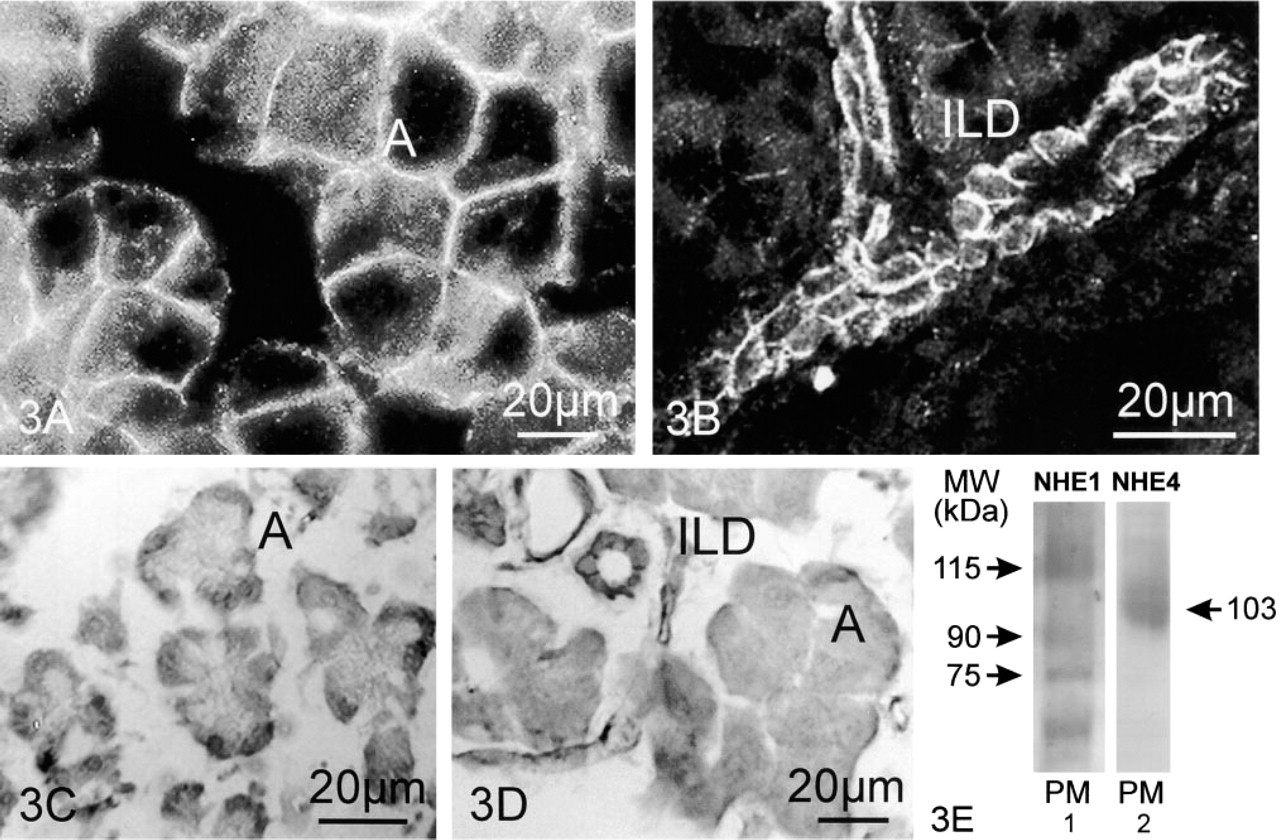
Figures 3A and 3B show the staining pattern using the anti-NHE1 antibody on PLP-fixed cryosections of rat pancreas. Acinar cells (Figure 3A, A) revealed sharp NHE1 staining of moderate intensity at the baso-lateral cell sides. NHE1 immunoreactivity was also present in pancreatic ducts: Figure 3B shows the NHE1 labeling pattern in intralobular (ILD) duct cells, showing uniform NHE1 staining at their basolateral membranes. An identical staining pattern was also observed in interlobular and main duct cells (not shown), thus confirming the data reported by Lee et al. (2000). Labeling in both acinar and duct cells was absent in control experiments in which the sections had not been incubated with the primary antibody (not shown).
No NHE4 labeling was detected with the anti-NHE4 monoclonal antibody 11H11 on PLP-fixed cryo-sections that had not been treated with SDS. However, by use of an antigen unmasking protocol by treating the cryosections with 1% SDS for 5 min before antibody incubation, NHE4 immunolabeling was observed in rat pancreas (Figures 3C and 3D). Acinar cells (Figures 3C and 3D, A) showed specific NHE4 staining in their basolateral cell sides. Similarly, baso-lateral NHE4 labeling was also observed in intralobular (Figure 3D, ILD), interlobular and main duct segments. The results of immunoblotting experiments with the polyclonal antibodies against NHE1 (1:2500) and NHE4 (1:2500) on a rat pancreas plasma membrane fraction (PM) are shown in Figure 3E, Lanes 1 and 2. The anti-NHE1 antibody crossreacted with proteins from plasma membranes of sizes ≈115 kD, ≈90 kD, ≈76 kD, and ≈58 kD, whereas the anti-NHE4 antibody recognized a major immunoreactive band at ≈103 kD.
Figure 4 shows NHE1 and NHE4 mRNA expression in whole rat pancreas and kidney tissue cDNA used as a positive control, as detected by RT-PCR. With NHE1-specific degenerate primers (Sardet et al. 1989), a 403-bp fragment from rat pancreatic and kidney cDNA was obtained after two amplification steps (Figure 4B), as previously reported (Anderie et al. 1998). A 203-bp NHE4 fragment was also identified in rat pancreas and kidney after one amplification step with specific primers encoding sequences in the evolutionary highly conserved predicted transmembrane domains 5 (“T-for 1”) and 5b (“T-rev 1”) (Anderie et al. 1998) (Figure 4A). Similar results were also obtained in another exocrine gland, the rat parotid gland (data not shown). However, it should be noted that when we tried to amplify NHE4 cDNA from pancreas or kidney with NHE4-specific primers deduced from cDNA coding for the cytosolic domain of NHE4 (“C-for 1”, “C-for 2”, “C-rev 1”, “C-rev 2”, C = cytosolic) and also for the transmembrane domain of NHE4 (“T-for”, T = transmembrane) (Orlowski et al. 1992) (Figure 4A), no amplification products of RT-PCR were obtained with pancreas cDNA (Figure 4B). In contrast, a 1001-bp (Figures 4A and 4B), a 466-bp (i.e., the product of the first amplification step “C-for1” “C-rev1”; Figure 4A and not shown in 4B) and a 359-bp (i.e., the product of the “nested” amplification, “C-for2” “C-rev2”; Figures 4A and 4B) fragment were evident in kidney. The 466-bp and 359-bp fragments from kidney cDNA were cloned and after sequencing were identified as NHE 4 (accession no. m35001). The forward primer (“T-for 1”), which successfully detected NHE 4 from pancreas and kidney cDNA, was also used for further amplification with a reverse primer that encodes the NHE4 sequence from the cytosolic carboxy-terminal part (“C-stop”). This RT-PCR revealed a 1662-bp fragment in kidney cDNA but not in pancreatic cDNA (Figure 4B). This confirms that RT-PCR with primers corresponding to the cytosolic domain of NHE4 can detect NHE4 transcripts in rat kidney but not in rat pancreas.
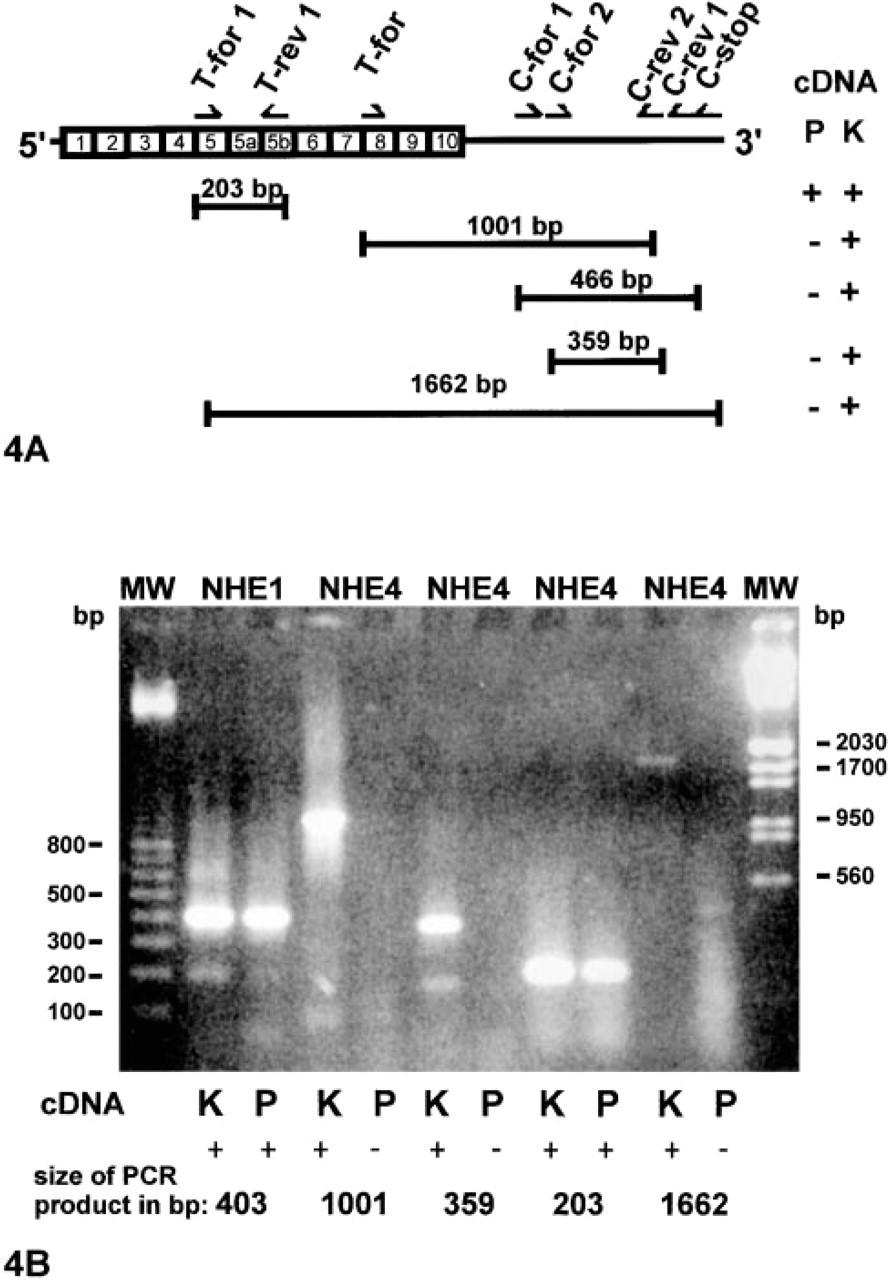
Schematic of the strategy used to amplify NHE4-specific cDNA from rat pancreas and kidney and RT-PCR amplification products. The coding regions for the predicted transmembrane domains (Boxes 1–10) and for the carboxy-terminal ends of the NHE4 are shown in (
Discussion
AE2
The anion exchanger (AE) gene family includes products of three genes, AE1, AE2, and AE3 (Alper et al. 1989; Alper 1994). AE2 mRNA is also expressed in human fetal pancreas (Hyde et al. 1999). Immunoblotting of a plasma membrane fraction from adult rat pancreas with anti-AE2 antibody revealed immunoreactive bands at ≈90 kD, ≈110 kD, and ≈160 kD (Figure 1E). The ≈160-kD band is similar to the apparent molecular mass (Mr) of AE2a/b (Alper et al. 1989). Although the ≈90-kD and ≈110-kD bands correspond to the Mr of AE1, the lower band likely reflects residual erythrocytes in the tissue sample. The identity of the ≈110-kD band remains uncertain, but it resembles polypeptides previously noted in several secretory cell types, alveolar Type II cells (Noviz–Grayck et al. 1997), and may represent a Golgi form of AE (Kellokumpu et al. 1988).
Immunohistochemistry showed basolateral AE2 labeling in pancreatic acinar cells (Figures 1A and 1B), which is in agreement with previous functional studies (Muallem and Loessberg 1990). However, duct cells did not show any AE2 immunoreactivity as already described for rat salivary glands using the same AE2 antibody (Roussa et al. 1999). Functional studies have provided strong evidence for AE activity in rat pancreatic ducts (Novak and Greger 1988a, b; Zhao et al. 1994). This is also supported by a recent study in human fetal pancreas, which showed AE2 expression in whole fetal pancreas but not in duct cells (Hyde et al. 1999). It is therefore likely that AE2 expression in whole pancreas reflects acinar AE2 expression, as shown in the present study. Our results therefore indicate that AE2 is not involved in HCO3 – secretion by pancreatic duct cells, but that another AE may contribute to ductal HCO3 – secretion.
V-ATPase
Zymogen Granules. Our results show the presence of the 31-kD and 70-kD subunits of V-ATPase in ZG membranes (Figures 2B and 2C). Active H+ pumping by V-ATPases is generally held responsible for acidification of intracellular compartments. Our data suggest that the acidic intragranular pH previously reported (Gasser et al. 1988) reflects granule acidification generated by a V-ATPase. What could be the physiological role of an acidic granule pH? In vitro studies have demonstrated that an acidic ZG pH is necessary for aggregation and condensation-sorting of secretory proteins (Dartsch et al. 1998). A previous study has demonstrated that NHE1 and NHE4 are expressed in ZGs by immunogold labeling (Anderie et al. 1998). This suggests that these transporters may be functionally linked to contribute to ZG fusion and exocytosis of digestive enzymes, possibly by alkalinization and/or osmotic Na+ influx into the intragranular space to promote decondensation and disaggregation of ZG contents.
Ducts. When expressed in plasma membranes of epithelial cells, V-ATPases may also contribute to generation of intracellular HCO3 – by extruding H+ out of cells (Alper et al. 1988). Our results show basolateral V-ATPase distribution in intra- and interlobular cells, with certain cells being stained in the luminal cell side (Figures 2E and 2F, arrows). The data are consistent with a perfusion study that showed an HCO3 –-dependent and bafilomycin A1-sensitive H+ extrusion mechanism in the basolateral membrane of intralobular, main, and common segments of rat pancreatic ducts (Zhao et al. 1994). They are also in agreement with functional studies in pig and guinea pig pancreatic interlobular ducts (Villanger et al. 1995; De Ondarza and Hootman 1997) suggesting secretagogue-induced fusion of tubulo-vesicles carrying H+ pumps into the plasma membranes to enhance H+ extrusion. Thus, a basolaterally located V-ATPase could mediate H+ extrusion into the interstitial fluid, thereby enhancing the supply of intracellular HCO3 – required for secretagogue-induced HCO3 – secretion into the pancreatic juice via the luminal Cl–/HCO3 – exchanger.
NHE1 and NHE4
In the present study we have demonstrated NHE1 and NHE4 expression in basolateral membranes of acinar and duct cells (Figures 3A–3D). The immunohistochemical data are extended by immunoblotting of plasma membranes with anti-NHE1 antibody, which revealed immunoreactive bands at ≈115 kD, ≈90 kD, and ≈76 kD. The ≈115-kD band likely corresponds to the mature processed form of NHE1 (91 kD). The ≈90-kD (and perhaps also the ≈76 kD) band may represent a precursor form of NHE1, as previously reported (Coupaye–Gerard et al. 1996). Immunoblotting of plasma membranes with a polyclonal anti-NHE4 antibody showed an immunoreactive band at ≈103 kD, which is in agreement with the results of previous studies on fibroblasts transfected with NHE4 cDNA (Bookstein et al. 1994) and probably represents glycosylated NHE4. Our results agree with perfusion studies on acinar (Muallem and Loessberg 1990) and duct cells (Zhao et al. 1994), which provided evidence for basolateral Na+/H+ exchange activity in both cell types and demonstrated that Na+/H+ exchange activity in the basolateral membrane is completely blocked in the presence of 0.5 mM amiloride, a concentration sufficient to inhibit both NHE1 and NHE4 (Bachmann et al. 1998). A recent study has demonstrated by RT-PCR that rat pancreatic ducts do not express NHE4 mRNA, using primers encoding the published 3′ UTR sequence (Lee et al. 2000). We also failed to PCR-amplify NHE4 when we attempted to demonstrate NHE4 in rat pancreas with primers for the C-terminal cytosolic region of NHE4, whereas PCR with kidney cDNA was successful (Figures 4A and 4B). However, with NHE4-specific primers encoding cDNA sequences of the highly homologous predicted transmembane domains 5 and 5b (Orlowski et al. 1992), a 203-bp fragment identical to the NHE4 cDNA sequence reported by Orlowski et al. was detected in pancreas and kidney cDNA (Anderie et al. 1998). Interestingly, Robertson et al. (1997) also failed to PCR-amplify NHE4 by RT-PCR from parotid cDNA with primers encoding the cytosolic region of NHE4, but with NHE4-specific primers from the transmembrane regions 5 and 5b, we obtained an NHE4 cDNA fragment from parotid tissue (not shown). Our results, together with the data from Robertson et al. (1997), indicate that it is impossible to amplify NHE4 from pancreas or parotid gland with primers coding for the C-terminal region of NHE4 and may account for the difference between our results and those of Lee et al. (2000). One explanation could be that the 3′-reverse primers (“C-stop”, “C-rev1”, and “C-rev2”; see Figure 4A) deduced from the base sequence encoding the carboxy-terminal region of rat stomach NHE4 cDNA (Orlowski et al. 1992) do not match the 3′-terminal base sequence of rat pancreatic NHE4. Alternatively, the 3′-terminal base sequences of NHE4 covered by the 3′-reverse primers may be missing in rat pancreatic NHE4.
The failure to obtain PCR products of the carboxy-terminus of pancreatic NHE4 appears in contrast to the detection of NHE4 with antibodies raised against C-terminal NHE4 sequences. Degradation or absence of the 3′-end of the pancreatic cDNA in the present study could be ruled out because the reverse transcription was not random but was oligo dT-primed. One possible explanation is that the epitope recognized by the antibody directed against the 40 C-terminal NHE4 aa is located outside of the sequence covered by the primers used (in aa 677–690 or aa 696–704). The 3′-reverse primers “C-stop”, “C-rev1”, and “C-rev2” covered the sequences corresponding to aa 711–717, aa 704–710, and aa 690–696, respectively. However, the polyclonal antibody used in the present study was raised against aa 677–717 of NHE4. Alternatively, differences between the 3′-terminal sequences of the primers derived from the stomach NHE sequence published by Orlowski et al. (1992) and the corresponding cDNA of pancreatic NHE4 could result in negative RT-PCR, but could translate into the same amino acid sequence in stomach and pancreas, thus explaining the results obtained with the antibodies used in the present study. It therefore seems likely that the pancreas and parotid NHE4 cDNA sequences encoding the C-terminal cytosolic region of NHE4 may differ from those of stomach (Orlowski et al. 1992). In this context, it should be mentioned that Orlowski et al. reported additional minor gastric NHE4 transcripts of larger and smaller size and suggested that these might represent partially processed or alternatively spliced gene products of NHE4.
Pancreatic duct cells are highly specialized bicarbonate secretory cells. They appear to be equipped with several H+ extrusion mechanisms at their baso-lateral membranes, such as Na+/H+ exchangers (Lee et al. 2000; and this study), the Na+/HCO3 – co-transporter NBC (Thévenod et al. 1999), and a V-ATP-ase (this study). Together with our previous study (Thévenod et al. 1999), the present work confirms the functional study by Zhao et al. (1994), demonstrating the presence of all three H+-extruding mechanisms at the ductal basolateral plasma membrane of rat pancreas, and provides molecular entities for these transporters. What could be the reason for this redundancy of HCO3 –-accumulating transport proteins? They may be recruited to various degrees, depending on demand, and compensate for loss-of-function mutations in any individual transporter. For example, in vitro studies on interlobular duct segments from guinea pig pancreas show that inhibition of an Na+/HCO3 – co-transporter with H2-DIDS that is responsible for more than 75% of secretin-stimulated HCO3 – accumulation (Ishiguro et al. 1996a) can be substantially compensated by an amiloride-sensitive component, most likely an Na+/H+ exchanger. Similarly, in humans, in whom NBC is expressed basolaterally (Marino et al. 1999), patients with a loss-of-function mutation of NBC do not show major pancreatic dysfunction (Iga-rashi et al. 1999), suggesting that intracellular HCO3 – accumulation can be accomodated for by (an)other basolateral transporter(s) as well. This is different from CFTR, which is expressed in the luminal membrane of pancreatic ducts and whose mutations are associated with pancreatic dysfunction. Therefore, luminal secretory HCO3 – transporters may be rate-limiting in ductal HCO3 – secretion.
Footnotes
Acknowledgements
Supported by a grant from Deutsche Mukoviszidose e.V. (FT, ER) and by National Institute of Diabetes and Digestive and Kidney Diseases grants DK-43495 (SLA) and DK 34854 (Harvard Digestive Diseases Center).