
Abstract
M
The MAb AA4 was originally identified as one of several monoclonal antibodies raised against the surface of RBL-2H3 cells that affect histamine release (Basciano et al. 1986). MAb AA4 recognizes two derivatives of the gangliosideGD1b (Guo et al. 1989) that are unique to the surface of rat mast cells. These gangliosides are found close to Fc∊RI and co-precipatate with the Src family tyrosine kinase p53/56lyn (Minoguchi et al. 1994). Binding of MAb AA4 or its Fab fragment to the surface of RBL-2H3 cells inhibits the binding of IgE to the receptor and produces morphological and biochemical changes similar to those seen with activation of Fc∊RI, but without the release of histamine (Oliver et al. 1992; Swaim et al. 1994; Stephan et al. 1997). Previously, we had noted that this MAb recognized mature mast cells in rat bone marrow along with a population of poorly differentiated cells presumed to be immature mast cells (Oliver et al. 1992). Subsequently, MAb AA4 was used to detect the presence of immature mast cells during repopulation of the rat peritoneal cavity after mast cell depletion by distilled water (Faraco et al. 1997). In this study we have used this well-characterized mast cell-specific MAb AA4, (Oliver et al. 1992; Jamur et al. 1995, 1997; Faraco et al. 1997) to identify, isolate, and characterize mast cells at various stages of maturation in rat bone marrow.
Materials and Methods
Cells
Young (150 g) male and female Wistar (Secretary of Health; Paraná State, Paraná, Brazil) and Sprague–Dawley (Harlan Sprague–Dawley; Indianapolis, IN) rats were used. Animals were housed and experiments were conducted according to NIH guidelines. Bone marrow from the femurs of the rats was removed with Dulbecco's PBS containing heparin (1000 U/ml; Produtos Roche Químicos e Farmacêuticos, Rio de Janeiro, Brazil) and DNase (1000 U/ml, Type I; Sigma Chemical, St Louis, MO). The cells were dissociated by aspiration with a Pasteur pipette. They were then rinsed twice by centrifugation (27 × g) in PBS.
Peripheral blood was collected in a heparinized syringe by cardiac puncture.
Peritoneal cells were obtained by injecting rats IP with 15 ml PBS. The peritoneal wash was collected with a Pasteur pipette after laparotomy. The cells were rinsed twice by centrifugation (27 × g) in PBS and placed on Cell Tak (Becton Dickinson Labware; Collaborative Biomedical Products, Bedford, MA)-coated coverslips. In some experiments, the adherent cells were separated from non-adherent cells by re-suspending the cells in PBS + 1% BSA, allowing them to settle onto an uncoated coverslip for 1 h at 37C, and then rinsing the coverslip three times in PBS.
Antibodies
MAbs AA4 and BC4 (Basciano et al. 1986) were raised in mice against the cell surface of RBL-2H3 cells, a rat mast cell line. The antibodies were purified from ascites fluid by ammonium sulfate precipitation, followed either by ion exchange chromatography on a DE-52 column, MAb BC4, or HPLC, MAb AA4. An affinity-purified mouse MAb, anti-rat IgE, was purchased from Biosource International (Camarillo, CA). The polyclonal antibody against c-kit was purchased from Santa Cruz Biotechnologies (Santa Cruz, CA). All MAbs are IgGγ1.
Coupling of Antibody to Magnetic Beads
MAb AA4 was conjugated to tosylactivated Dynabeads (Dynal; Lake Success, NY) as previously described (Jamur et al. 1997). Briefly, equal volumes of tosylactivated Dynabeads and MAb AA4 were mixed. The solution was incubated for 24 hr at 22C with slow end-over-end rotation. After incubation the magnetic beads were collected and washed three times with 5 ml 0.01 M PBS containing 0.1% BSA. The coated beads were resuspended and stored in PBS + 0.1% BSA at a concentration of 30 mg/ml.
Cell Separation
The cells were incubated with coated beads (3 beads/target cell) in PBS containing 2% BSA for 5–10 min at room temperature (RT). After incubation the mast cells were isolated by washing four times with PBS containing 2% BSA and once in PBS.
Light Microscopy
Cells were rinsed in PBS and placed on coverslips coated with Cell Tak (Becton Dickinson Labware). Some samples were fixed and stained with Toluidine Blue (4% formaldehyde, 0.1% Toluidine blue, and 1% acetic acid, pH 2.8, for 10 min) or Alcian Blue (1% Alcian Blue in 0.1 N hydrochloric acid for 30 min). Other samples were fixed with 4% formaldehyde for 20 min and stained with 0.02% berberine sulfate (Molecular Probes; Eugene, OR), pH 4.0, for 20 min, rinsed in water adjusted to pH 4.0 with acetic acid for 5 min, and mounted in anhydrous glycerol. For immunostaining of plastic-embedded samples, tissues from 250-g male Sprague–Dawley rats were fixed for 2 hr in 4% formaldehyde, dehydrated and embedded in JB-4 plastic (EM Sciences; Fort Washington, PA). Four-μm sections were mounted on glass slides and the sections treated with xylene for 15 min and then rehydrated to water. The sections were blocked with 1% BSA in PBS and incubated with MAb AA4 for 2 hr at 37C. After rinsing in PBS, the sections were treated with AuroProbe LM gold-conjugated goat anti-mouse IgG (Amersham Pharmacia Biotech; Uppsala, Sweden), and the gold silver enhanced (IntenSe M; Amersham Pharmacia). For fluorescence microscopy, cells were placed on Cell Tak-coated coverslips, rinsed three times in PBS, and fixed and permeabilized in 2% formaldehyde (EM Sciences) in methanol for 5 min at –20C. The cells were rinsed in PBS, PBS containing 0.1 M glycine, and incubated with MAb AA4 (5 μg/ml) directly conjugated to FITC or anti c-kit (10 μg/ml) for 1 hr at RT. After incubation, the cells were rinsed thoroughly in PBS and the samples incubated with anti c-kit were further incubated with donkey anti-rabbit Fab′2 conjugated to FITC (JacksonImmunoResearch; West Grove, PA). All cells were then rinsed and the cover-slips mounted with Fluoromount-G (EM Sciences) and observed with fluorescence and phase-contrast microscopy.
Electron Microscopy
For routine electron microscopy, cells were fixed in 2% glutaraldehyde (Ladd Research Industries; Burlington, VT)–2% paraformaldehyde (Ladd) in 0.1 M cacodylate buffer, pH 7.4, containing 0.05% CaCl2, for 40 min at RT.
Because all of the antigens detected are sensitive to glutaraldehyde, for immunoelectron microscopy the samples were fixed by microwave. Cells were suspended in 5 ml of fixative containing 2% formaldehyde, 0.05% glutaraldehyde (Ladd), 0.025% CaCl2 in 0.1M cacodylate buffer, pH 7.4, and irradiated for 4 sec at 100% power (Jamur et al. 1995). Immediately after irradiation, 10 ml of PBS was added to the suspension and the cells were centrifuged for 2 min (27 × g). The cells were then rinsed twice in PBS, PBS containing 0.1 M glycine, and then in PBS.
After fixation, cells were incubated with primary antibody (MAb AA4, 2.5 μg/ml; MAb BC4, 0.5 μg/ml; anti-IgE, 5 μg/ml) diluted in PBS + 1% BSA for 1 hr at RT. After incubation the cells were rinsed sequentially in PBS + 1% BSA, PBS, PBS + 1% BSA, and then incubated for 1 hr with donkey anti-mouse IgG conjugated to horseradish peroxidase diluted (25 μg/ml final concentration; Jackson ImmunoResearch) in PBS + 1% BSA. Cells incubated without primary antibody or with normal mouse IgG (5 μg/ml; Jackson ImmunoResearch) in place of the primary antibody served as controls. None of the controls was immunolabeled. The cells were then rinsed in PBS + 1% BSA, PBS and 0.1 M cacodylate buffer (pH 7.4) and immersed in diaminobenzidine incubation medium [12.5 ml cacodylate buffer, 12.5 mg diaminobenzidine (Polysciences; Warrington, PA) and 250 μl 1% H2O2] for 30 min at RT. The cells were then rinsed 10 times in cacodylate buffer. For light microscopy, endogenous peroxidase was blocked by incubating the samples for 30 min in 3% H2O2 in methanol at RT. Some samples were packed by centrifugation in 1.5% agar before processing for electron microscopy. Cells were postfixed in 2% OsO4 (EM Sciences) for 1 hr at RT, rinsed in distilled water, dehydrated through a graded series of ethanols, rinsed in acetone, and embedded in Embed 812 (EM Sciences). Thin sections were cut with a diamond knife and stained for 10 min each in Reynolds'lead citrate (Reynolds 1963) and uranyl acetate.
Flow Cytometry
The suspension of bone marrow cells was washed twice by centrifugation (27 × g) in PBS + 2% BSA, blocked for 1 hr with rat IgG (5 μg/ml), rinsed in PBS + 2% BSA, and incubated with MAb AA4 directly conjugated to FITC (2.5 μg/ml; filtered through a 0.22 μm Millex-GV filter unit; Millipore Products Division, Bedford, MA) in PBS + 1% BSA for 1 hr at RT or with rabbit IgG directly conjugated to FITC (3 μg/ml, filtered through a 0.22 μm Millex-GV filter unit). After incubation, the cells were washed five times in PBS + 1% BSA and analyzed with a Becton-Dickinson Fluorescence Activated Cell Sorter (Becton-Dickinson Labware; Bedford, MA) using the Lysis II program. Because the bone marrow-derived mast cells do not represent a homogeneous population, the area to be gated was determined by sorting the cells inside the gate and examining the sorted cells by fluorescence microscopy. The gate was set to exclude any debris less than 2.5 μm in diameter and above cells displaying autofluorescence.
Cell Counts
The percentage of mast cells present in the bone marrow was determined by counting, in a Neubauer Camera, the positive and negative cells after immunostaining with either MAb AA4 or anti-IgE, and by counting the number of cells that were either free or attached to MAb AA4-conjugated beads.
The percentage of isolated cells that immunolabeled with MAb AA4, MAb BC4, anti-IgE, or anti-c-kit was determined by counting five separate fields from five different experiments with a × 40 objective. A minimum of 1000 cells/antibody was counted.
Cell Measurements
Cell volume was calculated from measurements of cell diameter of cells isolated with and attached to MAb-AA4-conjugated beads. A total of 150 cells were measured, with a minimum of 25 cells for each stage of maturation. Measurements were made by light microscopy of Toluidine Blue-stained preparations and were compared with measurements from electron micrographs of cells that were positive after immunostaining. Because of potential errors induced by measuring thin sections of cells, all data reported here are from whole cells measured by light microscopy.
RT-PCR
RNA was extracted from rat bone marrow cells and MAb AA4-isolated cells using the RNeasy Mini Kit (Quiagen; Valencia, CA). The RNA was treated with DNase I to eliminate residual genomic DNA; cDNA was then synthesized with the SUPERSCRIPT preamplification system for first strand cDNA synthesis (GIBCO-BRL; Grand Island, NY) and reverse-transcribed using random hexamer primers. Six pairs of oligonucleotide primers (Life Technologies; Rockville, MD) were used for amplification for 30 sec at 94C, 30 sec at 55C, and 1 min at 72C for 35 cycles in a 25-μl reaction, using Platinum Taq Polymerase (GIBCO-BRL). The PCR products were analyzed on 2.5% agarose gels.
Results
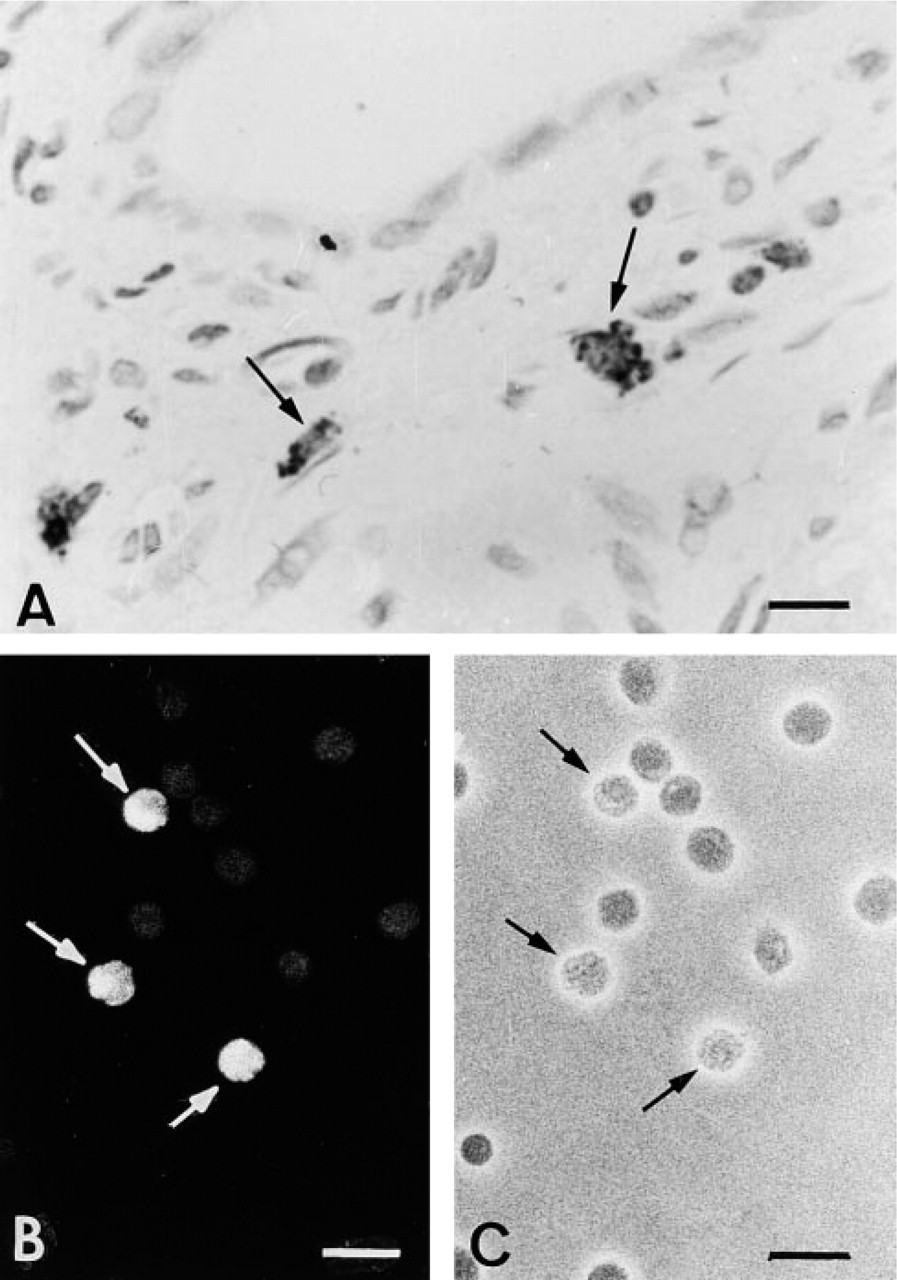
Mature and immature mast cells from rat bone marrow were identified and isolated using the mast cell-specific antibody MAb AA4. The specificity of MAb AA4 for mast cells was reconfirmed by immunostaining 18 different tissues from the rat: adrenal gland, brain, duodenum, epididymis, heart, kidney, lacrimal gland, liver, lung, parotid gland, pancreas, skeletal muscle, skin, spleen, sublingual gland, submandibular gland, testis, and thymus. After immunostaining, the mast cells were further identified by staining the sections with either Alcian Blue or Toluidine Blue (Figure 1A) Only mast cells were immunolabeled in all of the tissues examined. No other cell type was labeled. All controls were negative. In addition, rat whole peripheral blood smears and cells from peritoneal washings were immunostained with MAb AA4. In the peripheral blood, no cells were stained with MAb AA4 and, as expected (Castells 1997), no mast cells could be identified. In the peritoneal washings, only mast cells were immunostained (Figures 1B and 1C). All other cell types were negative. Moreover, in the peritoneal washing, when the adherent cells were separated from the non-adherent cells there was no immunostaining of the adherent cells. None of the control preparations was immunolabled. By electron microscopy, when the total bone marrow was immunolabeled with MAb AA4, again only mast cells were stained (Figure 2).
When plastic-embedded sections of the liver (
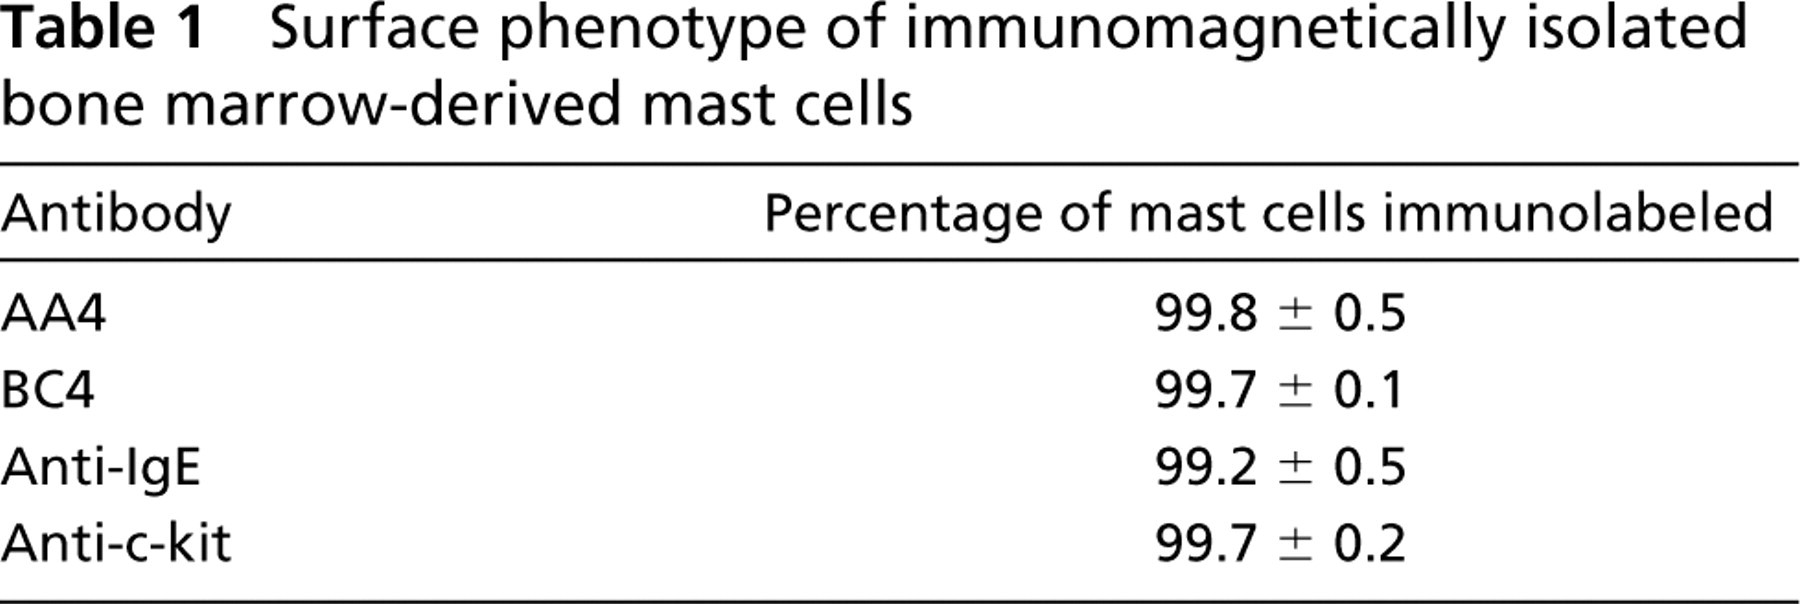
Although mast cell maturation is a dynamic process, on the basis of cell size, granule content, and overall morphology mast cells in three distinct stages could be distinguished among the immunolabled cells: very immature, immature, and mature. The mature mast cells could be readily identified on the basis of their morphology alone. However, the immature and very immature mast cells could not be identified without the use of the mast cell-specific antibody MAb AA4 (Figure 3). The very immature cells (Figure 3A) had large nuclei and the cytoplasm was virtually devoid of organelles other than mitochondria. A few small granules, usually less than three per section, could be found in the cytoplasm. The most prominent features of the immature mast cells (Figures 3B and 3C) were a well-developed Golgi apparatus and many electron-dense granules of various sizes in the cytoplasm. These cells appeared to be actively forming cytoplasmic granules, with the number of granules increasing as the cells matured. In addition, the nucleus was concave and often peripherally located. The mature mast cells (Figure 3D) displayed morphology typical for these cells. They contained a centrally located spherical nucleus, a cytoplasm filled with characteristic dense granules, and few organelles. Analysis of the total cell population from the bone marrow by flow cytometry using MAb AA4 to immunolabel the mast cells showed that only 2.34 ± 0.5% of the cells in the bone marrow are mast cells. Figure 4 shows the results of a representative experiment. By light microscopy, the number of mast cells present in the bone marrow was 2.4 ± 0.6%. This is in agreement with the percentage obtained by FACS analysis. Because the mast cells make up only a small proportion of the cells in bone marrow, we were concerned that, because of problems in sampling a specimen by electron microscopy, some stages of mast cell maturation could be missed by immunolabeling the whole cell population. Therefore, MAb AA4 was coupled to magnetic beads and the mast cells were isolated by immunomagnetic separation (Jamur et al. 1997). A pure population of mast cells was obtained after immunomagnetic isolation. There was no preferential selection for stage of maturation, and the same stages were seen in the mast cell population after immunomagnetic separation (Figure 5) as had been observed in the whole bone marrow preparation. Furthermore, no additional stages of maturation were observed. The mature mast cells were easily identified on the basis of morphology alone (Figure 5A), but to confirm the identity of the immature and very immature cells as mast cells, they were immunostained with MAb BC4, which is directed against the α-subunit of the high-affinity IgE receptor (Basciano et al. 1986) (Figures 5B and 5C). To further characterize the surface phenotype of these cells, the isolated cells were also immunolabeled with anti-IgE, specific for the heavy chain of rat IgE, and anti-c-kit, which recognizes the stem cell factor receptor. All of the antibodies used gave identical results and uniformly labeled the surface of the mast cells (Table 1). The c-kit receptor is expressed on rodent mast cells but not on basophils (Kitamura et al. 1993), and is useful for distinguishing between the two cell lineages. The fact that all of the isolated cells were positive for c-kit (Figure 6) confirms that they were mast cells rather than basophils. In addition, when peripheral blood was incubated with MAb AA4-conjugated magnetic beads, no cells bound to the beads.
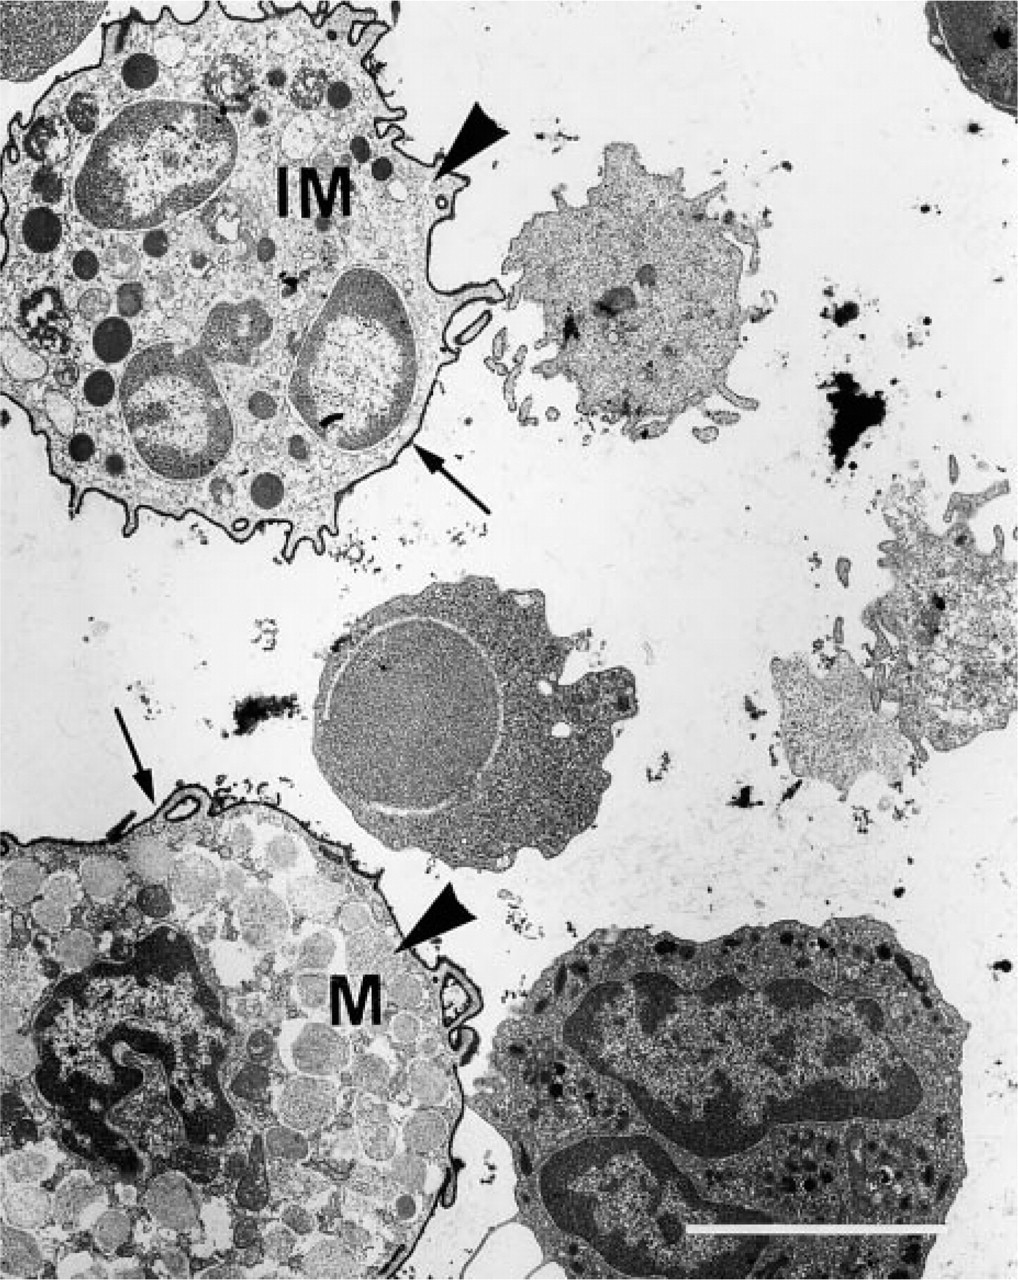
In this preparation of unfractionated bone marrow, only mast cells (arrowheads) are labeled with MAb AA4. The plasma membranes (arrows) of immature (IM) and mature (M) bone marrow-derived mast cells stain positively with mast cell-specific antibody MAb AA4. All other cells are negative. Bar = 5 μm.
Light microscopic measurements of immunomagnetically isolated mast cells showed that, as the mast cells matured, they increased significantly in diameter and cell volume (Table 2). The mast cells in the bone marrow ranged in diameter from 3 to 13 μm. Measurements of cell diameters from electron micrographs in which the stage of maturation could be easily determined validated the data obtained by light microscopy. These results also showed that the majority of the resident mast cell population in bone marrow is composed of immature cells, with an appreciable number of mature mast cells and relatively few very immature cells.
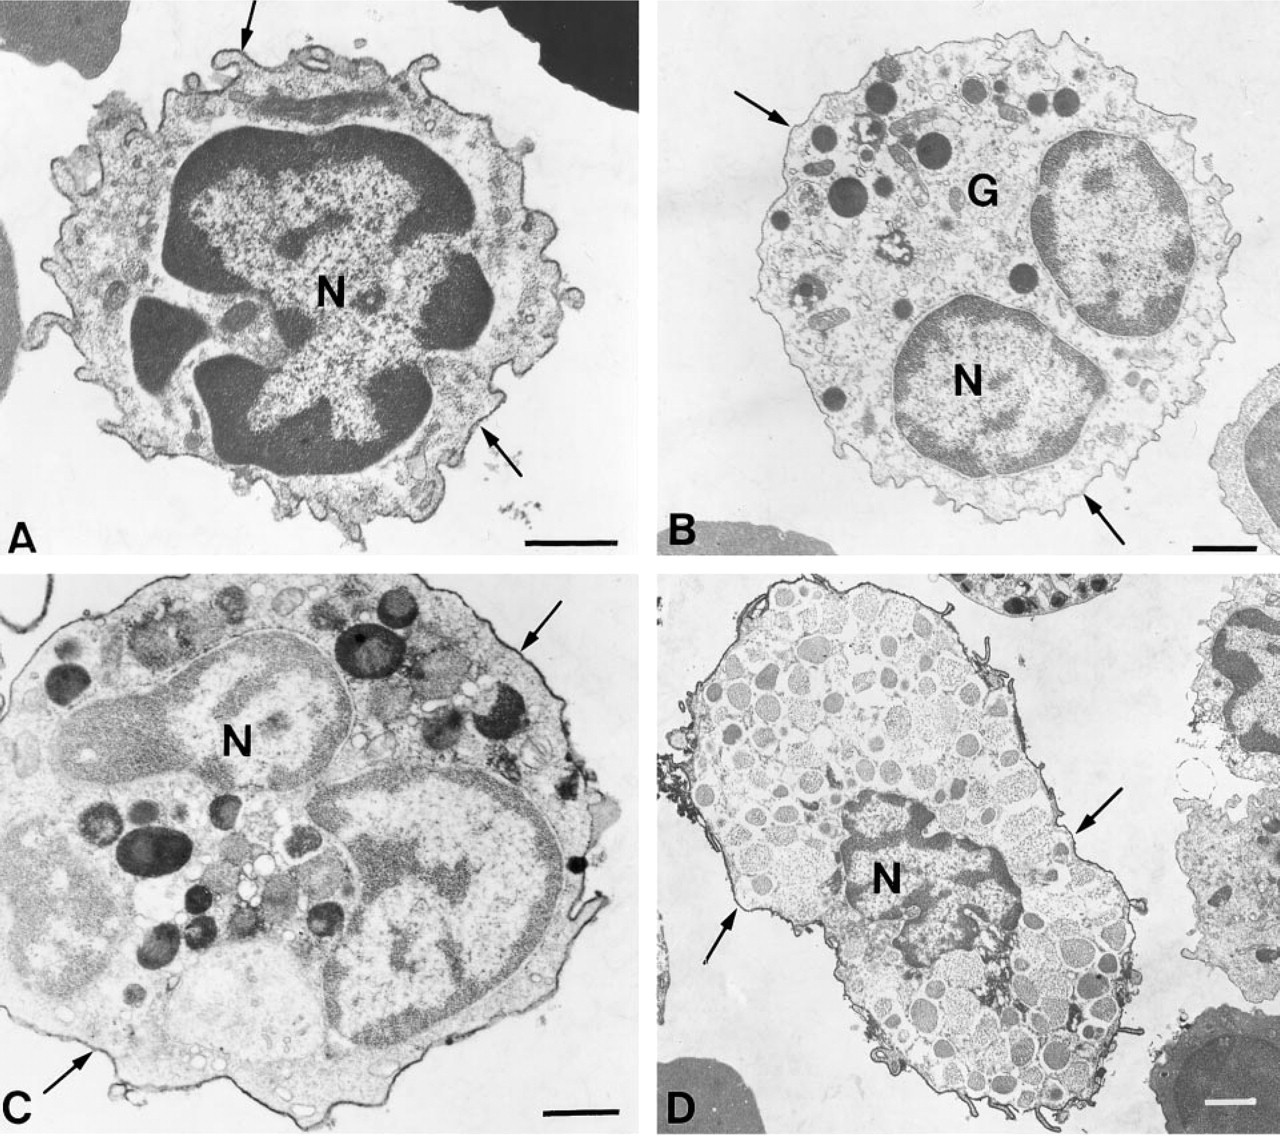
Very immature (
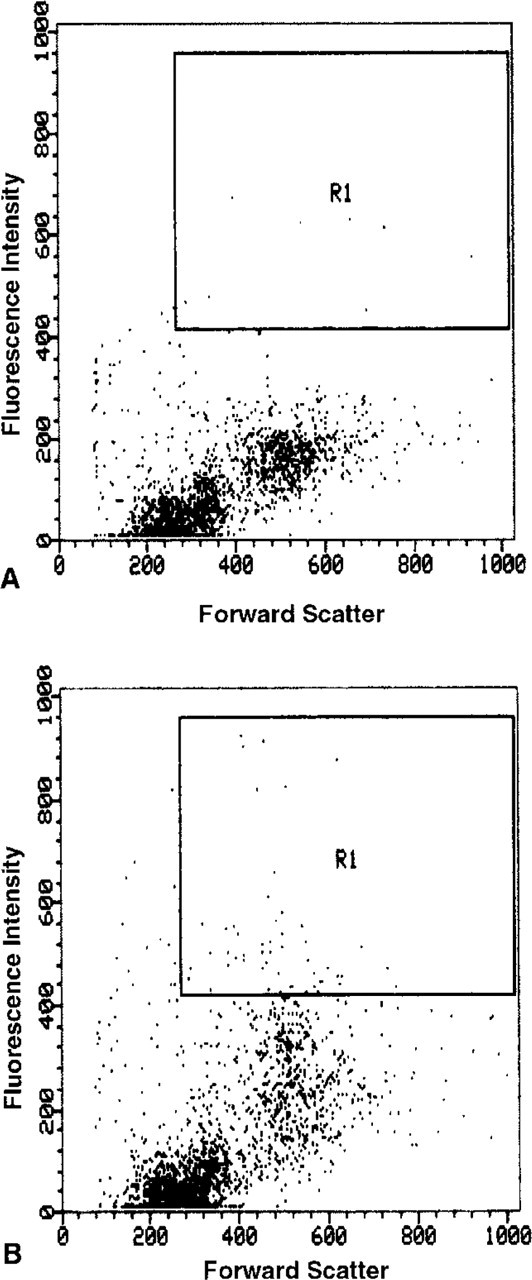
In this representative experiment from six experiments, 0.32% of the fluorescence measured (
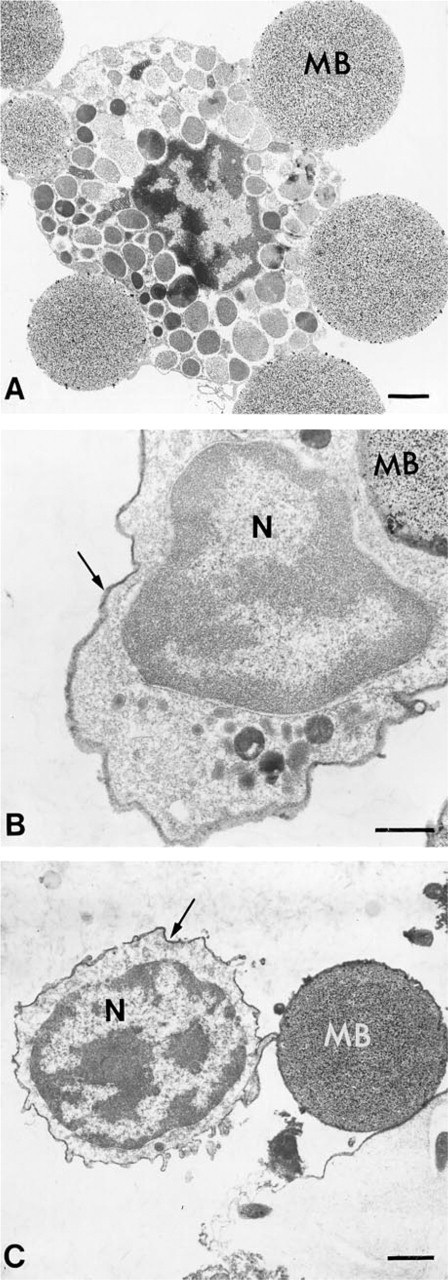
Mast cells in different stages of maturation were isolated from the bone marrow with magnetic beads conjugated with MAb AA4. Mature mast cells (
Surface phenotype of immunomagnetically isolated bone marrow-derived mast cells
The bone marrow-derived mast cells were also characterized as connective tissue-type mast cells by staining and PCR of the fractionated and unfractionated bone marrow. The bone marrow-derived mast cells stained positively with Toluidine Blue and were fluorescent with berberine sulfate (Figures 7A and 7B), a marker for connective tissue-type mast cells. Moreover, messenger RNA was present for both the α- and β-subunits of the high-affinity IgE receptor, rat mast cell proteases 1 and 5, and carboxypeptidase A (Figure 8) in the total bone marrow population. When the mast cells were immunomagnetically isolated, the amount of message was enriched.
Discussion
In this study, using MAb AA4 and a panel of other antibodies combined with electron microscopy, it was possible to demonstrate that mast cells can completely differentiate in the bone marrow into connective tissue-type mast cells. The stages of maturation seen here for bone marrow-derived mast cells are in agreement with those reported for other granulocytes from the bone marrow (Bainton and Farquhar 1968, 1970; Nichols et al. 1971; Nichols and Bainton 1973; Bentfeld–Barker and Bainton 1980).
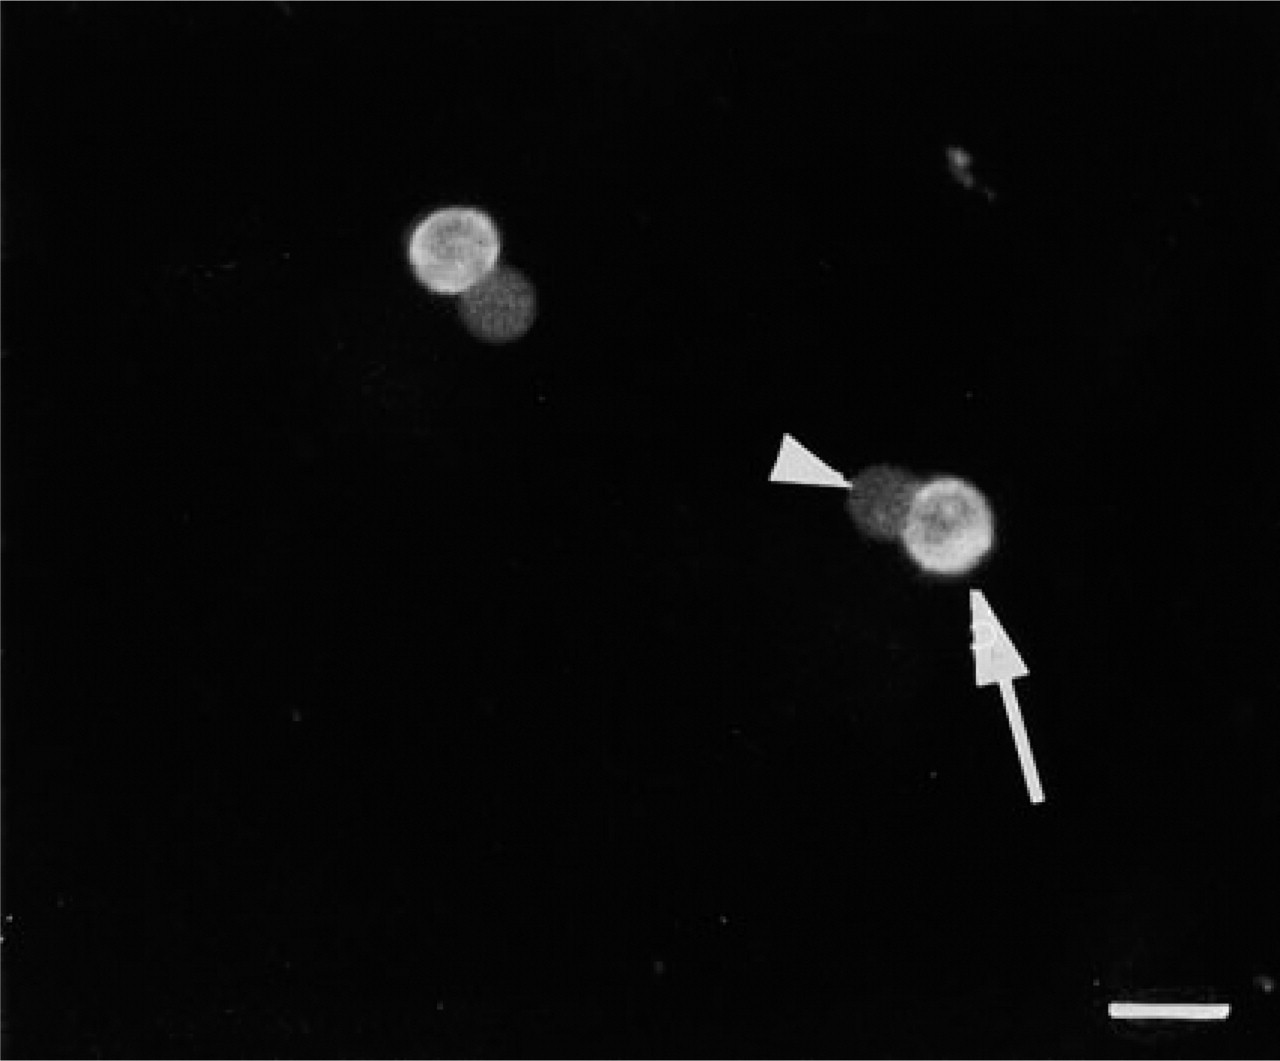
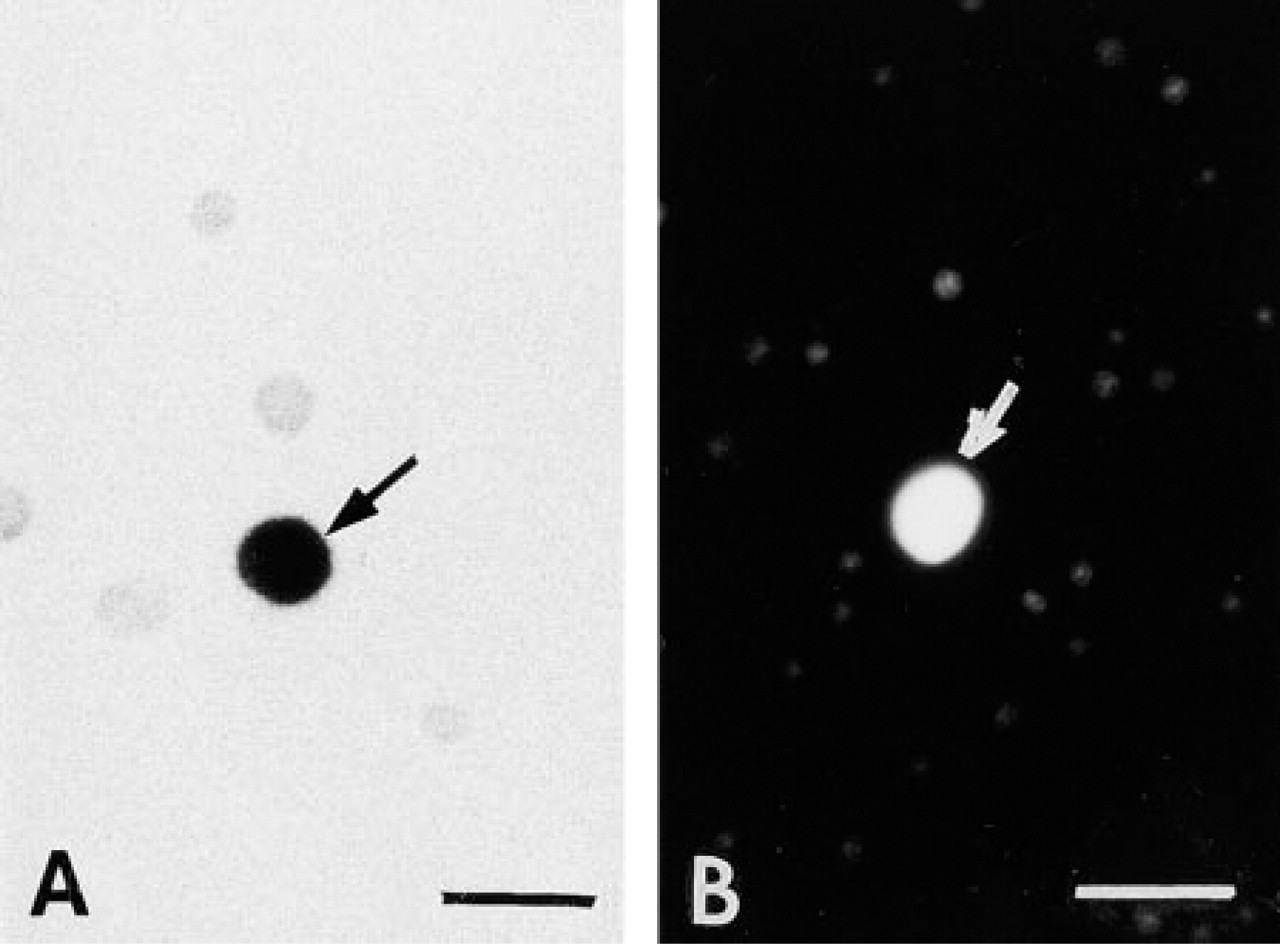
Mast cells isolated with MAb AA4-conjugated magnetic beads (arrowhead) immunostain positively for c-kit (arrow). Bar = 50 μm.
Analysis of cell size of bone marrow-derived mast cells a
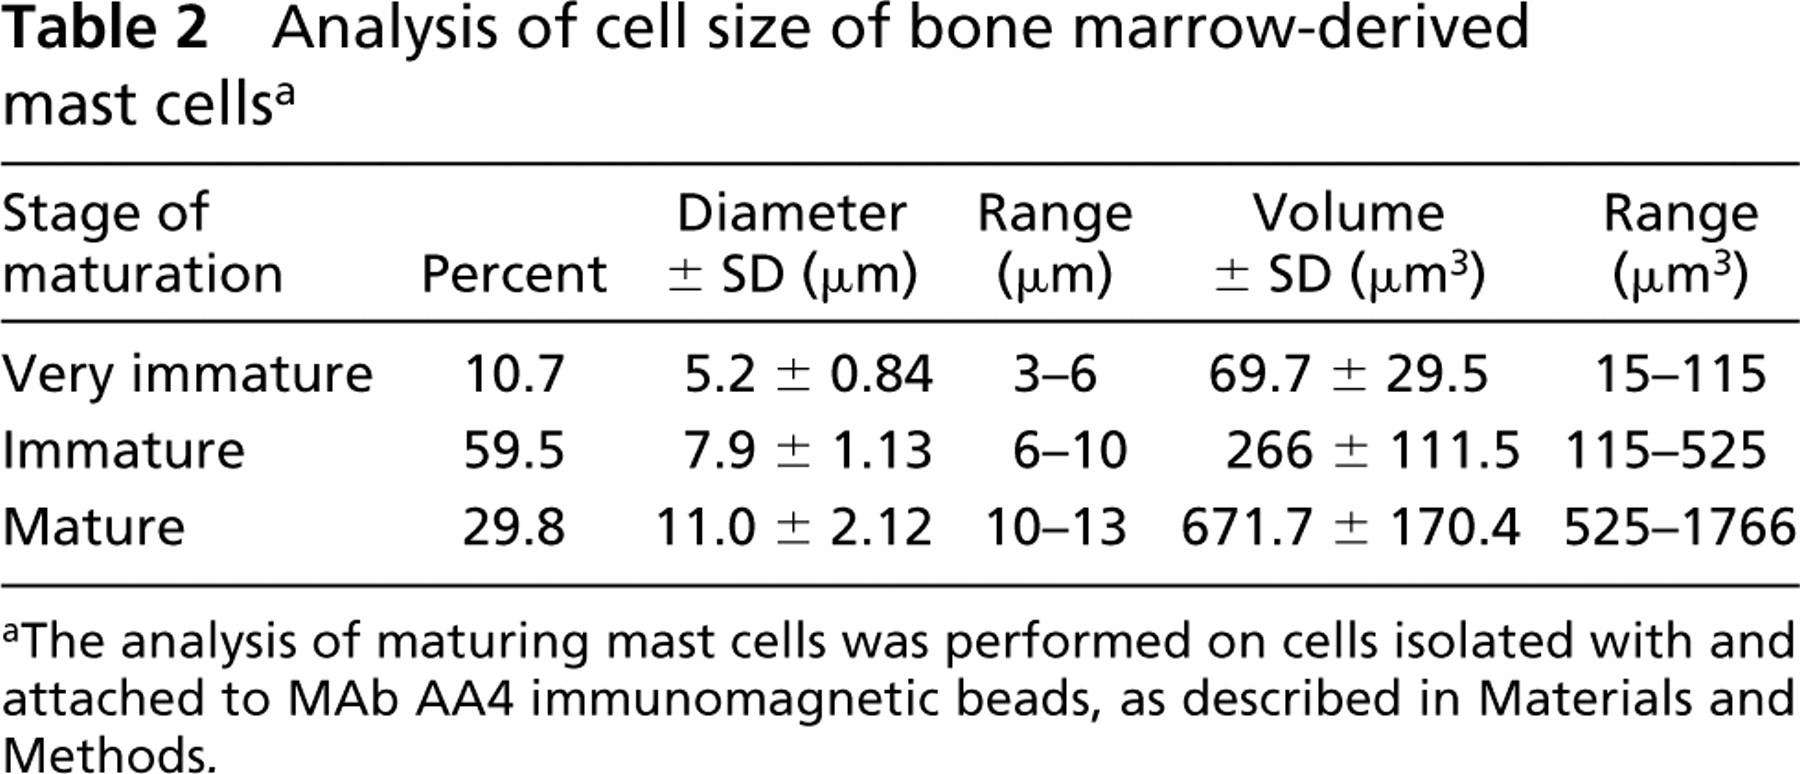
The analysis of maturing mast cells was performed on cells isolated with and attached to MAb AA4 immunomagnetic beads, as described in Materials and Methods.
Identification of mast cells in early stages of maturation, especially in vivo, has been limited (Dvorak 1991), and the process of mast cell differentiation and maturation is still poorly understood (Castells 1997). The majority of the studies to date on mast cell maturation have been done with experimental animal models (Fawcett 1955; Jamur et al. 1986; Mendonca et al. 1986), young animals (Yong et al. 1979), or by culturing blood or bone marrow in the presence of specific growth factors (Ginsburg and Lagunoff 1967; Rodewald et al. 1996; Metcalfe et al. 1997). Although the initial differentiation of mast cells from uncommitted progenitors is presumed to occur in the bone marrow, mast cell maturation has not been investigated in bone marrow (Kitamura et al. 1993, 1995; Huff et al. 1995; Lantz and Huff 1995). Our current investigation indicates that all of the factors necessary for mast cell maturation are present in the bone marrow.
Mature bone marrow-derived mast cells (arrows) are metachromatic after staining with Toluidine Blue (
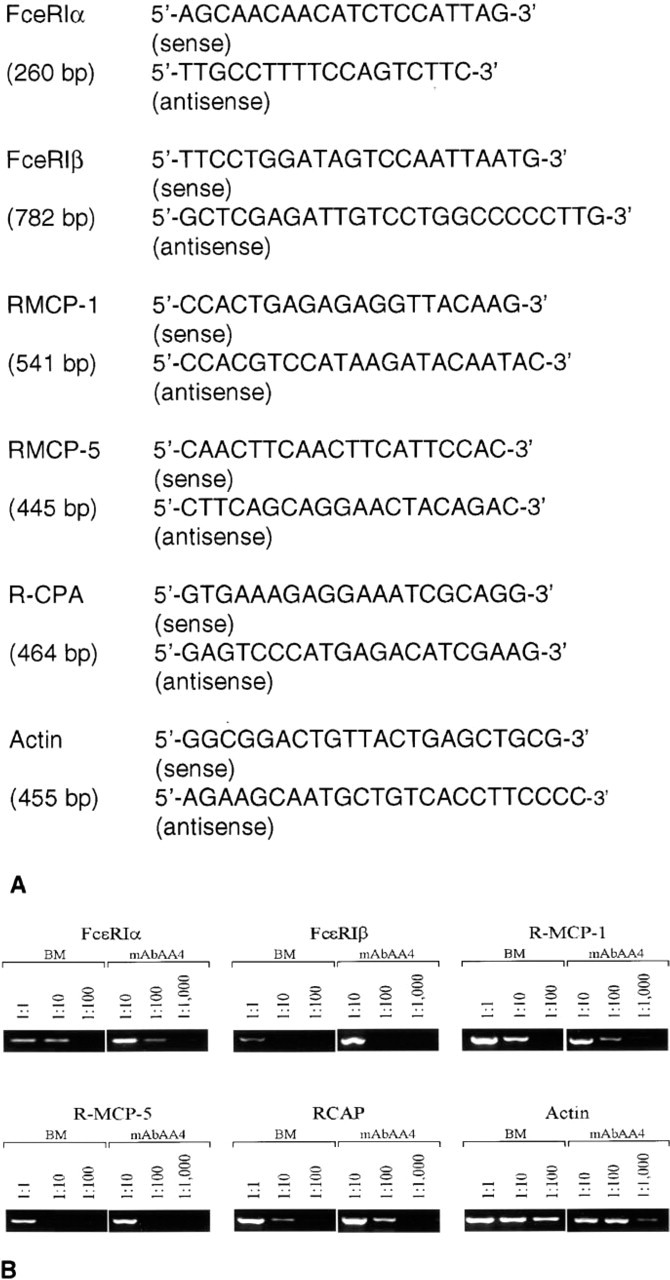
PCR analysis of mast cell molecules by semiquantitative RT-PCR. The cDNA prepared from the same numbers of either total bone bone marrow cells or cells bound to AA4 beads was serially diluted as indicated and amplified using the different sets of primers (
Previous studies of mast cell maturation have relied on the presence of granules or granule content to identify mast cell progenitors. However, cytoplasmic granules are not present in great enough numbers during the very early stages of maturation to permit their use for mast cell identification. A number of previous investigations have attempted to use antibodies to identify immature mast cells, but their usefulness has been limited because these antibodies were not mast cell-specific and recognized other cell types in the preparation (Katz et al. 1983; Rimmer et al. 1984; Odarjuk et al. 1989; Kinzer et al. 1995). By immunoelectron microscopy, it was possible to characterize a very immature mast cell containing only one or two small cytoplasmic granules but positive for both Fc∊RI and IgE. It is likely that these very immature cells represent committed rather than uncommitted mast cell progenitors, because even the most immature cells seen in this study already express Fc∊RI. The presence of Fc∊RI or IgE on the cell surface is a better indication that a progenitor cell has committed to differentiate than is the presence of cytoplasmic granules. The current study also indicates that the small lymphocyte-like cells previously reported to be mast cell precursors (Thompson et al. 1990; Ashman et al. 1991; Chen and Enerback 1994; Huff et al. 1995) might instead be very immature mast cells that are already committed. Furthermore, the use of granule content alone to identify immature mast cells can seriously underestimate the number of immature mast cells because none of the very immature mast cells would be identified. This could be a potential problem in the diagnosis of conditions, such as mastocytosis, that involve abnormal mast cell proliferation (Valent et al. 1999). The inability to fully delineate the entire population of mast cells involved in the disease may have consequences for the treatment of this disorder. The same also holds true for the role of mast cells in neurological disorders, such as multiple sclerosis and Guillain–Barre syndrome (Dines and Powell 1997; Secor et al. 2000). Therefore, the mast cell-specific antibodies may represent valuable new tools to study the process of mast cell proliferation and differentiation in normal and disease states.
Footnotes
Acknowledgments
Supported in part by the Conselho Nacional de Desenvolvimento Científico e Tecnológico (CNPq) and by Fundação de Amparo á Pesquisa do Estado de São Paulo (FAPESP). Ana Cristina G. Grodzki is the recipient of a FAPESP fellowship and Luciana de Fátima C. de Mello and Maria Veronica D. Pastor are recipients of CAPES fellowships.
We wish to thank Maria Tereza Picinoto Maglia and José Augusto Maulin for technical assistance, Ana Carolina J. Dubas for help with the morphometry, Neal J. Hardegen and Alexandra Rosa Vieira Dias for assistance with the FACS analysis, and Linda Bowers for preparation of the micrographs.