
Abstract
Signal amplification techniques greatly enhance the sensitivity of immunohistochemical (IHC) and in situ hybridization (ISH) methods. In particular, catalyzed signal amplification (CSA) using labeled tyramide or Nanogold–silver staining is an important signal amplification tool. We have applied a combination of both techniques, as has been introduced for ISH, for a further increase in sensitivity of an IHC method to detect cathepsin B. This lysosomal proteinase can also be expressed extracellularly, particularly in relation to cancer metastasis. Higher sensitivity of the IHC method was needed because existing methods failed to demonstrate cathepsin B protein where cathepsin B activity was found with a fluorescence enzyme histochemical method. Combined CSA and Nanogold–silver staining provided the sensitivity that was required. Moreover, this signal amplification method enabled the use of a 10-fold lower concentration of primary antibody (1 μg/ml). Nonspecific background staining was low provided that endogenous biotin, avidin, and peroxidase were completely blocked. The method was reproducible when all steps, and particularly the silver enhancement step, were rigidly controlled. The method resulted in localization patterns of cathepsin B protein that were in agreement with those of cathepsin B activity in serial sections of rat liver containing colon cancer metastases. We concluded that combined application of CSA and Nanogold–silver staining provides high sensitivity for immunohistochemical methods and that activity localization by an enzyme histochemical method is a very attractive alternative to IHC localization of an enzyme because it is at least as sensitive, it is rapid and simple, and it provides direct information on the function of an enzyme.
Keywords
T
Recently, we compared localization patterns of protein and activity of cathepsin B, a lysosomal proteinase, during cancer progression in human colon (Hazen et al. in press). Cathepsin B is frequently found extracellularly in relationship to cancer metastasis (Sloane et al. 1986; Van Noorden et al. 1998a; Frosch et al. 1999). A puzzling issue was that activity was found regularly in tissue compartments that showed hardly any cathepsin B protein with standard IHC methods. Therefore, either the method to localize activity was nonspecific and proteinases other than cathepsin B were also generating fluorescent reaction product, or the IHC method that had been applied was not sensitive enough to show molecules of low abundance. Because the enzyme histochemical method to detect cathepsin B activity has been rigidly validated (Van Noorden et al. 1987, 1989), we were convinced that activities of other proteinases were not likely to be involved. Therefore, we decided to compare directly localization patterns of cathepsin B protein as obtained with various signal amplification techniques with activity staining patterns in serial cryostat sections, to establish the most sensitive and specific IHC method. We performed this semiquantitative comparative study on rat livers containing colon cancer metastases. Liver parenchyma usually produces higher background levels than other tissues due to high endogenous biotin, avidin, and peroxidase levels (Speel 1999). Therefore, sections containing liver tissue, connective tissue (stroma), and colon cancer (Figure 1) constitute a good model to test the sensitivity and specificity of localization methods. It appeared that the combination of CSA and Nanogold–silver staining for protein localization provided a good correlation with activity localization patterns. Until now, this combination has been used only for highly sensitive ISH of single or low-abundance copies of foreign nucleic acid sequences (e.g., viruses) or mRNAs in cells (Hacker et al. 1996, 1997; Zehbe et al. 1997; Hacker 1998).
Materials and Methods
Cancer Cells and Induction of Liver Metastases
A colon adenocarcinoma cell line, CC531s, was obtained from a moderately differentiated and weakly immunogenic colon adenocarcinoma after experimental induction in Wag–Rij rats by treatment with 1,2-dimethylhydrazine (Marquet et al. 1984). Cells were cultured in vitro at 37C as monolayers in Dulbecco's modified Eagle's medium (ICN Biomedicals; Irvine, Ayrshire, UK) supplemented with 10% (v/v) fetal bovine serum, 2 mmol/liter glutamine, 100 IU/ml penicillin, and 100 μg/ml streptomycin. Cells were washed with PBS and, after detachment with 0.05% trypsin in PBS and centrifugation (250 × g, room temperature, 10 min), single-cell suspensions were obtained with a viability of at least 95%. After anesthesia with 0.07 ml/10 g body weight of a fentanyl–fluanizone–midazolam mixture [1 ml Hypnorm (Janssen; Beerse, Belgium), 1 ml midazolam (Roche; Mijdrecht, The Netherlands), and 2 ml water], colon carcinoma metastasis was induced in livers of six mature female Wag–Rij rats weighing 130–150 g (Broekman; Someren, The Netherlands) by injection of single-cell suspensions containing 1 × 10⁵ cancer cells into the portal vein, as described previously (Smorenburg et al. 1999). To prevent peritoneal seeding, the puncture site was covered with Spongostan (Medical Workshop; Groningen, The Netherlands) until complete hemostasis was obtained.
Preparation of Liver Tissue Sections
Livers were removed immediately after sacrifice at 3 weeks after administration of the cancer cells and the individual liver lobes were divided and cut into small pieces (up to 5 mm thick). The pieces of liver that contained macroscopically visible metastases were frozen in liquid nitrogen and stored at −80C until further use. Sections (10 μm thick) were cut on a motor-driven cryostat with a rotary retracting microtome (5000 M; Microm, Walldorf, Germany) at a constant speed and a cabinet temperature of −25C. Sections were mounted on glass slides coated with Biobond (Electron Microscopy Sciences; Ft Washington, PA) and stored at −20C until use.
Immunohistochemical Procedures
Cryostat sections were taken from the −20C storage cabinet and were immediately fixed in 3.7% paraformaldehyde (20 ml) supplemented with 100% acetic acid (10 ml) and 100% ethanol (17 ml) at 4C for 15 min. Sections were pretreated for IHC assays after fixation by rinsing for 5 min in 0.05 mM Tris buffer, pH 7.6, containing 0.5 M NaCl and for 5 min in distilled water. Then sections were incubated in Lugol's solution for 5 min, which was followed by two rinses in distilled water, 5 min each, in 2.5% Na2S2O3 for 3 min, in tapwater for 5 min, and finally twice in rinsing buffer that contained 0.05 M Tris, pH 7.6, 0.5 M NaCl, and 0.5% Tween-20. To determine optimal dilution of primary antibody, we used concentrations of 10, 1, 0.1, and 0.01 μg/ml. For comparative studies of the various detection systems, we consistently used a concentration of 10 μg/ml of rabbit anti-rat cathepsin B (dilution 1:100; Upstate Biotechnology, Lake Placid, NY). Control incubations were performed by omitting the primary antibody or by replacing the rabbit anti-cathepsin B antibody by an irrelevant antibody, rabbit anti-salmon vitellogenin (BN-5; Biosense, Bergen, Norway) in the same dilution.
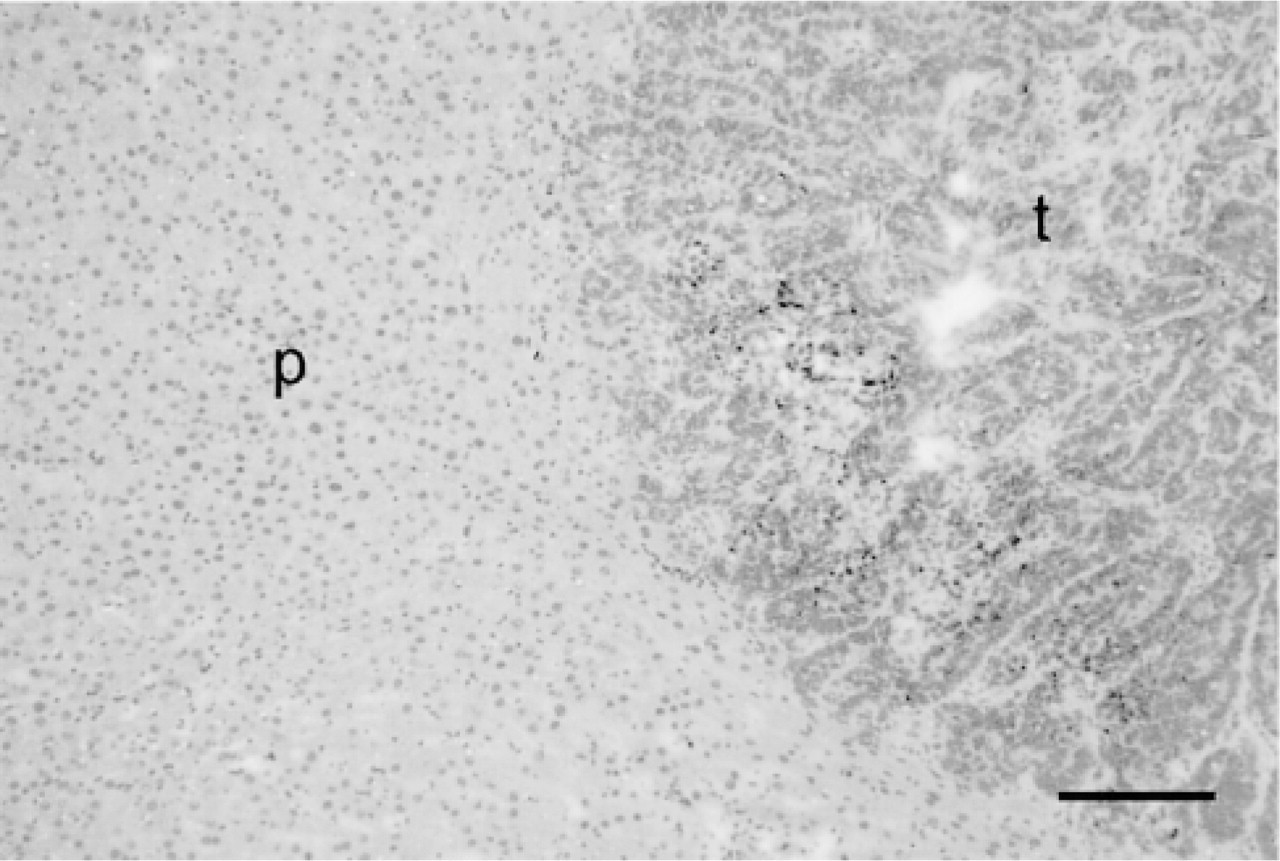
Rat liver containing a colon cancer metastasis. p, parenchyma; t, tumor. Hematoxylin-eosin. Bar = 100 μm.
Nanogold–Silver Staining Method. The Nanogold–silver staining method was performed according to Danscher and Nörgaard (1983). Blocking of nonspecific binding was performed in 0.05 M Tris buffer, pH 7.6, containing 3% fatty free milk powder, 0.1% fish gelatin, and 0.05% saponin (TMGS buffer) for 20 min at 20C. Incubation with rabbit anti-rat cathepsin B in TMGS buffer was performed at 4C overnight. After incubation, sections were rinsed three times for 5 min at 20C in rinsing buffer. Then sections were incubated with the secondary goat anti-rabbit antibody conjugated with 1.4-nm gold (Nanogold; Hainfeld and Furuja 1992) diluted 1:30 in TMGS buffer for 1 hr at 20C. Sections were rinsed three times for 5 min in distilled water at 20C. Postfixation of the immunocomplex was performed in 2% glutaraldehyde dissolved in 0.05 M Tris buffer, pH 7.6, for 15 min at 20C. Sections were rinsed three times for 5 min in distilled water at 20C. Silver enhancement was performed for 9 min in the dark at 20C exactly in 10 ml freshly prepared silver solution that contained 2 ml 1 M citric acid buffer, pH 3.7, 3.3 ml of a 50% (v/v) gum arabic solution in distilled water, 1.5 ml distilled water containing 0.09 g hydroquinone, 1.5 ml distilled water containing 0.019 g silver lactate, and 1.7 ml distilled water. After silver enhancement, sections were rinsed twice for 5 min at 20C in distilled water and for 3 min in 2.5% Na2S2O3 in distilled water, then three times for 5 min in distilled water. Counterstaining was performed in Gill's hematoxylin for 1 min and in eosin for 30 sec before mounting in Euparal.
Avidin–Biotin Complex with Diaminobenzidine (ABC–DAB). Blocking of endogenous biotin was performed with avidin (Dako; Glostrup, Denmark) for 20 min at 20C. Sections were rinsed three times for 5 min in rinsing buffer. Blocking of endogenous avidin was performed with biotin (Dako) for 20 min at 20C and sections were rinsed three times for 5 min in rinsing buffer. Blocking of endogenous peroxidase was performed in 3% H2O2 in distilled water for 20 min at 20C. Sections were rinsed three times in rinsing buffer for 5 min at 20C. Blocking of nonspecific binding was performed in TMGS buffer at 20C for 20 min.
Incubation with rabbit anti-rat cathepsin B was performed in TMGS in buffer at 4C overnight. After incubation, sections were rinsed three times for 5 min in rinsing buffer. Then sections were incubated with the secondary biotinylated goat anti-rabbit antibody (Dako) diluted 1:300 in TMGS buffer for 30 min at 20C. Sections were rinsed three times in rinsing buffer for 5 min at 20C. Incubation with avidin–biotin complex (ABC system; Dako) was performed in a solution that was made up by adding 40 μl of streptavidin in PBS and 40 μl of biotin conjugated to horseradish peroxidase in PBS to 5 ml diluent for 30 min at 20C. Sections were rinsed in rinsing buffer for 5 min at 20C. Then sections were incubated in a solution of DAB and H2O2 (Dako) for 5 min at 20C. Sections were rinsed three times in distilled water for 5 min at 20C. Counterstaining was performed in Gill's hematoxylin for 1 min before mounting in Euparal.
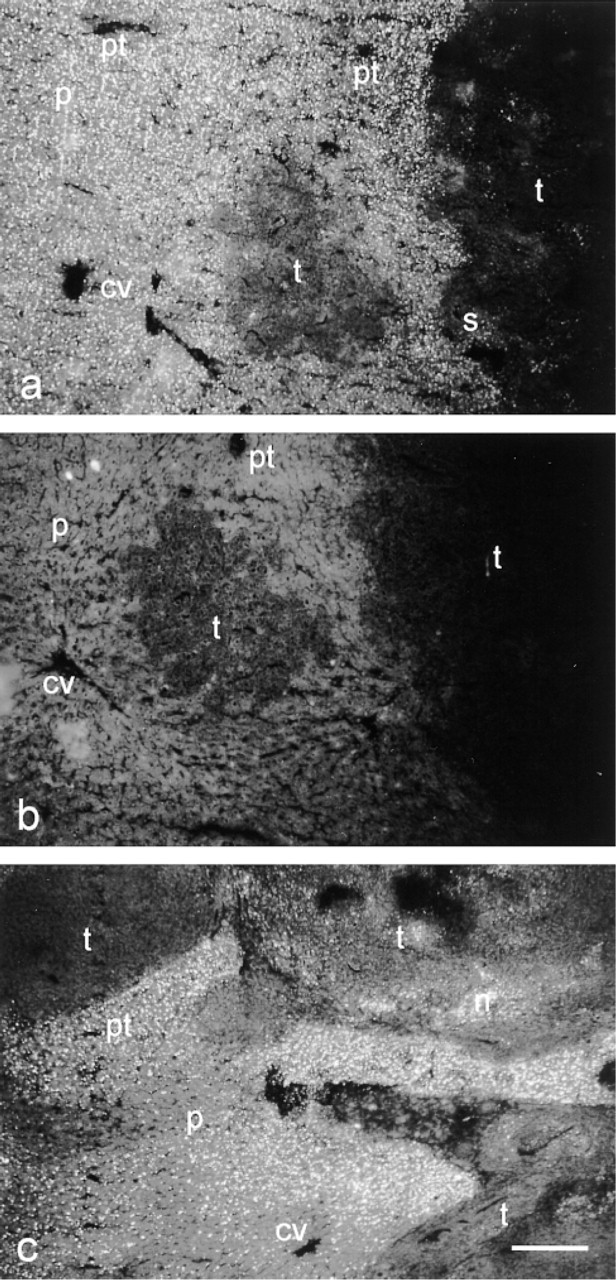
Localization pattern of cathepsin B activity in rat liver containing colon cancer metastases, showing activity as granular yellow fluorescent final reaction product against a nonspecific green fluorescent background. (
Catalyzed Signal Amplification with DAB (CSA–DAB). Sections were processed exactly as described for the ABC–DAB method up to the rinsing steps after incubation with the ABC complex. Then sections were incubated with biotinylated tyramide (Dako) for 15 min at 20C. Sections were rinsed three times in rinsing buffer for 5 min at 20C. Sections were incubated in streptavidin-peroxidase conjugate (Dako) for 60 min at 20C and rinsed three times in rinsing buffer for 5 min at 20C. Then sections were incubated with DAB and H2O2, rinsed, counterstained, and mounted as described in the ABC–DAB method. In some cases, 6 mg/ml ammonium-nickel sulfate was added to the DAB–H2O2 solution as recommended by Punnonen et al. (1999). The solution was filtered when cloudy.
Catalyzed Signal Amplification (CSA) with Nanogold-Silver Staining. Sections were processed exactly as described in the CSA-DAB method up to the rinsing steps after the incubation with biotinylated tyramide. Then sections were incubated with streptavidin conjugated with 1.4-nm Nanogold diluted 1:60 in TMGS buffer for 60 min at 20C. Then sections were treated as described in the Nanogold–silver staining method from the rinsing steps after incubations with the secondary goat anti-rabbit antibody.
Microphotographs of polymerized DAB and counter-staining were made with an Axioskop microscope (Zeiss; Oberkochen, Germany) and either a × 10 objective or a ×40 water-immersion objective. Microphotographs of Nanogold-silver were made with the same microscope using epipolarized light.
Areas in sections positive for Nanogold–silver were determined with the use of image analysis. A 3-chip CCD color video camera (Sony; ATV Horn, Aalen, Germany) was attached to the microscope and coupled via a frame grabber (maximal size 786 × 512 pixels) to an image analysis system with a KS 300 software package (Kontron; Eching, Germany). The camera signal and set-up were adjusted according to the recommendations of Chieco et al. (1994) and Jonker et al. (1997). Tissue sections were viewed with either epipolarized light and a ×40 water-immersion objective for visualization of Nanogold–silver or with light of 480 nm for DAB and white light for DAB-Ni, a stabilized power supply, and an infrared blocking filter. Positive areas were determined using a set threshold value and were expressed as percentage (%) of the total tissue compartment.
Enzyme Histochemistry
The incubation medium to demonstrate cathepsin B activity consisted of 100 mM phosphate buffer (pH 6.0), 1.3 mM EDTA (disodium salt), 1 mM dithiothreitol, 2.67 mM
Results
Serial sections were used to compare sensitivity and specificity of the immunohistochemical and enzyme histochemical methods to detect protein and activity of cathepsin B in rat liver containing colon cancer metastasis. Activity was localized as yellow fluorescent granules against a green fluorescent background after an incubation period of 15 min at RT (Figure 2). Activity in liver parenchyma was distributed heterogeneously. Parenchymal cells around central veins (pericentral areas) contained lower activity than the remainder of the lobuli in all animals tested (Figure 2a and 2c). The reaction was considered to be specific because control reactions in the presence of the selective cathepsin B inhibitor Z-Phe-Arg-FMK completely inhibited the reaction (Figure 2b). Tumors contained hardly any activity except for necrotic areas, where a rather high activity was found, and stroma that contained some activity (Figure 2a and 2c).
Immunolocalization with a 1:100 dilution of the primary anti-rat cathepsin B antibody demonstrated that the traditional Nanogold–silver staining (Figure 3a) and ABC–DAB methods with or without Ni-enhancement yielded hardly any positivity (Table 1). When CSA was included in the reaction, the sensitivity increased up to 10-fold (Table 1). Positivity was found in liver parenchyma, tumors, and particularly in necrotic areas (Figure 3b and 3c). The reaction was specific because sections incubated with the irrelevant primary antibody against salmon vitellogenin were virtually unstained (not shown). Only a small amount of polymerized DAB was found in necrotic areas after control incubation. Ni-enhancement made the brown DAB precipitate black but it did not increase sensitivity (Figure 3b and 3c; Table 1). However, the combination of CSA and Nanogold–silver staining greatly increased sensitivity, whereas control reactions did not yield more product (Figures 3d–3f; Table 1). In fact, 10 μg/ml primary antibody produced far too much signal for exact localization of cathepsin B protein (Figure 4a). Parenchyma was homogeneously and strongly positive, whereas tumors showed distinct protein labeling, particularly in stroma and necrotic areas. Tenfold dilution of the primary antibody (1 μg/ml) improved localization considerably (Figure 4b; Table 2). We found that a concentration of 1 μg/ml of the primary antibody gave the best results that were in agreement with localization patterns of activity of cathepsin B (cf. Figures 2 and 4b). Higher dilutions of the primary antibody (concentrations of 0.1 μg/ml and 0.01 μg/ml) resulted in too little signal to show cathepsin B protein in sites where cathepsin B activity was present (Figure 4c). Again, the control reaction in the absence of primary antibody produced low amounts of staining (Figure 4d; Table 2). Similar results were obtained when the primary antibody was replaced by the irrelevant antibody.
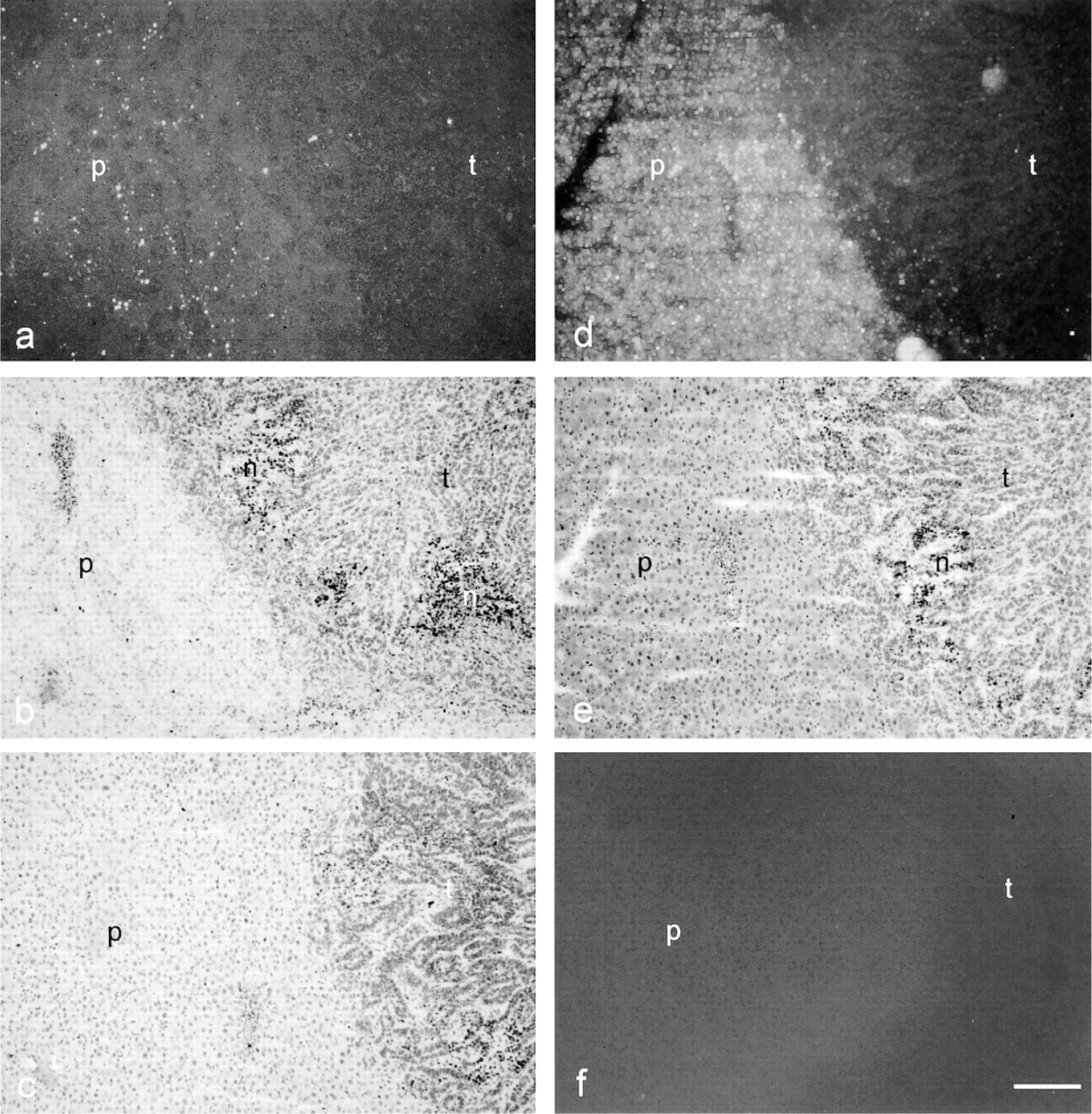
Localization patterns of cathepsin B protein in rat liver containing a colon cancer metastasis, as detected immunohistochemically with 10 μg/ml anti-cathepsin B antibody and various amplification methods. (
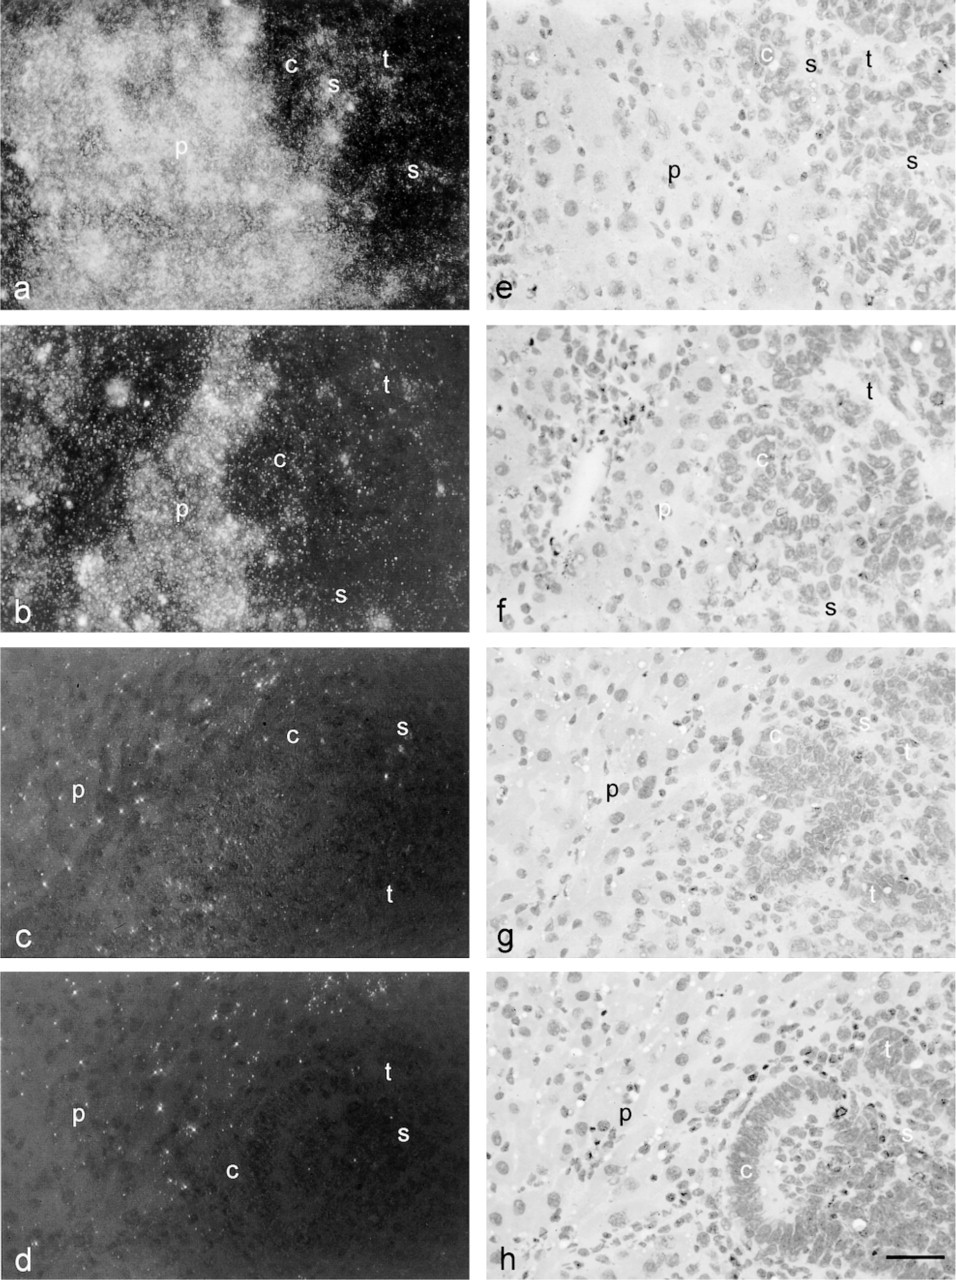
Localization patterns at higher magnification of cathepsin B protein in rat liver containing a colon cancer metastasis, as detected immunohistochemically with CSA amplification and Nanogold–silver staining using different concentrations of the primary anti-cathepsin B antibody. (
Semiquantitative comparison of various signal amplification techniques in the immunohistochemical method for localization of cathepsin B in different tissue compartments of rat liver containing colon cancer metastasis
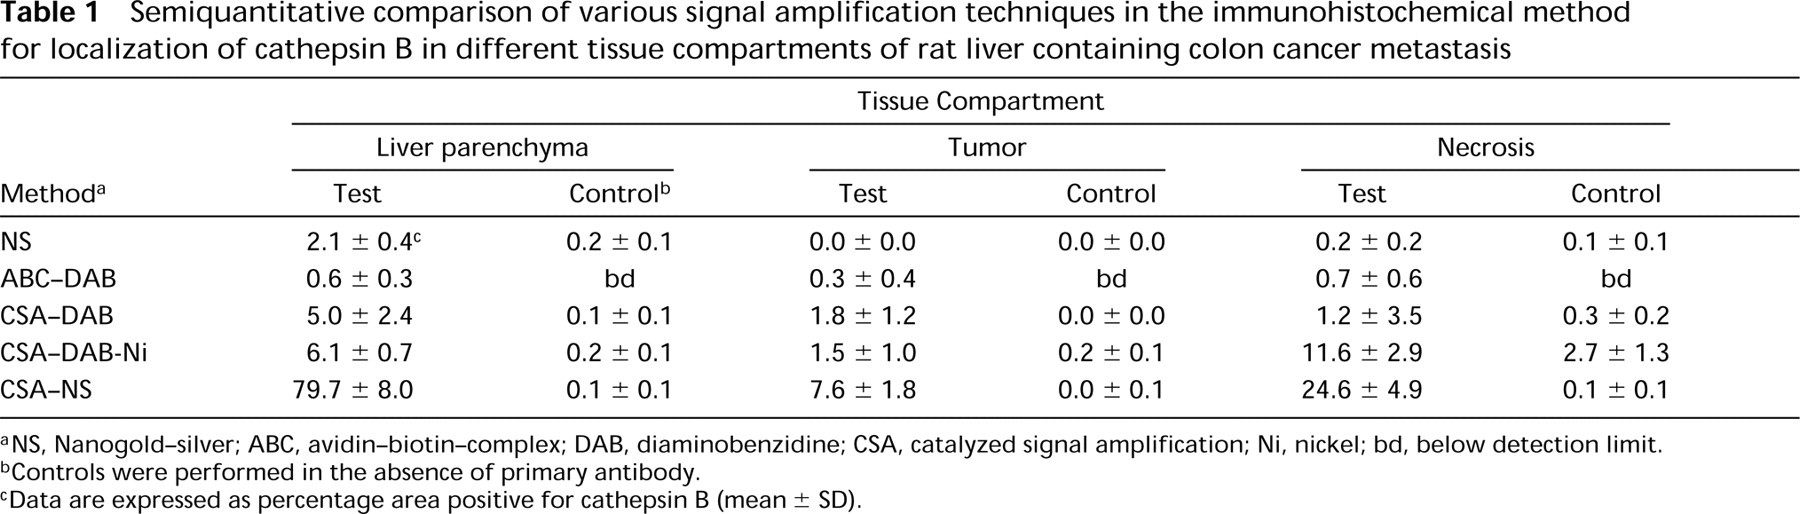
aNS, Nanogold–silver; ABC, avidin–biotin–complex; DAB, diaminobenzidine; CSA, catalyzed signal amplification; Ni, nickel; bd, below detection limit.
bControls were performed in the absence of primary antibody.
cData are expressed as percentage area positive for cathepsin B (mean ± SD).
Reproducibility of amplification with CSA and Nanogold–silver staining was very high (Table 3), provided that each step in the procedure was carefully controlled and standardized. In particular, the silver enhancement step appeared to be highly variable with temperature, period of incubation, and pH.
When 1 μg/ml of the primary antibody and the combination of CSA and Nanogold–silver staining were used, the following localization pattern of cathepsin B protein in rat liver containing colon cancer metastasis was found. Liver parenchyma contained homogeneously distributed high levels of cathepsin B protein, whereas the tumors contained low levels that were particularly localized in necrotic areas and stroma (Figure 4b).
Discussion
The present study clearly indicates that combination of two amplification systems, i.e., the tyramide-dependent CSA method and the Nanogold–silver staining method as introduced by Hacker and co-workers in ISH (Hacker et al. 1996, 1997; Zehbe et al. 1997; Hacker 1998), enables localization of a relatively low-abundance protein, such as cathepsin B, with an IHC method. Whereas activity localization with the use of N-CBZ-Ala-Arg-Arg-MNA and nitrosalicylaldehyde appeared to be highly sensitive, this was not the case for immunolocalization of cathepsin B. To our surprise, we were not able to localize cathepsin B protein with any of the existing methods in such a way that protein could be demonstrated where we found activity (Figure 2). Only the combination of CSA and Nanogold–silver staining provided such a high level of signal that the cathepsin B protein localization pattern was in agreement with the activity pattern. However, signal amplification was then far too strong for proper localization (Figure 4a). Therefore, we tested a series of dilutions of the primary antibody (Von Wasielewski et al. 1997; Van de Corput et al. 1998; Mengel et al. 1999; Speel 1999; Speel et al. 1999). It appeared that a further 10-fold dilution of the primary antibody to a concentration of 1 μg/ml gave a satisfactory localization pattern that was in agreement with the activity staining pattern (Figure 4b). Therefore, in addition to the high sensitivity of the combination of CSA and Nanogold–silver staining, it has also a financial advantage because higher dilutions of the primary antibody can be used. Despite the rigorous blocking steps that were carried out, we could not always prevent some background staining in liver tissue owing to the high levels of endogenous biotin, avidin, and/or peroxidase. Tumor tissue was completely negative when an irrelevant antibody was used as primary antibody.
Semiquantitative comparison of various concentrations of the primary antibody in the immunohistochemical method using CSA and Nanogold–silver staining for localization of cathepsin B in different tissue compartments of rat liver containing colon cancer metastasis
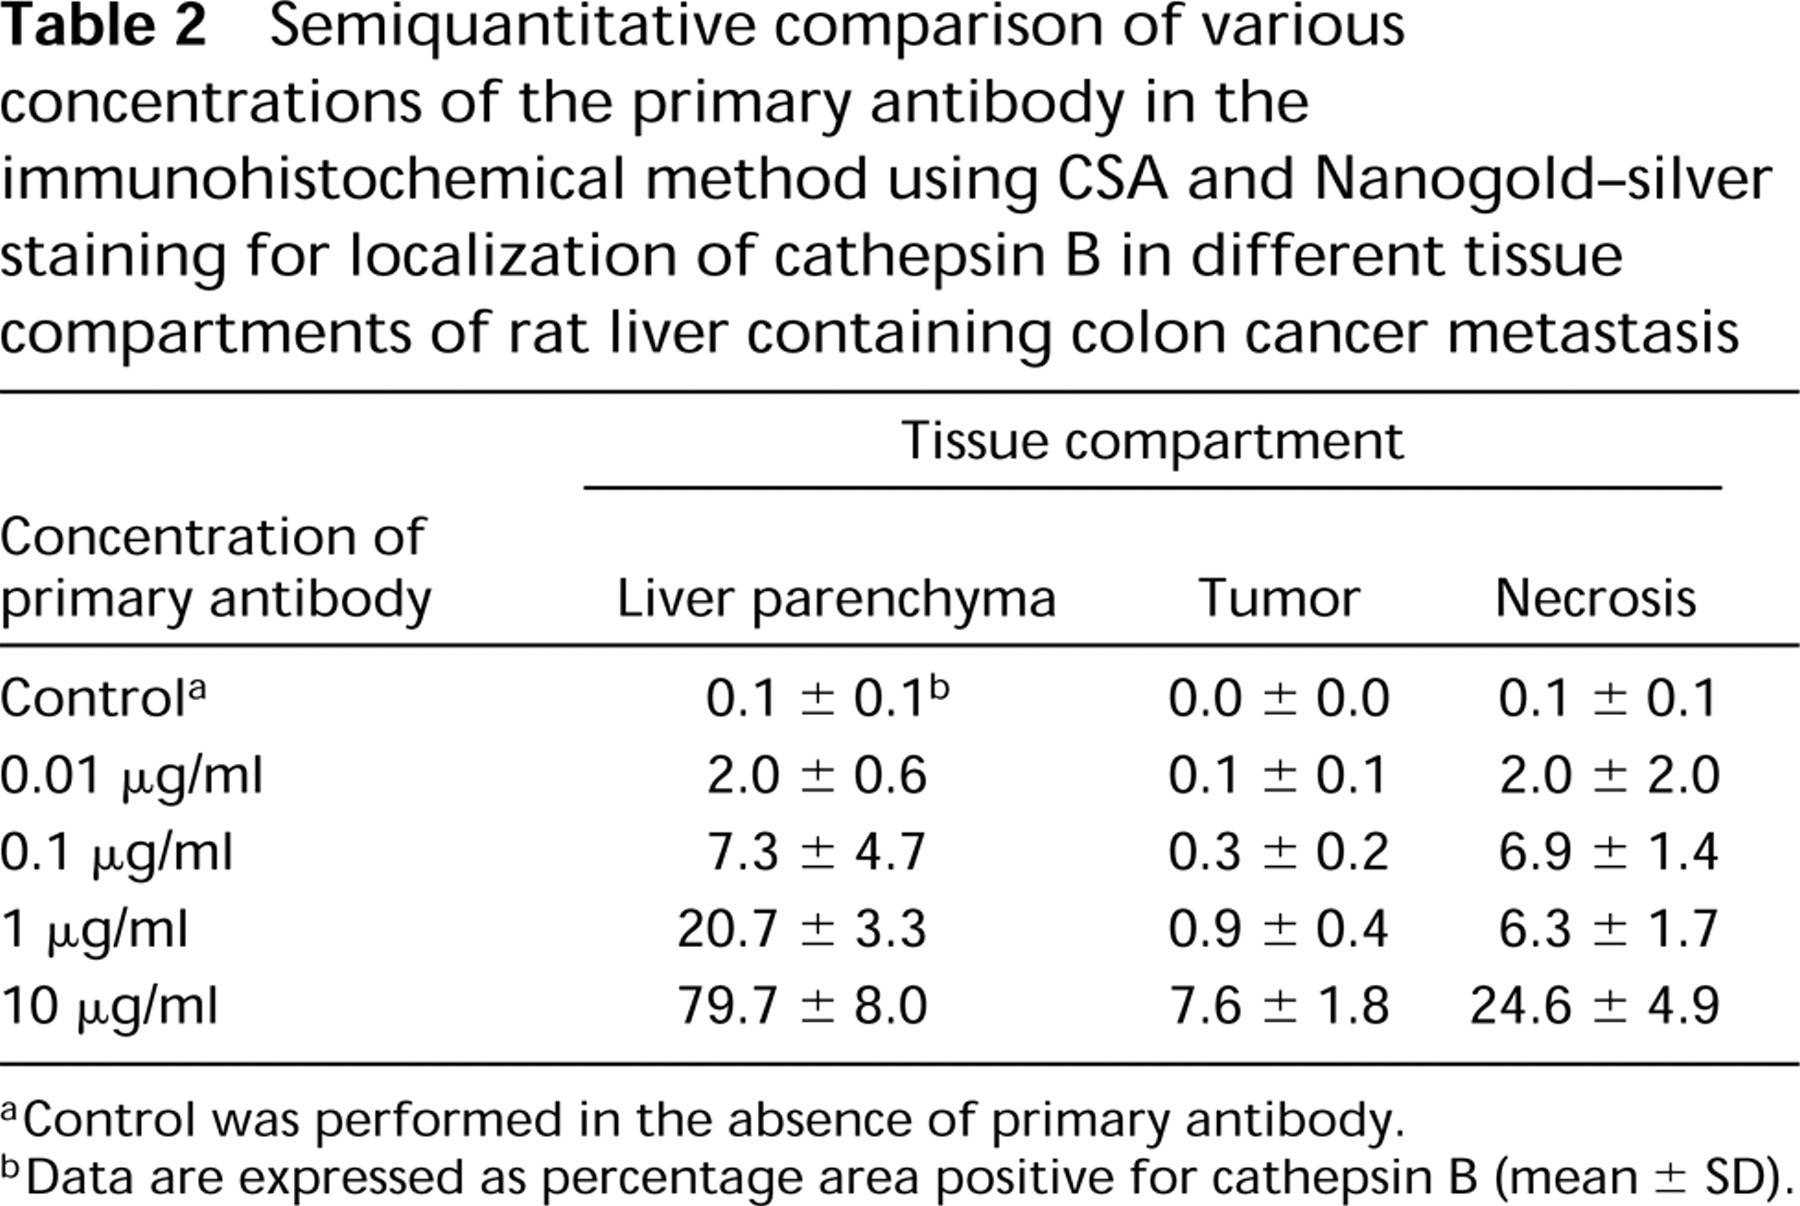
aControl was performed in the absence of primary antibody.
bData are expressed as percentage area positive for cathepsin B (mean ± SD).
Semiquantitative determination of the reproducibility of the combination of CSA and Nanogold–silver staining in the immunohistochemical method for localization of cathepsin B in different tissue compartments of rat liver containing colon cancer metastasis which was performed on 3 different days
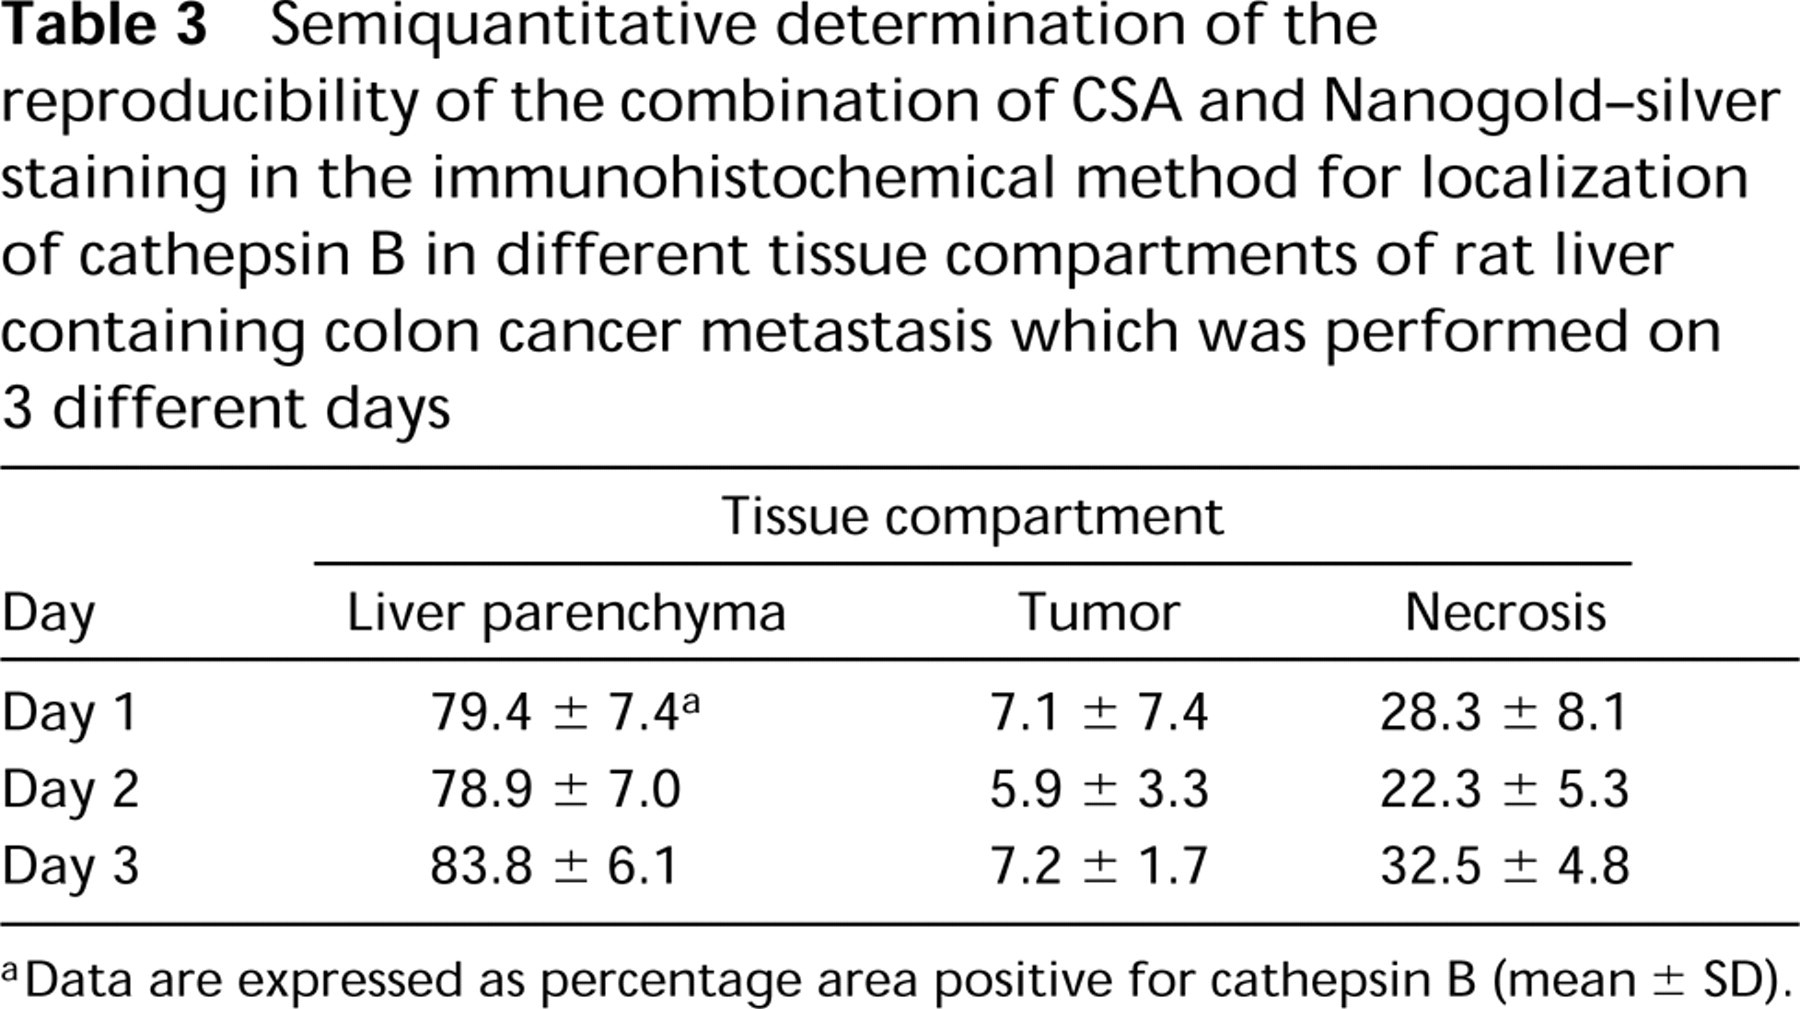
aData are expressed as percentage area positive for cathepsin B (mean ± SD).
An alternative for biotin is dioxygenin, as was suggested by Speel (1999), to further reduce nonspecific staining. Nevertheless, nonspecific background reaction was so minute in comparison to the specific cathepsin B signal that we did not have any difficulty in establishing which cells and tissues were positive for cathepsin B and which were not.
It must be stressed that every step in the staining procedure has to be carefully controlled to obtain low background levels and reproducibility. This is inherent to the enormous amplification of signal in the method, thus also of nonspecific signals (Speel 1999; Speel et al. 1999). In particular, the silver enhancement step appeared to be a major factor in causing lack of reproducibility. Slight variations in temperature or time of incubation and, to a lesser extent, pH resulted in major differences in the outcome of the assay. Therefore, we controlled the silver enhancement step rigidly.
Localization of cathepsin B protein and activity was largely similar in rat livers containing colon cancer metastases except for pericentral areas. Cathepsin B protein was homogeneously localized in liver parenchyma, whereas activity was distinctly lower in pericentral areas than in periportal areas. These lower levels of cathepsin B activity in pericentral areas were the only sign of cathepsin B in inactive form, be it as (pre)proform or bound to endogenous inhibitor(s) (Van Noorden et al. 1998b; Frosch et al. 1999).
In conclusion, signal amplification with the combined use of CSA and Nanogold–silver staining is a specific and highly sensitive technique for immunohistochemistry as it is for in situ hybridization (Hacker 1998). It provided localization patterns of cathepsin B protein that were similar to localization patterns of cathepsin B activity as obtained with a fluorescent enzyme histochemical method. Our findings stress the high sensitivity of enzyme histochemical methods compared with immunohistochemical methods. Because enzyme histochemical methods are cheap, easy to perform, and rapid, we advocate activity localization when enzymes are studied. Moreover, activity studies provide information on functions of enzymes, unlike immunohistochemical methods, which usually localize enzymes in both active and inactive forms.