
Abstract
The atomic force microscope (AFM) (Binnig et al. 1986) has become a very versatile technique for measuring the minute forces involved in nanoscopic systems. Until now, a large variety of forces have been measured for physical, chemical, and biological systems using an AFM. Van der Waals, hydration, and electrostatic interaction (Weisenhorn et al. 1989, 1992; Leng and Williams 1993; Manne and Gaub 1995) and the elastic or friction properties of surfaces have all been successfully measured (Erlandsson et al. 1988; Marti et al. 1992; Hoh and Engel 1993; Radmacher et al. 1994). Forces acting between specific chemical groups (Frisbie et al. 1994a) and covalent forces between a tip and a surface (Jarvis et al. 1997; Grandbois et al. 1999) have also been investigated. Moreover, forces associated with single molecular recognition events were recently measured for several biological systems (Florin et al. 1994; Lee et al. 1994; Moy et al. 1994; Dammer et al. 1995; Hinterdorfer et al. 1996; Ros et al. 1998; Yip et al. 1998). In atomic force microscopy, the image formation is based on the possibility of scanning a surface and probing locally, with high precision, the forces acting between the tip and the sample. When imaged with the AFM, a sample is touched with an atomically sharp tip mounted at the end of a very soft cantilever. The sample is scanned with the help of an xyz piezo translator and the force is measured through the deflection of the cantilever. In principle, all of the forces cited above can be used to generate the contrast required for imaging a surface. Electrostatic forces (Rotsch and Radmacher 1997), chemical forces (Frisbie et al. 1994b), friction forces (Moiseev et al. 1991), and elastic (Radmacher et al. 1996) properties have been used to image chemical or biological samples. Recently, molecular recognition forces between the biotin-streptavidin pair (Ludwig et al. 1997) or antibody-antigen (Hinterdorfer et al. 1996) enabled imaging of artificially patterned surfaces. In these experiments, it was possible to discriminate between regions functionalized with streptavidin or with intercellular adhesion molecule-1 (ICAM-1).
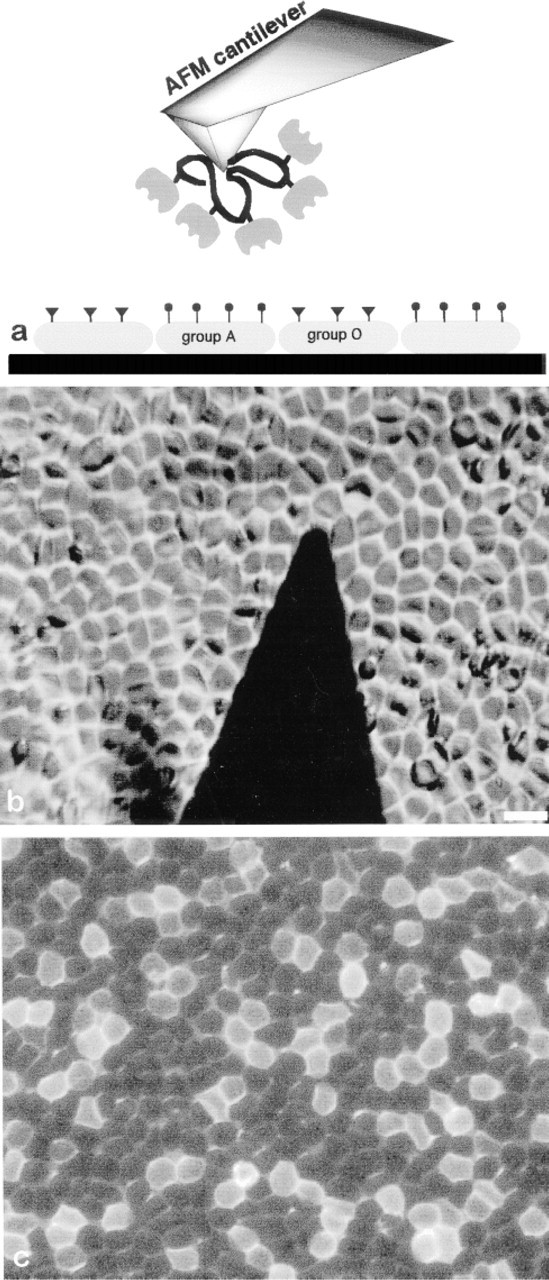
The cell glycocalix located at the external membrane side of eucaryotic cells is basically composed of glycosylated molecules. This external sugar envelope contributes to the steric repulsion that prevents undesirable nonspecific cell-cell adhesion (Bongrand et al. 1994). More specifically, the glycolipids or glycoproteins present in the glycocalix may also act as intermediates in recognition processes (Weis and McConnell 1982; Weis and Drickamer 1996; Feizi 1998). These interactions are mediated by a family of receptor proteins called lectins (Gabius and Gabius 1997). Helix pomatia lectin (HPL) is a lectin that binds specifically to the N-acetylgalactosamine (galNAc)-terminated glycolipids present at the surface of the group A red blood cells (RBCs) (Torres and Smith 1988; Torres et al. 1988). In this study we used HPL-functionalized AFM tips to image a mixed-group A and O RBC layer adsorbed on a flat solid surface (see Figure 1a). The affinity image was generated by measuring the adhesion force between the lectin-functionalized AFM tip and the RBC for each pixel of the image following the method proposed by Cleveland et al. (1994). The specific interaction between the HPL-functionalized tip and the group A RBCs, but not with the group O RBCs, enabled us to discriminate between the two cell groups. The lectin was tethered to the tip of an AFM cantilever by using a polymer spacer as suggested by Hinterdorfer et al. (1996). Such a protocol provides motility of the anchored protein and allows discrimination between the undesirable nonspecific adsorption and the specific unbinding events.
Materials and Methods
Surface and Tip Preparation
Here we used carboxymethylated amylose for the lectin immobilization on the AFM tip. This protocol was very similar to the one used in the protein immobilization technique developed by Johnsson et al. (1991) for surface plasmon studies with the Biacore system. The AFM tips were functionalized in the following way. First, the Si-OH layer of the standard commercially available Si3N4 cantilever (Microlever; Park Scientific Instruments, Sunnyvale, CA) was silanized with N'-(3-(trimethoxysilyl)-propyl)-diethylentriamin; Aldrich, Milwaukee, WI) to obtain an amino-functionalized surface. A PBS (pH 7.4) solution of 10 mg/ml of carboxymethylamylose (Sigma; St Louis, MO) was activated with 20 mg/ml N-hydroxysuccinimide (NHS; Aldrich) and 50 mg/ml 1-ethyl-3-(3-dimethylaminopropyl) carbodiimide) (EDC; Sigma) for 5 min. The tip was then incubated with this NHS-activated amylose for 10 min and rinsed three times in PBS. It was then incubated with 0.5 mg/ml HPL (Sigma) in PBS, pH 7.4, for 2 hr and intensively rinsed to remove the unbound lectin. All the measurements were made in PBS, pH 7.4, at room temperature. The spring constant of the cantilever in each experiment was determined using the thermal noise technique reported earlier (Florin et al. 1995). The RBC layer was prepared as follows. Fresh human blood cells were rinsed four times in PBS, pH 7.4, to eliminate soluble glycoprotein present in the plasma. The RBC layer was prepared by incubating a polylysine-coated slide (Poly-prep; Sigma) for 30 min with a PBS solution of mixed (1:2) RBCs of group A and O. The cell surfaces were then gently rinsed with PBS to remove loosely attached cells. Figure 1b shows a typical image recorded with an inverted optical microscope mounted under the fluid cell of an AFM. This image shows the AFM cantilever standing over the densely packed RBC layer. As expected, it is impossible to distinguish between the RBC of group A and O on this image. The epifluorescence image shown in Figure 1c was obtained by incubating the RBC layer with a PBS solution of 20 ± fluorescein-labeled HPL (Sigma) for 15 min. The cell layer was then gently rinsed with PBS and the fluorescence image was recorded.
Adhesion and Height Image Acquisition
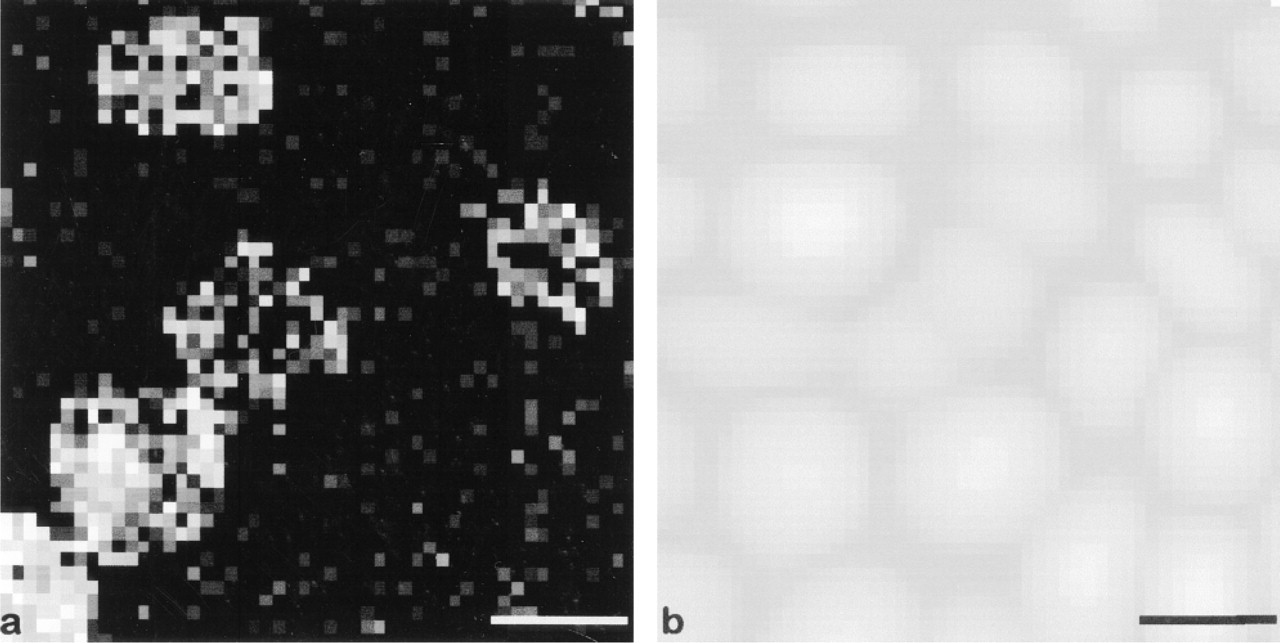
The adhesion image was obtained by first recording a two-dimensional array (55 × 55) of force vs extension curves over the RBC layer. A typical force vs extension curve is shown in Figure 2. The contact of the lectin-funtionalized AFM tip with the cell surface can be observed in the first part of the curve (Figure 2a). In Figure 2b, the bridge between the lectin and the AFM tip is stretched, producing a bending of the cantilever which can then be converted into force units (Newton). In Figure 2c one can observe the rupture of the molecular bridge. This bond rupture event could be assigned to the lectin-sugar molecular pair. In fact, all the other bonds in the bridge are of covalent nature and their rupture forces have been demonstrated to be at least one order of magnitude higher (Grandbois et al. 1999).The adhesion force for each image pixel (see Figure 2c) was then calculated from the last rupture peak of each retract curve and plotted in a gray scale in the adhesion image (Figure 3a). The non-adhesion events were plotted as black pixels. The height images were calculated from the piezo elongation at the contact point (Figure 3b). With this indentation into the cell, the probability of receptor-ligand binding was close to 1 on a group A RBC. For such height binding probability, we expect to observe multiple binding events for each approach. The cantilever retract speed was 6 ±/sec. The loading rates were calculated by taking the slope of the force vs elongation curves just before the rupture event. The mean loading rate was found to be close to 1 nN/sec. Under these conditions, the typical acquisition rate was 30 min per image.
Force vs Elongation Curves on Agarose Beads
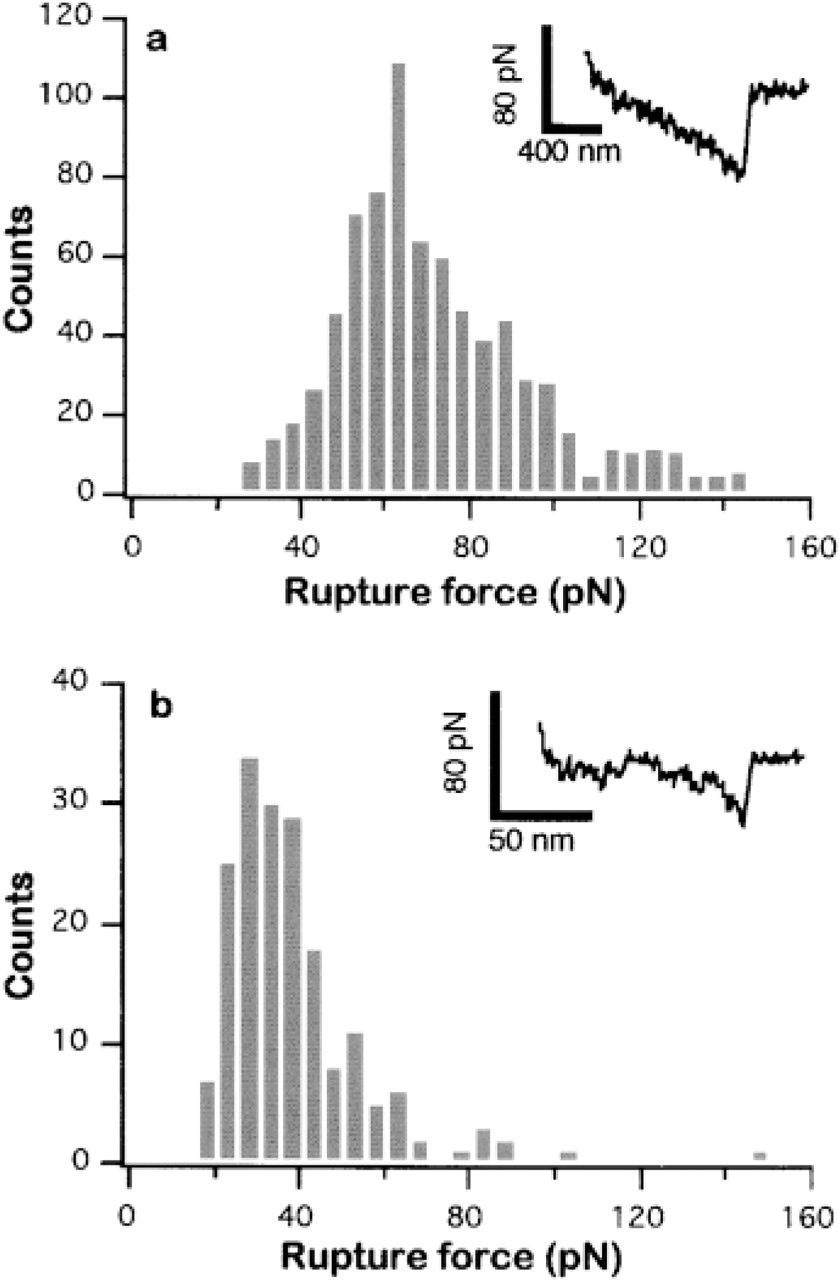
Force vs elongation curves were measured with HPL-functionalized tips and commercially available agarose beads functionalized with galNAc (Sigma). For each experiment, 4000 curves were recorded at a fixed position on one agarose bead. The adhesion force was measured for each force curve as for the RBCs and was plotted in a histogram (Figure 4). The indentation force was set to a constant value below 40 pN. The loading rate for each force curve was also 1 nN/sec. A blocking control experiment was performed by exchanging the PBS buffer of the AFM fluid cell with a PBS buffer containing 100 mM free N-acetyl-D-galactosamine.
Results and Discussion
The epifluorescence image in Figure 1c shows a typical mixed (1:2) group A and O RBC layer used for AFM affinity imaging. On this micrograph, the group A RBCs can be readily identified from their bright fluorescent appearance. The contrast between the two RBC groups was obtained by incubating the cell layer with a fluorescein-labeled HPL. The high binding specificity of that lectin for group A RBCs enables them to be distinguished in a mixed A and O cell layer. Such a technique is intensively used in histochemistry, where it is very useful for characterization of cell structures. However, this approach may be somewhat destructive because the receptors used for fluorescent contrast imaging are at least partly blocked after the labeling procedure.
(
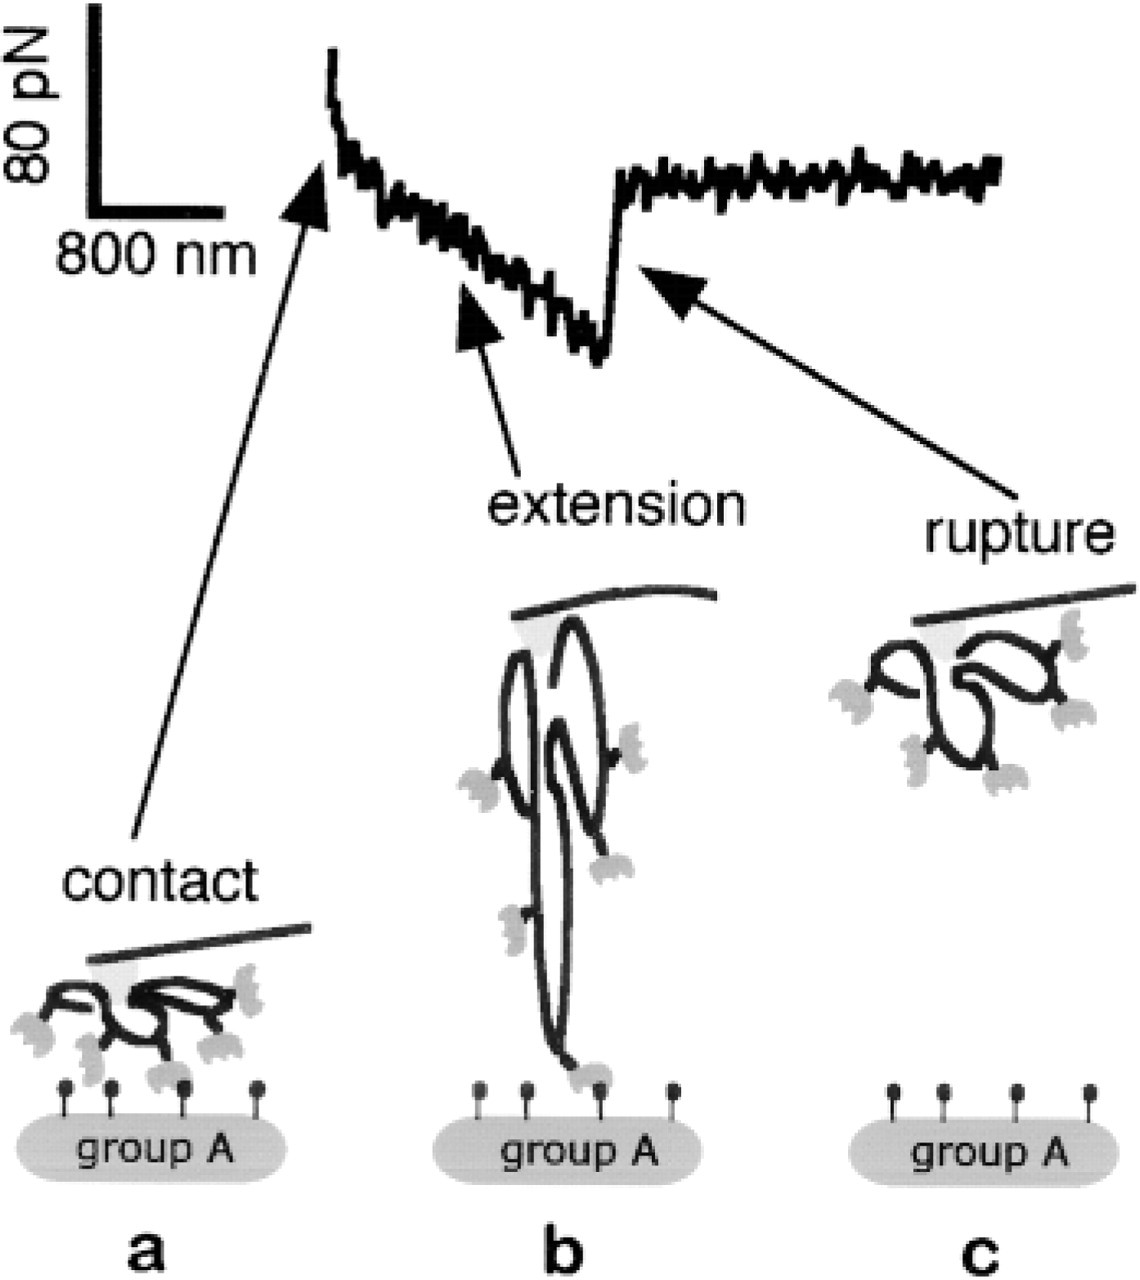
Typical force curve recorded on group A RBCs with an AFM tip functionalized with HPL. Rupture events, such as the one observed on the group A, were responsible for the contrast in the affinity image shown in Figure 4a. (
In Figure 3 the cell layer was affinity-mapped with an AFM tip functionalized with HPL. The adhesion image in Figure 3a shows several regions on the cell layer in which adhesion events are observed with a very high probability (see bright spots). The arrangement of these regions can be directly correlated to the presence of RBCs as observed on the topographic image (Figure 3b). Moreover, the ratio of bright cells seen on the affinity image (25%) corresponds very well to the number of group A RBCs present in the cell layer (33%). The small statistical discrepancy between these two values can be explained by the relatively small number of cells scanned in one image (24 cells). The distribution and number of group A RBCs also correspond very well to the one observed on the epifluorescence micrograph shown in Figure 1c. Hence, the affinity image clearly shows that it is possible to observe the receptors present at the surface of a given cell. On the affinity image, it is impossible to extract any information about the distribution of galNAc receptors on the surface of a single group A RBC. Because the lipid membrane receptors of the RBC are well known to be homogeneously distributed and free to diffuse in the experimental time scale, such local distribution was not expected.
(
The rupture forces for all the adhesion events observed in the affinity image (Figure 3a) were quantified and plotted in the histogram shown in Figure 4a. This histogram shows a distribution of the rupture forces between 30 and 140 pN, with a maximum centered at 65 pN. One should note here that the majority of the higher rupture force values were observed in the first force curves recorded on a group A RBC (see the bright cell in the left lower corner of Figure 3a). This effect is probably due to detachment of loosely attached lectin. In fact, after the initial measurement of some 50 adhesion events, the rupture forces are found to be close to the maximum at 65 pN. This maximal rupture force on cells compares very well to the rupture forces measured on agarose beads. The histogram in Figure 4b shows the rupture forces calculated from the force vs elongation curves measured on agarose beads functionalized with galNAc. For this experiment, the probability of observing a binding event was approximately 10%. Such a low probability makes it very likely to observe single binding-unbinding events. The maximum at 35 pN can therefore be attributed to the rupture of a single lectin-sugar pair. All together, the values measured on group A RBCs and on agarose beads strongly suggest that only a few pairs are required to produce the contrast necessary for affinity imaging.
The locus of failure of the lectin-sugar pair remains an open question in our measurements with RBCs. Indeed, the rupture of the lectin-glycolipid pair may occur at the receptor ligand binding site, or the membrane receptor may simply be extracted from the cell membrane like a carrot, as proposed in several previous studies (Bell 1978; Evans et al. 1991a,b; Leckband et al. 1995). The low force required to pull the lipid anchor of a specific receptor out of the membrane has been proposed as a potential limitation for affinity-imaging application. It is still unclear which of these two mechanisms was measured in our affinity image. Pulling the receptor out of the membrane may certainly contribute to the wearing out of the tip. However, the rather high off-rate (10−3 sec) of the galNAc group for the lectin, combined with the rather long acquisition time for one picture (30 min) may contribute to keeping the tip free of sugar membrane receptors. This possible wearing out of the tip was verified by recording 5000 force scans on the same single group A RBC. As for the affinity image, the probability of observing an adhesion event as well as the magnitude of the rupture force rapidly decreases for the first tens of force vs extension curves, reaching a steady state with binding probability still very close to 1. It is therefore possible to scan the same cell several thousands of force curves without observing any dramatic wearing out of the AFM tip.
(
Conclusions
We have demonstrated that it is possible to use specific affinity forces to image a biological relevant surface. It was possible to distinguish between RBC populations having different membrane receptors at their extracellular side. The quantitative analysis of the force curves recorded on RBC and on beads has shown that only a few lectin-sugar bonds were necessary to obtain contrast. Wearing out of the tip resulting from pulling the receptor out of the membrane may be an important limiting factor for cell surface imaging. It has been shown recently that a force of a few tens of pN is enough to extract the lipid moiety of a receptor from the membrane. In our case, this problem appeared to be circumvented by the high off-rate of the lectin-sugar pair. In that case, the AFM tip seems to be self-cleaned in the time scale of our experiment. Probing of cytoskeleton-anchored transmembrane receptors is believed to be less problematic because their extraction from the membrane is very unlikely. Affinity imaging by AFM has the potential to become a valuable tool for studying membrane receptor expression in cell tissues under different conditions and at different stages of development.
Footnotes
Acknowledgements
Acknowledgments
Supported by the Deutsche Forschungsgemeinschaft. MG is a recipient of a postdoctoral fellowship from the Canadian NSERC.