
Abstract
We developed a new quantitative histochemical method for mapping aggrecan content in articular cartilage and applied it to models of cartilage degradation. Ruthenium hexaammine trichloride (RHT) forms co-precipitates with aggrecan, the main proteoglycan component of cartilage, and was previously found to be a good fixative in aiding the maintenance of chondrocyte morphology. We show that these RHT-aggrecan precipitates generate a positive chemographic signal on autoradiographic emulsions, in the absence of any radioactivity in the tissue section, via a process similar to the autometallographic process used previously for localization of trace metals ions in tissues. By exploiting the inherent depth-dependence of aggrecan concentration in adult articular cartilage, we demonstrated that the density of silver grains produced by RHT-derived chemography on autoradiographic emulsions correlated with locally measured aggrecan concentration as determined by the dimethylmethylene blue assay of microdissected tissue from these different depths of cartilage. To explore the benefits of this new method in monitoring tissue degradation, cartilage explants were degraded during culture using interleukin-1 (IL-1) or digested after culture using chondroitinase and keratinase. The RHT chemographic signal derived from these samples, compared to controls, showed sensitivity to loss of aggrecan and distinguished cell-mediated loss (IL-1) from degradation due to addition of exogenous enzymes. The RHT-derived chemographic grain density represents an interesting new quantitative tool for histological analysis of cartilage in physiology and in arthritis.
Keywords
T
Histological localization methods, using immunological or genetic probes or stains, have proved to be highly useful in several studies of cartilage physiology but are usually qualitative in nature. In the area of cartilage physiology involving functional biomechanical properties of the tissue, there is also a need for spatially resolved quantitative characterization of tissue properties, motivating the development of quantitative histological methods. For example, a recently developed quantitative autoradiographic method for the spatial localization of aggrecan synthesis (Buschmann et al. 1996b) permitted the correlation of load-induced physical factors, such as cell structural changes and interstitial fluid flow, to alterations of aggrecan synthesis also induced by tissue loading (Buschmann et al. 1996a,1999; Quinn et al. 1998). In these studies, changes in aggrecan synthesis were spatially localized with the quantitative histological method and were compared to locally derived values of cell structure and other physical parameters that were also altered by tissue loading.
Our study describes another new method by which total glycosaminoglycan (GAG) concentration, essentially representing aggrecan, can be spatially mapped in tissue sections using techniques similar to those for the localization of PG synthesis by quantitative autoradiography. The method relies on the ability of ruthenium hexaammine trichloride (RHT) to bind to and thus retain aggrecan during fixation and to induce a positive chemographic signal when sections are processed for autoradiography. We quantified this RHT-derived chemographic grain density as a function of depth from the articular surface, using image analysis, and found that it correlated strongly with the colorimetric (DMB) evaluation of GAG (aggrecan) content in microdissected, papain-solubilized tissue from those regions. A high sensitivity of the RHT chemographic signal to tissue degradation was also found in cultured tissue explants treated with a cytokine or exogenous GAG-degrading enzymes.
Materials and Methods
Tissue Isolation for Cryosections and for Fixation in the Presence of RHT
Tissue isolation was similar to a previously described procedure (Buschmann et al. 1996b). Young (10-14-month-old) bovine humeral head articular cartilage, obtained from a local abattoir, was processed within 12-14 hr post exitus (joints being kept at 4C before use). The humeral shaft was mounted in a vise and the joint capsule opened with a scalpel. A wedge of cartilage/bone was cut with a bone saw from the periphery of the load-bearing area of the humeral cartilage and the bone saw was used again to produce a lateral cut into the bone, underneath the cartilage, from the base of the cut wedge. Twenty cartilage/bone cylinders, 4 mm in diameter, were excised from the load-bearing areas of two humeral heads using a hand-held orthopedic coring drill (Prototype; Straumann, Waldenburg, Switzerland). Each cartilage/ bone cylinder was liberated from the joint when the coring bit reached the bone saw cut made at ~6-10 mm below and parallel to the articular surface. The 20 cylinders were grouped into 10 matched pairs, in which the two cylinders in each pair originated from adjacent regions of one of the humeral heads. The cartilage/bone cylinders were then cut with a custom-built device (Buschmann et al. 1996b) to remove some of the bone. Within each pair, the cylinder destined for cryostat sectioning and the assay for GAG content was cut to obtain a total length of ~5 mm, of which ~1 mm was the entire layer of articular cartilage. The long bone portion (~4 mm long) of these cylinders was then embedded in Tissue-Tek and mounted in a cryostat with the cylinder axis vertical, perpendicular to the cryostat blade. The cartilage surface was punched with a dermal biopsy punch of internal diameter 3.75 mm. Then a series of ~30 circular frozen sections, 35 μm thick and 3.75 mm in diameter, were obtained by traversing the entire (~1-mm) thickness of the articular cartilage layer in 35-μm increments. Beginning with the first complete circular section, sections were placed in cryo-vials in groups of three. The tissue in each vial therefore represented a defined volume (π/4 × 3.752 × 3 × 0.035 = 1.16 μl) taken from tissue depths of approximately 50 μm plus increments of 105 μm, from the articular surface. The other cylinder within each pair was cut to a total length of ~1.5 mm and fixed in 10 ml of 0.05 M Na-cacodylate (820670 Merck; Dietikon, Switzerland) buffer containing 2% v/v glutaraldehyde (G002, Taab Lab Equipment; Fakola, Basel, Switzerland) and 0.7% w/v RHT (ruthenium hexaammine trichloride, 2340.0100 Merck) at room temperature for 16 hr. Nonchemographic control specimens were generated by fixing similar cartilage/bone disks in 10 ml of 0.05 M Na-cacodylate buffer containing 2% v/v glutaraldehyde and 2.5% w/v CPC (N-cetylpyridinium chloride, 2340.0100 Merck).
GAG Content vs Tissue Depth Using Dimethylmethylene Blue (DMB) Spectrophotometry of Solubilized Cryosections
Each group of three 35-μm-thick cryostat sections was digested in 0.5 ml of papain [0.125 mg/ml (Sigma, St Louis, MO) in 0.1 M Na2HPO4, 0.01 M Na2-EDTA, and 0.01 M L-cysteine-HCl, pH 6.5] for 16 hr at 60C. Duplicates of 5, 10, and 15 μl volumes of each digest were transferred to 96-well flat-bottomed microtiter plates (Flow Laboratories 76-381-04; Allschwil, Switzerland). A total of 250 μl of DMB dye solution [46 μM 1,9 dimethylmethylene blue chloride #03610 (Polysciences; Warrington, PA) in 0.04 M NaCl + 0.04 M L-glycine #4201.1000 (Merck) pH 3] was added to each well with a multipipette and the absorbance read at 530 nm within 1 min of adding the DMB solution (Farndale et al. 1986). Standards were included on each plate comprising 0-4-μl aliquots of a shark chondroitin sulfate stock solution (0.5 μg/μl; #C4384, Sigma) prepared in the same buffer (without cysteine) as the papain solution. Absorbance values of the digested tissue samples were converted to equivalent chondroitin sulfate concentration (mg/ml tissue volume) using second-order polynomial fits of the standard curves, the aliquot volumes of the samples (5, 10, 15 μl) and total digest (0.5 ml), and the original tissue volume of the samples (1.16 μl). Because GAG content varies widely with depth from the articular surface, selection of the sample aliquot volumes that fell into the linear part of the standard curve was required. In addition, the term “equivalent chondroitin sulfate concentration” is used throughout the text to refer to DMB-reactive material because other GAGs are also detected with this method and have different sensitivities from that of chondroitin sulfate, which was used as a standard (see Discussion).
Embedding, Sectioning, and Detection of RHT-derived Chemographic Signal Using Autoradiographic Emulsion, and Quantitation Using Computerized Image Analysis
Immediately after fixation (1 day post isolation), 1.5-mm-thick cartilage/bone disks were washed four times over 2 hr in 0.1 M Na-cacodylate buffer, pH 7.4, and transferred to 70% ethanol. Because we wished to measure the density of RHT-derived chemographic signal as a function of depth within cartilage explants, we obtained vertical sections along the axis of disks. The fixed disks were axially bisected with a razor blade. Disk halves were dehydrated in a graded series of ethanol concentrations (80, 90, 96, 100%) over a total period of 5 hr and were then placed once more in 100% ethanol overnight. On the second day after isolation, specimens were placed in 1,2 propylene oxide (PPO, Merck) for 1 hr and then embedded in EPON 812 (Flukka; Buchs, Switzerland) in the following stages: 1:3 EPON:PPO for 24 hr; 1:1 EPON:PPO with 0.6% v/v N-benzyldimethylamine (BDMA from Flukka) for 24 hr; 3:1 EPON:PPO with 0.6% BDMA for 3 days; pure EPON with 0.6% BDMA for 3 days; pure EPON with 1.2% BDMA for 5 days at 60C. Embedded disk halves were trimmed to remove most of the bone and semithin 1-μm sections, obtained with an ultramicrotome (Ultracut S; Leica, Vienna, Austria), were taken from the cut face of the disk halves and were therefore rectangular in shape, with a width equal to the disk diameter (~4 mm) and a height equal to the trimmed disk thickness (~1.2 mm). Sections were placed on gelatin-coated glass slides (Superfrost Plus; Menzel Glases, Haska, Bern, Switzerland).
To detect and quantify the RHT-derived chemographic signal, we followed in detail a procedure developed previously for quantitative autoradiographic analysis of sections of radiolabeled cartilage (Buschmann et al. 1996b). Slides containing the sections were dipped in Kodak NTB-2 emulsion, exposed for 1 week, developed, and fixed (see Buschmann et al. 1996b for detailed information on emulsion storage, dipping, development, and on the following grain-counting method). Sections were lightly stained with 0.008% toluidine blue in buffer (2% boric acid, 1% sodium tetraborate, pH 7.6) and viewed by light microscopy using a high-power (X100) oil immersion objective, and images were digitized and transferred to a personal computer via a CCD color camera. For each disk, a sequential series of 9-12 images (each image 125 μm wide × 80 μm high) spanning the depth of the articular cartilage layer at 105 μm vertical displacement increments was captured from a section. This vertical, or axial, series of images was centered at the radial center of the disk sections, and the center of the first image was positioned ~50 μm below the articular surface. The number of grains in each image was found by (a) thresholding the image on the blue channel to isolate silver grains, (b) determining the average area of a single grain in the image using the lowest section of the histogram of grain size, and (c) dividing total grain area by the average size of a single grain.
Models of Cartilage Degradation Involving Loss of Aggrecan: Explant Culture with Interleukin-1 and Digestion with Chondroitinase and Keratinase
A full-thickness mature bovine articular cartilage tissue explant system was employed (Dumont et al. in press). This mature cartilage/bone explant system is metabolically stable during long-term (3-week) culture in serum-free medium with respect to PG and collagen synthesis, content and degradation (Dumont et al. in press). Tissue isolation was similar to that described above, except that a total cartilage/bone thickness of 1.5 mm (~1.2 mm cartilage + ~0.3 mm bone) was produced using the custom-built cutting jig before punching to a 3-mm diameter. Disks were then rinsed five times in antibiotic-supplemented Hank's balanced salt solution before being placed in 96-well round-bottom micro-plates (#25850-96; Corning, Corning, NY) and cultured in 250 μl/well of DME/F12 supplemented with 15 mM HEPES, pH 7.4 (D8900), 50 μg/ml gentamycin (G1272), 0.01% BSA (A8412), and 20 μg/ml ascorbate (A4034; all from Sigma) at 37C in 95% air, 5% CO2. Media were changed every 24 hr, with ascorbate prepared fresh each day. A total of nine disks, taken as three matched groups of three, were isolated. One disk (control) from each group was immediately frozen without being placed in culture. This disk served as a control for the cultured disks because PG content is stable during long-term culture in this system (Dumont et al. in press). A second disk (IL-1) from each group was placed in culture for 11 days as described above but with the addition of 5 ng/ml of interleukin-1α (200-LA; R&D Systems, Minneapolis, MN). The third disk (digested) from each group was placed in culture without IL-1 but was digested at the end of culture in 0.25 ml of Tris-buffered saline (0.1 M Tris + 0.1 M NaCl) containing 200 U/ml of chondroitinase ABC (100332-1 Seikagaku; PDI BioScience Aurora, Ontario, Canada) and 200 U/ml of keratanase (100810-1, Seikagaku) and 0.01% BSA, three times for 24 hr each at 37C. These nine disks were fixed and processed for RHT chemography as described above. Because signal intensity in the degraded disks (IL-1 and digested) was above background in the deeper regions of the cartilage only, grain counting was confined to these areas for both control and degraded disks.
Results
Grain Density on Nonradioactive Sections Fixed in the Presence of RHT Is Due to RHT-derived Positive Chemography and Correlates with Local Aggrecan Concentration
Unlabeled, nonradioactive semithin plastic sections of cartilage that were fixed in the presence of the metal-containing trivalent cationic agent RHT, displayed a significant and spatially variable silver grain density when processed in a manner typically used for autoradiography of radioactively labeled specimens (Figure 1). The silver grains on RHT-fixed specimens were due to the presence of RHT in the fixative because similar specimens processed in the same manner, but with the non-metal-containing monovalent cationic agent cetylpyridinium chloride replacing RHT in the fixative, produced a negligible background silver grain density (not shown, but <1/4 the grain density seen in Figure 1B). The RHT-derived chemographic signal appeared to be stronger in deeper regions of the cartilage, consistent with a higher density of RHT-PG precipitates in those deeper regions, where PG density is known to be higher (Figure 1).
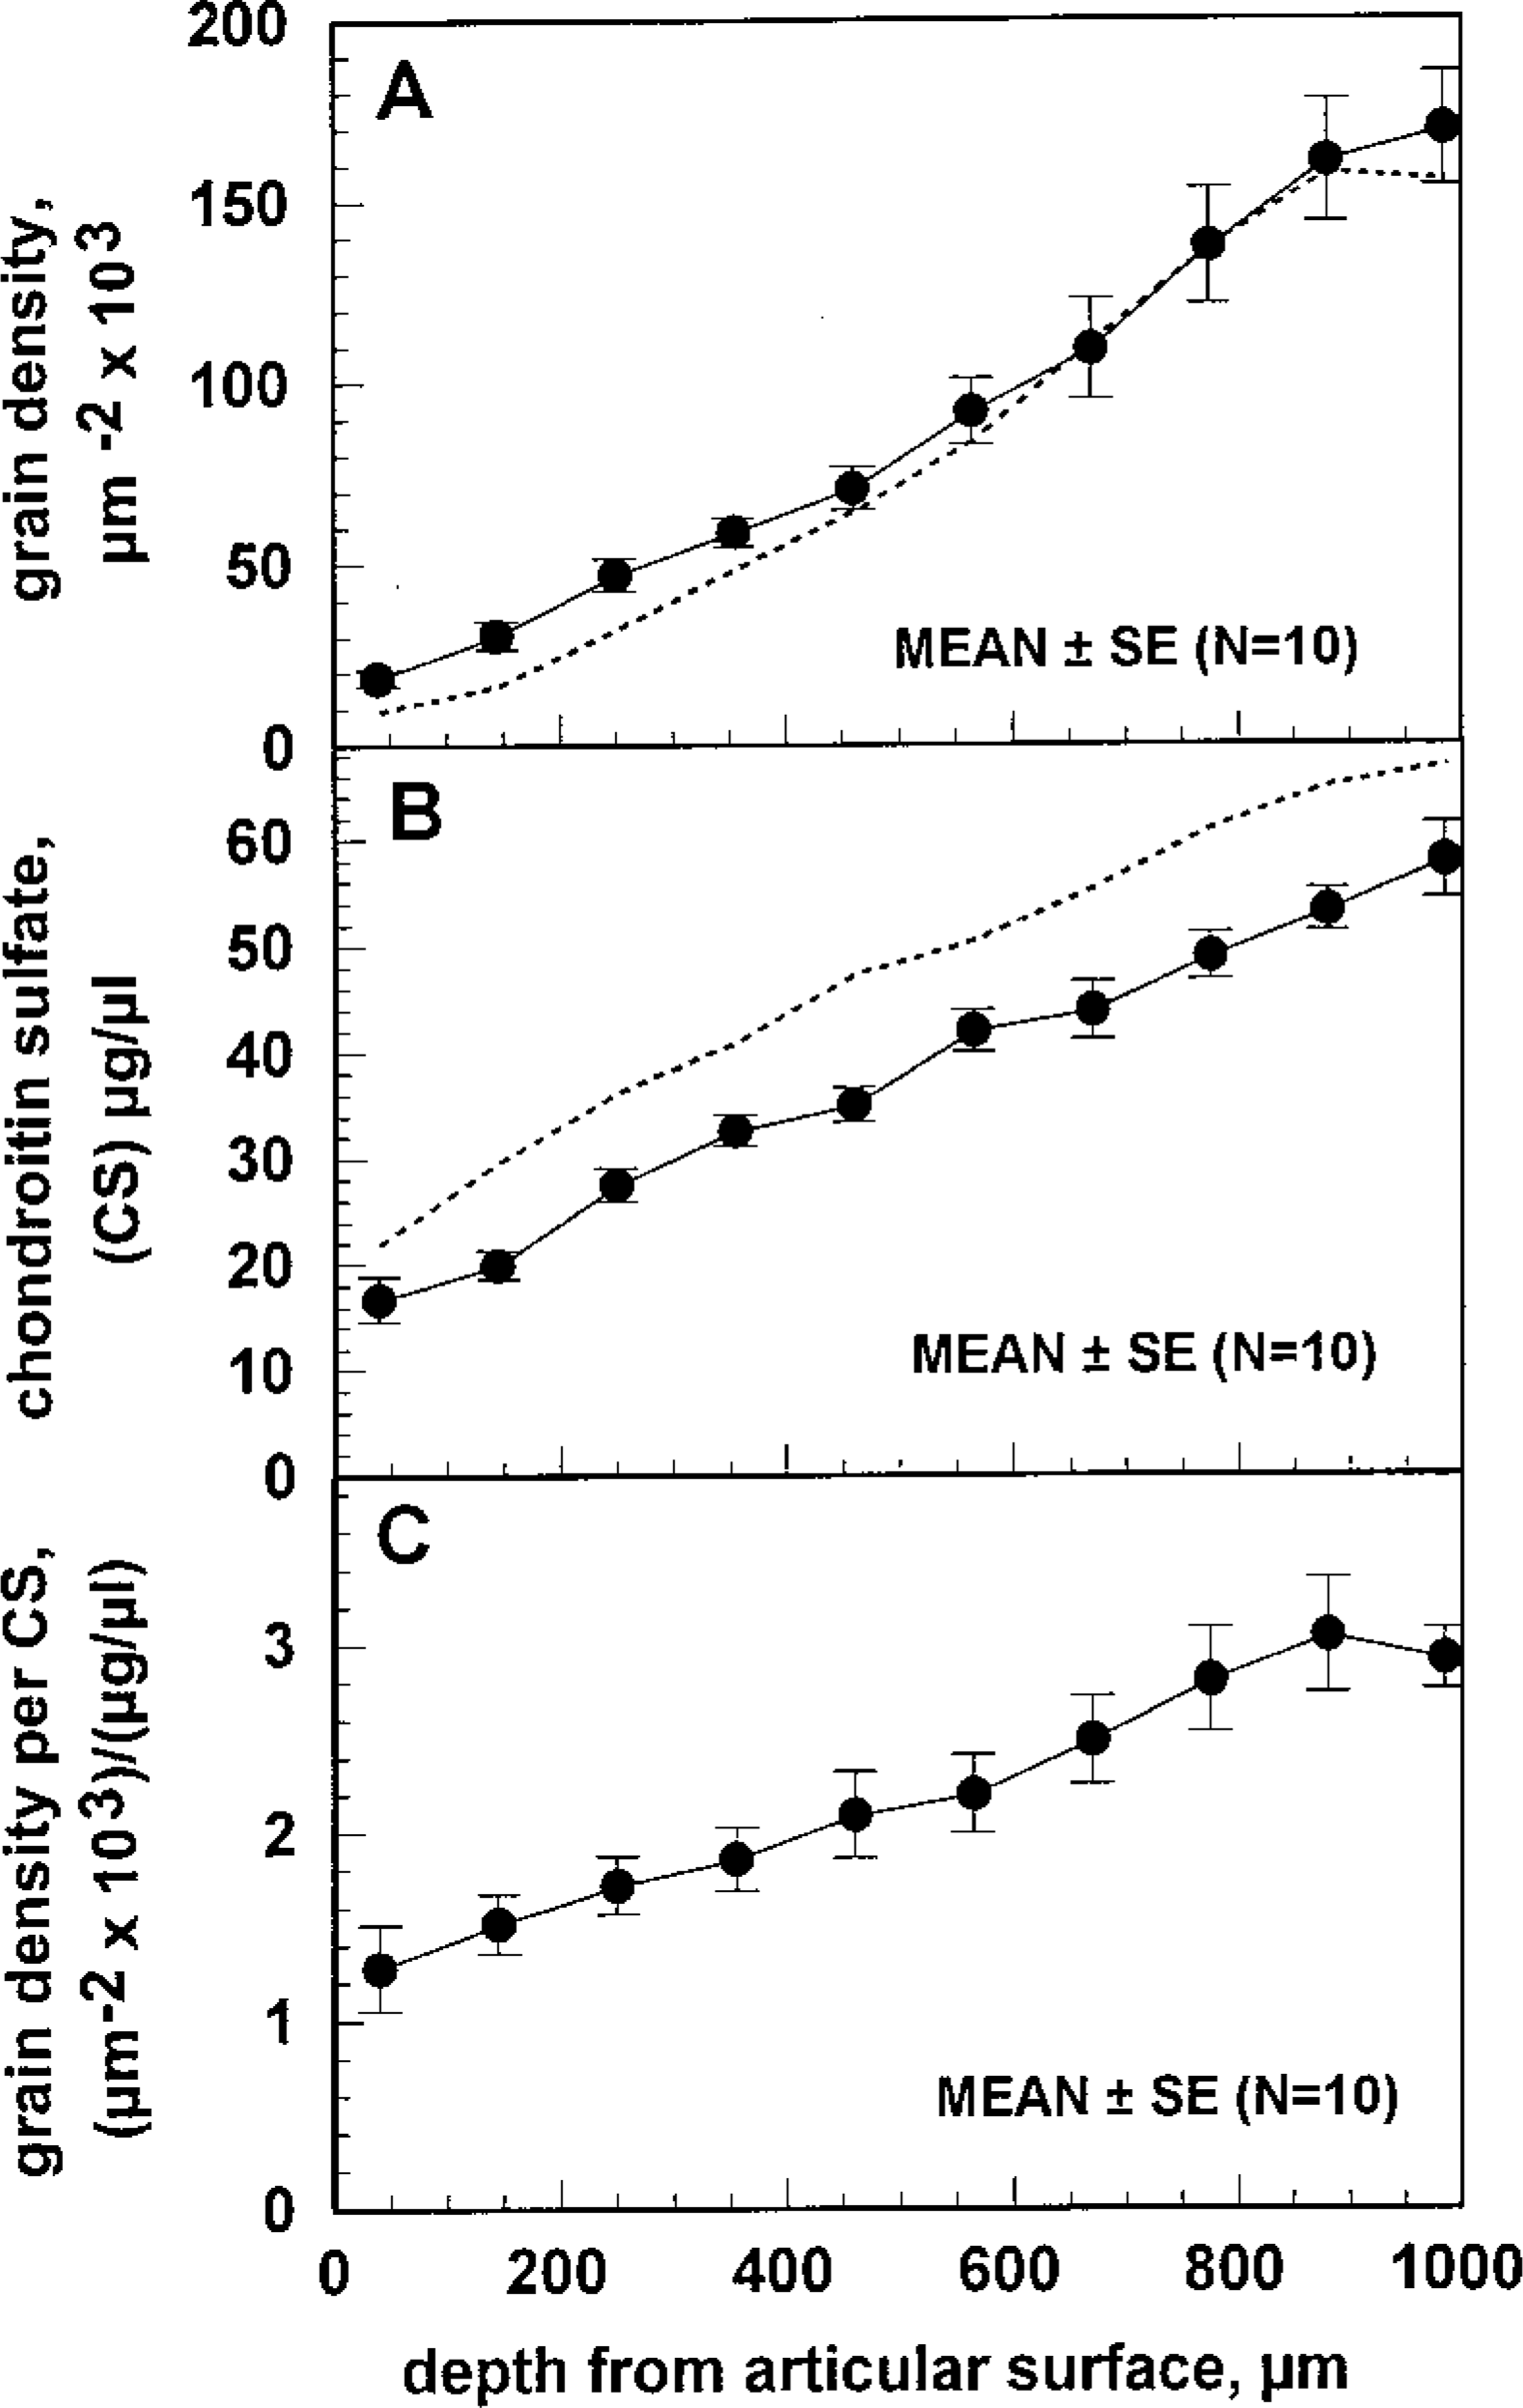
Both the RHT-derived chemographic grain density and the equivalent chondroitin sulfate concentration from DMB-assayed papain-solubilized tissue sections increased monotonically with tissue depth (Figure 2) and were therefore correlated as a function of distance from the articular surface. The grain density was approximately eight times higher in the deep zone compared to the superficial zone (Figure 2A). The equivalent chondroitin sulfate content was approximately four times higher in the deep zone compared to the superficial zone (Figure 2B). The ratio of grain density to equivalent chondroitin sulfate content, calculated using the 10 matched cartilage/bone cylinder pairs, was dependent on the distance from the articular surface (Figure 2C). The ratio varied linearly with depth and was approximately doubled in the deepest zone compared to the most superficial zone (Figure 2C).
The RHT-derived Chemographic Signal Was a Sensitive Indicator of Aggrecan Loss in both IL-1-degraded Tissue Explants and Explants Exposed to Exogenous Chondroitinase and Keratinase
Exposure of tissue explants to IL-1α over 11 days in culture or digestion with exogenous GAG-degrading enzymes resulted in greatly reduced grain density, reflecting the loss of aggrecan in these two models of cartilage degradation (Figure 3). When grains were counted, grain density in the degraded cartilage was found to be many-fold (X5-10) less than in the control tissue explants (Figure 4). Exposure to IL-1α over 11 days in culture reduced grain density to background levels (14 ± 2 μm-2 × 10⁻³; mean ± SEM, n = 3) in the upper two thirds of the cartilage. Grain density was only slightly above background in the lower third of the IL-1-treated cartilage (deep radial zone) but significantly higher than background (~fourfold) for the disks treated with exogenous GAG-degrading enzymes (Figure 4).
Discussion
This study investigated the use of RHT-derived chemographic signal as a quantitative histochemical indicator of aggrecan concentration in cartilage. RHT is a small (MW = 309), soluble trivalent cationic agent which has been used previously to aid in the retention of aggrecan, and thereby of chondrocyte morphology, in cartilage tissue during fixation and further processing, via the formation of stable RHT-aggrecan precipitates (Hunziker et al. 1982). Because of the high density of positive charge of the metal-containing RHT, it is also a very strong positive chemographic agent, acting as catalyst for the reduction of silver bromide to metallic silver during the autoradiographic emulsion development process, in much the same manner as a metallic silver cluster produced by ionizing radiation in the emulsion creates an observable silver grain (Rogers 1979). The application of a computerized grain counting procedure to emulsion-coated and developed plastic sections of RHT-glutaraldehyde-fixed adult articular cartilage produced spatial profiles of RHT-derived chemographic grain density from the articular surface to the deep zone, near the interface with subchondral bone. By applying a spectrophotometric assay for GAG content of papain-solubilized cryosections of tissue from regions representing the zones in the profiles of grain density, we found a positive correlation between RHT chemographic signal and the equivalent chondroitin sulfate concentration obtained by the spectrophotometric method. Furthermore, we found the RHT chemographic signal to be very sensitive to aggrecan loss, based on results using IL-1 treatment in vitro and enzymatically generated matrix degradation.
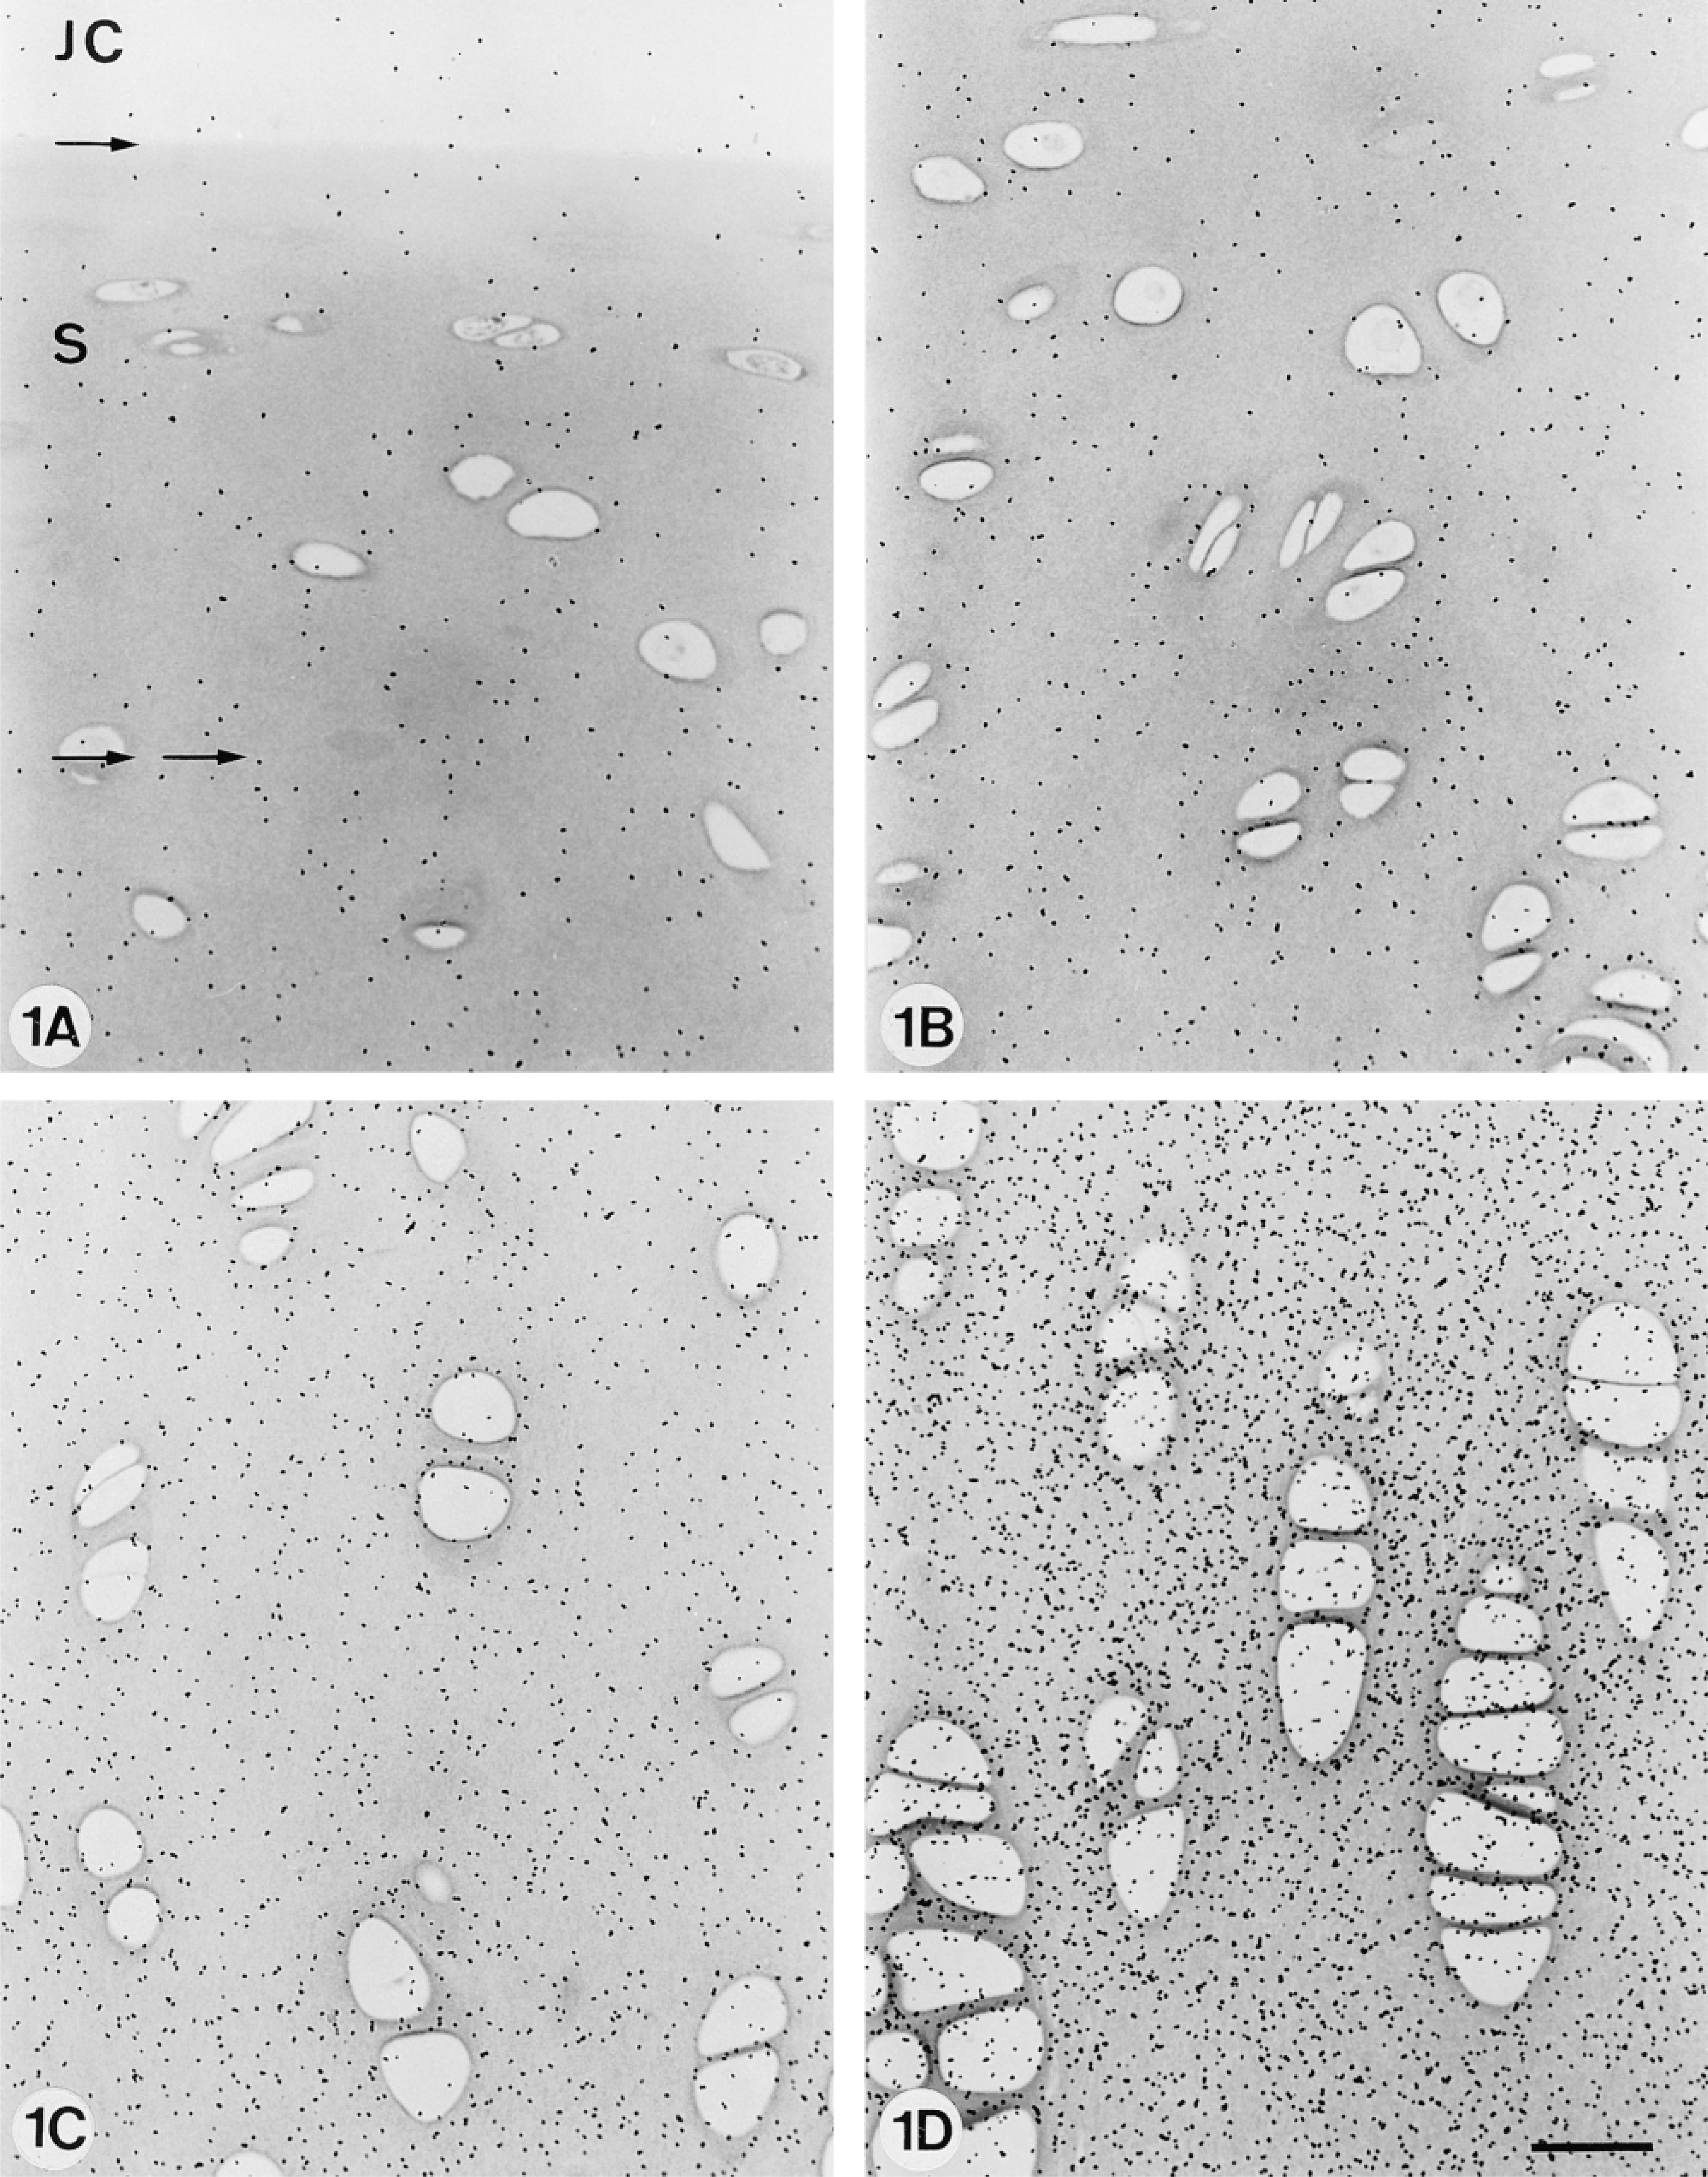
Representative light micrographs from the group of specimens fixed in 2% glutaraldehyde with 0.7% w/v RHT in 0.05 M Nacacodylate, pH 7.4, embedded in Epon, sectioned, and dipped in emulsion that was exposed and developed to reveal the positive chemographic signal (grains) produced by RHT. (
The physicochemical process involved in the chemographic generation of silver grains by RHT in tissue sections is similar to that used in the techniques of autometallography developed previously for the detection of trace levels of metal ions (e.g., gold, silver, mercury, zinc) in tissues (Danscher 1984,1991). Although the process involved in generation of silver grains in our method is similar to that of the autometallographic methods, we use the term RHT-derived chemography (Rogers 1979) rather than autometallography, because RHT was introduced only as a fixative and does not originate from biological processes in the relevant tissue, as is the case in autometallography. A previous study has described a procedure similar to ours in which cuprolinic blue was included in a glutaraldehyde-based fixative for the detection of polyanions in rat teeth (Lormée et al. 1989). That study was qualitative, in that no grain counting was performed, and no biochemical methods were used for correlation with the cuprolinic blue chemographic signal. Our method is also complementary to a previous method for the quantitation of GAGs in sections by microspectrophotometry of tissue sections stained with the cationic dye Safranin O (Kiviranta et al. 1985). Potential advantages of our method include those associated with the inclusion of RHT in the fixative, such as reduced loss of PGs during processing and improved cell morphology.
(
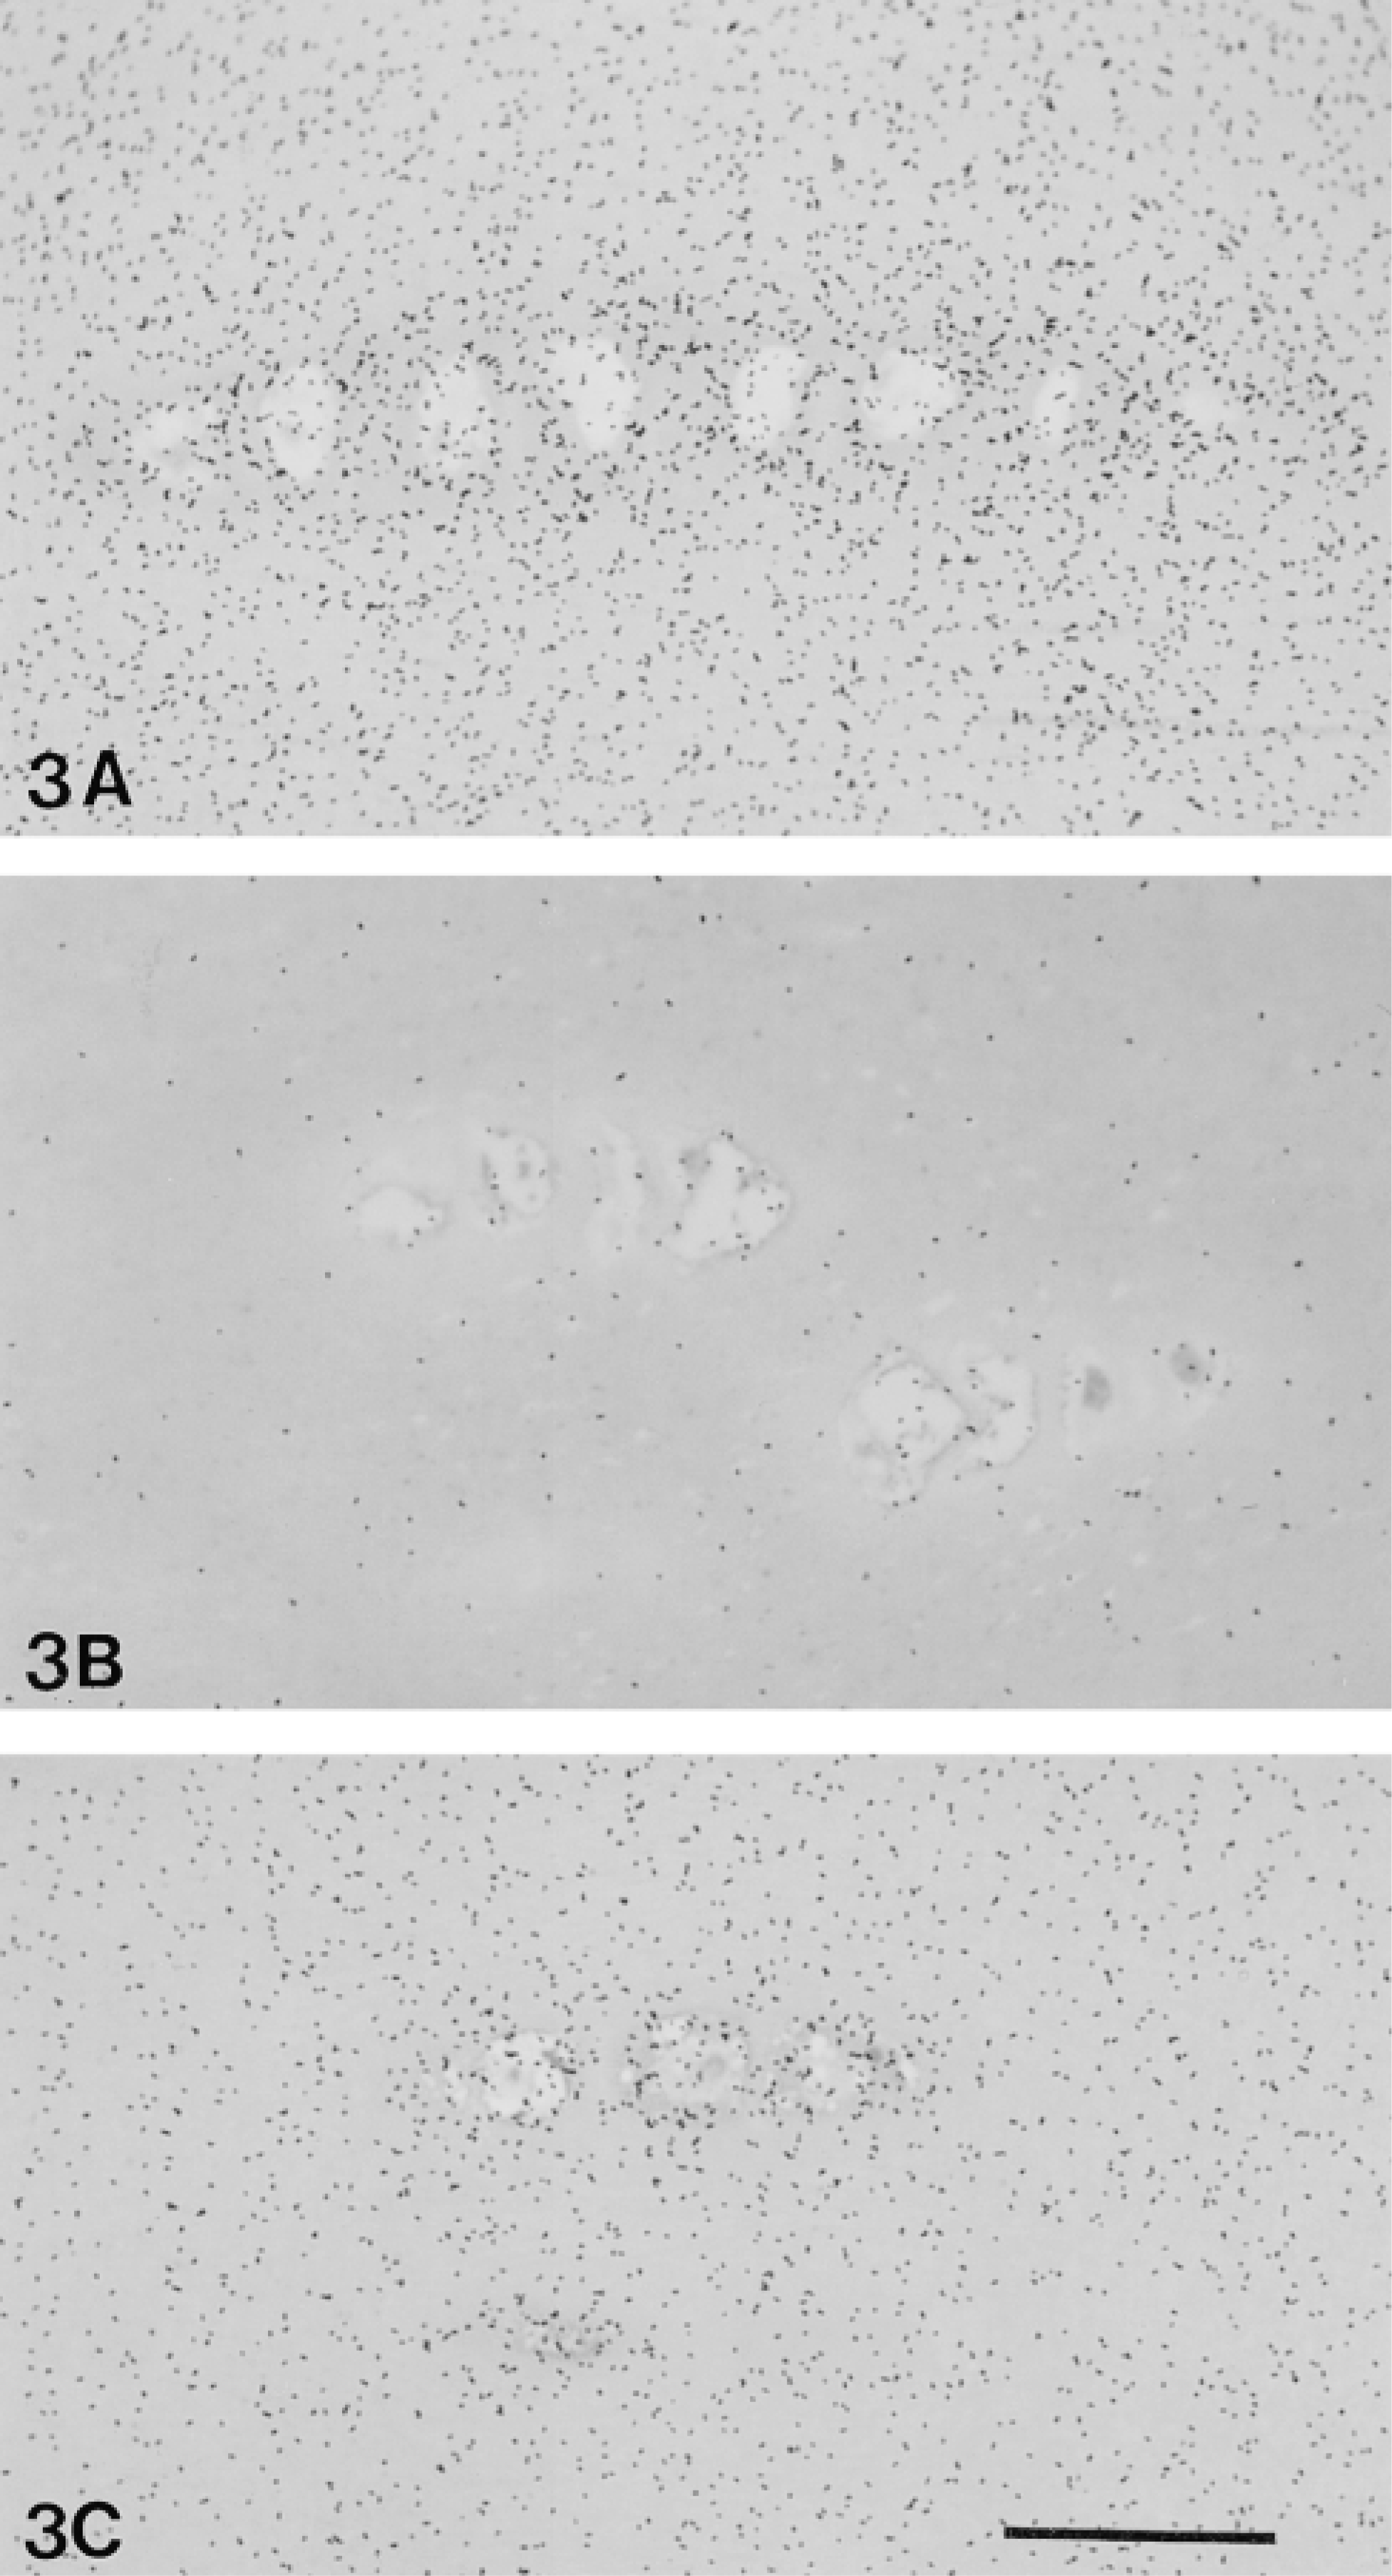
Light microscopic photographs showing the RHT chemographic signal from the deep region (radial zone) of control tissue explants frozen immediately after isolation (
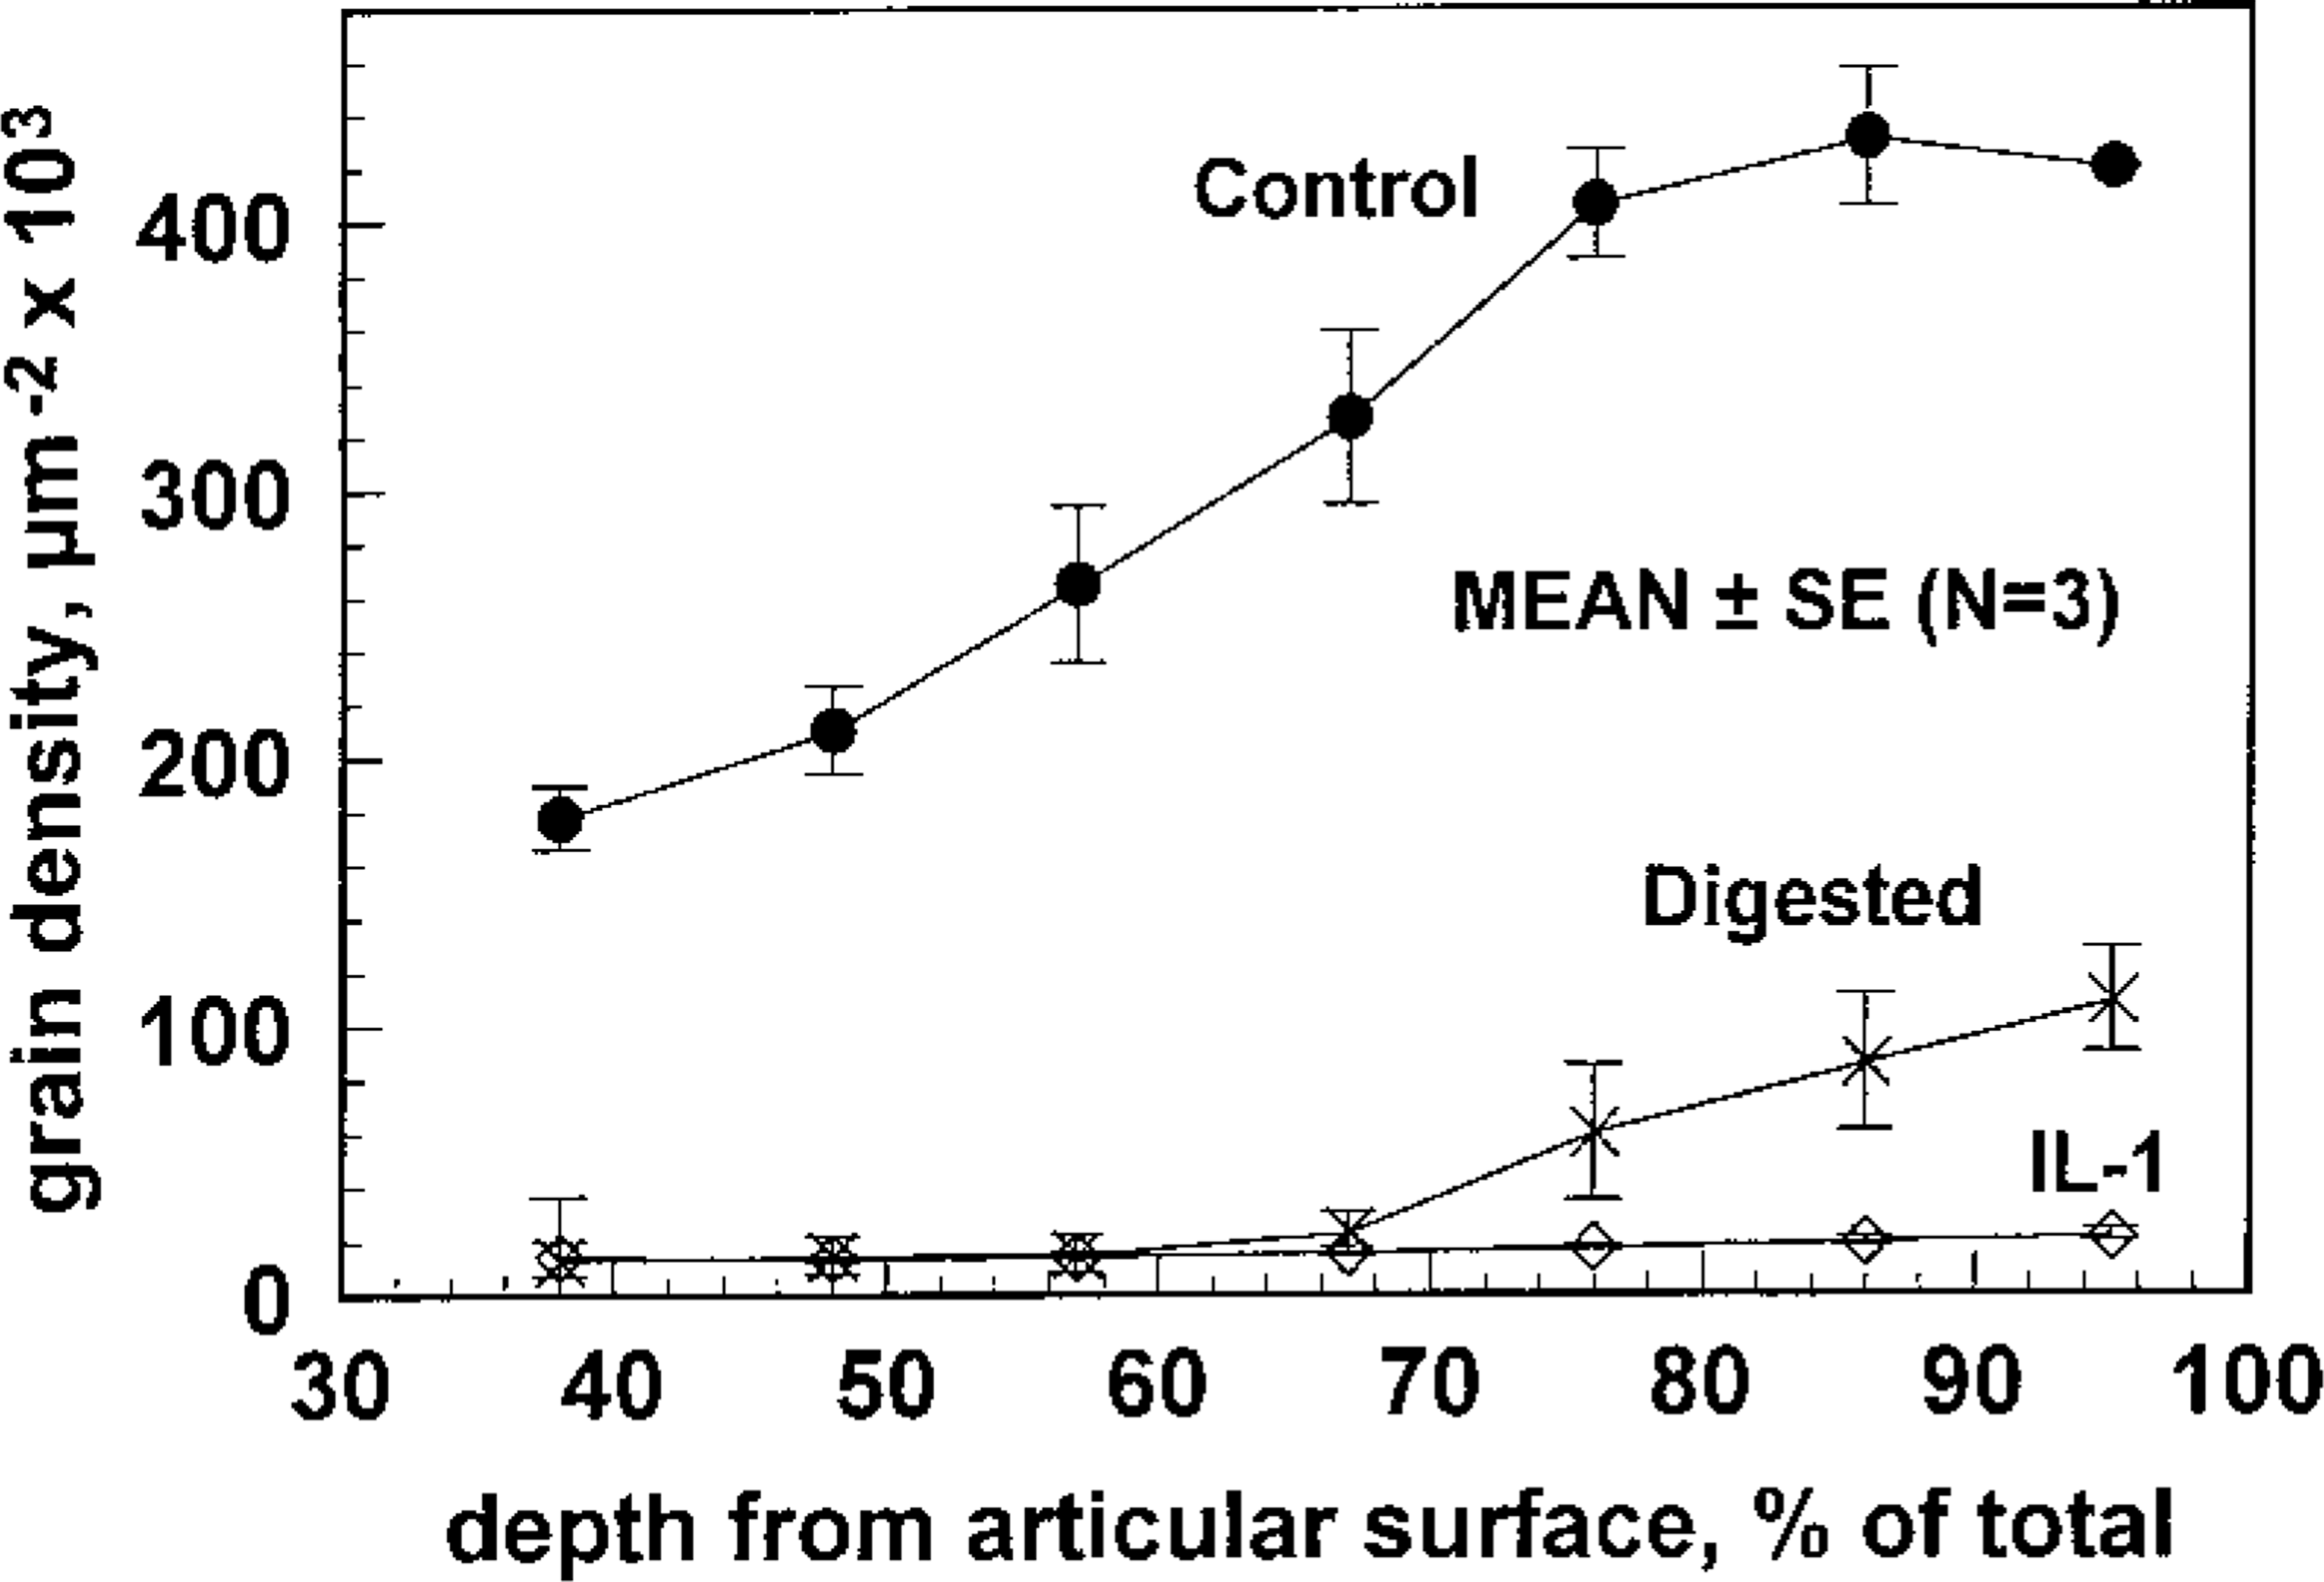
RHT-derived chemographic grain density measured from digitized images similar to those in Figure 3. Grain density was obtained by acquiring seven adjacent images from the tidemark to the upper radial zone and was plotted as a function of distance from the articular surface (as a percentage of total cartilage thickness). Grain density in degraded (IL1 and Digested) cartilage was reduced several-fold. Significant grain density remains in the deeper zones of the digested samples, despite extensive digestion (three times for 24 hr) with both chondrotinase and keratanase.
The quantitative ratio of RHT-derived chemographic grain density to equivalent chondroitin sulfate concentration by DMB of papain-solubilized tissue pieces depended slightly (within a factor of 2) on distance from the articular surface. If chondroitin sulfate (CS) were the only reactive polyanion in the tissue for RHT and in the papain-solubilized samples for DMB, one would expect the above ratio to be constant, independent of depth or of other factors. However, even in that case, the RHT-CS binding in the tissue would take place under much denser conditions (25,000-fold higher CS concentration) than the DMB-CS binding in the microplate assay. Therefore, one hypothesis explaining the systematic variation of the RHT/DMB ratio (Figure 2C) is that higher concentrations of GAGs in the deeper regions bind proportionately more RHT in the tissue than DMB at the low concentrations in the solution assay. Therefore, RHT-GAG binding in tissue sections may display a cooperative character not present in DMB-GAG binding in dilute solution. Other factors that could influence the RHT/DMB ratio include the presence of other species of reactive polyanions (keratan sulfate, dermatan sulfate, and hyaluronan) in addition to our standard, chondroitin sulfate, in the tissue sections and papain digests. The concentrations of these GAGs also vary with distance from the articular surface (Aydelotte and Kuettner 1993; Poole 1993) and have different sensitivities to DMB, for example (Farndale et al. 1982). Recently developed microanalytical techniques (Plaas et al. 1996,1998) may go a long way towards clarifying the contributions of different GAGs to the chemographic signal. These techniques would be particularly useful when the chemographic method is used to study new tissues or similar tissue subjected to alternative experimental manipulation. Cationic agents are also expected to bind to polyanions of RNA and DNA, which could give rise to RHT chemographic signal, independent of the presence of GAGs of PG. This source of grain density was supported by the presence of grains over cells and nuclei. However, the small volume fraction of cells and nuclei (~4%; Wong et al. 1996) compared to the extracellular space suggests that grains produced by RNA and DNA polyions are few compared to those produced by GAGs. Loss of RHT-PG precipitates by diffusion out of the tissue during processing is another potential source of spatial variation of grain density. However, this diffusional loss of RHT-PG precipitates was minimal with our protocol, as indicated by inspection of grain density near the lateral radial edges of sections, where the most significant loss would have taken place. We found evidence of loss of grain density only within a distance of ~100 μm from the lateral radial surface, a distance for diffusional loss that could affect only the initial points in our grain density profiles (Figure 2A).
An important observation in our study was the high sensitivity of the RHT chemographic signal to the effects of matrix degradation. We chose two in vitro models of cartilage degradation to explore the use of this new technique to monitor aggrecan loss in articular cartilage. Exposure of tissue explants to 5 ng/ml of IL-1α reduced grain densities by an order of magnitude compared to controls throughout the entire thickness of the cartilage and to background levels in all but the deep radial zone (Figures 3 and 4). Estimation of GAG content using the DMB method on tissue treated similarly with IL-1 revealed a five- to tenfold reduction of aggrecan compared to controls (down to 3–6 μg/μl), and an ELISA method showed no detectable change of total collagen II content, again confirming the role of aggrecan in generating the RHT chemographic signal. We can also glean from this data and our measurements of background grain density in many samples that the minimim GAG concentration required to produce a detectable RHT chemographic signal is in the range of 5-10 μg/μl. Interestingly, our second method of inducing aggrecan loss by directly digesting the tissue explants with GAG-degrading enzymes was able to deplete most of the cartilage of aggrecan to the levels of the IL-1-treated tissue except in the deep radial zone, where grain densities remained significantly higher than those produced by IL-1 (Figure 4). We hypothesize that the exogenously added enzymes are sterically blocked from penetrating the deeper cartilage regions where extracellular matrix is most dense, whereas the action of IL-1 on chondrocytes in upregulating the synthesis of matrix-degrading enzymes within those regions is not impeded. This distinction further highlights the potential of the new technique.
In summary, we have developed a quantiative histochemical method to estimate aggrecan concentration in cartilage tissue sections using the chemographic signal produced when ruthenium hexaammine trichloride is included in the fixative. In addition to providing a new tool in the analysis of pathologies such as osteoarthritis, this method can be used to localize functional anisotropic and spatially heterogeneous biomechanical properties of cartilage. For example, cartilage explants compressed under defined but variable loading conditions were fixed in the compressed state and processed for RHT-derived chemography (Kolmonen et al. 1997). Changes in grain density were used to estimate local levels of tissue deformation and thereby the spatial heterogeneity of tissue stiffness.
Footnotes
Acknowledgements
Supported by the AO/ASIF Foundation (93-G46), Switzerland, the Medical Research Council of Canada, and the Arthritis Society of Canada.
We thank Dr Thomas Quinn, Pirmin Schmid, and Anne Légaré for performance of some of the technical analyses.