
Abstract
After binding of epidermal growth factor (EGF), the EGF receptor (EGFR) becomes autophosphorylated via tyrosine. The ligand-activated receptor is internalized by endocytosis and subsequently degraded in the lysosomal pathway. To follow EGFR activation after EGF stimulation, we generated antisera to the EGFR phosphotyrosine sites pY992 and pY1173. The SH2 region of Shc binds to both these sites. Both antisera identified EGFR after EGF binding and did not crossreact with the unactivated receptor. The intracellular distribution of phosphorylated EGFR after ligand binding was traced by two-color immunofluorescence confocal microscopy and immunoelectron microscopy. Before EGF stimulation EGFR was primarily located along the cell surface. When internalization of activated EGFR was inhibited by incubation with EGF on ice, Y992- and Y1173-phosphorylated EGFR were located along the plasma membrane. Ten minutes after internalization at 37C, Y992- and Y1173-phosphorylated EGFR were almost exclusively located in early endosomes, as shown by co-localization with EEA1. Immunoelectron microscopy confirmed that phosphorylated EGFR was located in intracellular vesicles resembling early endosomes. After EGF stimulation, the adaptor protein Shc redistributed to EGFR-containing early endosomes. Our results indicate that EGFR activation of Shc via tyrosine-phosphorylated Y992 and Y1173 occurred in early endocytic compartments, and support a role for membrane trafficking in intracellular signaling.
Keywords
E
Ligand-bound EGFR is rapidly internalized through receptor-mediated endocytosis and sorted to multivesicular bodies. The receptor either recirculates to the plasma membrane after ligand dissociation or is degraded through the lysosomal pathway (Carpentier et al. 1987; Felder et al. 1990). Ligand-activated and internalized EGFR appears to be phosphorylated and adaptor protein-associated, but the importance and function of endosomal signal transduction is controversial (Lai et al. 1989; Futter et al. 1993; Di Guglielmo et al. 1994; Nesterov et al. 1994; Emlet et al. 1997). MAPK activation was strongly inhibited when endocytosis from clathrin-coated pits was arrested in cells transfected with a mutant dynamin (Vieira et al. 1996). It was recently shown that expression of mutant dynamin disrupts high-affinity binding of EGF but not ligand-induced recruitment of EGFR to clathrin-coated pits (Ringerike et al. 1998). This complicates the interpretation that MAPK inhibition is caused by inhibited endocytosis. There are also indications that signal specificity depends on intracellular processing of the internalized ligand-receptor complex. Skarpen et al. (1998) demonstrated that TGFα and EGF exert different proliferative effects because TGFα, but not EGF, dissociates from the receptor at the reduced pH of endosomes.
To elucidate the exact relationship between EGFR phosphorylation, intracellular membrane trafficking, and downstream signaling, it will be necessary to trace the activated receptor and its adaptor proteins along the involved organelles. In this study we applied immunofluorescence and immunoelectron microscopy to determine the intracellular localization of specific EGFR phosphorylation species in HeLa cells. Antisera to the activated form of the two Shc binding auto-phosphorylation sites Y992 and Y1173 of EGFR were developed. Two-color immunofluorescence confocal microscopy demonstrated that EGFR phosphorylated at these sites was almost exclusively located in EEA1-positive and LAMP-1-negative early endosomes after EGF stimulation. Immunoelectron microscopy confirmed that phosphorylated EGFR was predominantly located in subcellular compartments consistent with early endosomes. In response to EGF stimulation, the adaptor protein Shc redistributed to EEA1-positive vesicles that contained EGFR. These results show that EGFR remained phosphorylated and co-localized with Shc along the endocytic pathway, and demonstrate that two-color immunofluorescence, in combination with confocal laser scan microscopy and immunoelectron microscopy, possesses the necessary resolution and specificity for investigations of intracellular signal transduction.
Materials and Methods
Materials
Receptor grade EGF from mouse submaxillary glands was purchased from Sigma Chemical (St Louis, MO). Sheep antiserum to the intracellular domain of EGFR was obtained from Gibco BRL (Paisley, UK), and rabbit anti-Shc was purchased from Transduction Laboratories (Lexington, KY). Mouse anti-phosphotyrosine (4G10) was obtained from Upstate Biotechnology (Lake Placid, NY). Human anti-EEA1 serum, a kind gift from Dr. H. Stenmark (The Norwegian Radium Hospital; Oslo, Norway), and mouse anti-LAMP-1 (Developmental Studies Hybridoma Bank; University of Iowa, Iowa City, IA) have previously been characterized (Mu et al. 1995 and Chen et al. 1985, respectively). All FITC- and Texas Red-conjugated donkey antisera to mouse, rabbit, and human IgG and peroxidase-conjugated donkey antisera to sheep and mouse IgG were purchased from Jackson ImmunoResearch Laboratories (West Grove, PA). Gold-conjugated donkey anti-sheep IgG was purchased from Bio-cell (Cardiff, UK). Protein A-gold was obtained from Dr. J. Slot (Utrecht University; Utrecht, the Netherlands). All other materials were purchased from Sigma unless otherwise noted.
Generation of Antisera to Phosphorylated EGFR
Phosphorylated and nonphosphorylated synthetic peptides corresponding to the two cytoplasmic autophosphorylation sites Y992 and Y1173 of EGFR were generated by Genosys Biotechnology (Pampisford, UK). These sequences are identical in human and mouse. The tyrosine-phosphorylated peptides pY992 and pY1173 (DVVDADEpYLIPQQ and TAENAEpYLRVAP, respectively) were conjugated to keyhole limpet hemocyanin via a C-terminally added cysteine. Peptide conjugates were mixed with Freund's complete adjuvant and injected SC into NZL rabbits (250 μg peptide per animal). After several booster injections, sera were tested by Western blotting of lysates from unstimulated and EGF-stimulated HeLa cells. Both R42/pY1173 (to pY1173) and R46/pY992 (to pY992) antisera were tested for specificity by enzyme-linked immunosorbent assay (ELISA) and by absorption with their respective peptides.
ELISA
Synthetic peptides were coupled via their carboxyl groups to amino groups of the Covalink microtiter plates (Nunc; Kamstrup, Denmark) by adding sulfo-N-hydroxy-succinimide (sulfo-NHS; Pierce Chemicals, Rockford, IL) and 1-ethyl-3-(3-dimethylaminopropyl)-carbodiimide (EDC) (Staros et al. 1986). The synthetic tyrosine-phosphorylated peptides pY1173 and pY992 and unphosphorylated Y1173 and Y992 were dissolved in 60% dimethylsulfoxide. Dissolved peptides were stored at −20C and diluted in distilled water containing 0.175 mg/ml sulfo-NHS to a peptide concentration of 0.57 mg/ml immediately before use. Covalink microtiter plates were coated with a 1:1 mixture of serially diluted peptide/sulfo-NHS (final concentrations from 208 μM to 4.9 × 10⁻⁵ μM in distilled water) and EDC diluted in distilled water (1.2 mg/ml) at room temperature (RT) for 120 min. Rabbit anti-pY992 and anti-pY1173 (R46/pY992 and R42/pY1173, respectively) were diluted 1:10,000 in Covabuffer (PBS containing 2 M NaCl, 0.083 M MgSO4, and 0.05% Tween-20) and incubated with the Covabuffer-washed wells overnight at 4C. The wells were incubated with peroxidase-conjugated donkey anti-rabbit IgG (1:10,000) for 90 min at RT. Antibody binding was detected with a freshly made solution of 2,2'-azino-bis(3-ethylbenz-thiazoline-6-sulfonic acid) (ABTS) containing 77.2 mM Na2HPO4, 61.4 mM citric acid, 400 μM ABTS, and 0.03% hydrogen peroxide (Fluka Chemie; Buchs, Germany).
In a competition assay, Covalink wells coated with pY1173 (0.2 μM) or pY992 (0.1 μM) were incubated with their respective antisera [R42/pY1173 (1:20,000) and R46/ pY992 (1:10,000)] preincubated with serial dilutions of pY1173 or pY992 (832 μM-0.2 μM) at RT for 240 min. After overnight incubation, signal development was done as described above. Optical density was measured at 405 nm in a ThermoMax microplate reader (Molecular Devices; Sunnyvale, CA).
Cell Cultures
The human HeLa epidermal carcinoma cell line expressing approximately 1.4 × 10⁵ EGFR per cell (Kinzel et al. 1990) was obtained from American Tissue Type Collection (Rockville, MD). Cells were maintained in DMEM (BioWhittaker; Walkersville, MD) supplemented with 5% (v/v) fetal calf serum (BioWhittaker), 2 mM L-glutamine, and 50 ng/ml gentamycin (Gibco BRL). The cells were grown to 60-80% confluence in Petri dishes or flasks (Costar; Cambridge, MA). To synchronize EGFR internalization, tyrosine phosphorylation of the EGFR was induced with EGF (10 nM in Hank's balanced salt solution (Gibco BRL), pH 7.4) on ice for 15 min. Cells were then washed in ice-cold PBS, incubated in prewarmed medium, and chased at 37C for increasing time periods.
Western Blot Analysis
Cells were lysed in Tris-lysis buffer, pH 7.4 [60 mM Tris-HCl, 10% (v/v) glycerol, 3% (w/v) sodium dodecyl sulfate (SDS), 1 mM EDTA, 20 μM aprotinin, 20 μM leupeptin, 10 mM β-glycerophosphate, 0.2 mM 4-(2-aminoethyl)benzenesulfonyl fluoride (AEBSF), and 60 μM sodium orthovanadate]. The samples were sonicated four times for 10 sec and protein concentrations were measured with the DC protein Assay (Bio-Rad; Hercules, CA) and adjusted to equal concentrations in the lysis buffer containing 5% β-mercaptoethanol and 0.002% bromophenol blue. The samples were then boiled for 5 min and subjected to SDS-PAGE. The Rainbow molecular weight standards (Amersham; Poole, UK) were included. Separated proteins were electrotransferred to nitrocellulose membranes (Micron Separation; Westborough, MA) for subsequent protein detection as described (Laemmli 1970; Towbin et al. 1988). Membranes were washed in Trisbuffered saline (TBS), pH 7.6, and preincubated in 5% (w/v) fat-free dry milk in TBS for 30 min. The membranes were incubated overnight at 4C with anti-EGFR (1:20,000), R42/pY1173 (1:5000), R46/pY992 (1:5000), or anti-phosphotyrosine (1:5000). Binding of antibodies was detected with appropriate peroxidase-conjugated donkey or goat anti-IgG antiserum (1:5000) for 90 min. All antibodies were diluted in 1% (w/v) fat-free dry milk in TBS. The filters were washed in TBS before detection by the enhanced chemiluminescence (ECL) method (Amersham) with Hyperfilm (Amersham).
Immunocytochemistry and Confocal Microscopy
Cells incubated with EGF and chased for different time periods were fixed in 4% paraformaldehyde in PBS for 20 min at RT and exposed to 0.2% Triton X-100 in PBS for 10 min at 4C. The cells were washed in PBS, rinsed in distilled water, and air-dried before incubation with primary and secondary antibodies diluted in PBS containing 1% BSA (overnight and 30 min, respectively). Combinations of Texas Red- or FITC-conjugated donkey species-specific antisera to IgG of the appropriate species were utilized. To control the specificities of the immunostaining procedures, one or the other of the primary antisera was replaced with normal serum from the appropriate species. In addition, R42/pY1173 and R46/pY992 were preabsorbed with their respective immunogens and tested for immunofluorescence reactivity. The samples were mounted using the Dako fluorescent mounting medium (Dako; Carpinteria, CA). Cells were examined with a Nikon Labophot microscope (Nikon; Tokyo, Japan) equipped with an epifluorescence attachment and a Bio-Rad MRC 600 confocal laser scan unit with a krypton/ argon laser, a K1 double dichroic excitation filter block, and a K2 dichroic emission filter block (Bio-Rad). This equipment allowed simultaneous detection of FITC and Texas Red fluorescence. All pictures were taken with pinhole size 5/15 and Kalman filtration using 30 scans per picture, with a PlanApo X60/1.4 objective. A Polaroid freeze-frame unit (Polaroid; Cambridge, MA) was used for image recording.
Immunoelectron Microscopy
Cells incubated with EGF on ice and chased for increasing time periods were fixed in 4% paraformaldehyde and 0.2% glutaraldehyde in Sorensen phosphate buffer (pH 7.4) for 120 min at RT. Cells were collected with a cell scraper and centrifuged at 1000 rpm for 5 min. The pellets were resuspended in Sorensen phosphate buffer before centrifugation at 6000 rpm for 10 min. The cell pellets were infused with 15% polyvinylpyrrolidone and 1.7 M sucrose in PBS (pH 7.4) for 1 hr, cut into approximately 1-mm3 cubes, and frozen in liquid nitrogen. Sections (60-80 nm thick) were cut at −120C on a Leica Ultracut microtome (Leica; Vienna, Austria) using a diamond knife. Sections were transferred to carbon-coated copper grids and further processed for immunocytochemical labeling as described by Griffiths (1993), with some modifications. Sections were incubated with PBS containing 1% BSA for 15 min before labeling with anti-EGFR (1:80), R42/pY1173 (1:100), or anti-Shc (1:500) for 20 min. Protein A-gold (10 nm) was used for detection of R42/ pY1173 and anti-Shc, and gold-conjugated anti-sheep IgG (15 nm) was used for immunodetection of anti-EGFR. For simultaneous labeling of Shc and EGFR, labeling was done first with anti-Shc followed by protein A-gold (10 nm). The sections were fixed as described above before labeling with anti-EGFR followed by gold-conjugated (15 nm) anti-sheep IgG. All antibodies and protein A-gold were diluted in PBS containing 1% BSA. As a control, incubation of sections with protein A-gold or gold-conjugated anti-sheep IgG alone was done. Two independent samples for each time point were examined in three different sections from each sample. Approximately 30 cells were examined per sample. Sections were viewed in a JEOL 1200-EX transmission electron microscope at 80 kV.
Results
Characterization of Antisera to Phosphorylated EGFR
The specificities of antisera R42/pY1173 and R46/ pY992 to EGFR peptide sequences containing phosphorylated or nonphosphorylated tyrosine were examined by ELISA. Covalink wells were coated with serial dilutions of phosphorylated peptides (pY1173 or pY992) or their corresponding nonphosphorylated peptides (Y1173 or Y992) and incubated with antisera R42/pY1173 (Figure 1A) or R46/pY992 (Figure 1B), followed by peroxidase-conjugated antibodies to rabbit IgG and a peroxidase substrate. ELISA demonstrated that both antisera were highly specific for their corresponding phosphorylated peptide sequences compared to both their phosphorylated and unphosphorylated counterparts (Figure 1). To further characterize the R42/pY1173 antiserum, we performed competition assays. Serial dilutions of pY1173 and pY992 peptides were preincubated with R42/pY1173 or R46/ pY992 antiserum before incubation with Covalink wells coated with pY1173 and pY992, respectively. The data showed that the R42/pY1173 antiserum had more than 100-fold higher affinity to the pY1173 phosphopeptide compared to pY992 (Figure 2A). The R46/pY992 had approximately 1500-fold higher affinity to the pY992 phosphopeptide than to pY1173 (Figure 2B). When utilized in Western blotting, both antisera revealed a single 170-kD band corresponding to EGFR in EGF-exposed HeLa cells but not in unstimulated cells. Therefore, the antisera were specific for the phosphotyrosine-containing autophosphorylation sites Y1173 and Y992 of EGFR.
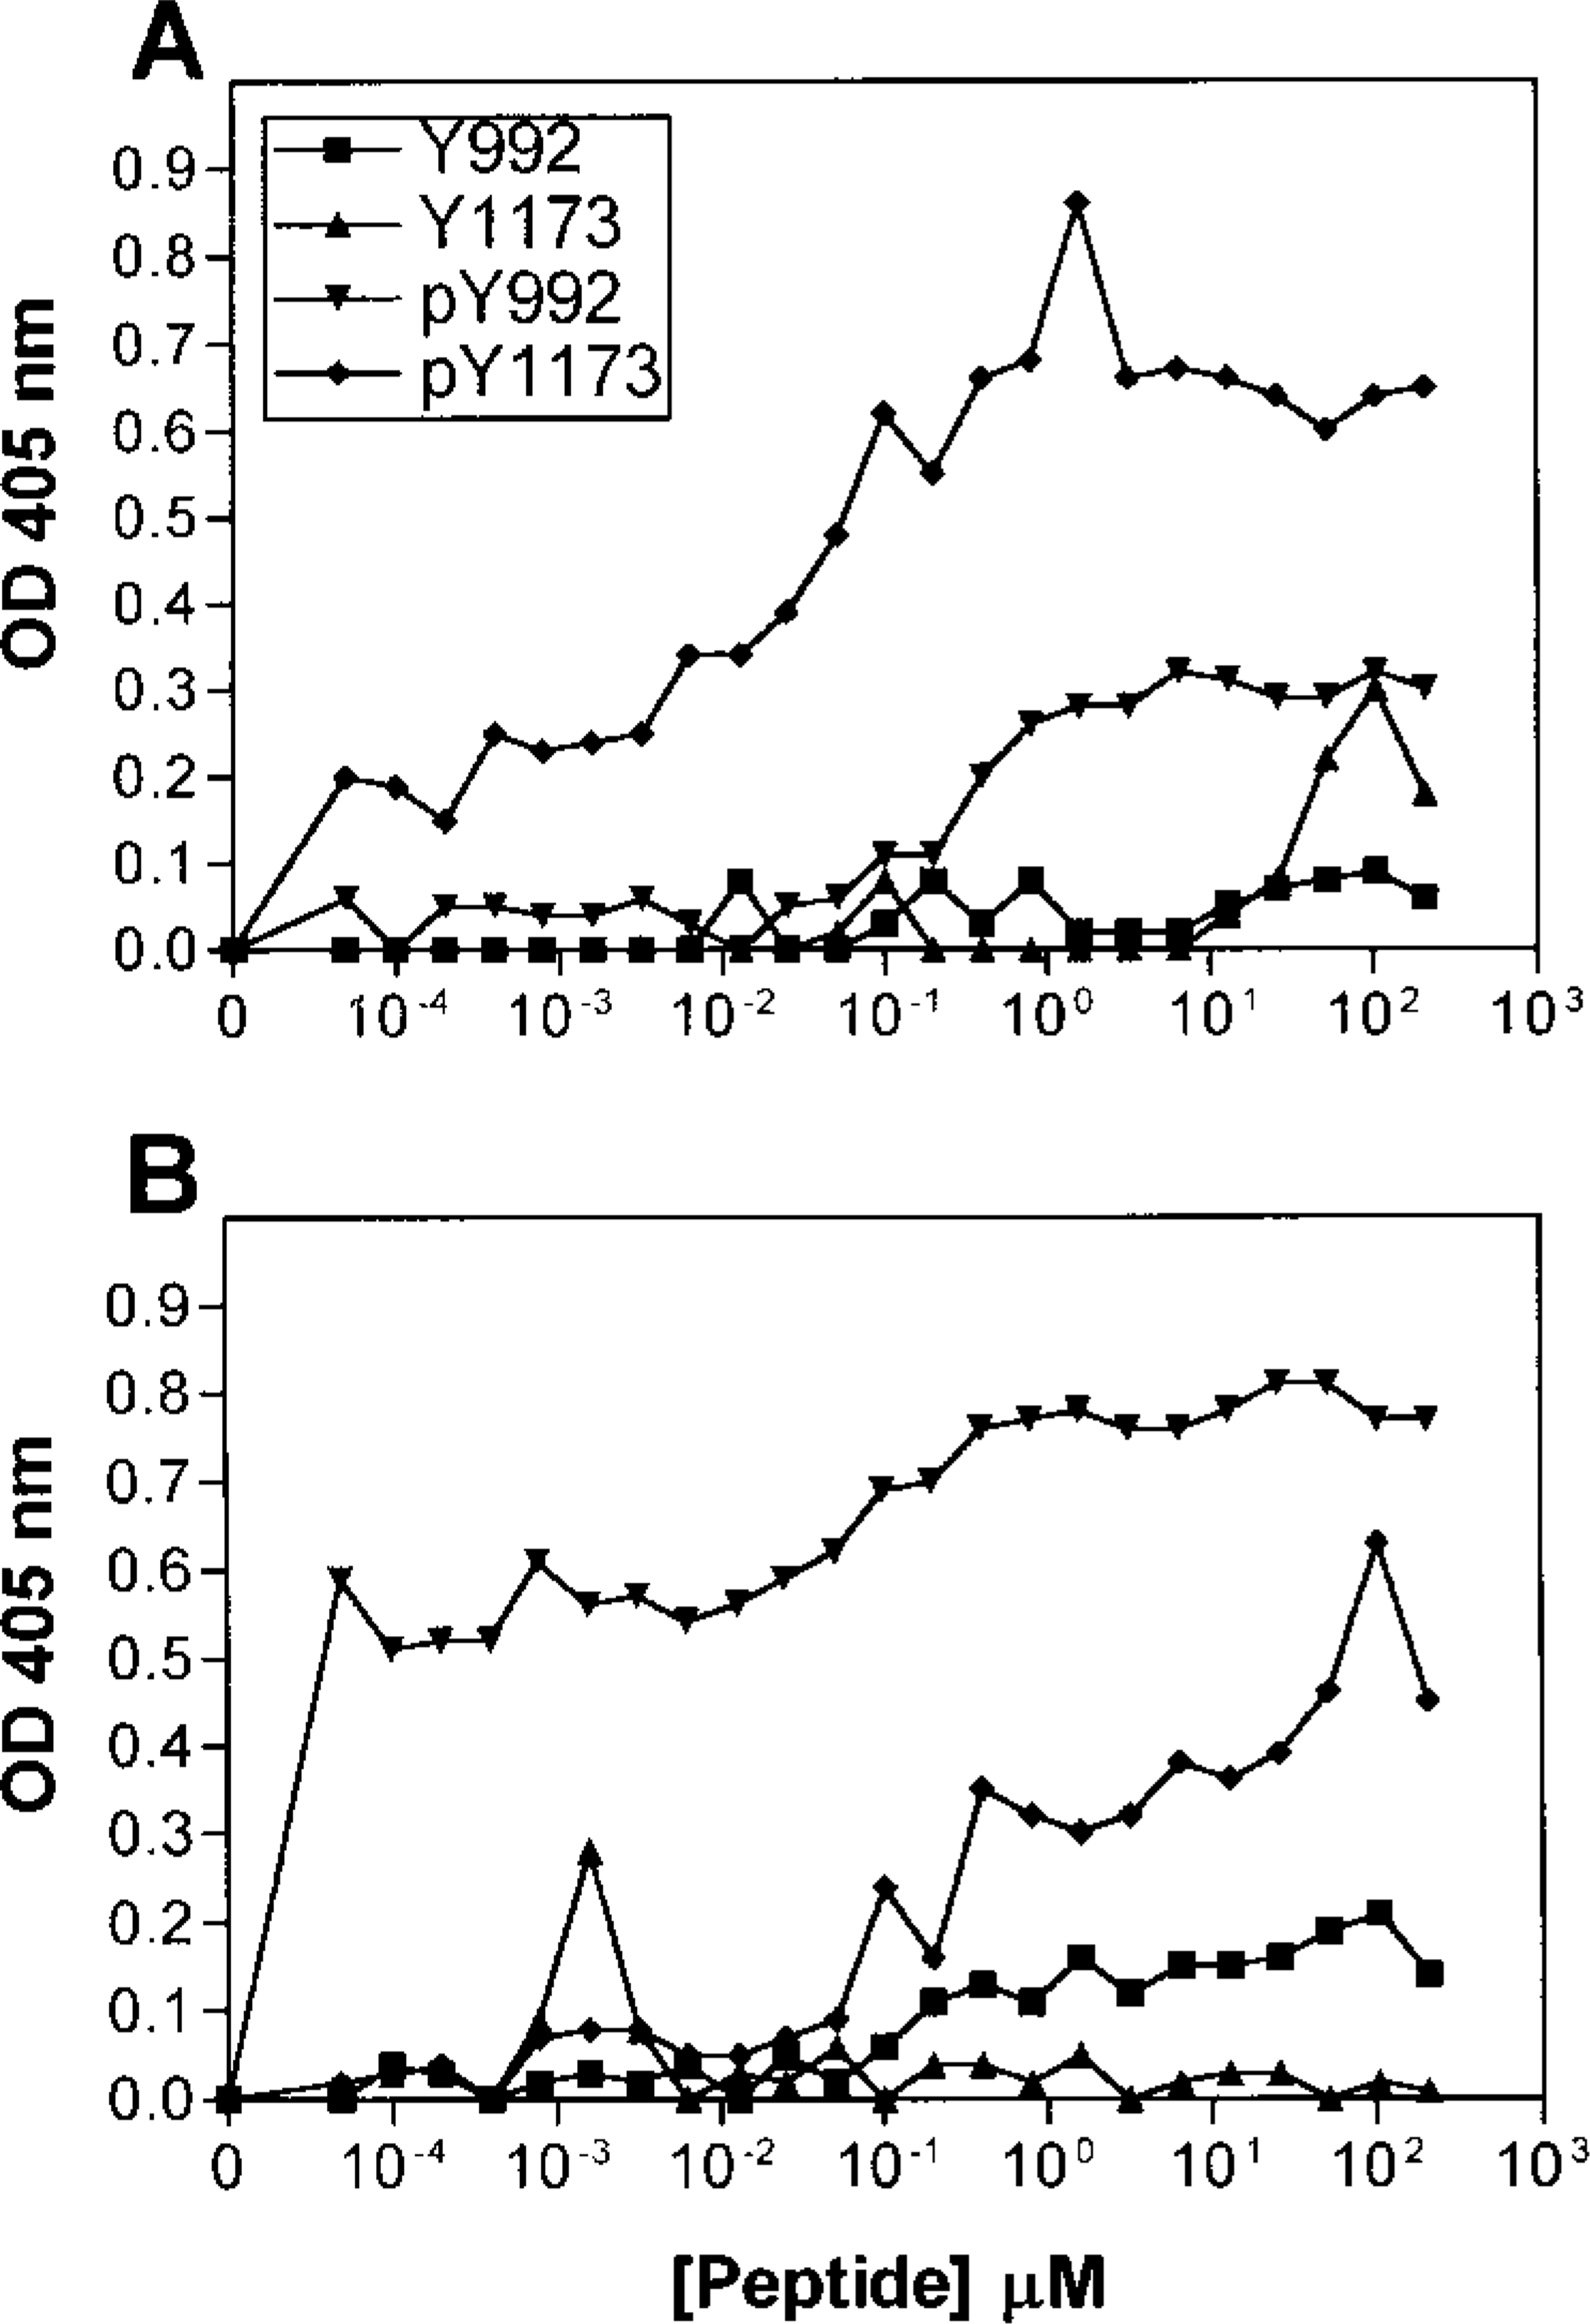
ELISA of R42/pY1173 (
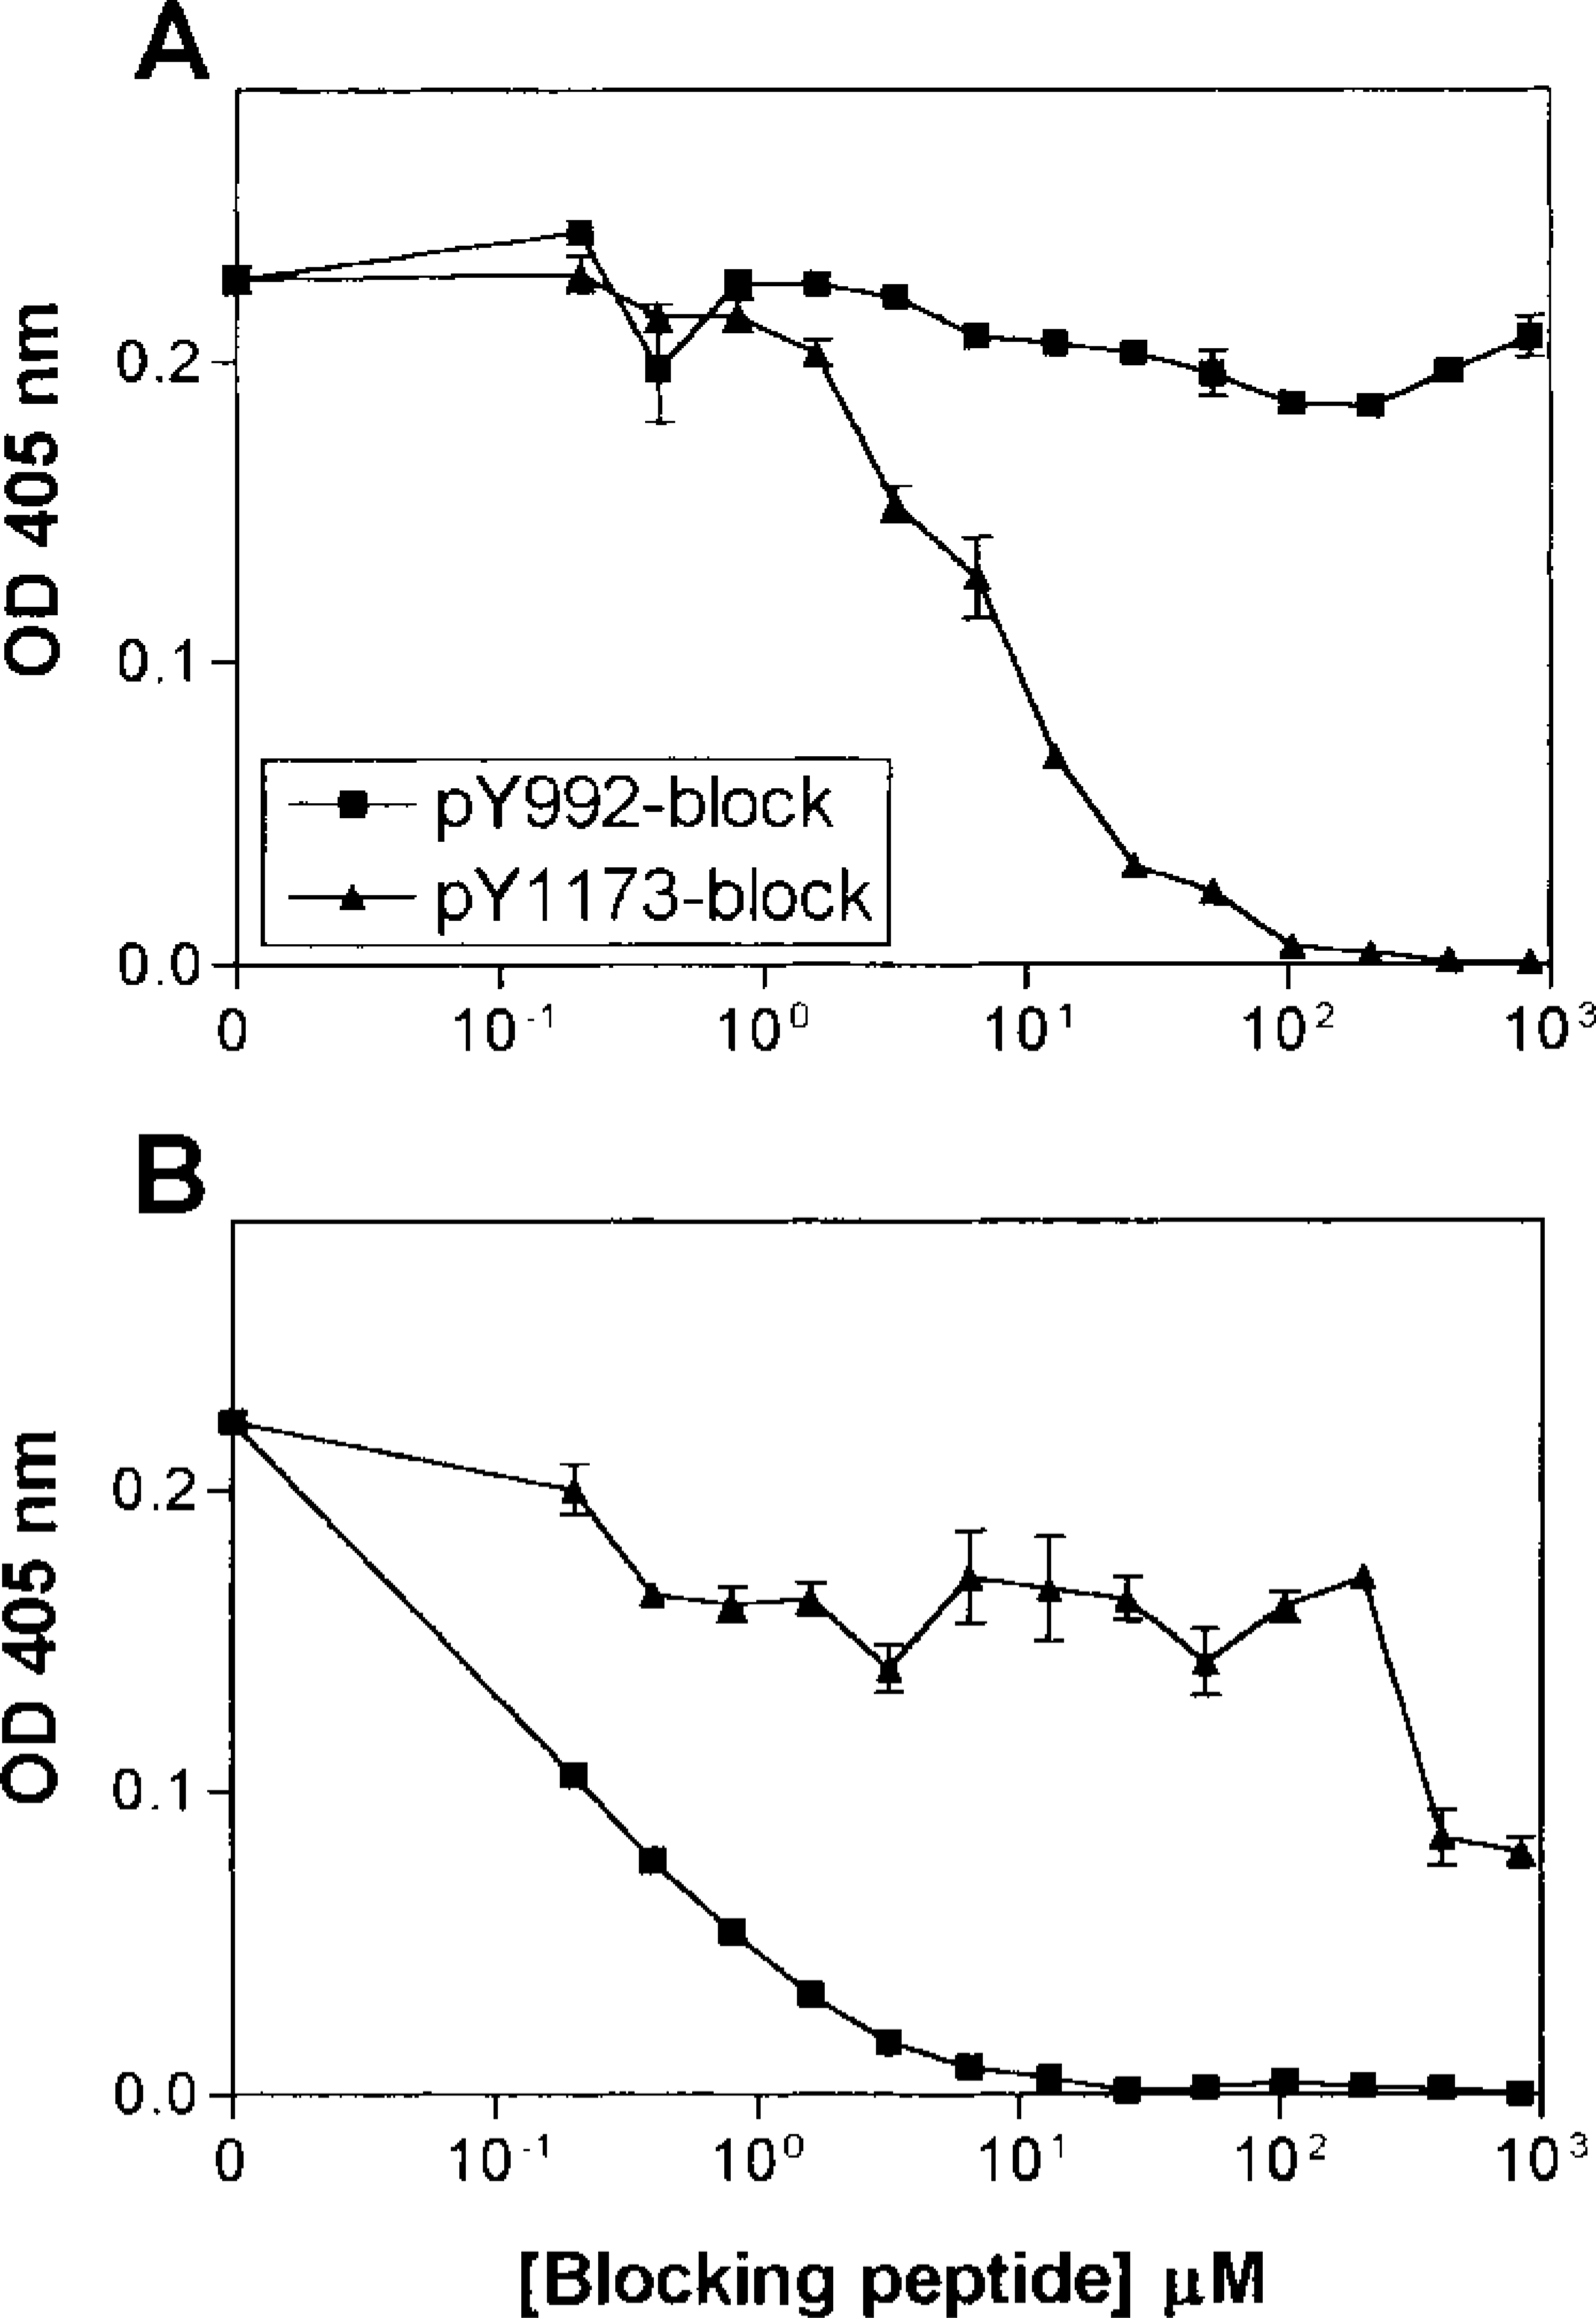
ELISA competition assay. Immunoreactivity of R42/ pY1173 and R46/pY992 as a function of the concentration of blocking peptide pY992 or pY1173. Wells coated with pY1173 (
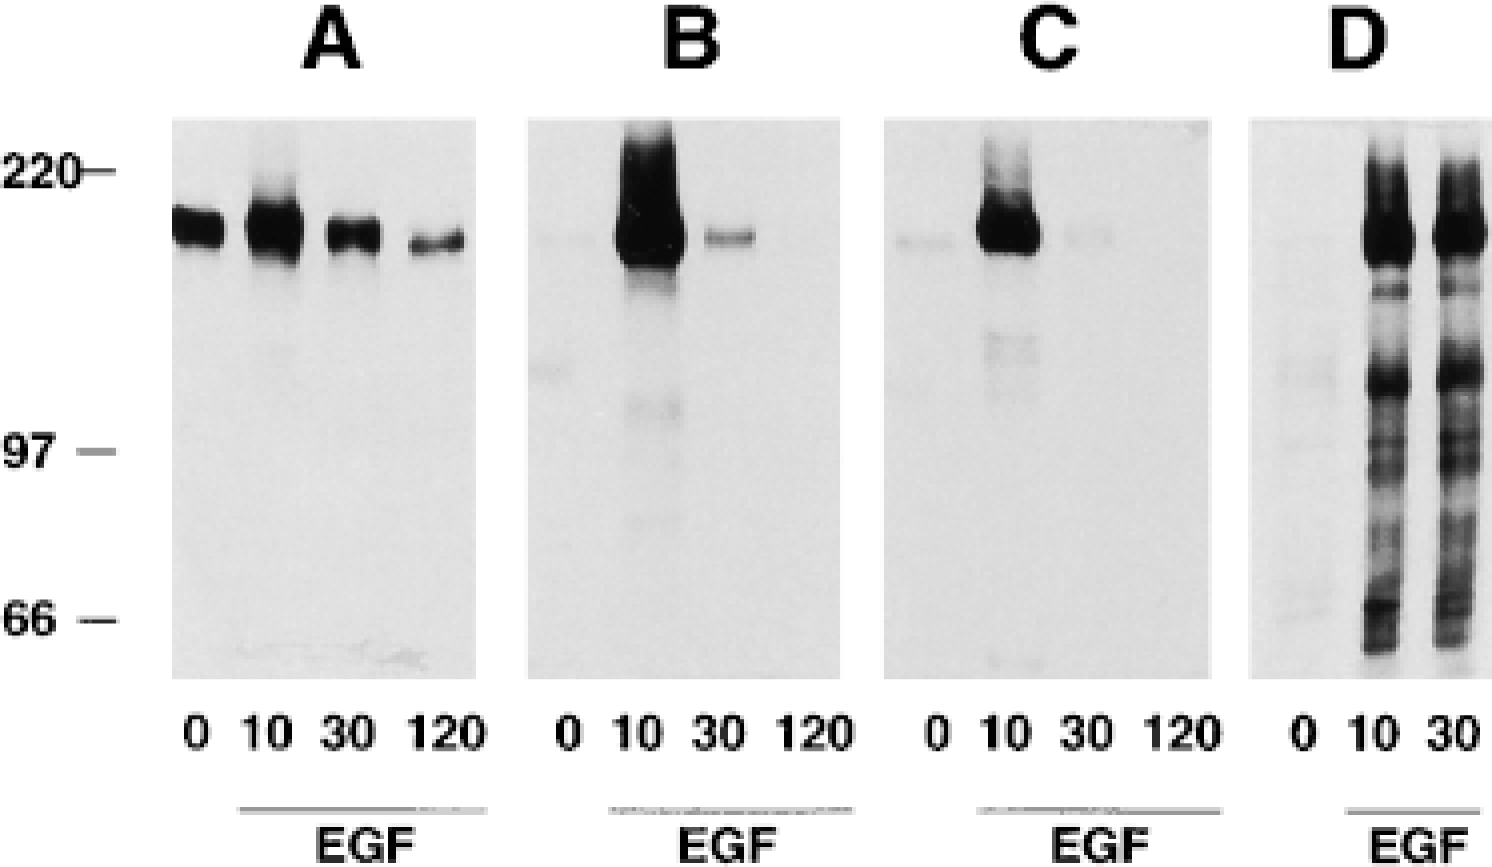
Western blot analysis of HeLa cell lysates. Control and EGF-stimulated cells were harvested at indicated time points after EGF stimulation. Downregulation of EGFR in response to EGF was detected with anti-EGFR (
Immunocytochemical localization of EGFR in unstimulated cells (
Characterization of the EGFR-containing compartment of EGF-stimulated cells chased for 10 min by two-color immunofluorescence confocal microscopy. Combination of anti-EGFR (
Expression and Tyrosine Phosphorylation of EGFR after EGF Stimulation
To follow the time course of EGFR phosphorylation after ligand binding and internalization, cell lysates from EGF-stimulated HeLa cells chased for 10 min, 30 min, and 120 min were analyzed by SDS-PAGE and immunoblotting. Western blotting revealed that the total amount of EGFR was downregulated after EGF stimulation (Figure 3A). Immunoblotting with R42/pY1173 and R46/pY992 antisera showed little or no reactivity in lysates of unstimulated HeLa cells, whereas both antisera showed strong reactivity with a single 170-kD band corresponding to EGFR after EGF stimulation (Figures 3B and 3C, respectively). The two SH2 binding sites Y992 and Y1173 were strongly phosphorylated 10 min after EGF stimulation, and both sites were dephosphorylated after a 120-min chase. To further verify the specificity of R42/pY1173 and R46/pY992, we compared the immunoreactivity of these antisera with an antibody to phosphotyrosine (4G10). Immunoblotting was performed on lysates from control and EGF-stimulated HeLa cells. The mouse anti-phosphotyrosine antibody detected several bands after EGF stimulation, whereas the R42/ pY1173 and R46/pY992 antisera detected only one band representing phosphorylated EGFR (compare Figure 3D with Figures 3B and 3C). Although the initial tyrosine phosphorylation signal detected with R42/ pY1173 and R46/pY992 was stronger than the EGFR phosphorylation detected by 4G10, the latter appeared to last longer.
Trafficking of EGFR Through the Degradative Pathway
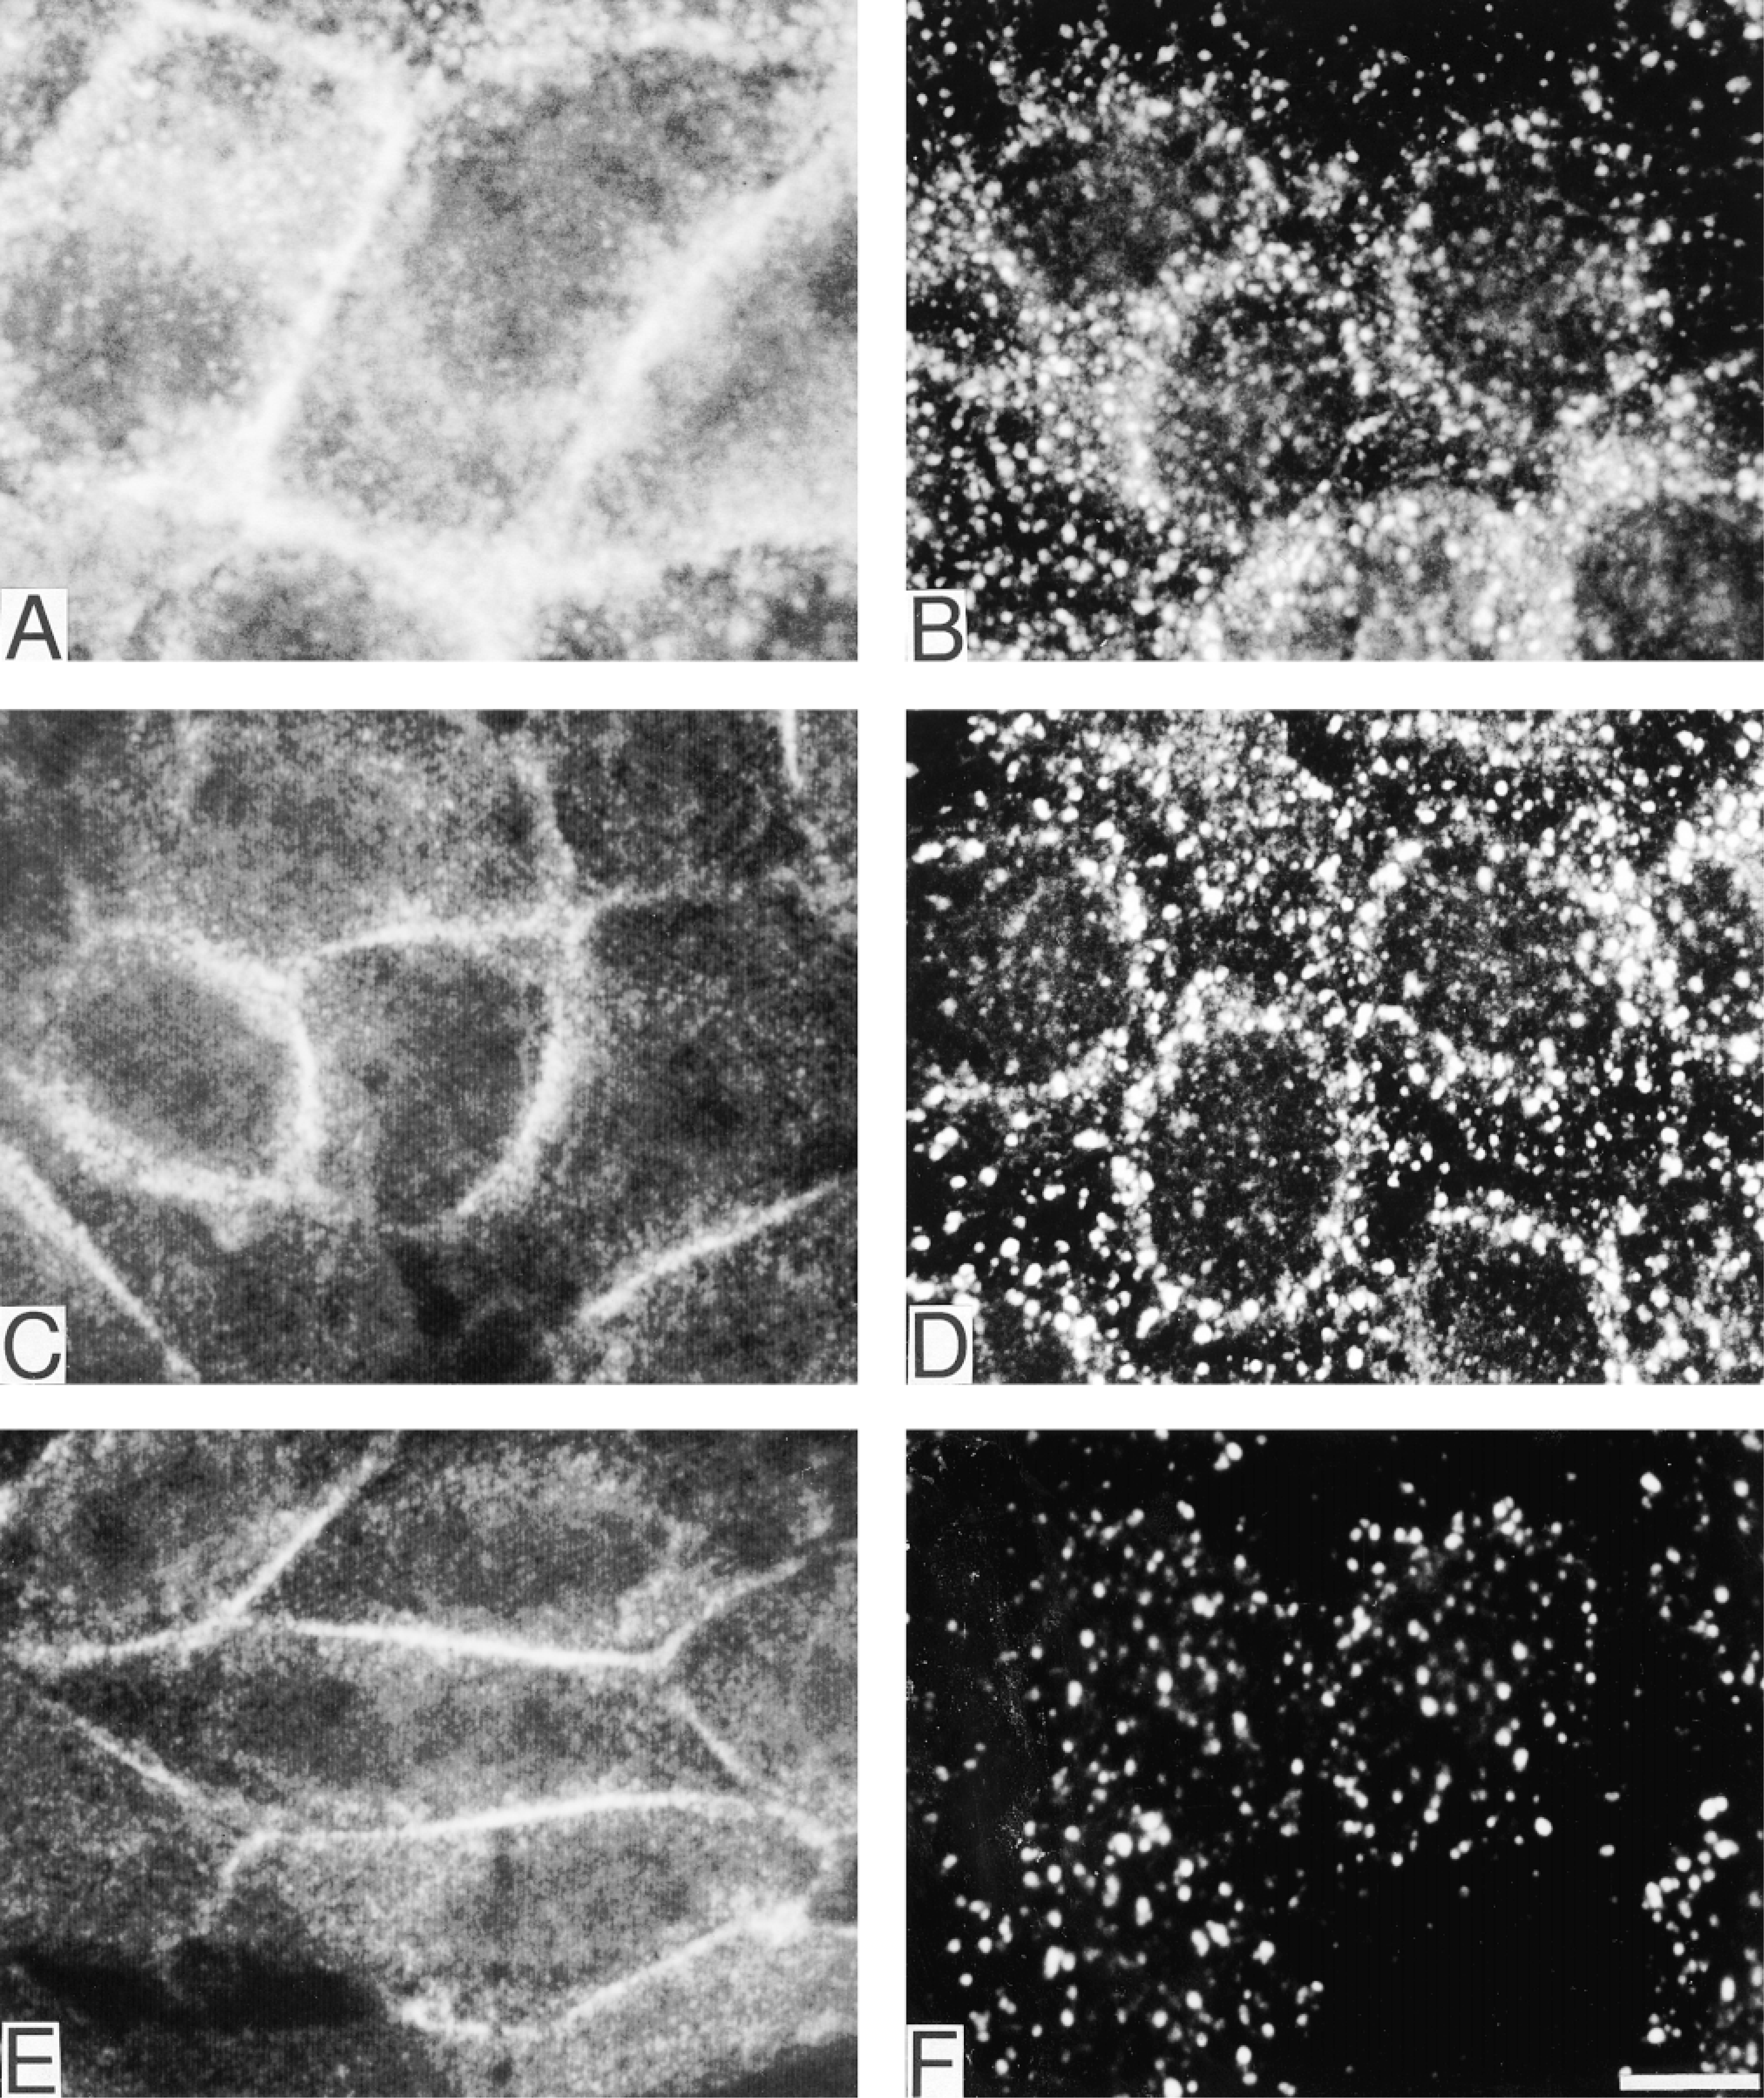
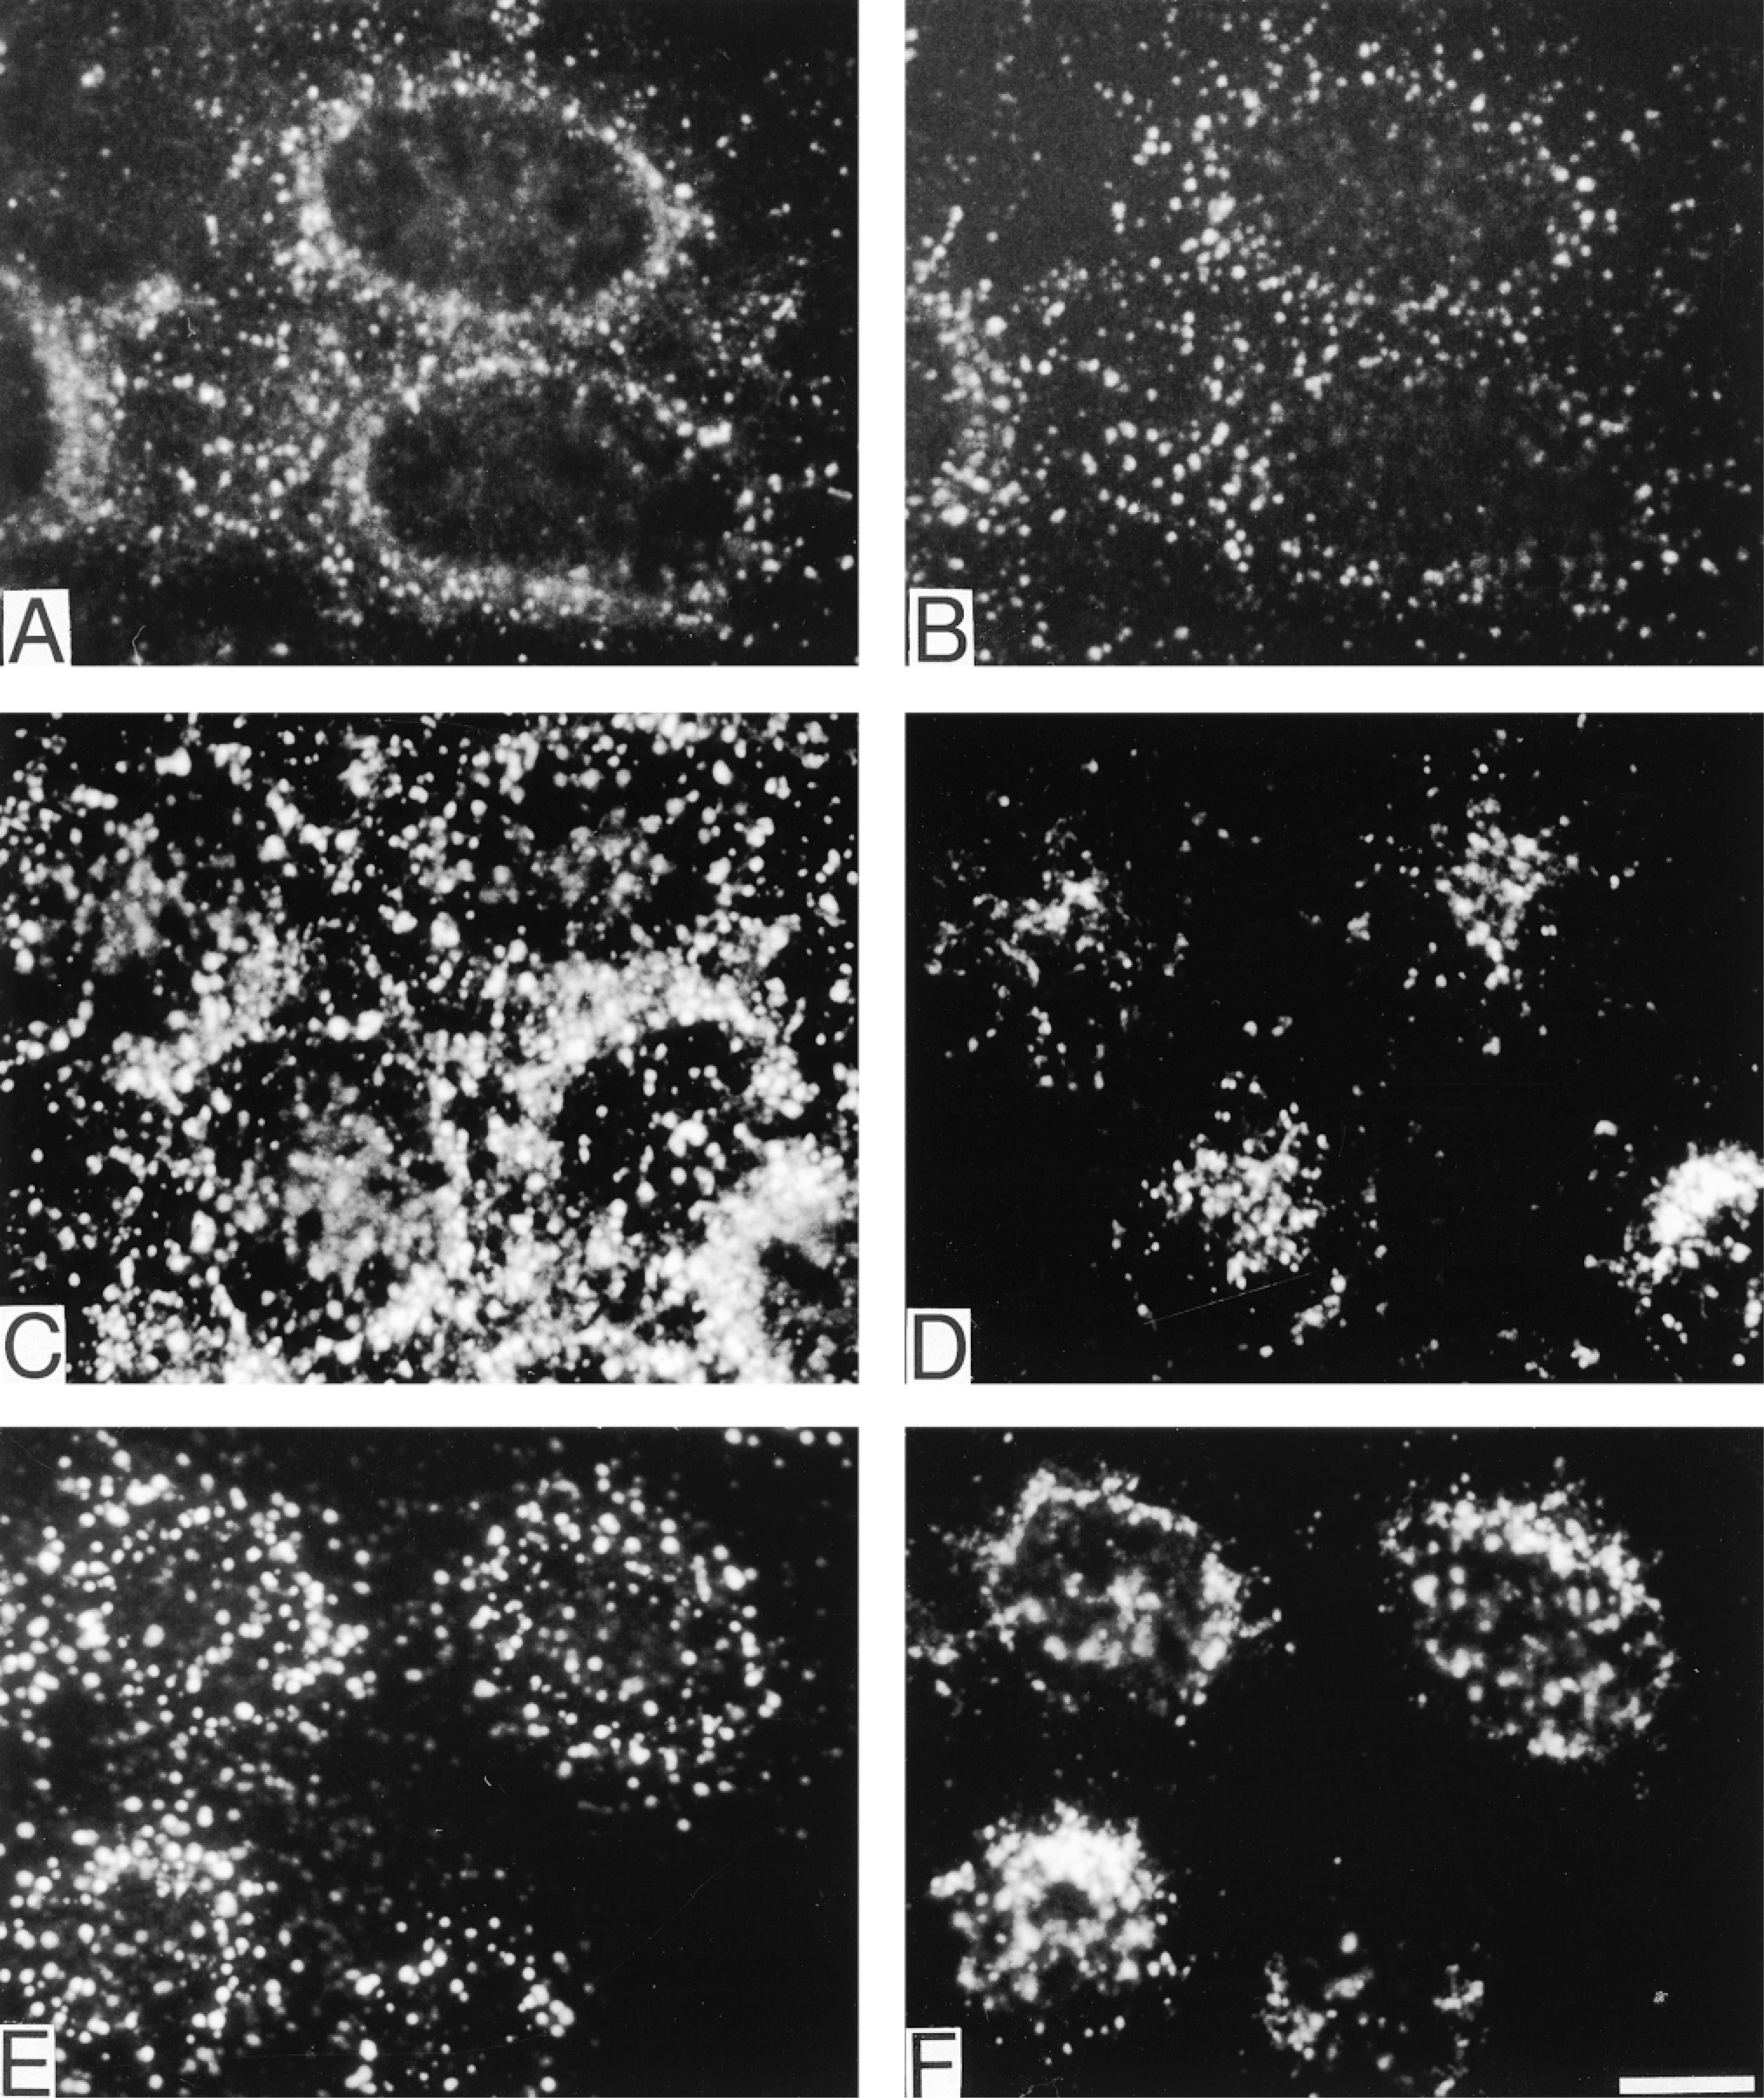
The intracellular localization of total EGFR and tyrosine-phosphorylated EGFR before and after EGF stimulation was investigated by two-color indirect immunofluorescence microscopy and confocal laser scan microscopy. In unstimulated cells, EGFR was predominantly located along the plasma membrane (Figure 4A). After EGF stimulation and a 10-min chase, EGFR had translocated to cytoplasmic vesicles (Figure 4B). Staining with the R42/pY1173 or R46/pY992 antiserum showed an EGF-dependent redistribution of activated EGFR. In EGF-stimulated cells on ice without chase, both Y1173- and Y992-phosphorylated EGFR were located along the plasma membrane (Figures 4C and 4E, respectively). After a 10-min chase, EGFR containing pY1173 or pY992 had translocated to cytoplasmic vesicles (Figures 4D and 4F, respectively). Two-color immunostaining combining anti-EGFR and anti-EEA1 (Figures 5A and 5B, respectively) or anti-LAMP-1 (Figures 5C and 5D, respectively) revealed that these vesicles were predominantly early endosomes. When anti-EEA1 and anti-LAMP-1 were combined, a minimal overlap was seen (Figures 5E and 5F, respectively).
Early Endosomes Contain Y992- and Y1173-phosphorylated EGFR
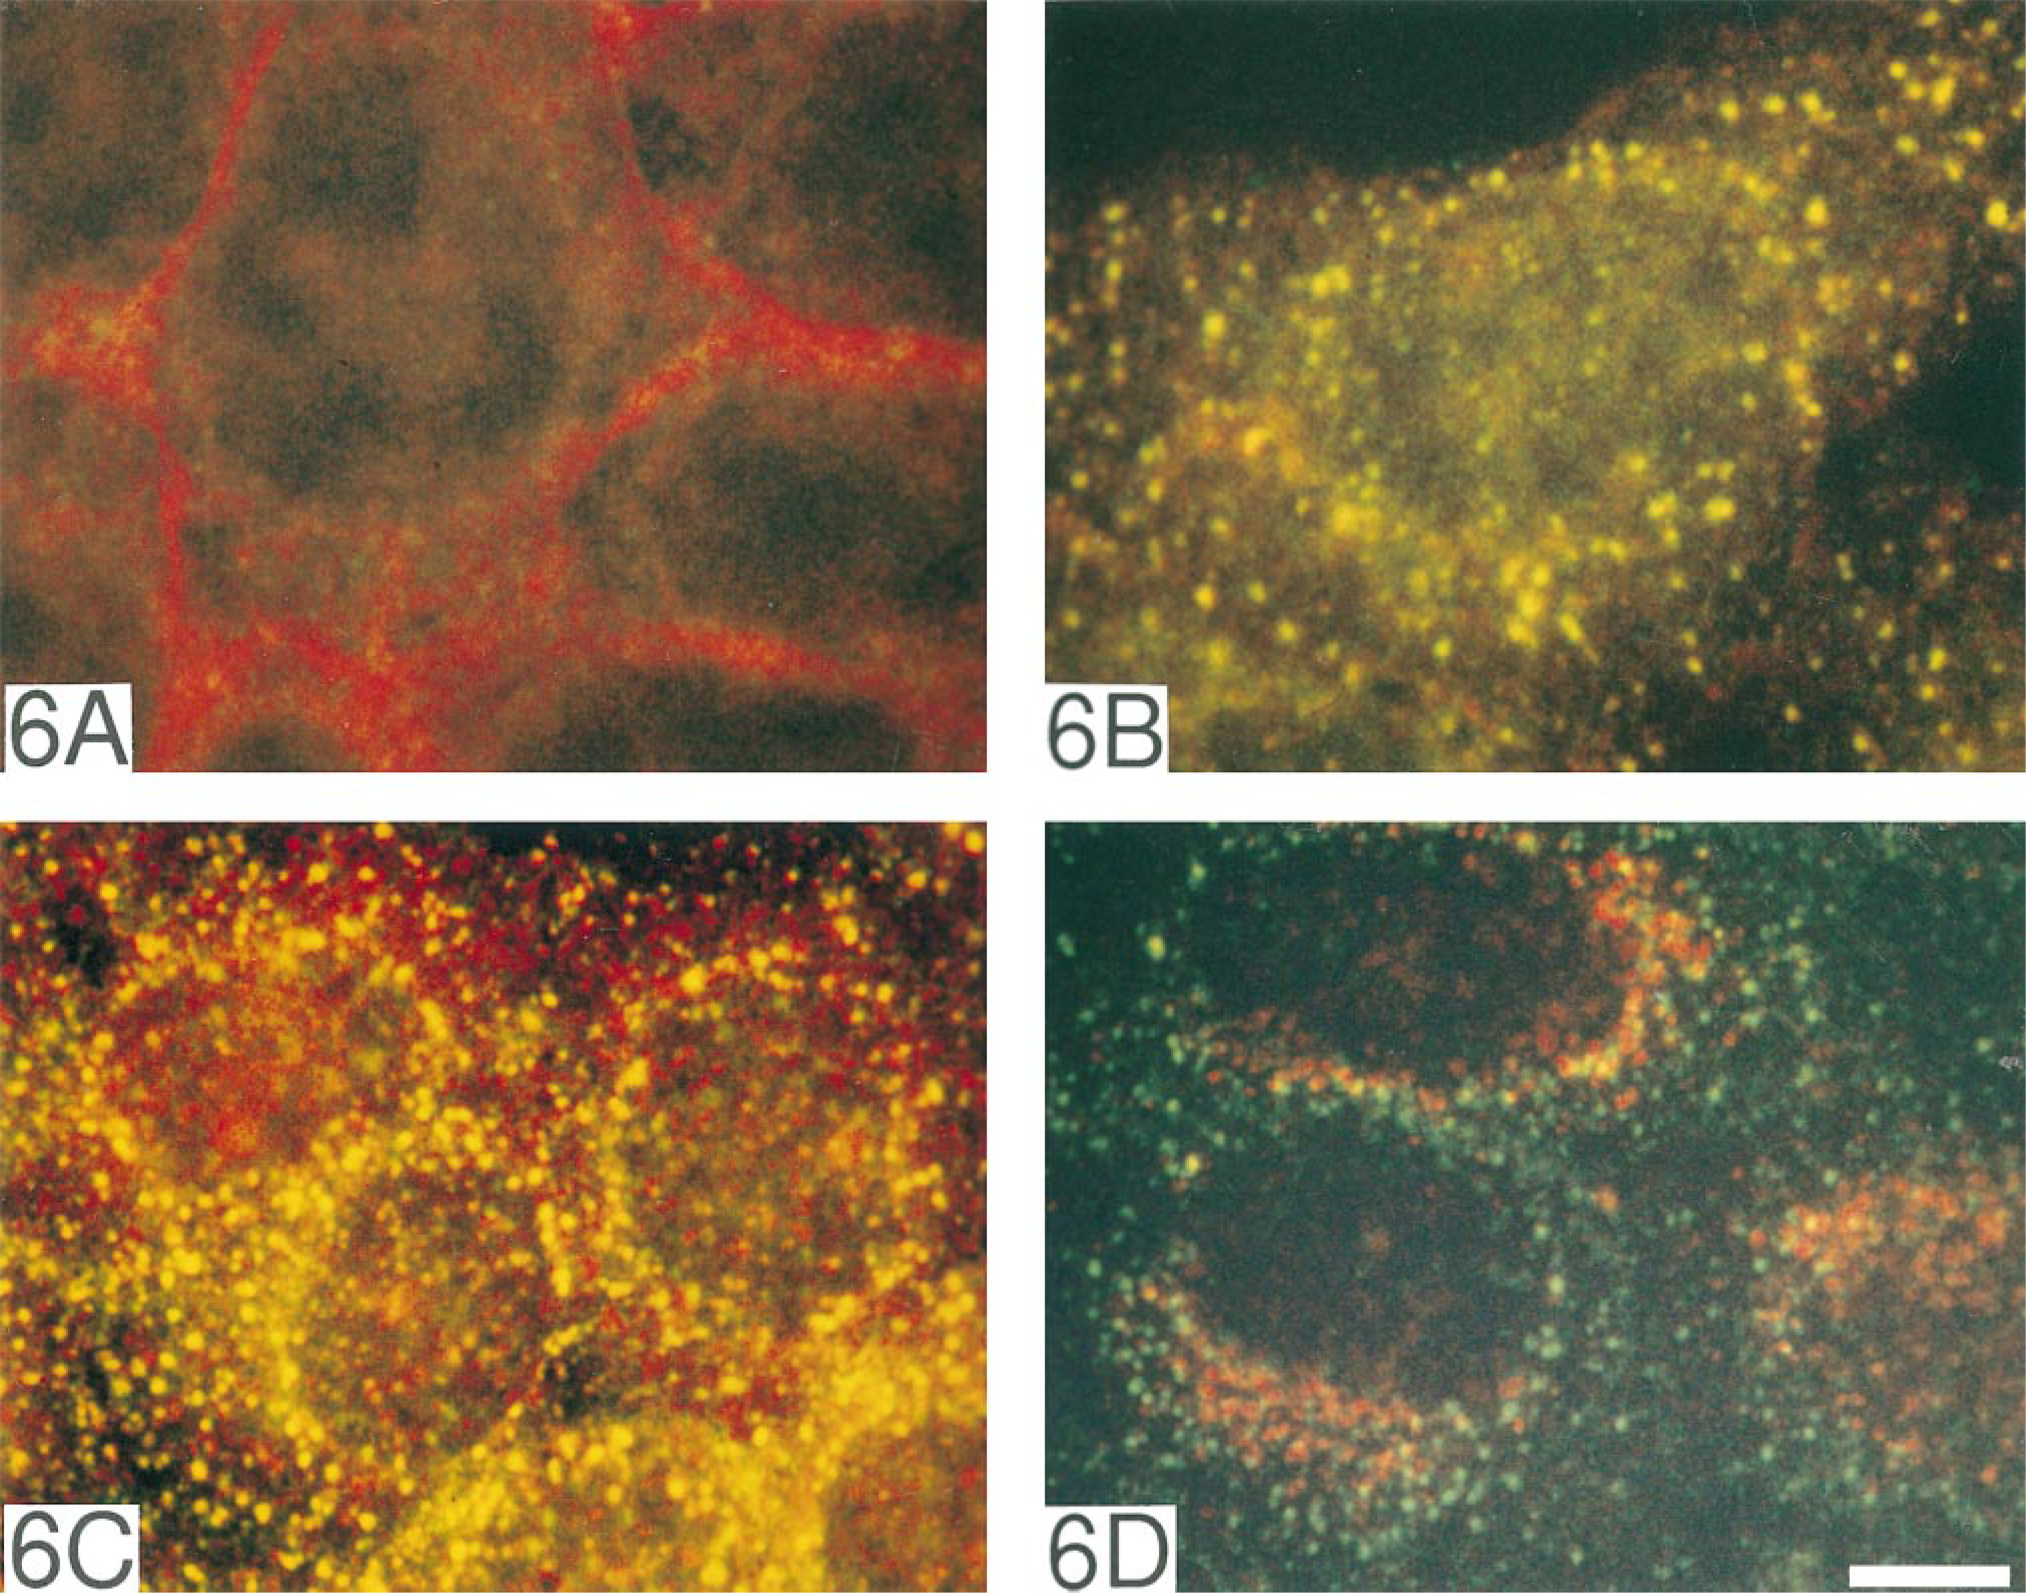
In unstimulated cells, immunofluorescence staining was not observed with antisera R42/pY1173 and R46/ pY992 (Figure 6A, green). Furthermore, the unactivated EGFR was predominantly localized along the plasma membrane (Figure 6A, red). After EGF stimulation on ice and a 10-min chase period, both R42/ pY1173 and anti-EGFR showed strong immunofluorescence staining in the same cytoplasmic vesicles (Figure 6B). Two-color immunofluorescence demonstrated that the majority of vesicles containing Y1173-and Y992-phosphorylated EGFR co-localized with the early endosome marker EEA1 (Figures 6C, 7A, and 7B). Only a small fraction of late endosomes and lysosomes detected with anti-LAMP-1 showed staining for pY1173-phosphorylated EGFR (Figure 6D). No difference was observed between the immunofluorescence staining patterns of R42/pY1173 and R46/pY992.
Shc Redistribution to Early Endosomes
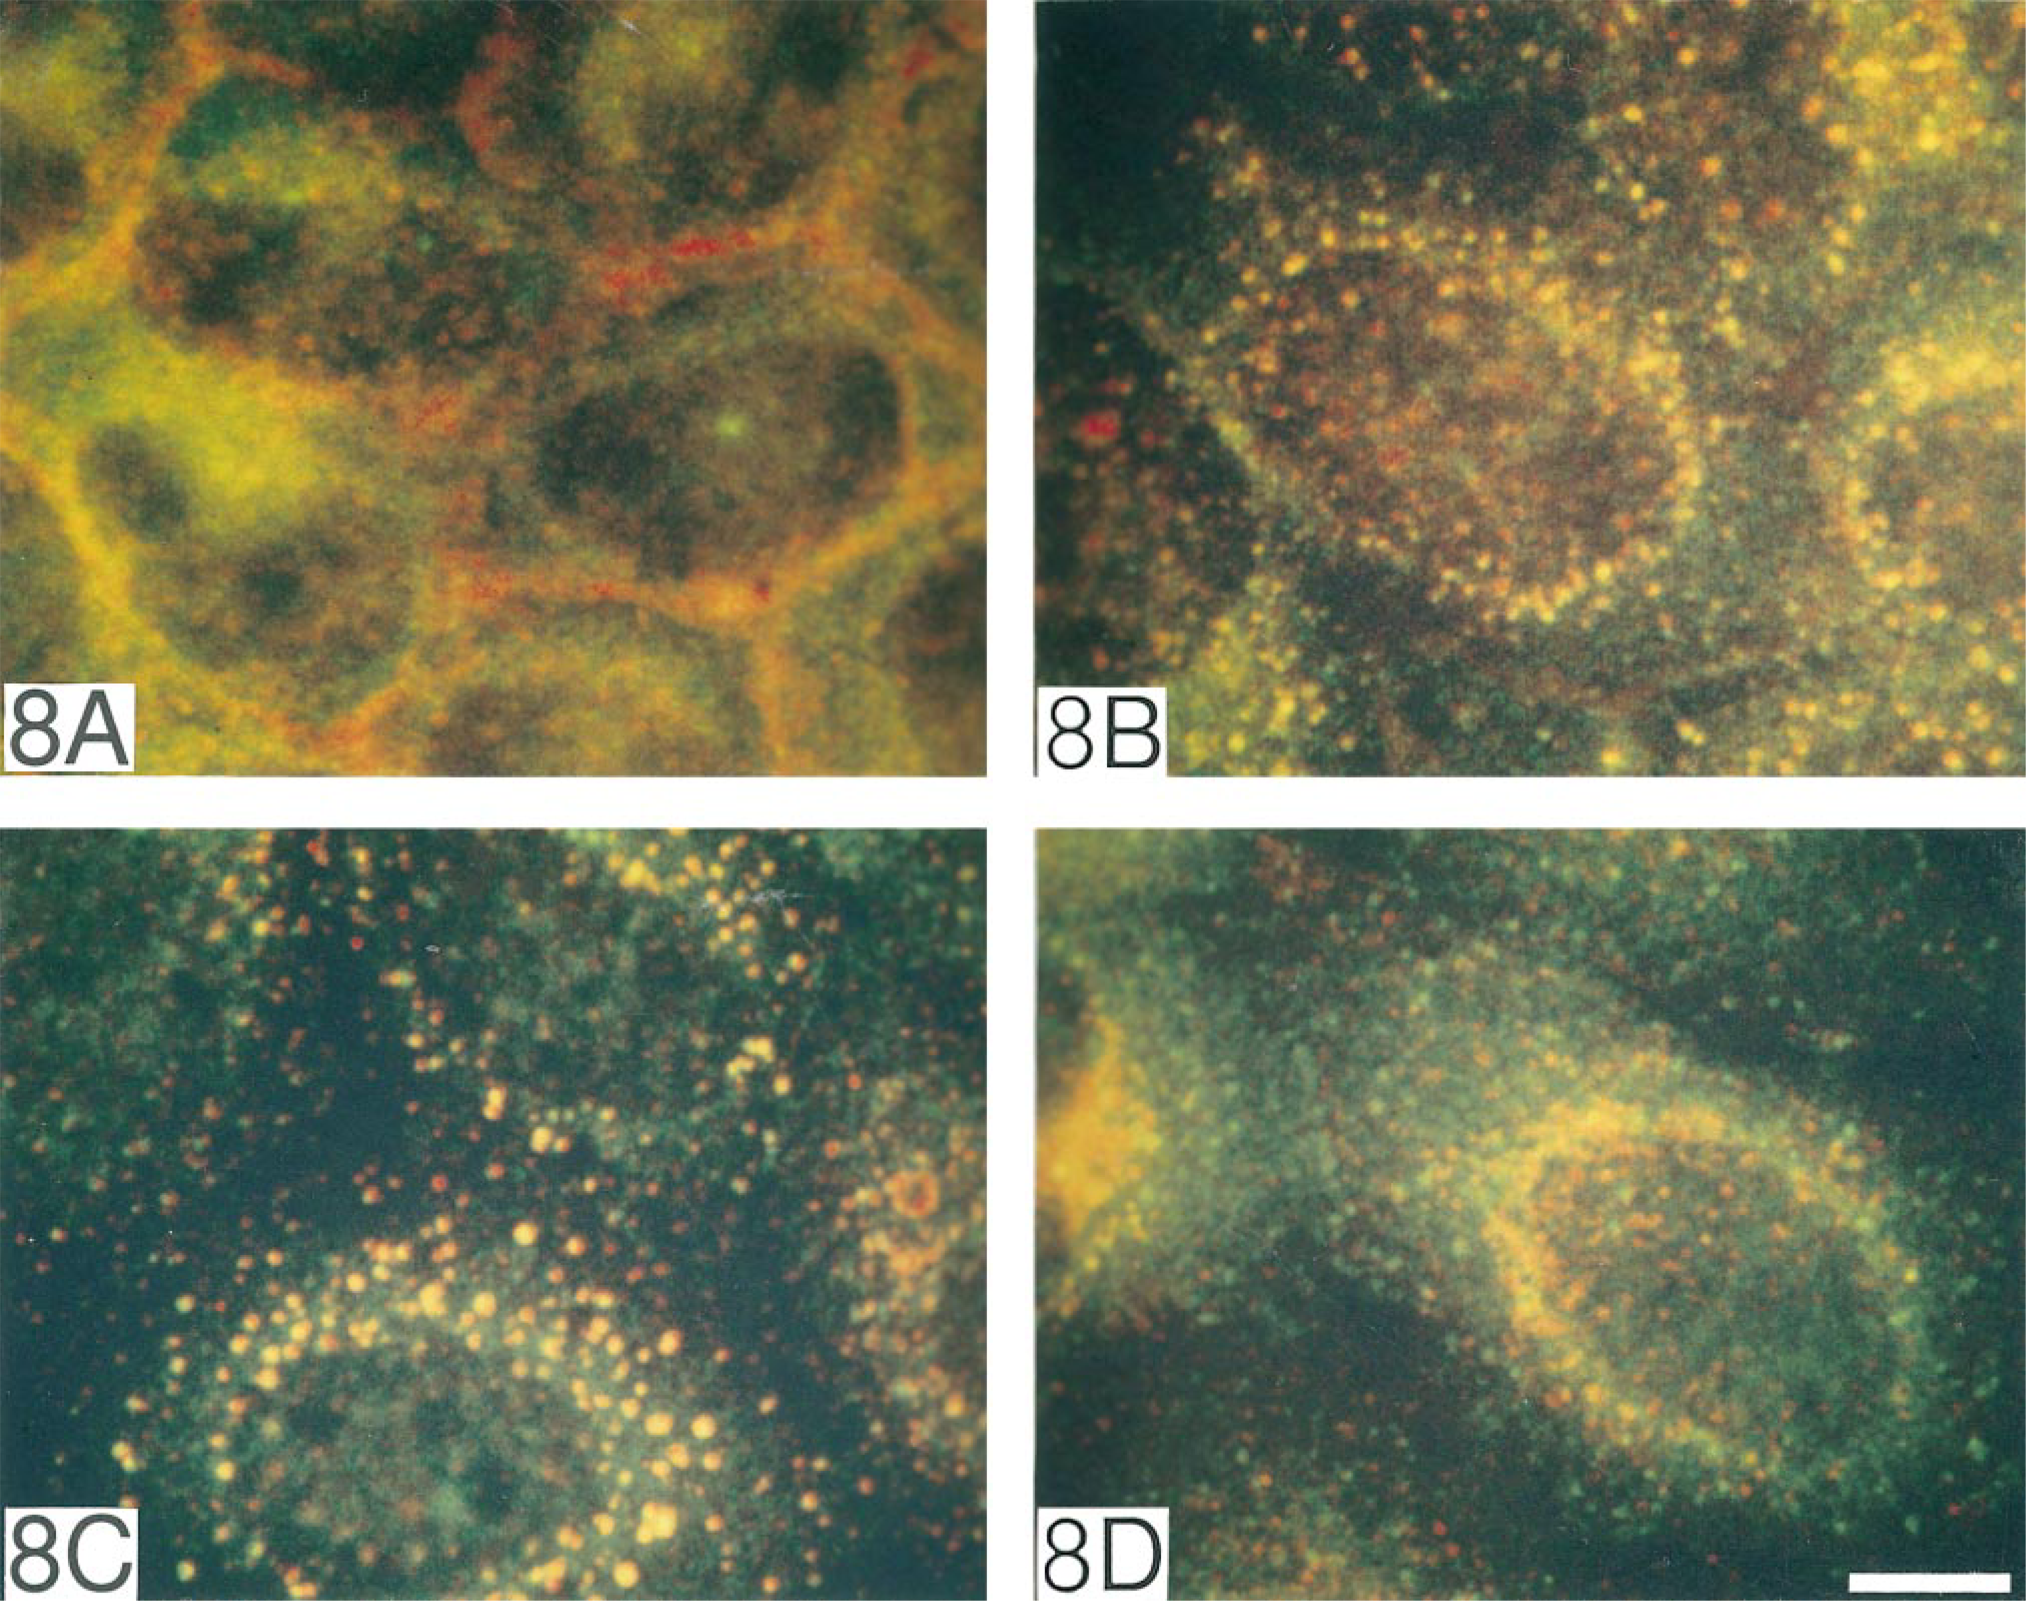
To see if the tyrosine-phosphorylated EGFR in endosomes co-localized with downstream transducers, we performed two-color immunocytochemistry for EGFR and Shc. In unstimulated cells, diffuse cytoplasmic localization of Shc was observed, usually not overlapping with EGFR (Figure 8A). After EGF stimulation and EGFR internalization for 10 min, Shc showed redistribution to EGFR-containing cytoplasmic vesicles (Figure 8B). Redistribution of Shc to early endosomes was confirmed by two-color immunostaining with antiserum to EEA1 (Figure 8C). Minimal co-localization of Shc and LAMP-1 confirmed a predominantly early endosomal localization of Shc (Figure 8D).
Detection of Phosphorylated EGFR in Vesicles by Immunoelectron Microscopy
To confirm intravesicular localization of autophosphorylated EGFR, we performed gold-immunolabeling electron microscopy using sheep anti-EGFR and R42/pY1173 antisera. In unstimulated cells, EGFR was predominantly found in clusters along the non-clathrin-coated plasma membrane (Figure 9A). After a 10-min and 30-min chase of EGF-stimulated cells, EGFR was observed in vesicular structures resembling early endosomes (Figure 9B) and in multivesicular endosomes (Figure 9C), respectively. After a 10-min chase period, Y1173-phosphorylated EGFR was predominantly found along membranes surrounding electron-lucent vesicular or cistern-shaped structures, which presumably represented early endosomes (Figure 9D). EGFR pY1173 was also detected at internal membrane structures of compartments resembling early endosomes (Figure 9E). To assess whether the EGFR downstream adaptor protein Shc was located in EGFR-containing compartments after the 10-min chase period, we performed double staining for EGFR and Shc. In unstimulated cells, Shc was found throughout the cytosol and no clear association with vesicular membrane structures was seen (Figure 9F). In EGF-stimulated cells chased for 10 min, Shc was associated with EGFR-containing vesicular membrane structures that resembled early endosomes. It was found predominantly in the outer membrane and in membrane structures, which presumably represented endosomal membrane tubules (Figure 9G).
Localization and phosphorylation of EGFR by two-color immunofluorescence confocal microscopy. Unstimulated cells were stained with anti-EGFR (Texas Red) and R42/pY1173 (FITC). EGFR was localized along the plasma membrane (red emission), whereas immunofluorescence staining from pY1173 (green emission) was not detected (
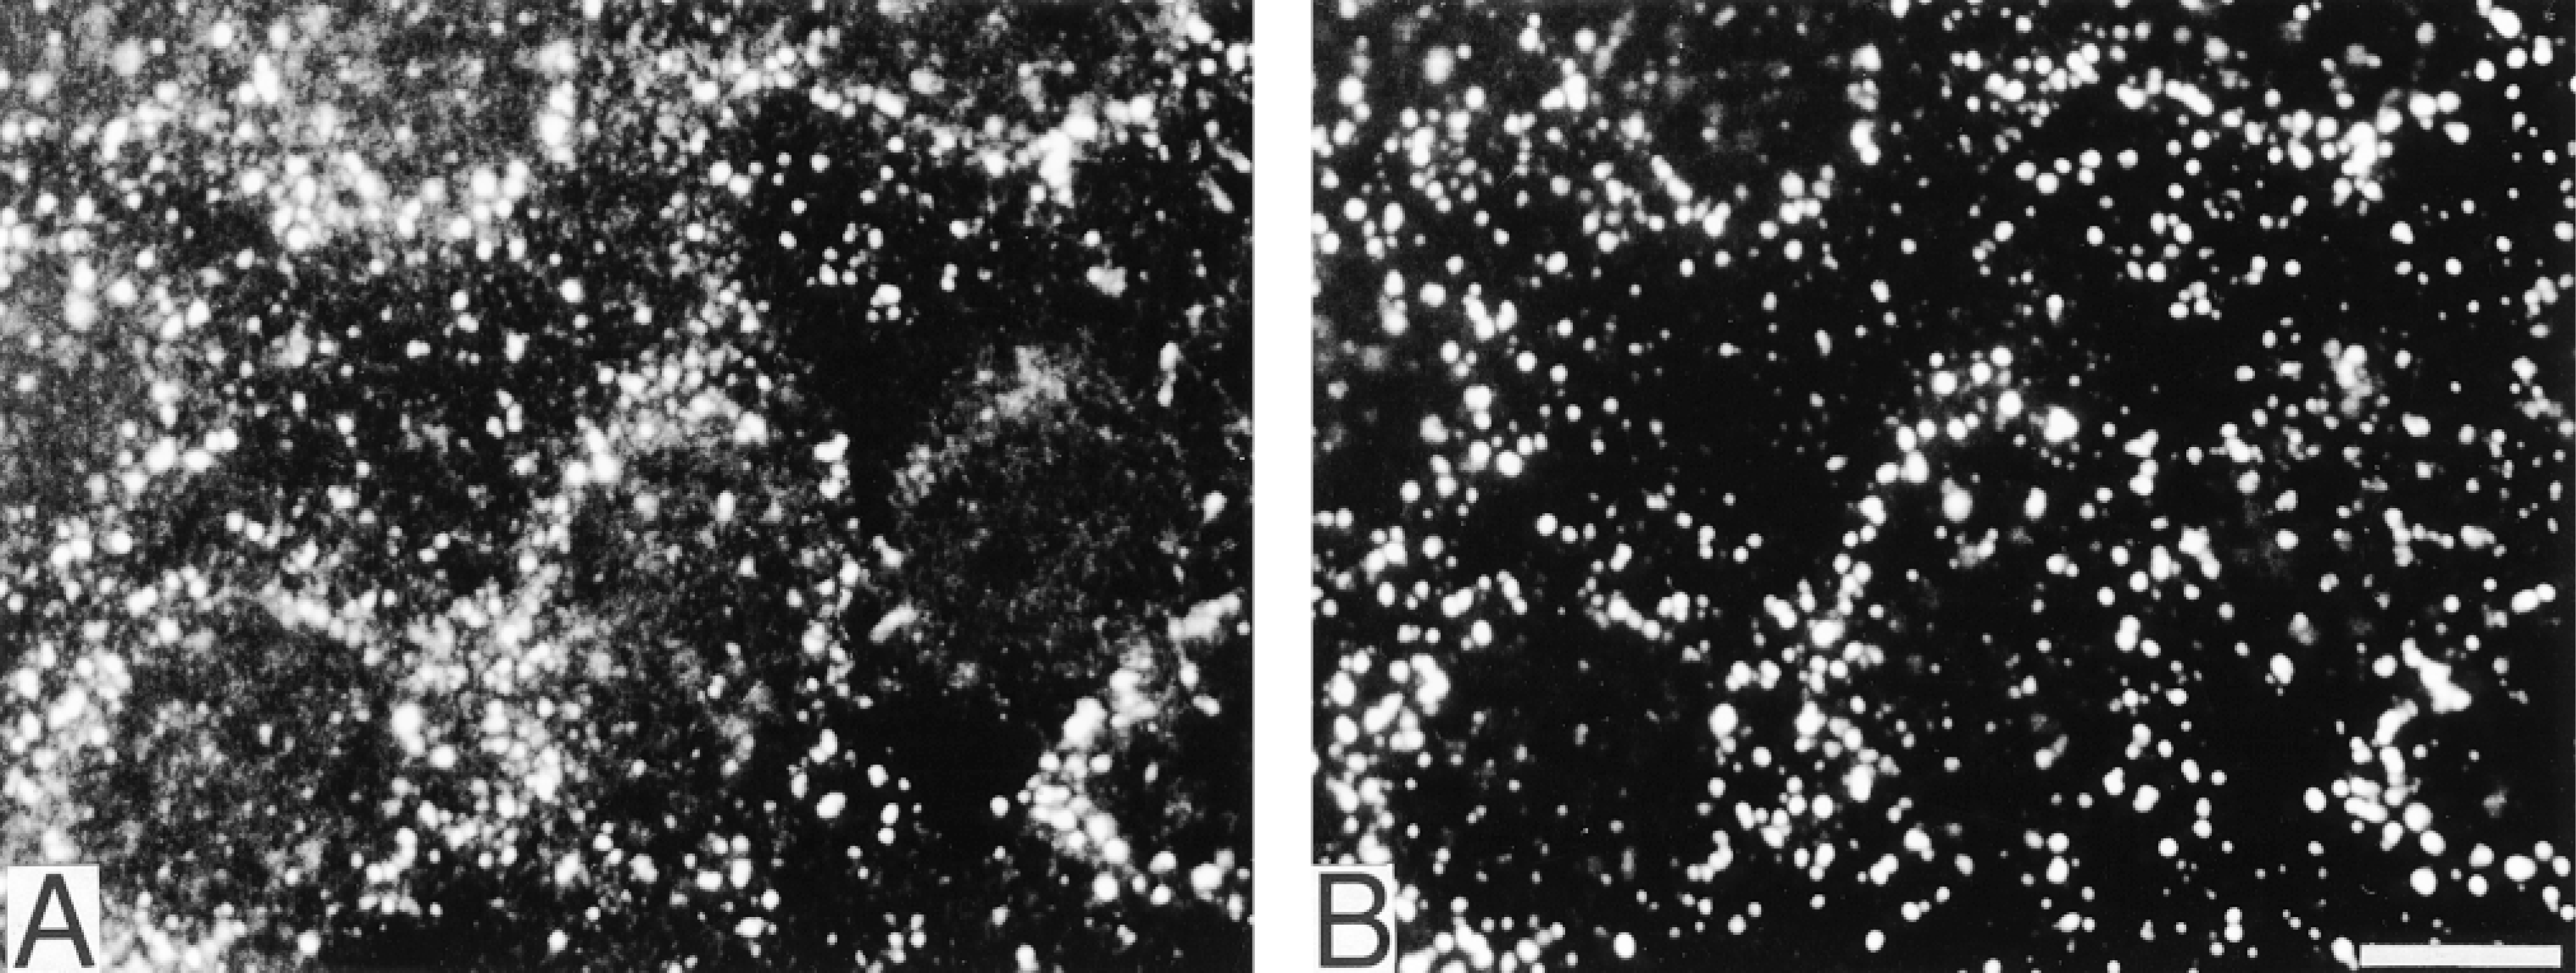
Two-color immunodetection of Y992-phosphorylated EGFR and EEA1 after EGF stimulation followed by a 10-min chase period. Staining with R46/pY992 (
Discussion
In this study we demonstrated, by immunocytochemistry and immunoelectron microscopy, that after EGF stimulation of HeLa cells, Y1173- and Y992-phosphorylated EGFR translocated from the plasma membrane to cytoplasmic vesicles. Co-localization with the early endosome marker EEA1 identified the main autophosphorylated EGFR-containing compartment as early endosomes. This was consistent with the ultrastructural morphology of vesicles containing autophosphorylated EGFR. The adaptor protein Shc simultaneously redistributed to EGFR-containing endosomes. These findings imply that the activated EGFR-Shc complexes, which initiate MAPK activation, are located predominantly along the endocytic pathway.
Phosphotyrosine-specific antisera against two of the autophosphorylation sites of EGFR were developed for this study. The antisera recognized their respective tyrosine-phosphorylated peptides with much higher affinity than their unphosphorylated counterparts or the noncorresponding phosphorylated peptides. By Western blotting, phosphorylated EGFR was not detected in unstimulated cells, whereas strong immunoreactivity was found after EGF stimulation. Two-color immunofluorescence combined with confocal laser scanning microscopy offered the necessary resolution and specificity to study the intracellular distribution of signal transducers and their relation to specific intracellular organelles. We found that ligand-activated EGFR appeared to be phosphorylated at Y992 and Y1173 and co-localized with its main downstream signal transducer, the adaptor protein Shc, in early endosomes. Localization of tyrosine-phosphorylated EGFR in a small fraction of LAMP-1-positive organelles suggested that EGFR remained phosphorylated further down the lysosomal pathway, presumably in late endosomes or in an intermediate compartment.
The EGFR autophosphorylation sites Y1173 and Y992 chosen for these studies are both binding domains for Shc. It is not known whether EGFR phosphorylated at these different sites is sorted identically on internalization. Because it has been shown that, on average, each EGFR protein is tyrosine-phosphorylated at one site (Emlet et al. 1997), it is possible that different phosphorylation species are sorted to different intracellular compartments or show different activation or internalization kinetics. Recently, Emlet et al. (1997) demonstrated that Y992-phosphorylated EGFR exhibited a slower rate of endocytosis than the general pool of activated EGFR in A431 cells. In this study we found no difference in the phosphorylation or internalization pattern between EGFR phosphorylated at Y992 and Y1173 10 min after EGF stimulation. A431 cells internalize EGFR more slowly than HeLa cells do (Carpentier et al. 1982; Wiley and Cunningham 1982), and different internalization of Y992-and Y1173-phosphorylated EGFR may be found at earlier time points in HeLa cells.
Endocytic internalization and intracellular membrane routing of activated receptors may be significant for signal transduction and specificity. Autophosphorylation sites are important for proper endocytosis of receptor tyrosine kinases, and individual sites may determine specific routing of the receptor (Sorkin et al. 1991; Joly et al. 1995; Wang and Moran 1996; Emlet et al. 1997). Membrane fractionation studies of rat liver have demonstrated that a complex of EGFR and the signal mediators Shc, Grb2, and the Ras guanine exchange factor Sos are enriched in endosomes as a consequence of EGF stimulation (Di Guglielmo et al. 1994). This is in accordance with studies in HeLa cells showing that MAPK activation after EGF stimulation is severely inhibited in cells transfected with a mutant nonfunctional dynamin gene (Vieira et al. 1996). Recently, it has been shown that transfection with the mutated dynamin gene leads to severe downregulation of high-affinity EGFR, implying that this mutant may endure MAPK inhibition by other mechanisms than depleted endocytosis (Ringerike et al. 1998). EGF and TGFα convey different proliferative effects due to different sorting of the internalized ligand-bound EGFR (Skarpen et al. 1998). Two-color immunofluorescence procedures combining antibodies to activated signal transducers and specific organelle markers will be helpful in investigations of the membrane trafficking of signaling complexes.
Localization of Shc by two-color immunofluorescence and confocal microscopy. In unstimulated cells, EGFR immunofluorescence staining (Texas Red) was found along the plasma membrane, whereas Shc showed a predominantly cytoplasmic immunostaining (FITC,
By immunoelectron microscopy, we detected tyrosine-phosphorylated EGFR in the outer membrane as well as in internal membrane structures of vesicles. According to Marsh et al. (1986) and Gruenberg et al. (1989), the early endosomes represent a network of tubular and tubulovesicular structures. Therefore, EGFR signaling may also occur from apparently internal endosomal membrane structures. Alternatively, the internal endosomal membrane structures may be small vesicles trapped in the lumen of endosomes without any communication with the cytoplasm. The tyrosine-phosphorylated EGFR and attached downstream signal mediators may thus be sequestered and processed for lysosomal degradation even in a biochemically active form.
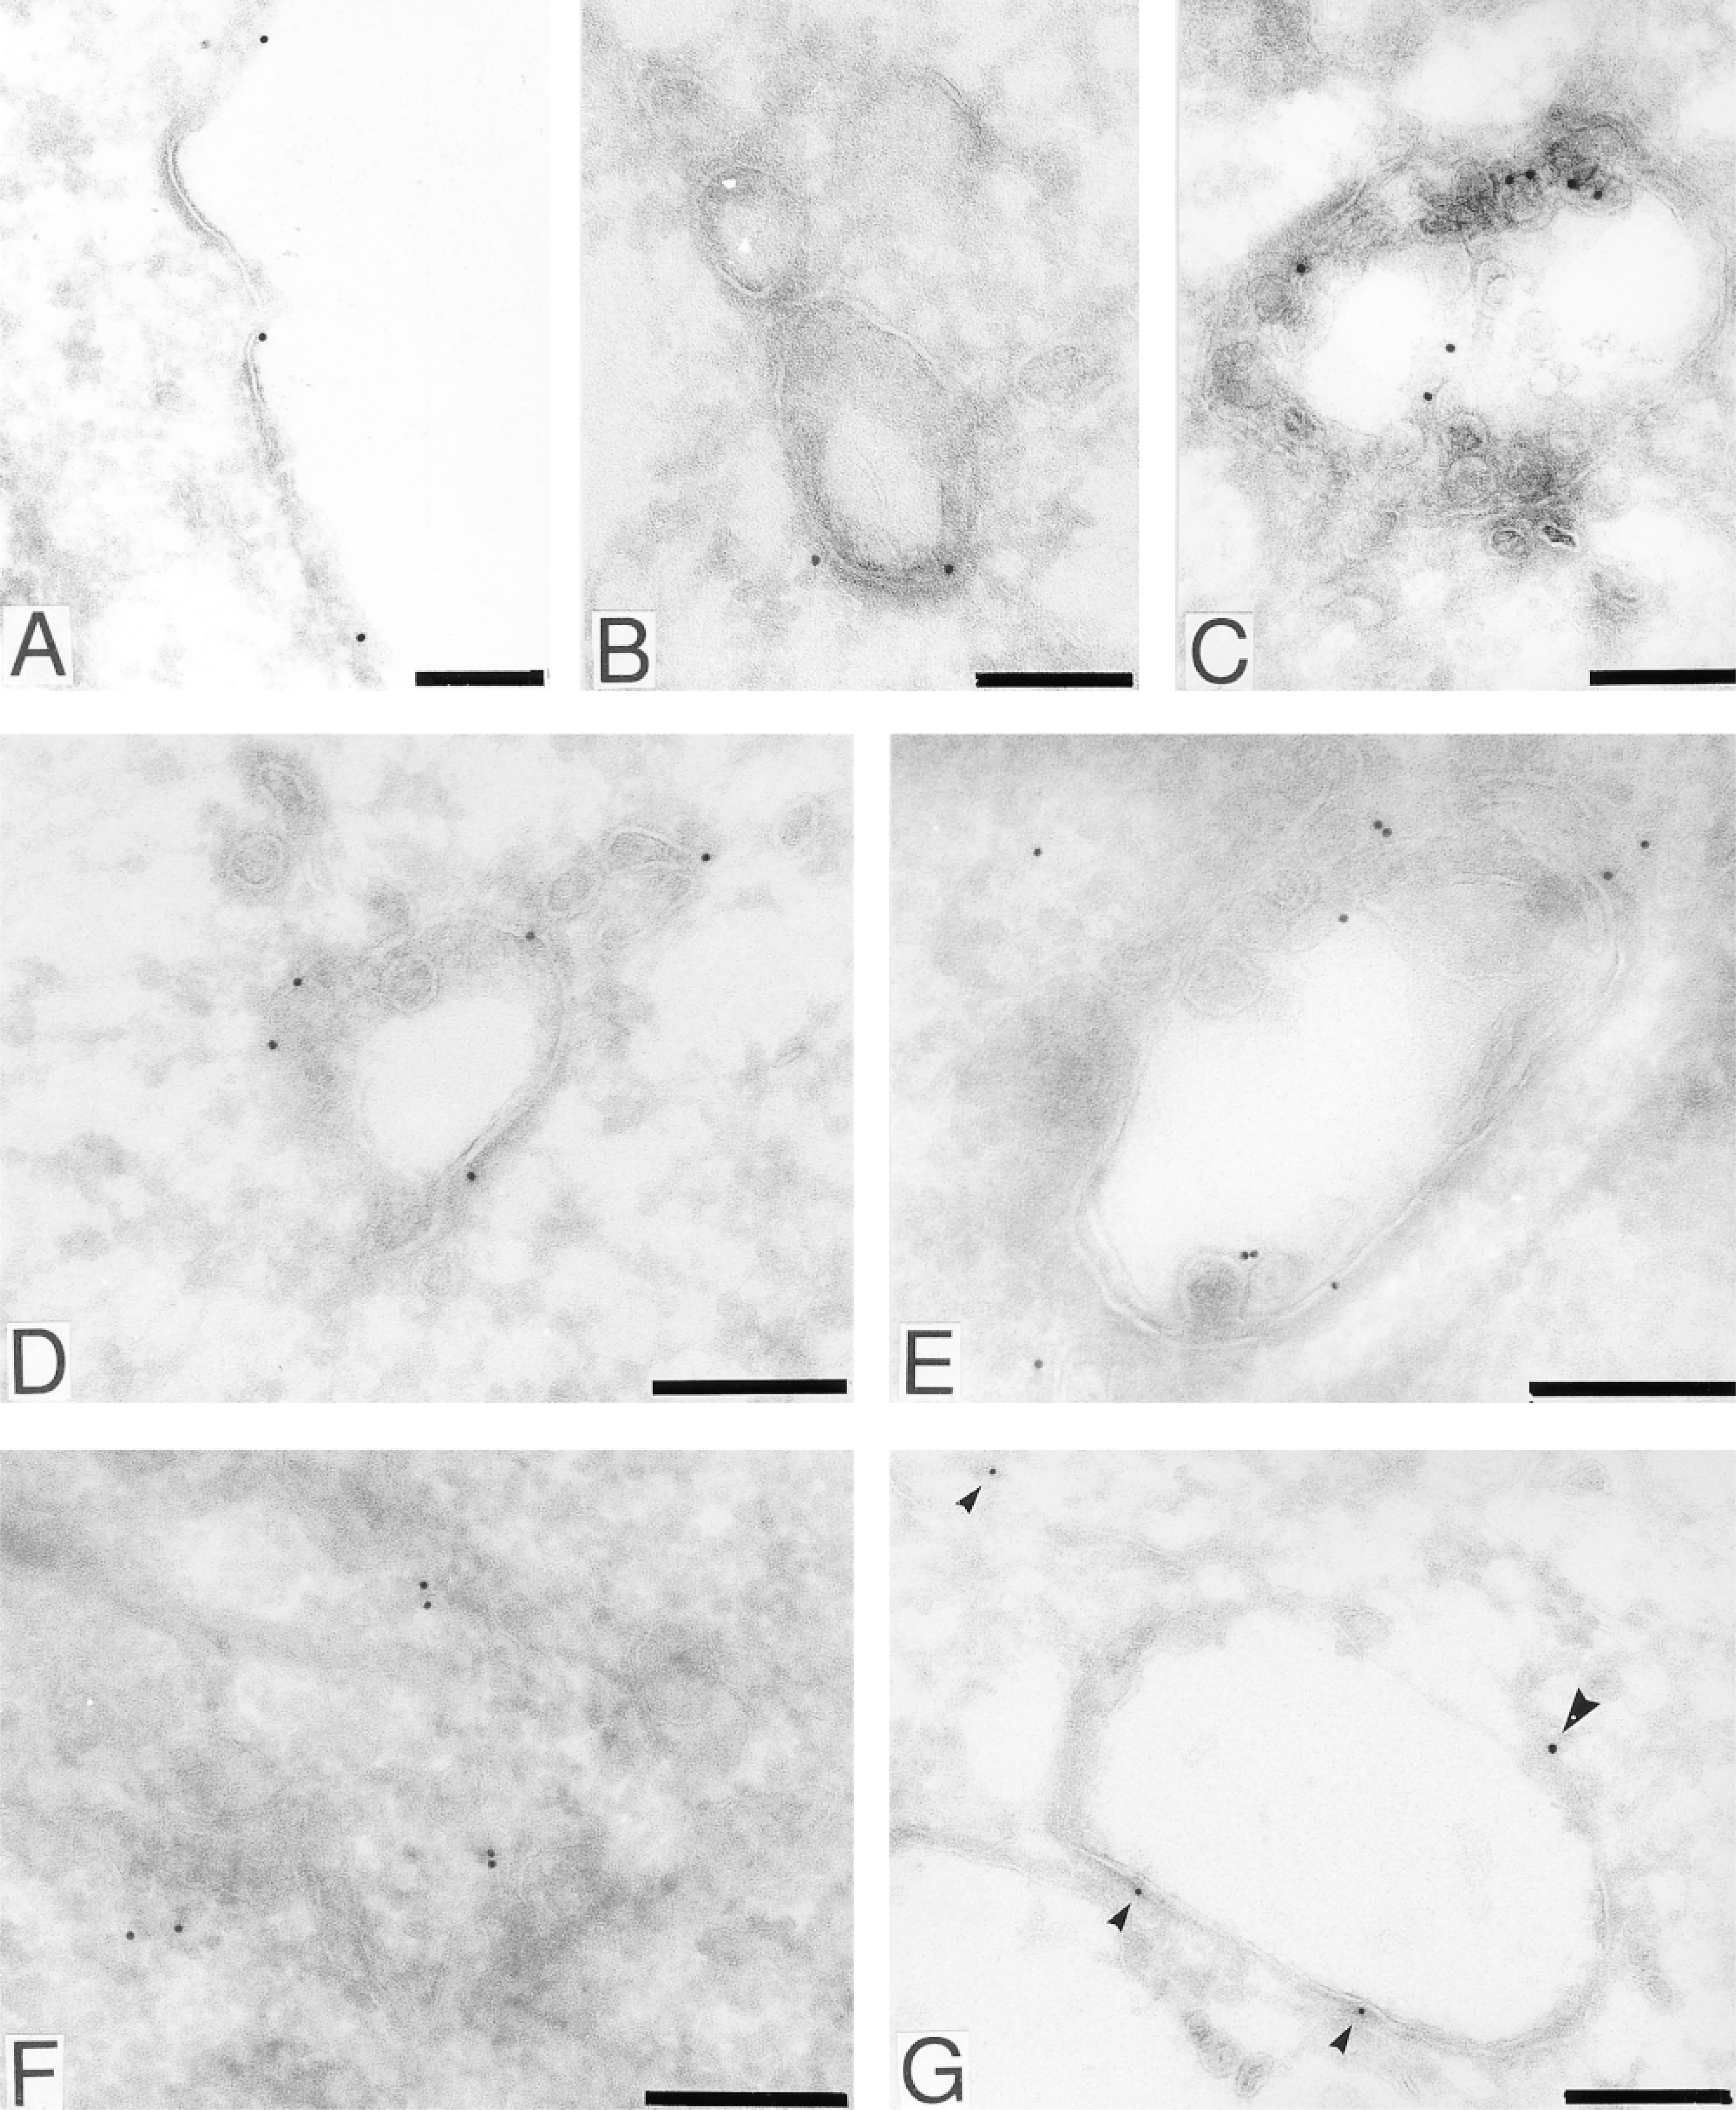
Localization of EGFR and tyrosine-phosphorylated EGFR by immunoelectron microscopy. Bound anti-EGFR and R42/pY1173 were traced with 15-nm and 10-nm gold, respectively, and anti-Shc with 10-nm gold. In unstimulated cells, EGFR was predominantly detected in clusters along the non-clathrin-coated plasma membrane (
The specificity and functional consequences of enzyme and gene activation may rely not only on the receptor's ability to activate different downstream signaling cascades but also on the processing of internalized signaling complexes through endocytosis. In this study we have demonstrated that EGFR phosphorylated at residue Y992 or Y1173 were internalized, and recruited Shc to early endosomes and possibly to a later compartment in response to EGF. This supports a role for membrane trafficking in EGFR signaling.
Footnotes
Acknowledgements
Supported by the Norwegian Cancer Society and by the Research Council of Norway.
We thank Helga Grøsvik, Lene Wierød, and the staff at the Electron Microscopy Laboratory for helpful technical assistance, and Paula De Angelis for critically reading the manuscript. Discussions with Espen Stang, Oistein Ihle and David R. Emlet were very much appreciated.