
Abstract
Flax/epoxy composites are recognized as an eco-friendly alternative to synthetic fibers in engineering. Understanding how fiber orientation affects cutting forces and surface characteristics is essential for machining these materials. This study investigates the relationship between fiber orientation and cutting forces (feed, normal, passive) as well as surface roughness in flax/epoxy composites. Results show that fiber orientation significantly impacts cutting forces. Cutting parallel to fibers (0° and 90° orientations) generally requires less force, with 0° needing higher normal force. At 0° orientation, feed force is 46.47 N, normal force is 58.86 N, and passive force is 54.44 N. At 90° orientation, feed force is 56.66 N, normal force is 44.68 N, and passive force is 50.95 N. Oblique orientations (45° and −45°) require higher forces, especially 45°, with the highest normal force of 77.95 N. Surface roughness analysis shows 90° orientation results in the lowest average roughness (Ra) of 10.97 µm but the highest surface roughness (Sa) of 34.25 µm. Conversely, 45° orientation has the highest Ra of 14.2 µm but lower Sa of 22.6 µm. Ra and Sa values for 0° orientation are 13.72 µm and 24.6 µm, and for −45° orientation, they are 12.3 µm and 21.8 µm. Correlation analysis reveals significant relationships between cutting parameters and surface quality, with higher feed rates correlating with smoother surfaces (lower Sa and Ra values). Fiber orientation also significantly influences fluffing defects, with 0° orientation minimizing these defects, while 45° and −45° orientations result in varied patterns.
Introduction
The increasing use of natural fibers in composite materials is driven by their environmental benefits and cost-effectiveness.1,2 Unlike synthetic fibers, natural fibers are renewable, biodegradable, and have lower carbon footprints, making them highly attractive for various industrial applications.3,4 Among these, flax (Linum usitatissimum) fiber stands out as one of the most widely used natural fibers.5–8 Flax/epoxy composites are gaining traction as eco-friendly alternatives in engineering,9–11 especially in aerospace and renewable energy sectors.12,13 These materials are crucial in the aerospace industry, 14 extensively used for components such as fuselage panels, wings, and interior elements.15,16 To fully exploit their potential, precision machining methods tailored to their unique characteristics are essential. While advanced techniques shape intricate composite components, many structural applications still require additional processes like drilling and trimming to achieve the precise desired shape.17,18
The aerospace industry demands precise tolerances and impeccable surface quality for its products. 19 However, machining natural fiber-reinforced composites presents challenges like delamination and surface roughness issues, linked to the material’s characteristics and cutting parameters.20–22 Machining these composites is challenging due to the orientation of fibers within the matrix,23,24 which influences cutting forces 25 and surface quality. 26 Despite its significance, understanding how different fiber orientations affect cutting forces and surface roughness in flax/epoxy composites is limited in existing literature.20,27
Research on natural fiber composites has predominantly focused on mechanical properties and environmental impacts,28,29 but detailed studies on their machinability, especially concerning fiber orientation and its effects, are relatively scarce.30–32 This highlights the necessity for dedicated research on the machining characteristics of flax/epoxy composites to bridge this knowledge gap.
Extensive research has explored the complex interactions between factors such as fiber orientation, machining direction, cutting mechanisms, and surface roughness.33,34 Accurately quantifying surface roughness is crucial in this context. Surface roughness measurement relies on two primary methods: contact-based and non-contact-based approaches, each with distinct attributes and applications.35,36 The contact method uses a diamond stylus to traverse the surface, detecting and measuring minute height variations.35,37,38 This approach provides precise and detailed measurements, making it reliable for many applications. The non-contact method employs optical or remote sensing mechanisms to assess surface characteristics without physical interaction, preserving surface integrity and avoiding damage to delicate materials like composites.35,39,40 Additionally, non-contact techniques mitigate issues with uncut fibers, ensuring greater accuracy.40,41 These methods are particularly valuable when evaluating surface roughness in contexts where material composition and surface integrity are critical. 41
Wang et al. 42 studied surface damage and roughness in multidirectional laminates, revealing distinct characteristics based on fiber orientation. However, they faced challenges in reliably characterizing individual layer roughness. Azmi et al. 43 used Ra values to assess machined composite surface quality, revealing issues with stylus-based methods. These included uncertainties from fiber presence and variations based on measurement position. These complexities highlight the need for accurate surface quality assessments in composite machining, considering fiber orientation, machining parameters, and measurement techniques.
Nwaogu et al. 44 compared tactile and optical devices for measuring surface texture on castings, finding that areal parameters like Sa were more consistent than profile parameters like Ra. Sa, which averages absolute values over an area, provided better repeatability and coverage. This suggests Sa’s potential for accurately quantifying surface roughness in castings and composites, given the similar surface issues in both materials.
Moreover, while extensive research exists on the machining of synthetic fiber-reinforced composites,45–48 there exists a critical need to address the unique characteristics and behaviors exhibited by natural fiber-reinforced composites such as flax/epoxy.
The novelty of this study lies in the correlation assessment between fiber orientation, cutting forces, and surface quality in flax/epoxy composites. This unique analysis offers new insights into the machining behavior of natural fiber composites. Additionally, an in-depth analysis of fluffing defects and their relationship to fiber orientation has been conducted, a topic not extensively covered in previous research. These contributions emphasize the innovative aspects of this study and its importance in advancing the understanding of machining natural fiber composites. By addressing a critical knowledge gap, this research aims to enable more efficient and sustainable engineering applications by optimizing machining conditions based on fiber orientation. This optimization enhances efficiency, reduces resource consumption, and improves component quality. Contributing to the sustainable engineering paradigm, this study explores optimal machining conditions and the intricate interplay among cutting parameters, surface roughness, and cutting forces. In today’s era of sustainability, this research equips manufacturers and engineers with essential knowledge for environmentally-friendly engineering practices.
Materials and methods
The plate employed for this research is a composite made from flax and epoxy, formed through the resin transfer molding (RTM) technique. RTM is chosen due to its ability to produce high-quality, dimensionally accurate, and complex composite parts with excellent fiber-matrix adhesion. This technique allows for precise control over fiber orientation and resin content, ensuring uniform material properties and superior mechanical performance. Additionally, this particular plate is composed of layers of flax fibers aligned in one direction, accounting for 41% of its volume. These fibers were produced by the French company LINEO, while the thermosetting epoxy resin, known as Marine 820, serves as the binding material. This resin originates from the manufacturer ADTECH Plastic Systems. The dimensions of this flax/epoxy plate are 290 mm x 290mm, with a thickness measuring 5 mm. These dimensions were chosen to ensure uniformity and consistency in material properties, provide a sufficient surface area for multiple tests, and facilitate accurate and repeatable machining and testing processes (Figure 1). Fabricated flax/epoxy composite plate.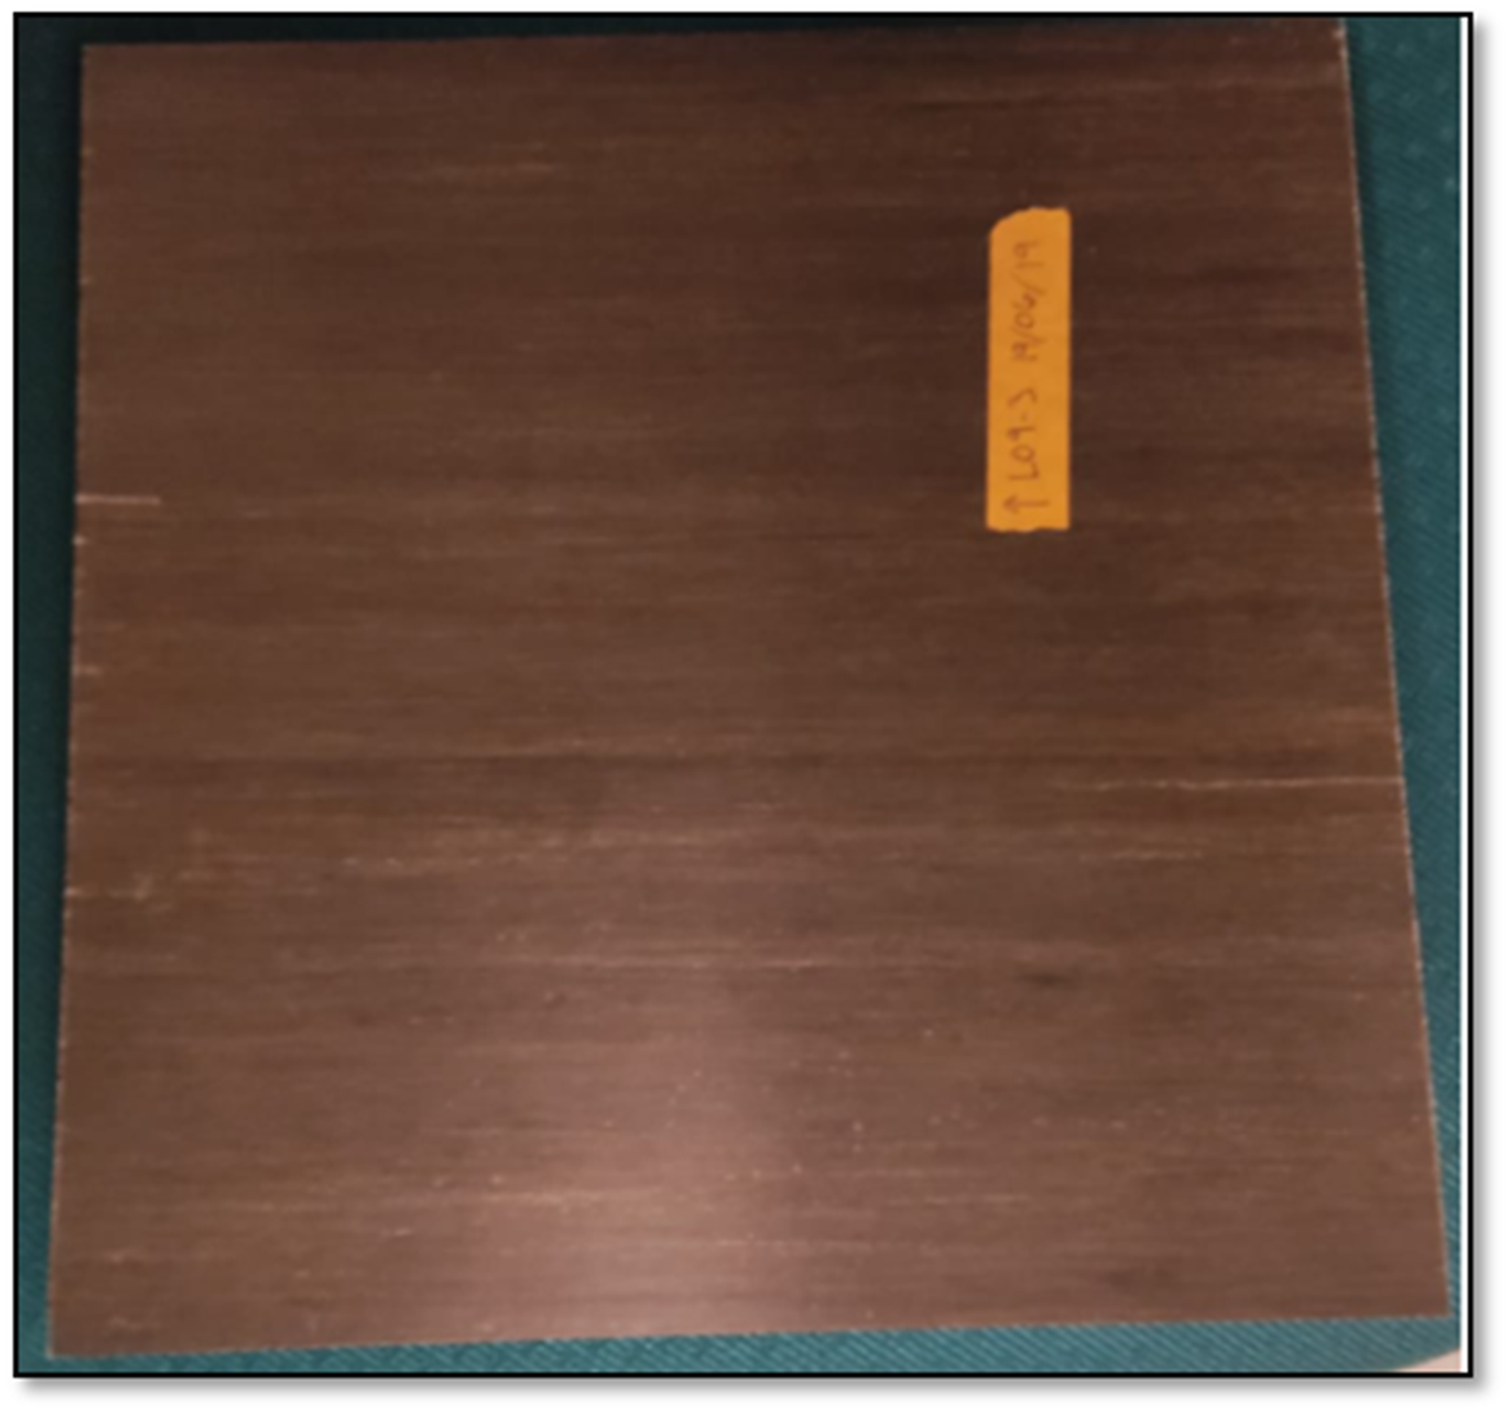
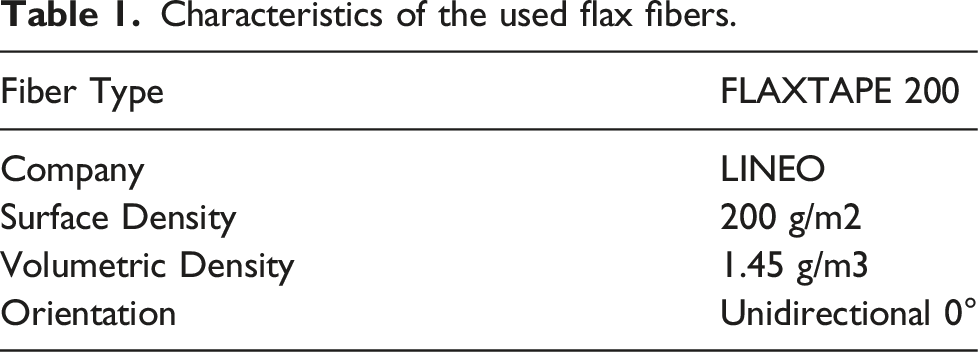
Characteristics of the used flax fibers.
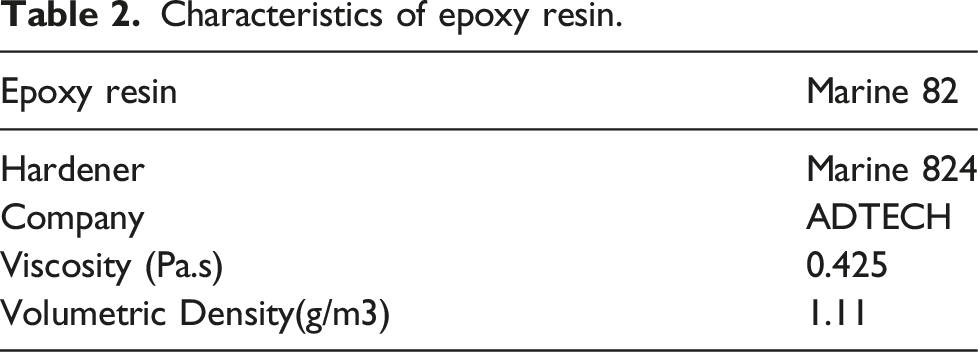
Characteristics of epoxy resin.
Factors of the design of experiments and the responses from slot milling tests.
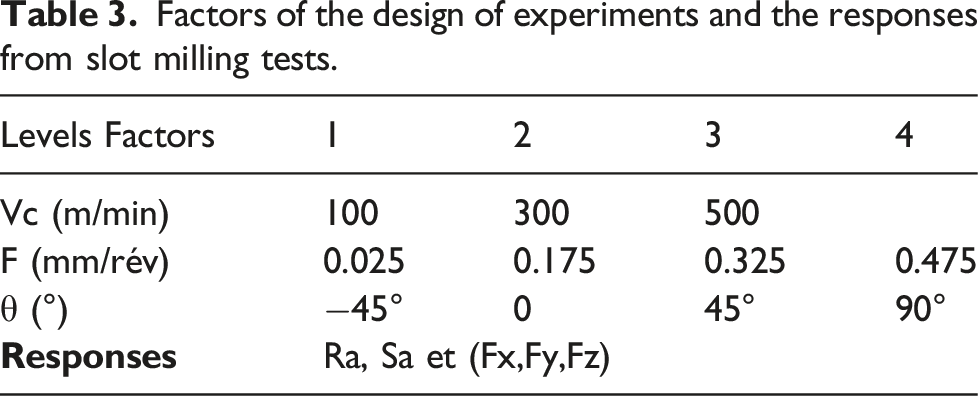
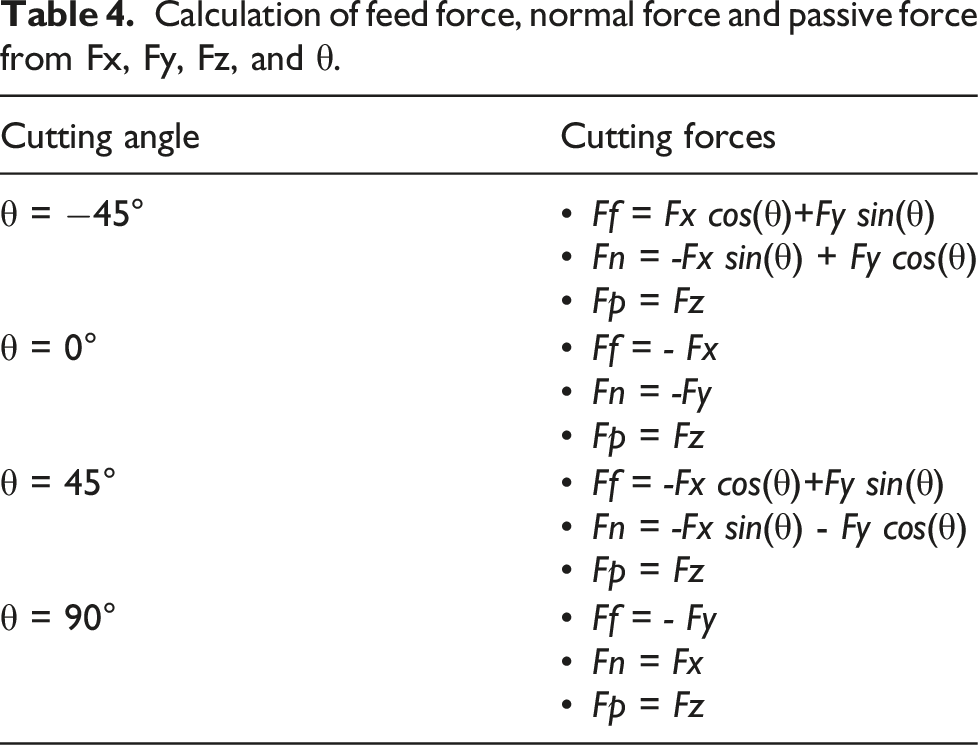
Figure 2 visually represents the relationship between fiber orientation and cutting direction. The force components in the x, y, and z directions were processed using the mathematical relationships shown in Table 4 to derive the feed force (Ff), normal force (Fn), and passive force (Fp). Schematic representation of the cutting test. Calculation of feed force, normal force and passive force from Fx, Fy, Fz, and θ.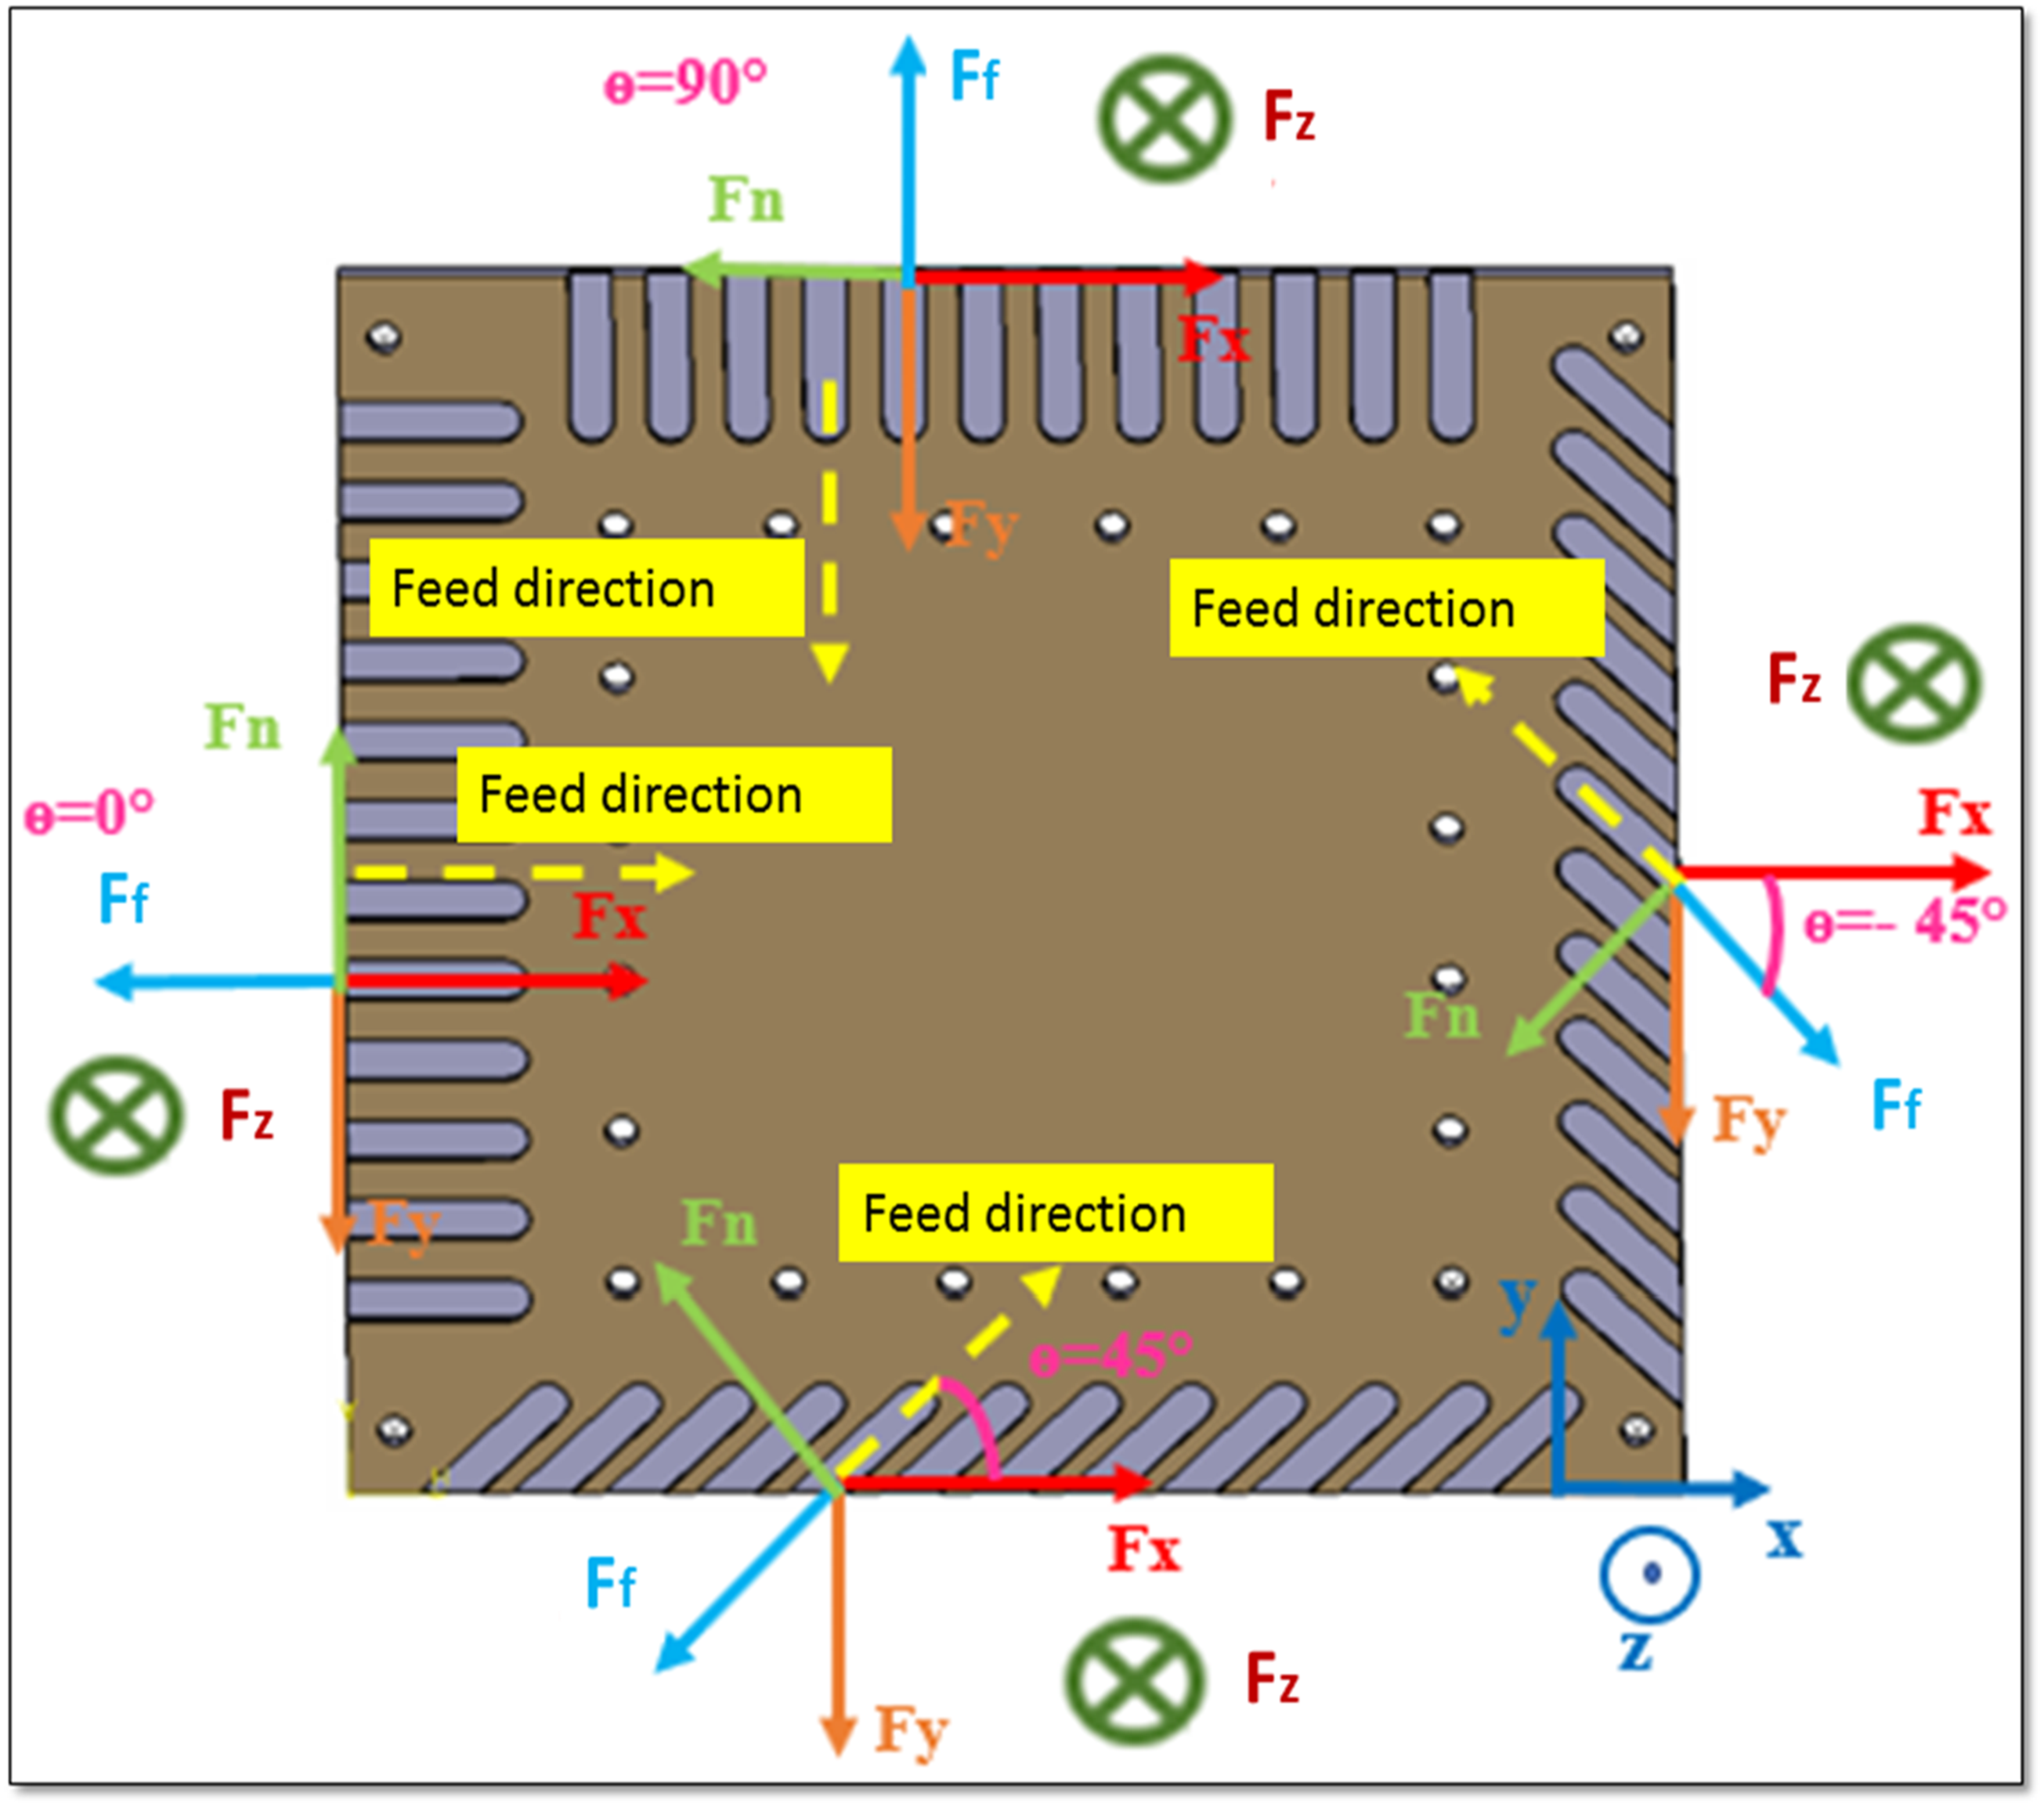
The slot milling tests on the plate adhere to the sequence outlined in the Design of Experiments (DOE) in Table 3, featuring complete randomization (Figure 3). There are, in fact, 48 milling combinations for the FFRP plate. Figure 3 showcases the plate’s design and the arrangement of the machining tests for the 48 grooves. Design and machining test sequence for FFRP plate grooves.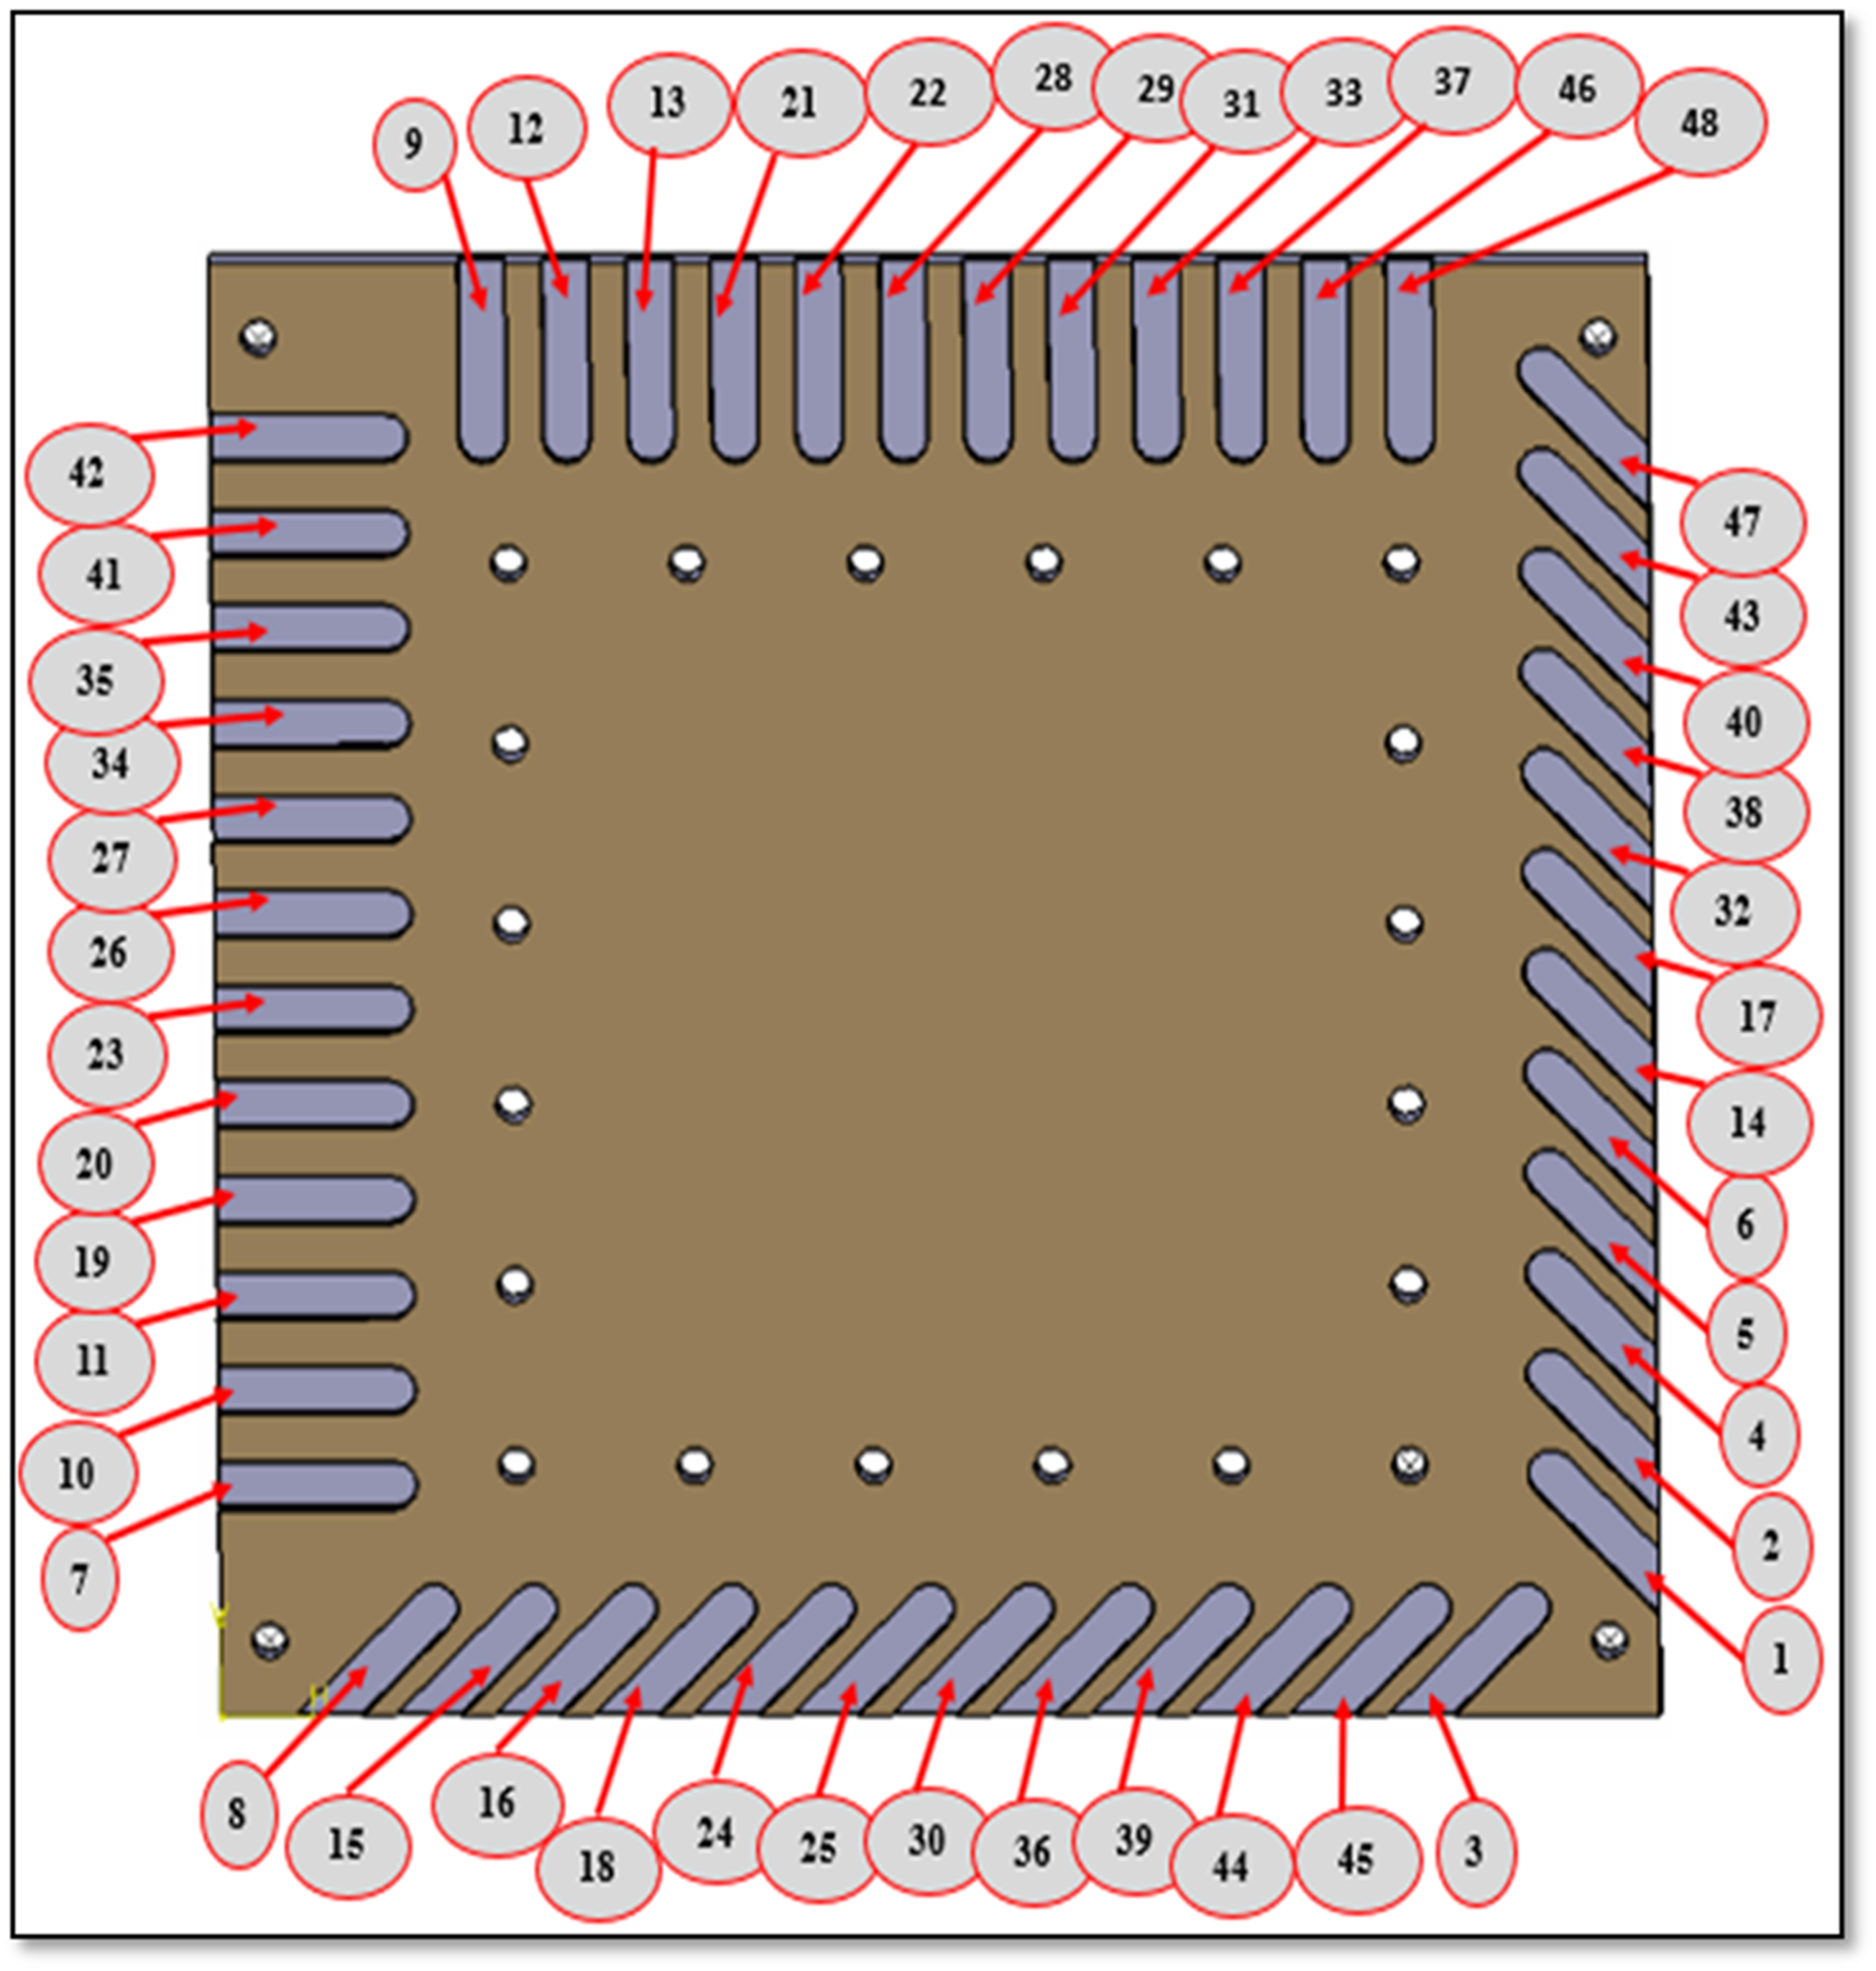
The slot milling experiments were conducted utilizing a HURON K2X10 3-axis CNC milling machine (Figure 4). This CNC machine is equipped with a SIEMENS 840 D controller and a spindle capable of reaching speeds up to 28,000 r/min. During the slot milling tests, a dust extraction system was employed to collect the dust produced. Slot Milling experiments setup with HURON K2X10 CNC milling machine.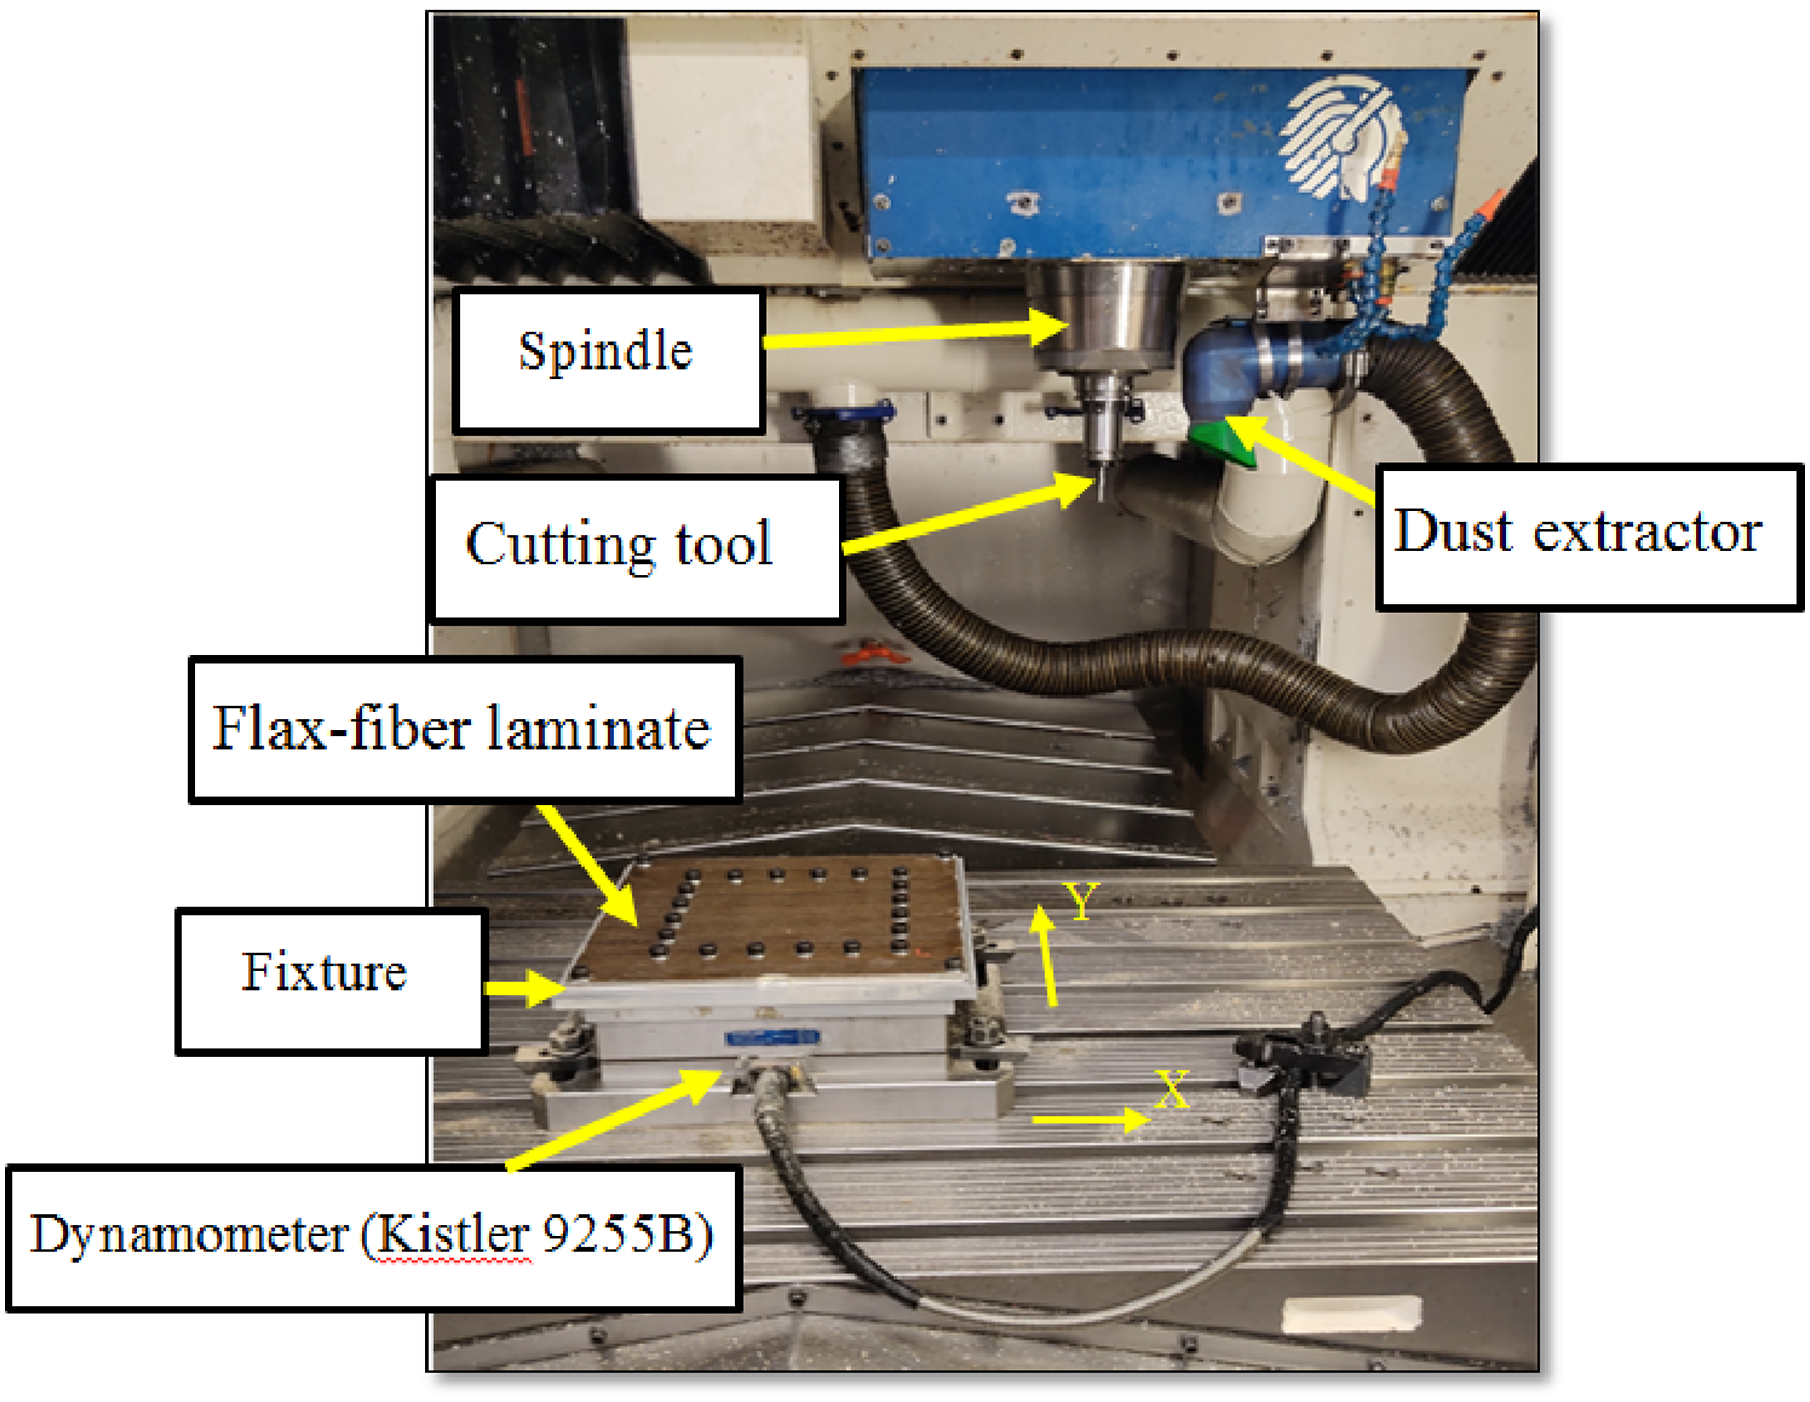
The machining jig used for securing the FFRP plate was attached to the acquisition table, as demonstrated in Figure 5. This jig is perforated with 7 mm diameter holes, enhancing the plate’s stability through secure fixation. The focus shifts towards the measurement of cutting forces across the three axes (X, Y, and Z). This task is accomplished by employing a 3-axis dynamometer, specifically the KISTLER model 9255B, affixed to the milling machine table. The dynamometer’s integration with the data acquisition system is facilitated by means of an acquisition table (Figure 4), and its robust construction ensures its capacity to measure an extensive range of forces. Fixture setup for FFRP plate on acquisition Table.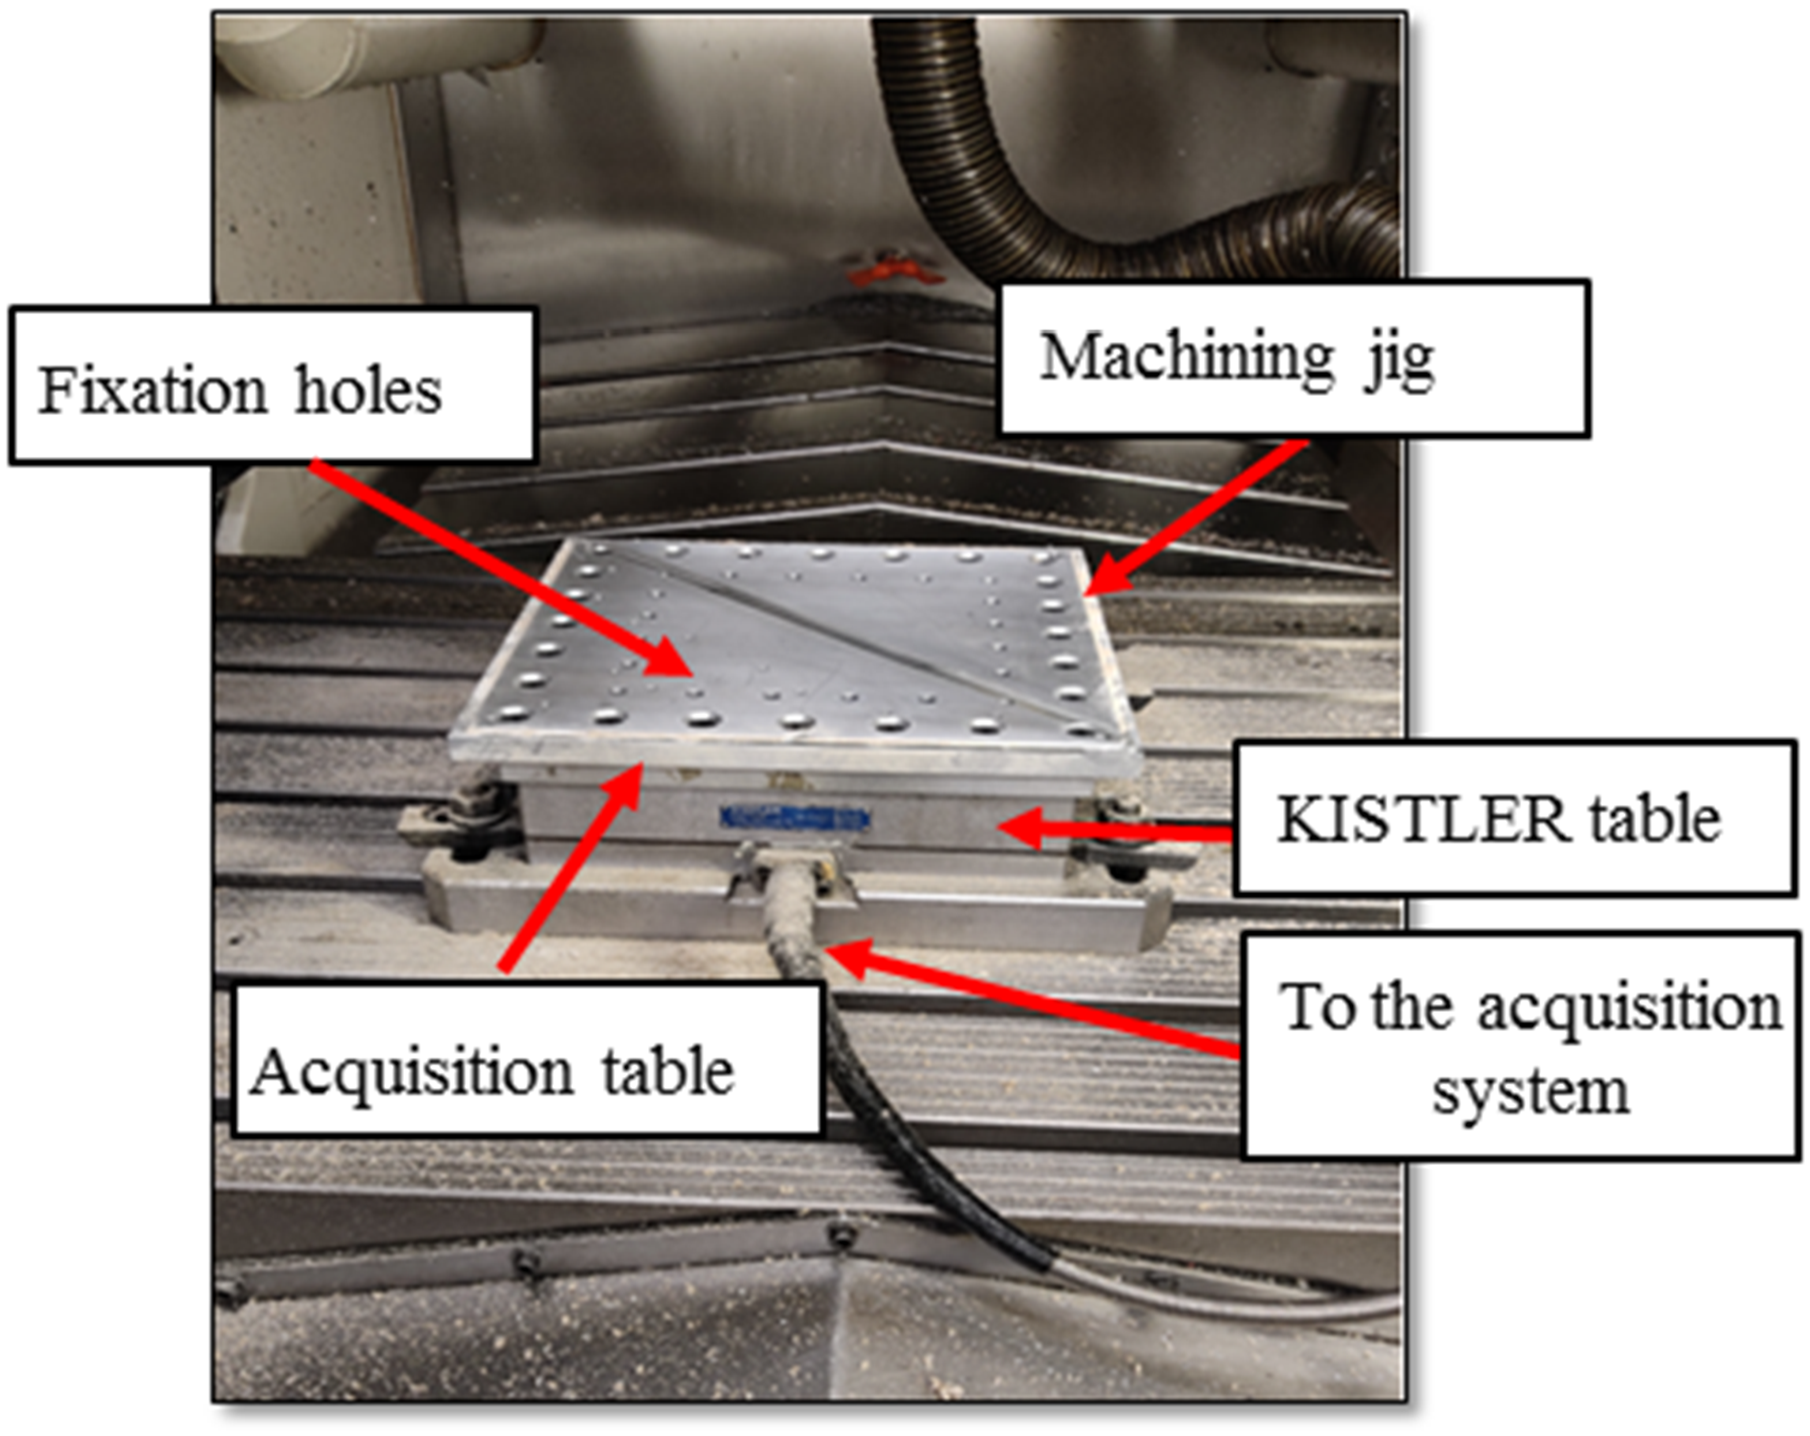
Central to the study lays the analysis of cutting forces in three directions (Figure 2): axial or passive force (Fp), feed force (Ff), and normal force (Fn). Notably, the feed force (Ff) signifies the resistance exerted by the machined component against the tool’s direction, illustrated in Figure 2. Concurrently, the axial or passive force (Fp) contributes to the milling force, aligned with the -Z axis. The normal force constitutes the orthogonal third component, perpendicular to both Ff and Fp.
The KISTLER equipment supplies raw force data (Fx, Fy, Fz), which must be processed to obtain the desired Ff, Fn, and Fp forces, as detailed in Table 4 and Figure 2. It’s important to mention that the data sampling occurs at a frequency of 6000 Hz. Notably, four distinct scenarios emerge based on the cutting angle orientation: θ = −45°, 0°, 45°, and 90°.
As shown in Figure 6, (a) two-flute solid carbide end mill was used for machining. Although higher flute counts can distribute cutting loads more evenly and reduce wear on individual teeth, extending tool life, it’s crucial to consider the specific characteristics of the material being machined. For non-abrasive materials like flax fibers, where tool wear is typically negligible, the focus shifts from wear reduction to other factors influencing machining quality. The decision to use a two-flute end mill was based on prior research indicating that this tool configuration offers superior accuracy and repeatability compared to alternatives like polycrystalline diamond (PCD) end mills.
49
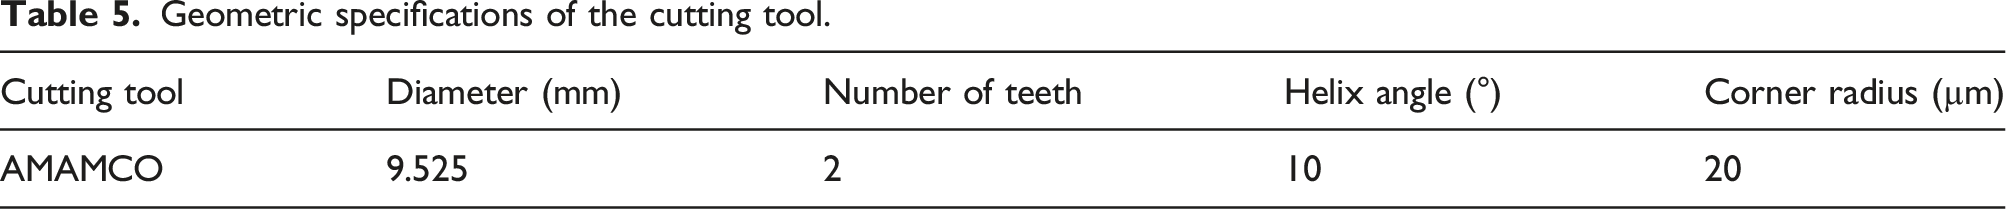
Table 5 provides a comprehensive summary of the essential geometric characteristics of the chosen cutting tool, known as the “AMAMCO” end mill. Figure 6 provides a visual representation of this tool through a photograph. Solid carbide 2-flute end mill. Geometric specifications of the cutting tool.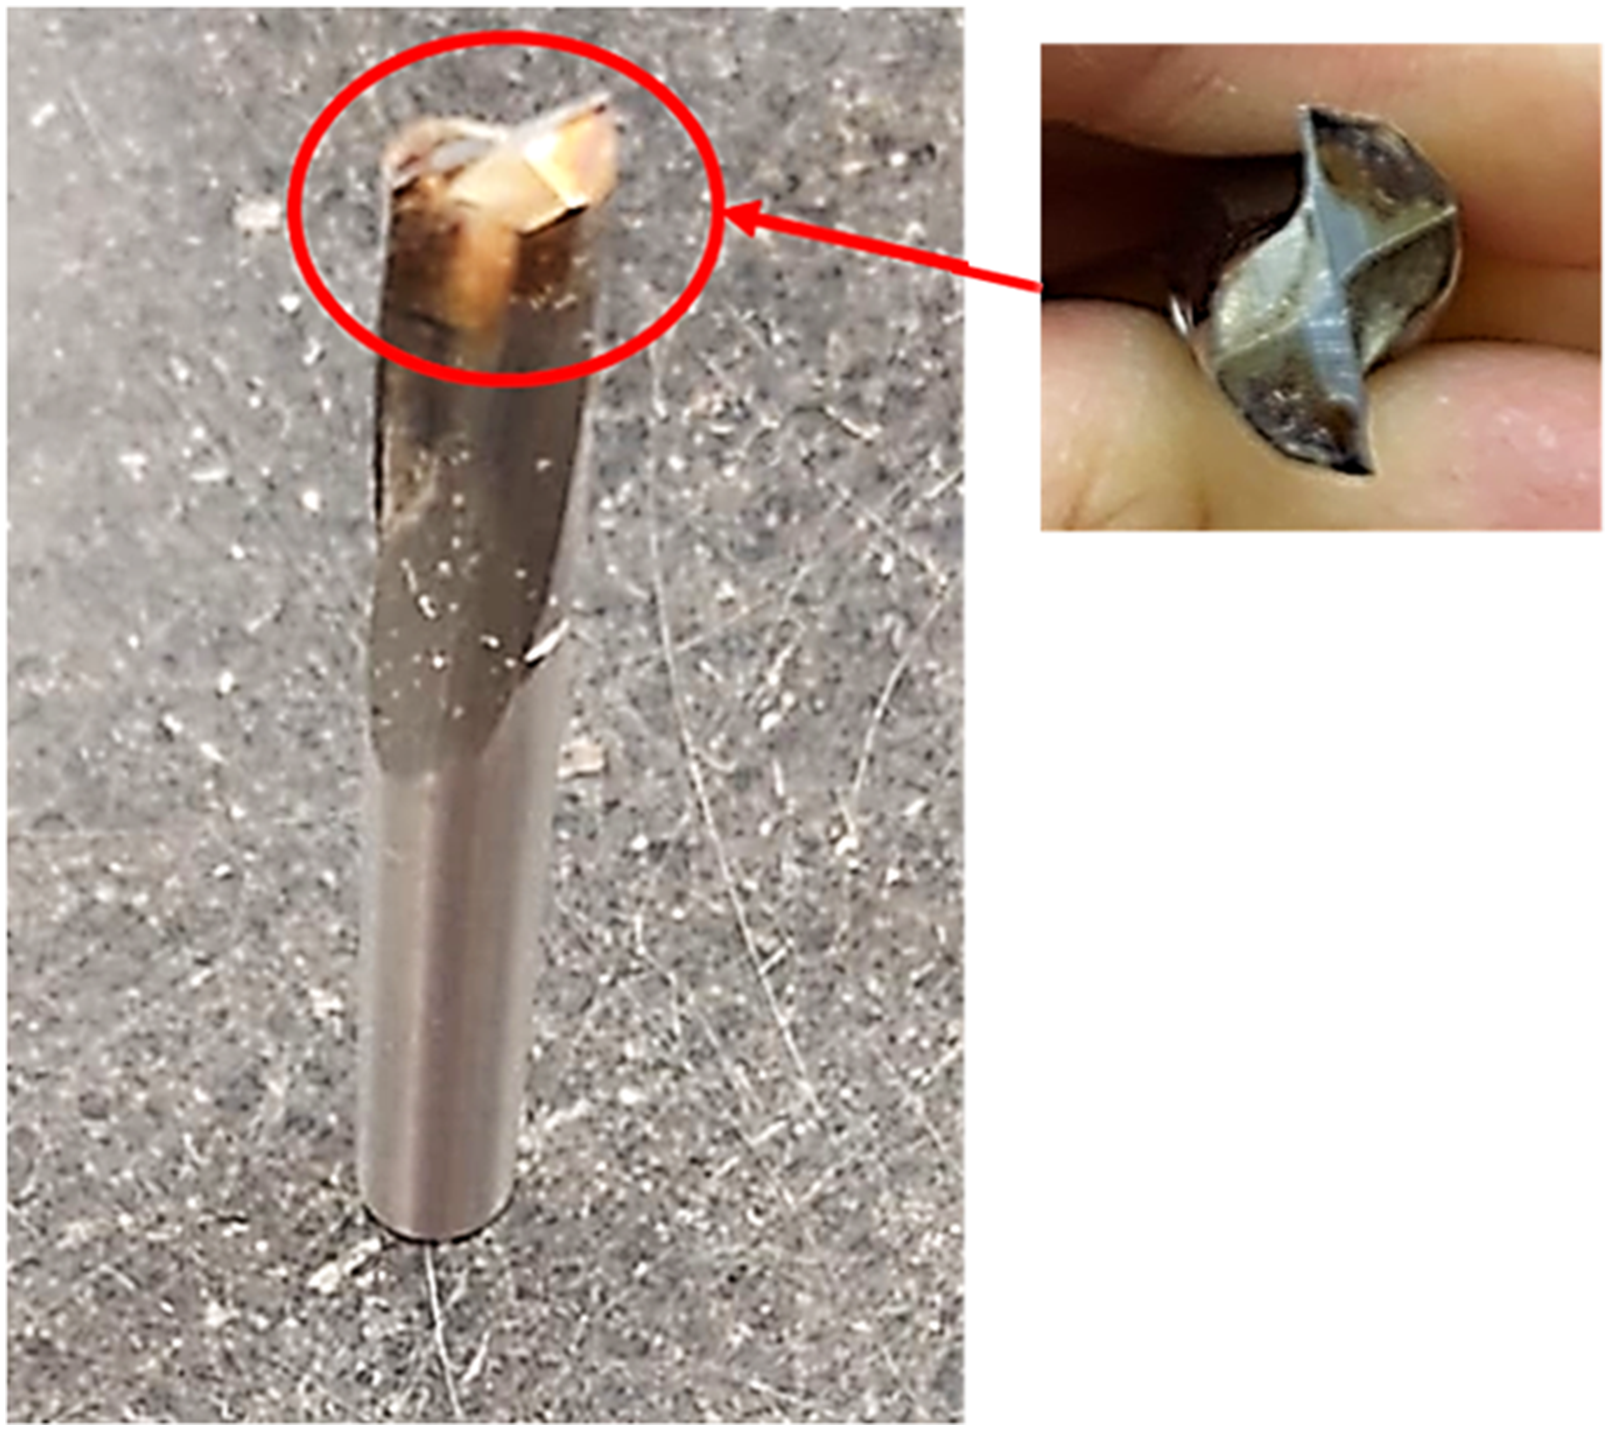
The surfaces of the grooves created on the FFRP plate are analyzed to characterize their conditions. For this purpose, the arithmetic mean roughness profile Ra and the arithmetic mean surface roughness Sa have been studied.
To measure the profile roughness Ra, the Mitutoyo Surftest SJ-410 profilometer was employed (Figure 7). This device is equipped with a 90° detector containing a diamond-tipped spherical stylus with a radius of 2 µm and a resolution of 0.000,125 μm. Data preparation is facilitated using the SURFPAK-SJ surface analysis software. Mitutoyo surftest SJ-410 profilometer.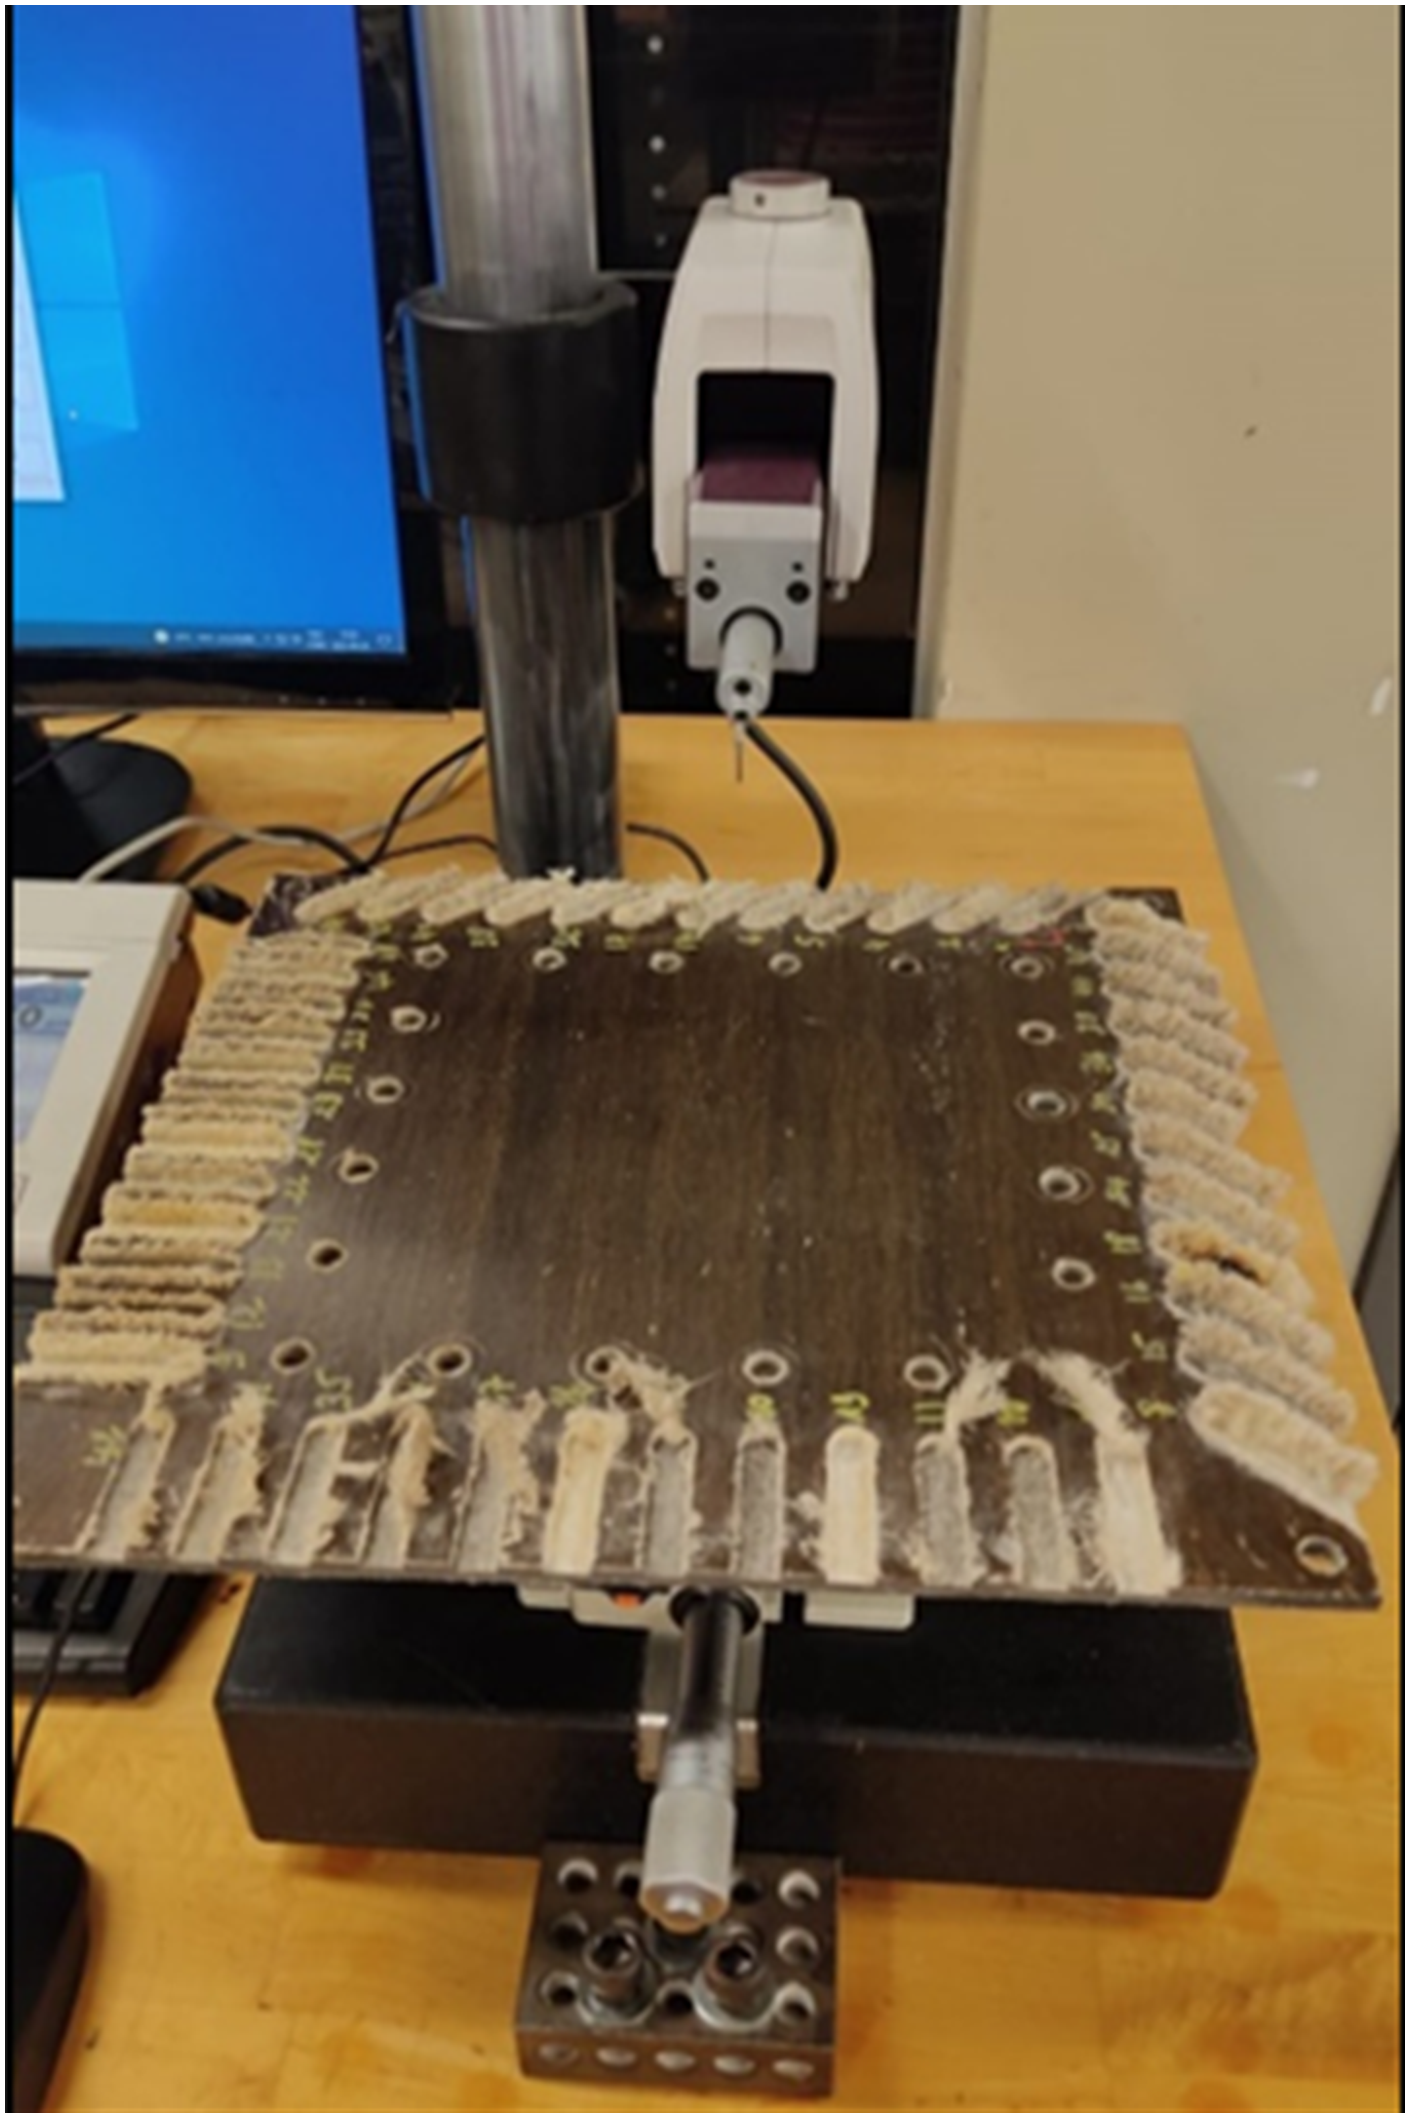
To address the potential impact on measurement accuracy, we meticulously prepared the composite samples to minimize loose fibers and used advanced surface profilometry techniques, which are less affected by fluffing compared to traditional methods. Additionally, multiple measurements were taken on different areas of each sample to average out any potential anomalies. Machined grooves were cleaned to remove any dust generated during the milling process. Measurements were conducted using a Mitutoyo SJ-410 roughness meter set to ISO 4287-1997 standards. A Keyence VHX-500FE optical microscope assisted in accurately following the ply to be measured and detecting any chips stuck to the surface, thereby reducing measurement errors. Measurements were performed along the selected ply and parallel to the cutting direction.
In order to measure the arithmetic mean surface roughness (Sa) of the grooves on the FFRP plate, the “KEYENCE VR500” 3D imaging device was employed. This advanced equipment enables contactless measurements of Sa roughness by scanning the target surface using simultaneous image capture, resulting in a precise composite image, as illustrated in Figure 8. 3D profilometer “KEYENCE VR500”.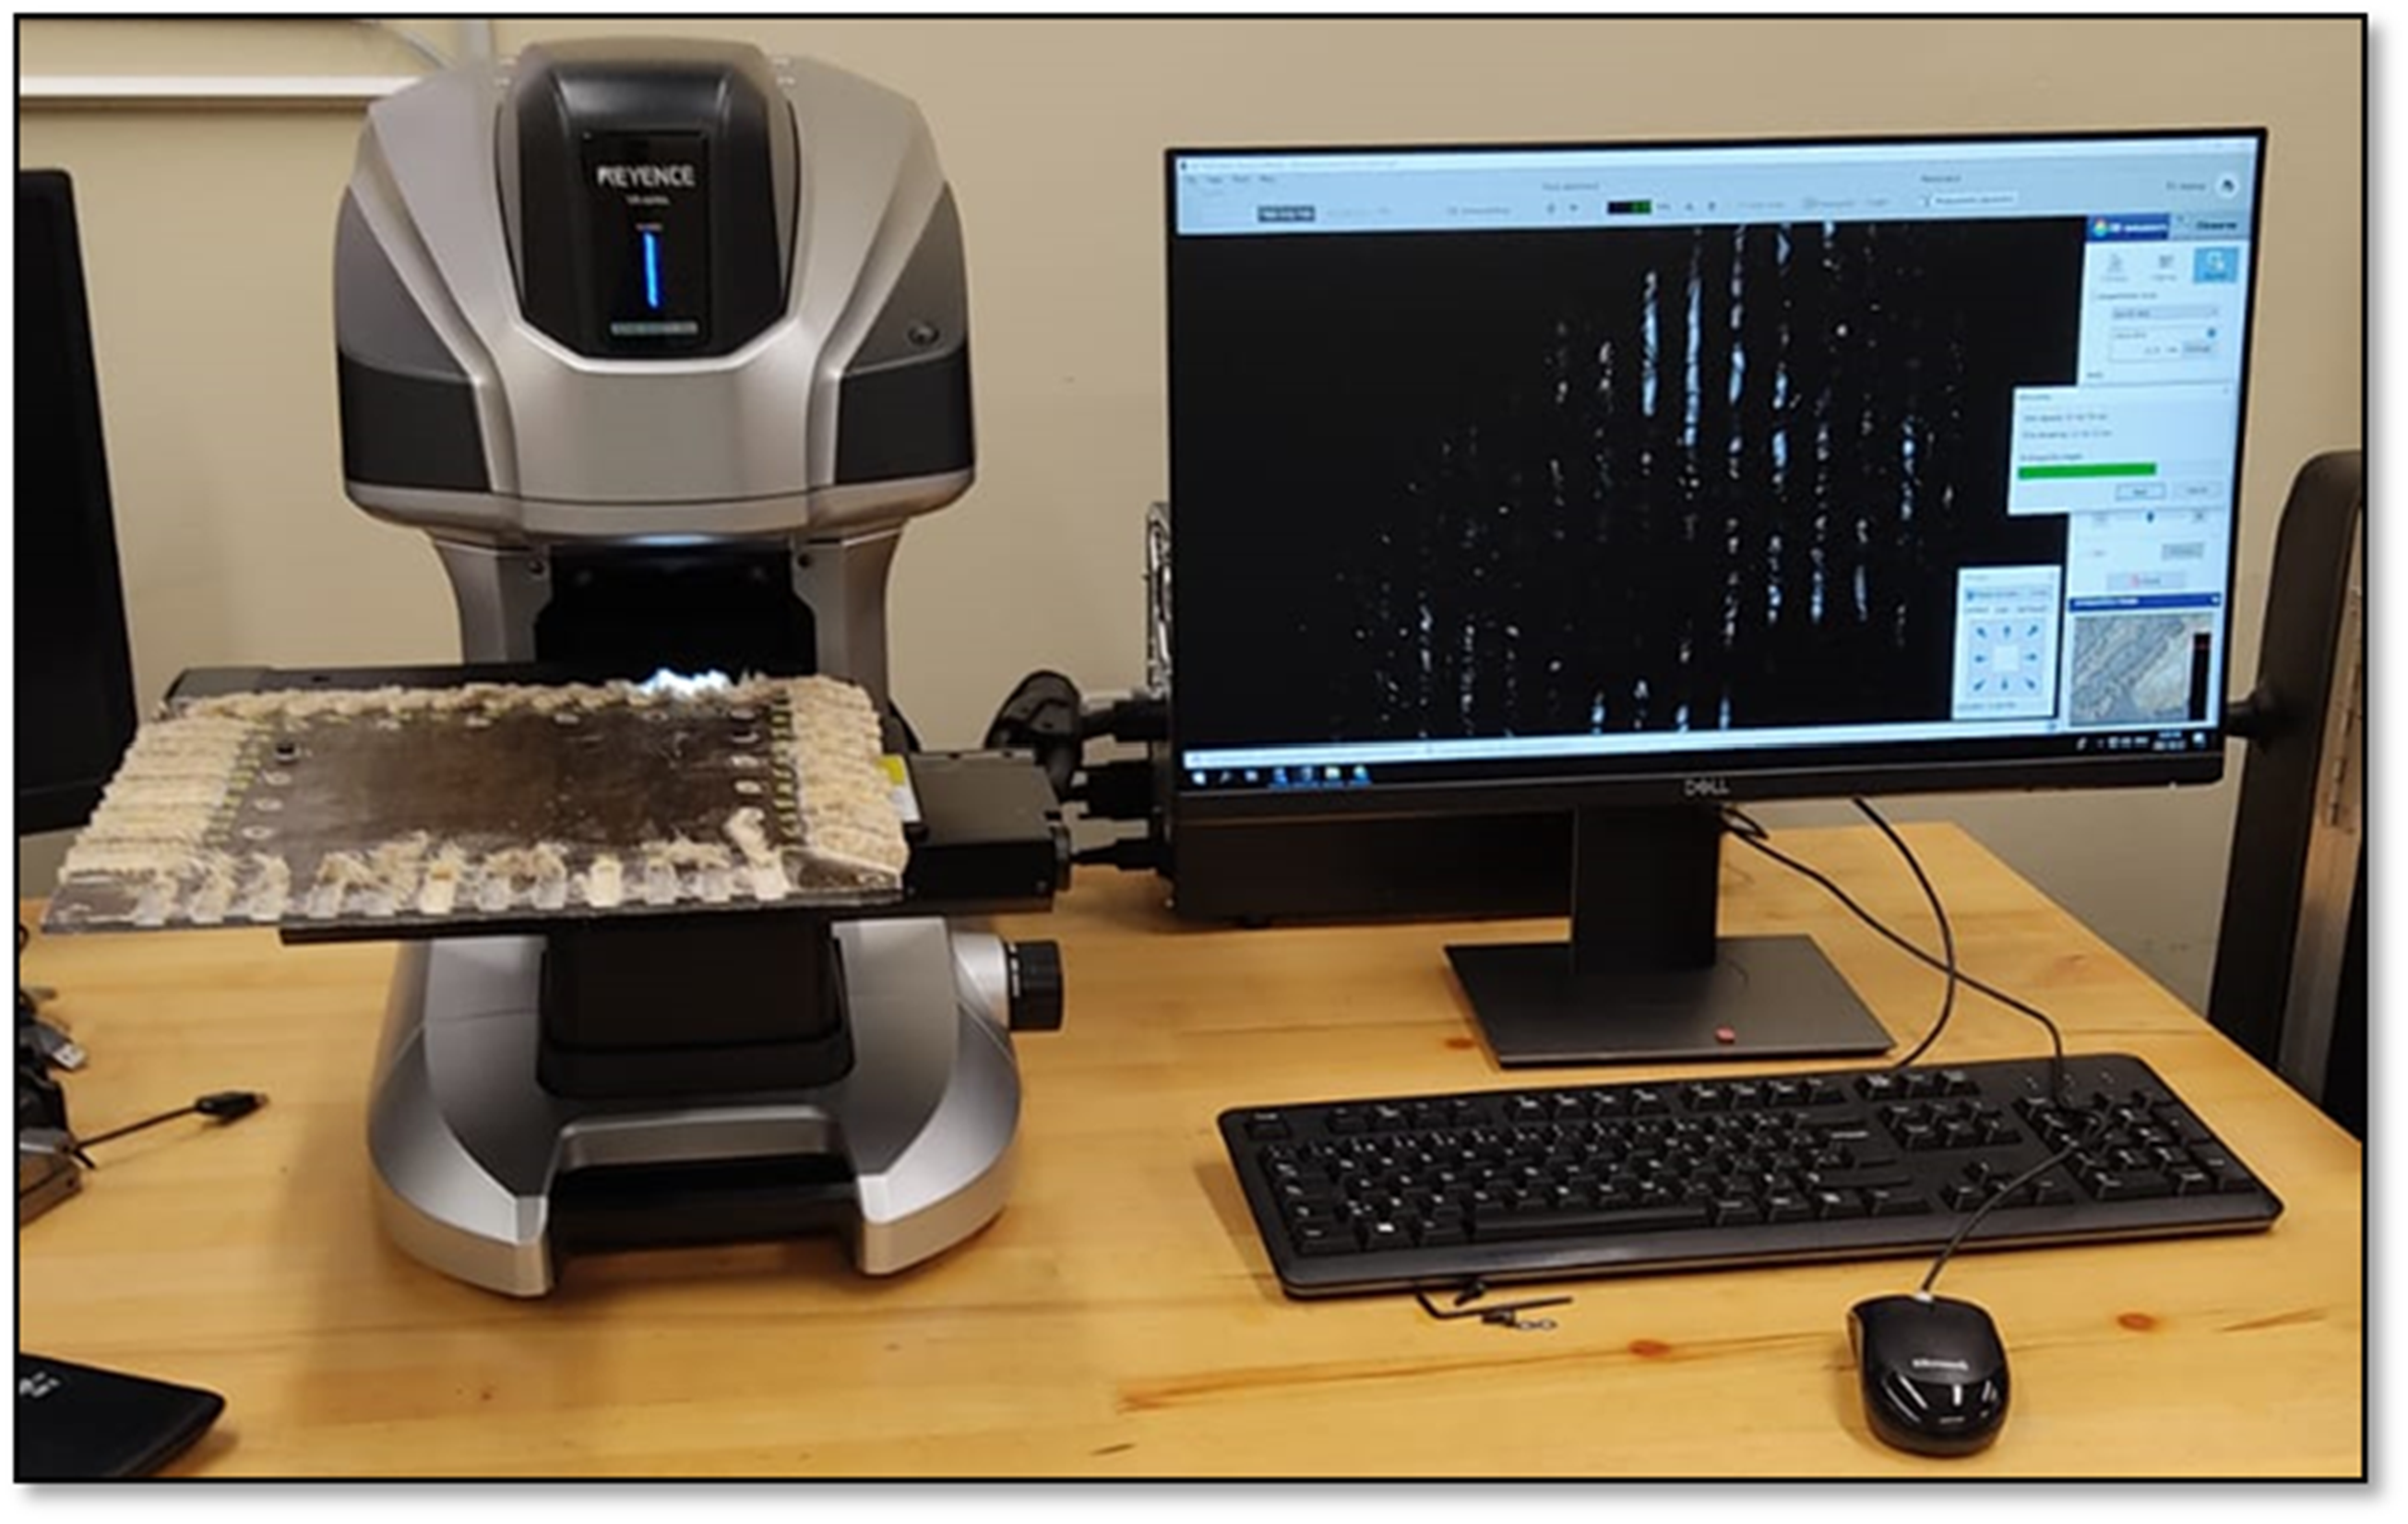
After obtaining the groove image, specific surfaces were selected for detailed analysis. This selection process involved random sampling of four tiles within each groove, each measuring 2.5 mm x 2.5mm, as depicted in Figure 9(a). To process this selection, an L-filter (high-pass filter) with a value of 2.5 mm, aligned with the dimensions of the tiles according to ISO 25,178 standards, was applied. Finally, the data acquisition software of the “KEYENCE VR500” device automatically provided the Sa roughness values for each selected tile, as shown in Figure 9(b). Sa Measurement of groove surfaces using “KEYENCE VR500”. (a) Machined grooves. (b) Scanned grooves 33 (left) and 37 (right).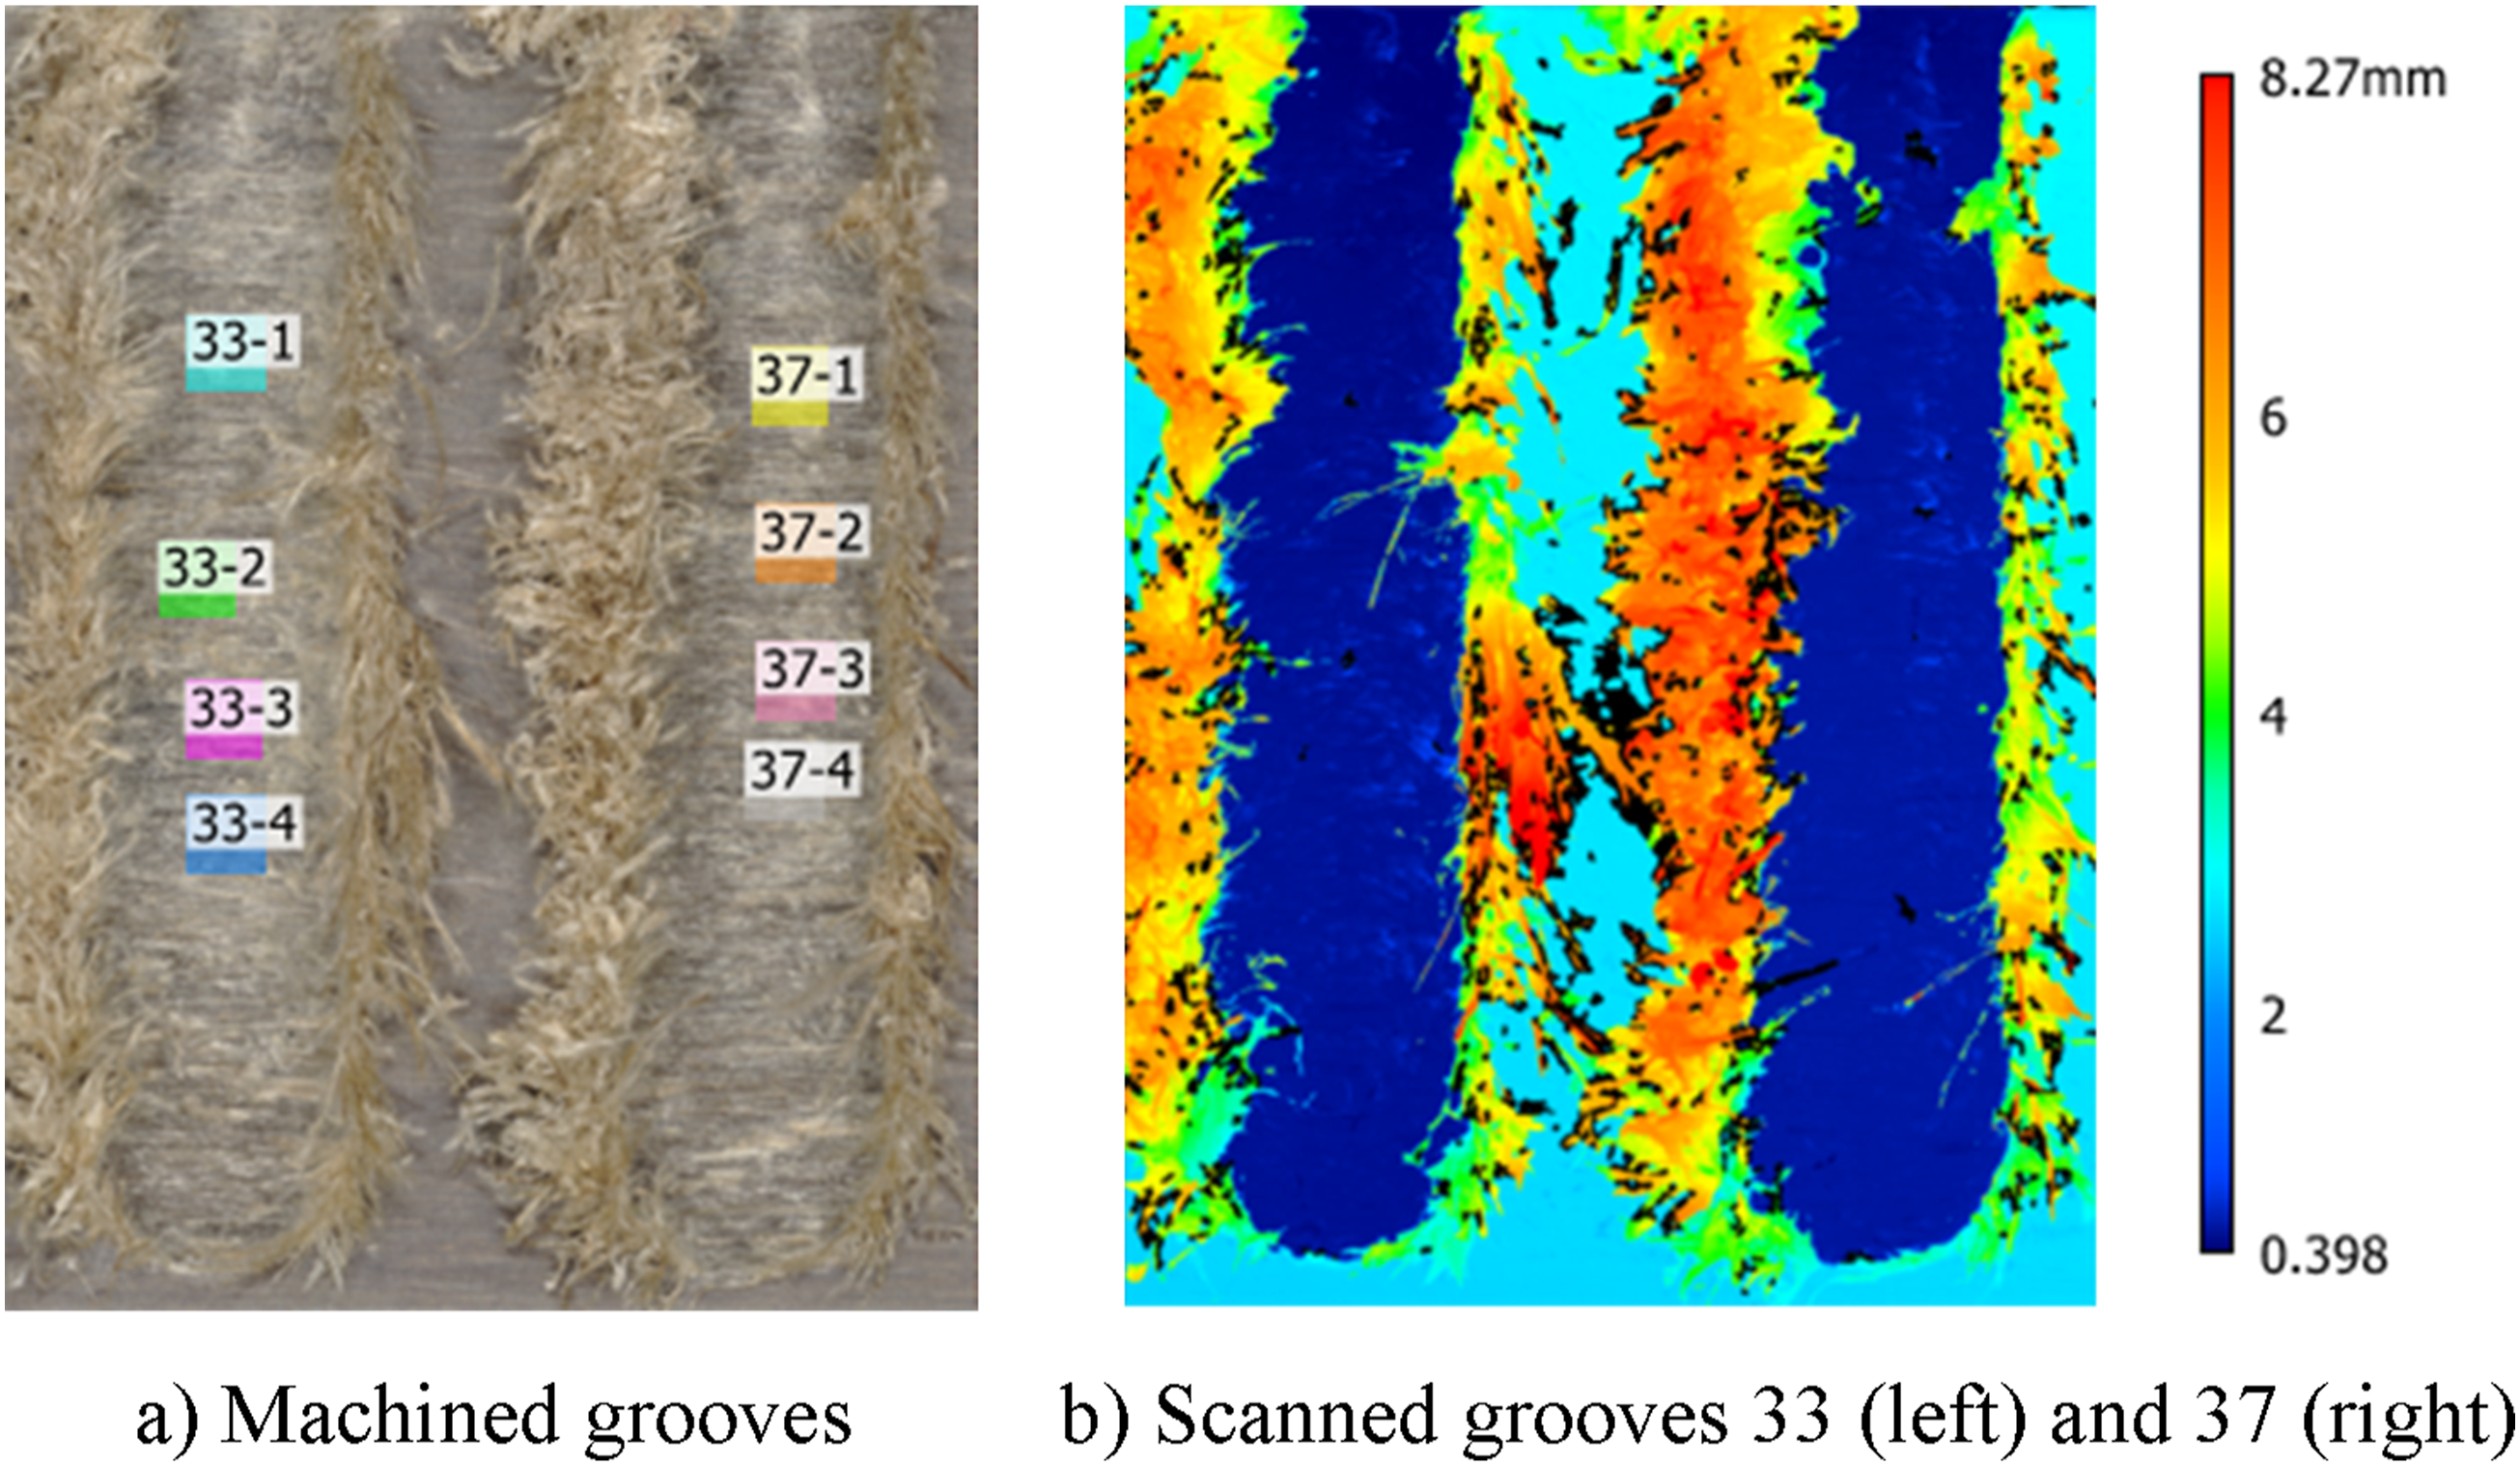
In Figure 10, the entire study is presented as a flow chart to offer a concise outline of the research process. This visual representation delineates the steps followed in this investigation, beginning with material selection and preparation, continuing through experimental design and machining processes, and concluding with data collection and analysis. Flow chart of research process.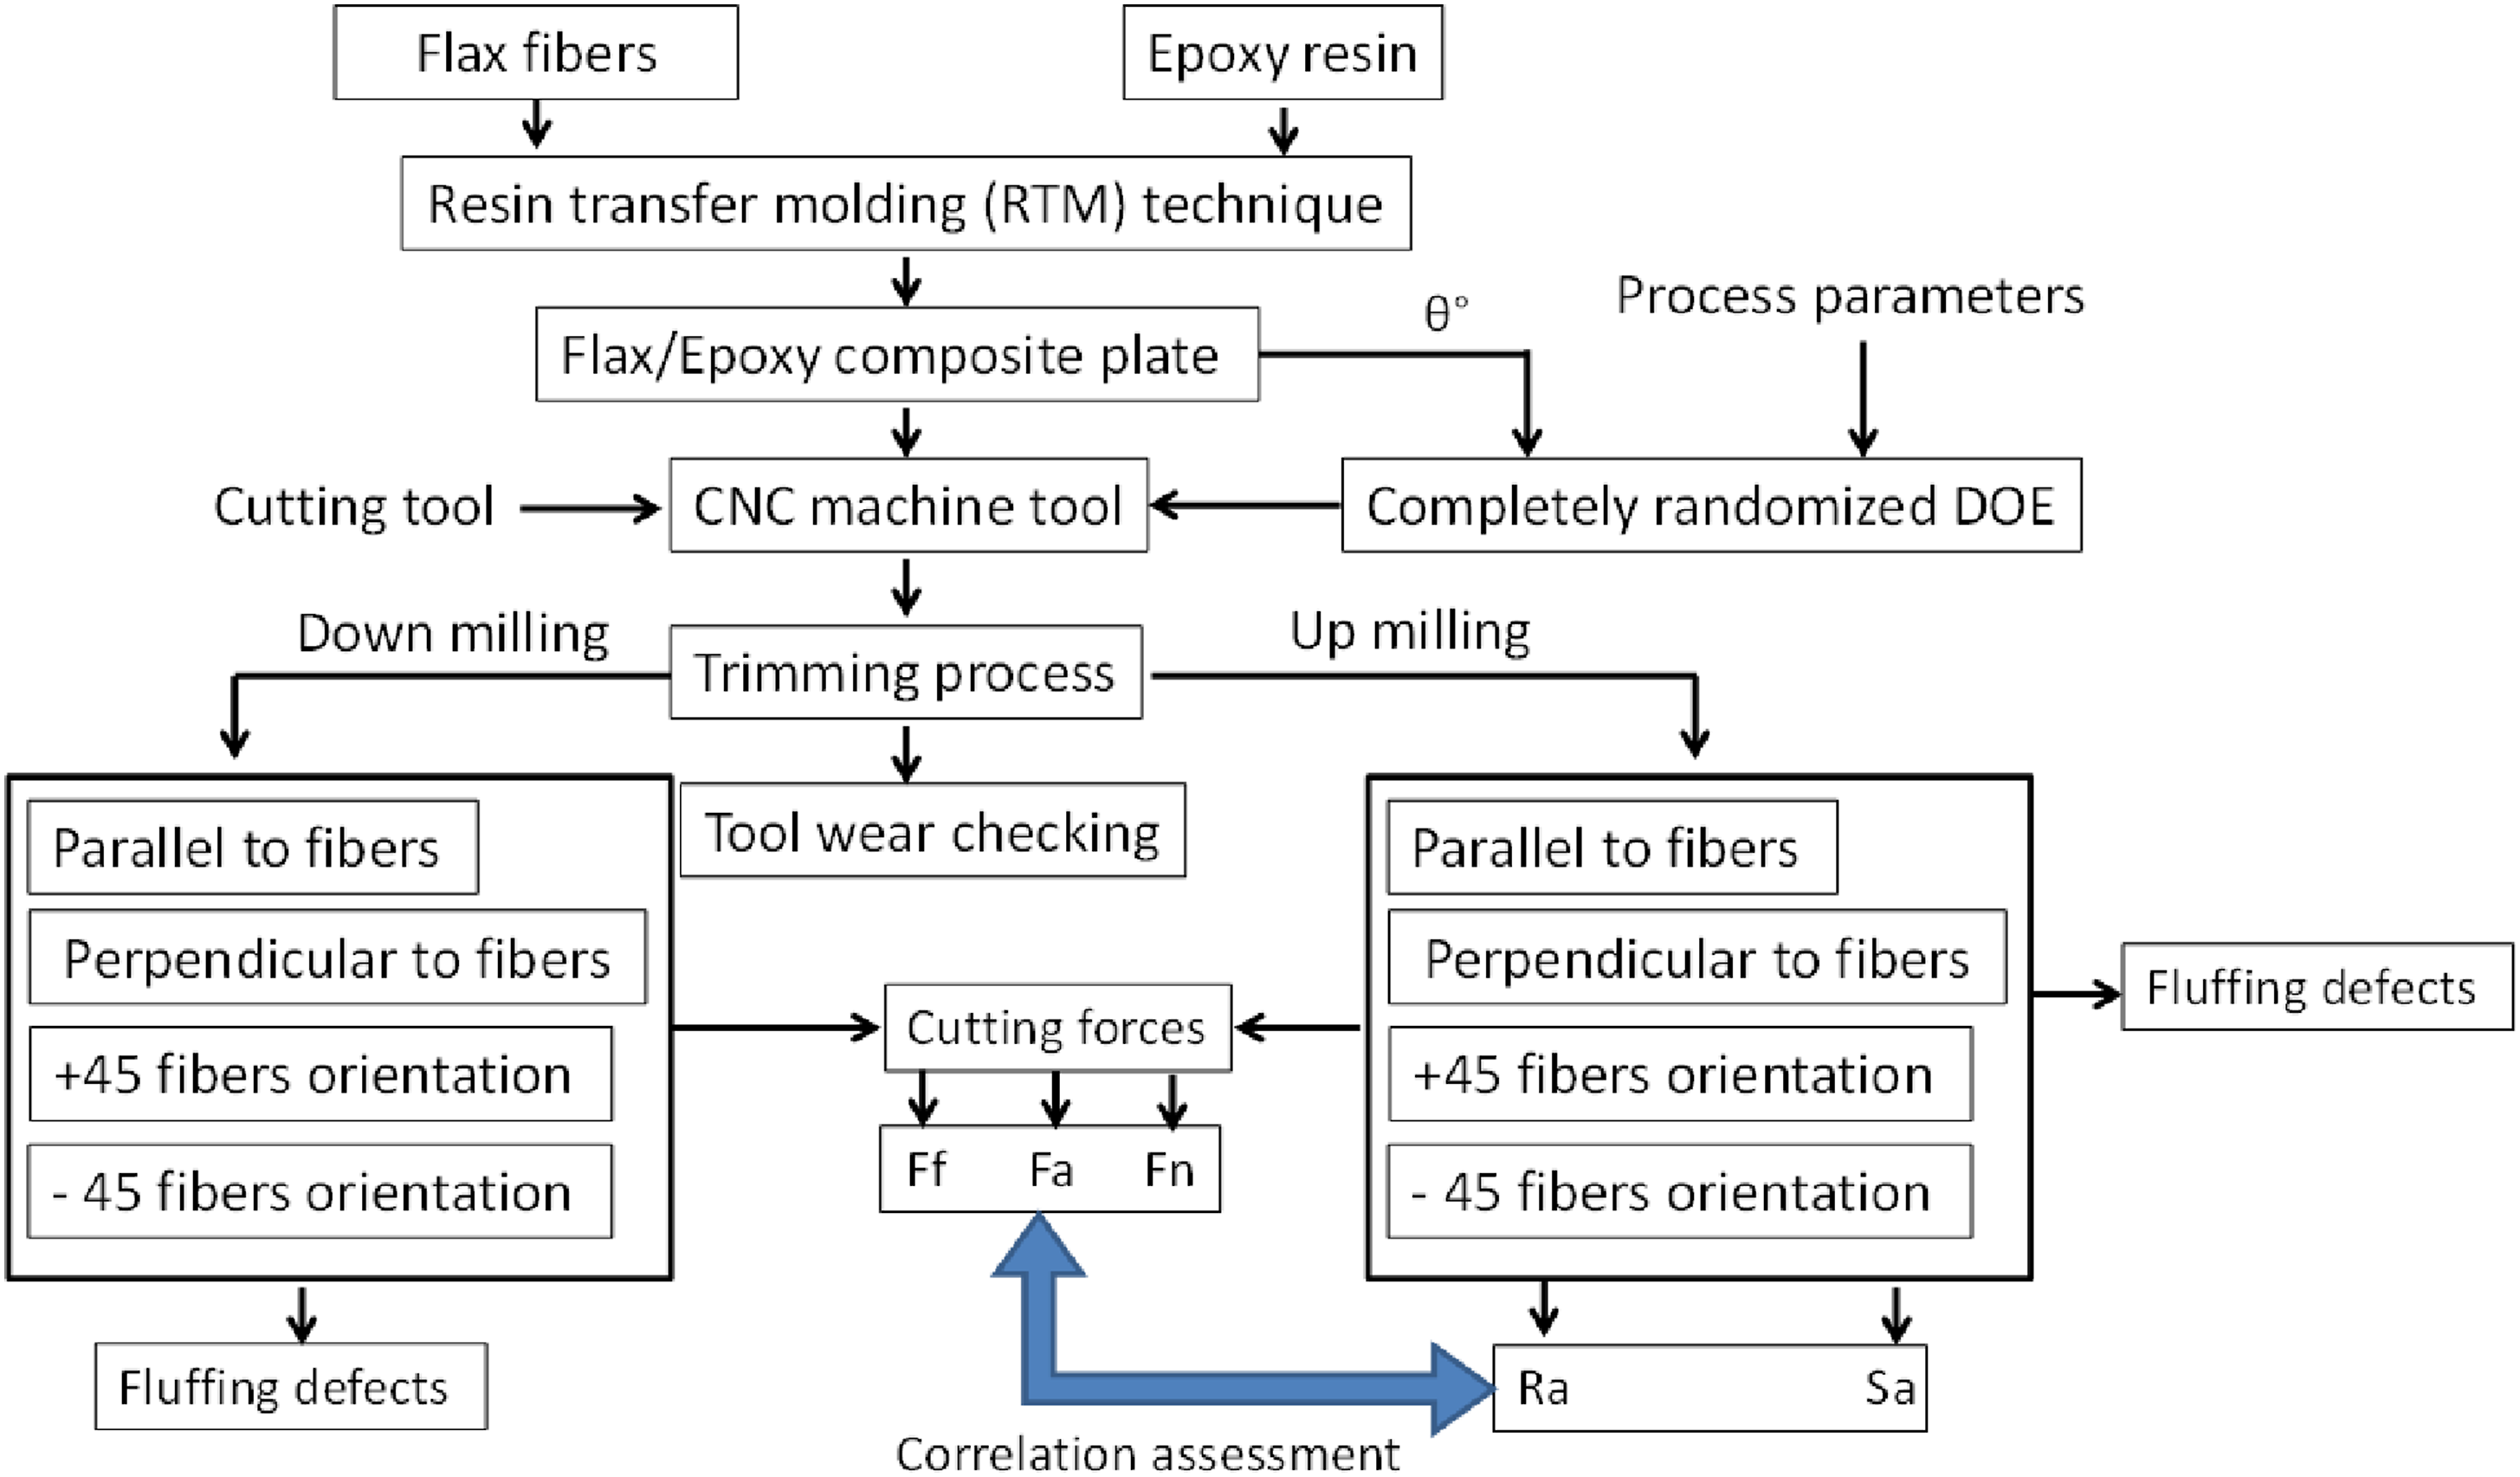
Results and discussion
Measuring cutting force is crucial for understanding how composite materials behave during machining. However, it’s essential to ensure the data collected is highly accurate to draw dependable conclusions. The validation of the normality assumption is particularly significant in such cases. Confirming the normality assumption holds great importance across various statistical methods, including correlation, regression, t-tests, and analysis of variance, especially when parametric tests are involved. Emphasizing the normality assumption becomes more critical when establishing reference intervals for variables. The accuracy and reliability of parametric tests heavily rely on substantiating this foundational principle. Confirming the normality assumption serves as a cornerstone that enhances the credibility of these techniques, given its direct impact on their validity and the meaningful interpretation of results. Therefore, conducting a comprehensive evaluation of the data’s adherence to a normal distribution is imperative before applying parametric tests, thereby ensuring the integrity and precision of subsequent analyses.
Assessment of the normality assumption
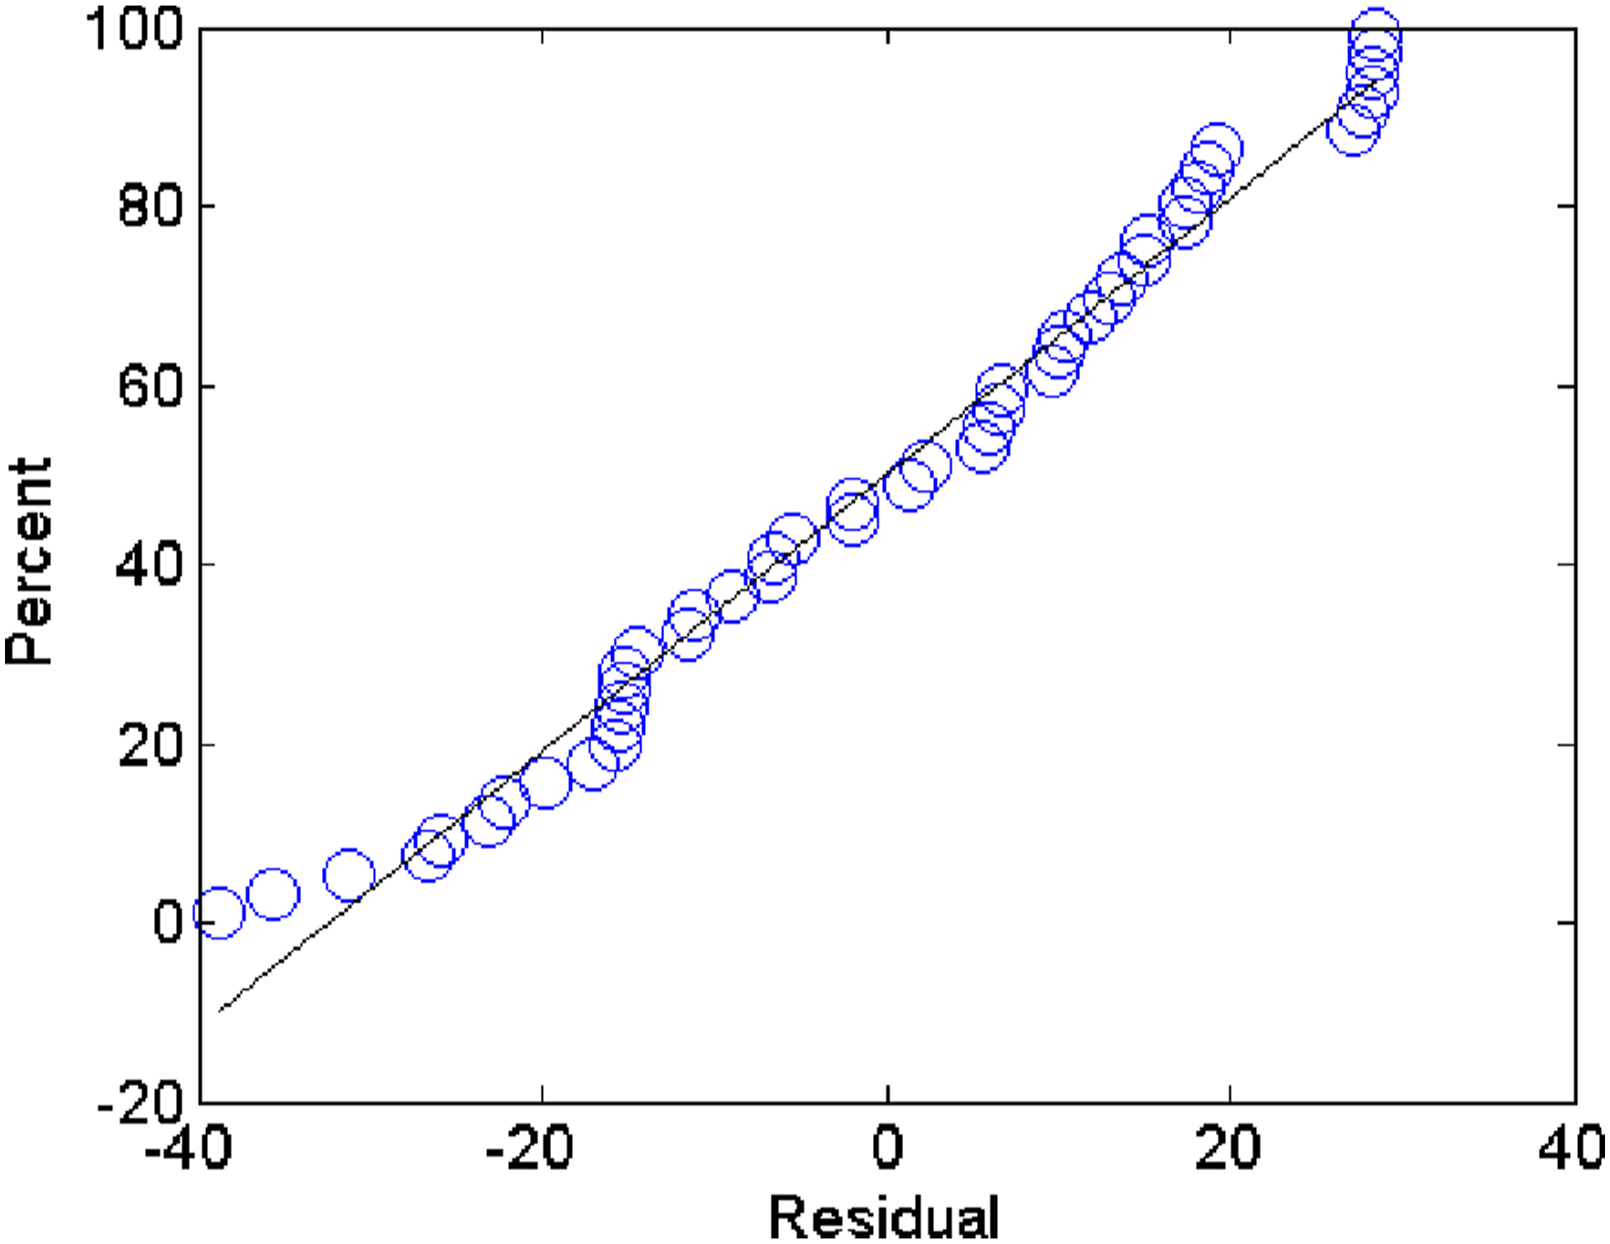
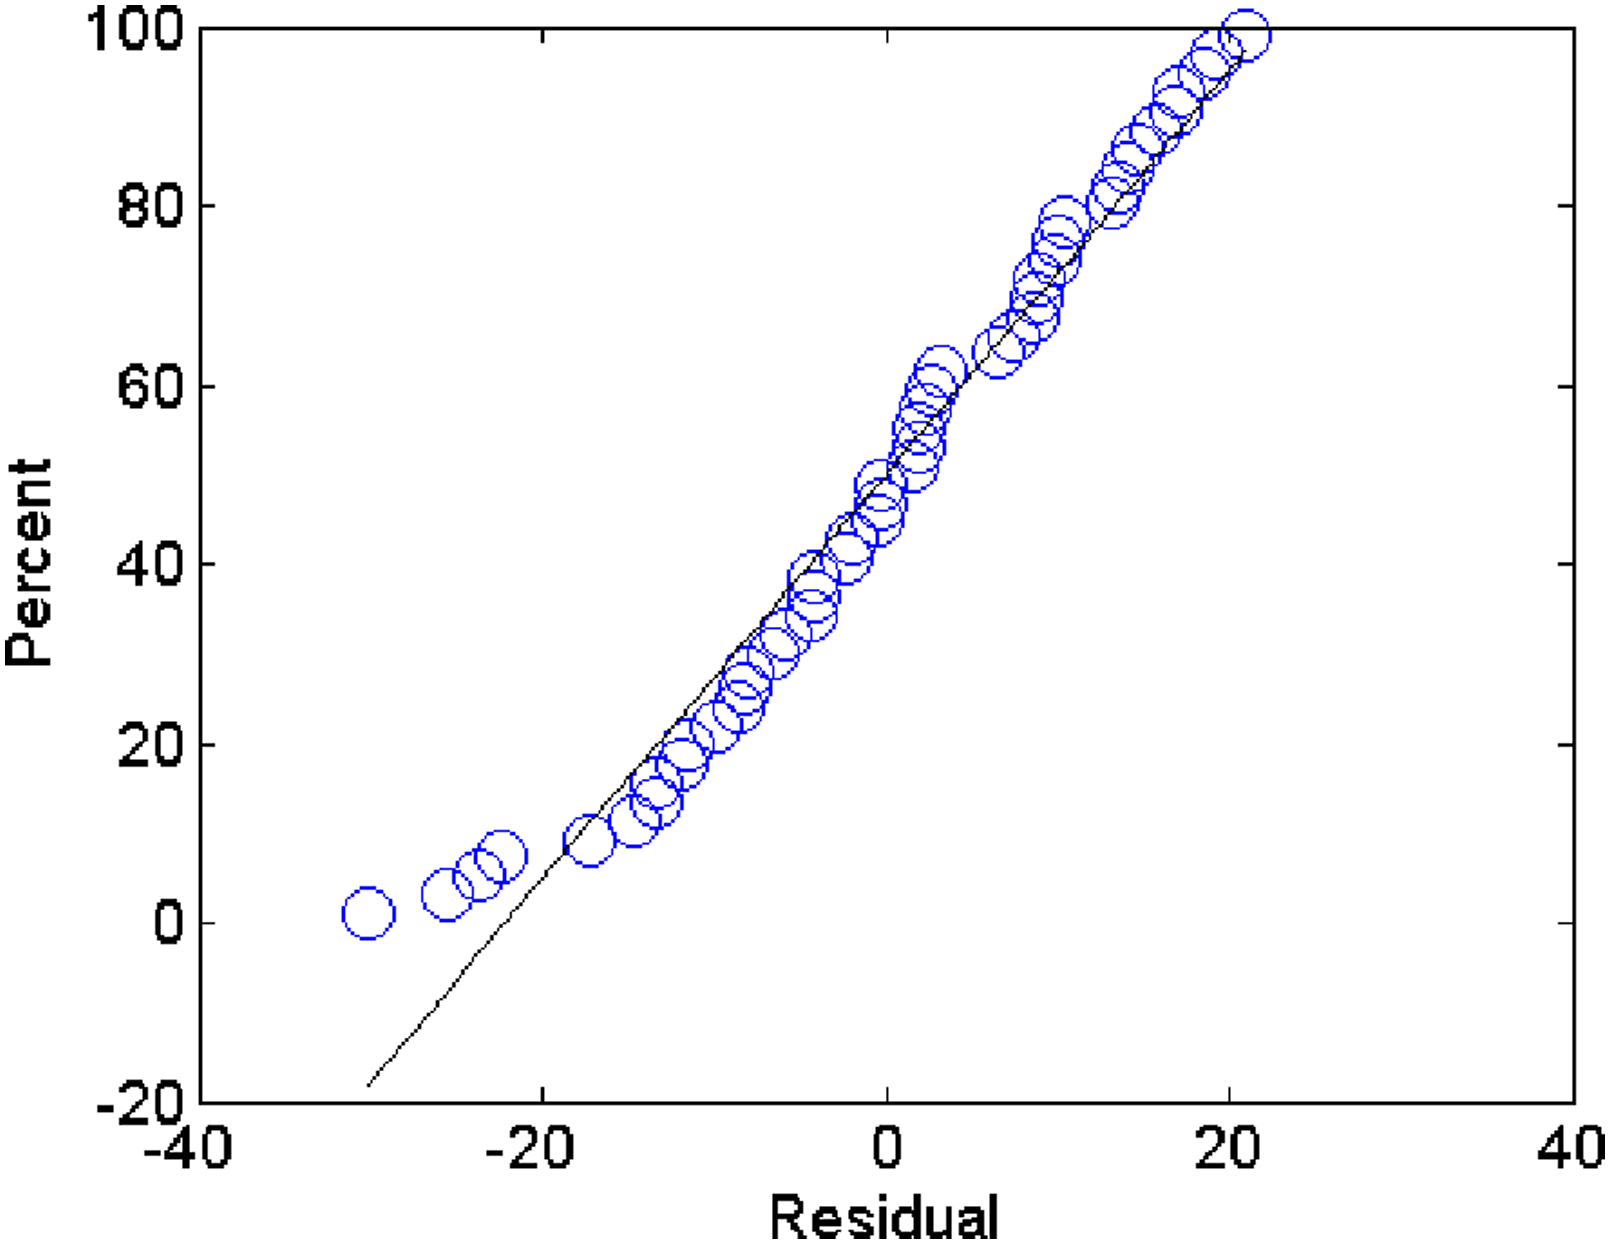
Figures 11, 12, and 13 provide an exhaustive assessment of the normality assumption with respect to the feed force, normal force, and passive force datasets. This assessment utilizes normal probability plots of the residuals. A detailed analysis of these figures reveals that the examined datasets validate their conformity to a normal distribution, as evident from their close alignment with the straight line on the probability plot. Any deviations from this straight line could suggest the possible existence of non-normality in the residuals. Assessing the normality assumption concerning the feed force dataset. Assessing the normality assumption concerning the normal force dataset. Assessing the normality assumption concerning the passive force dataset.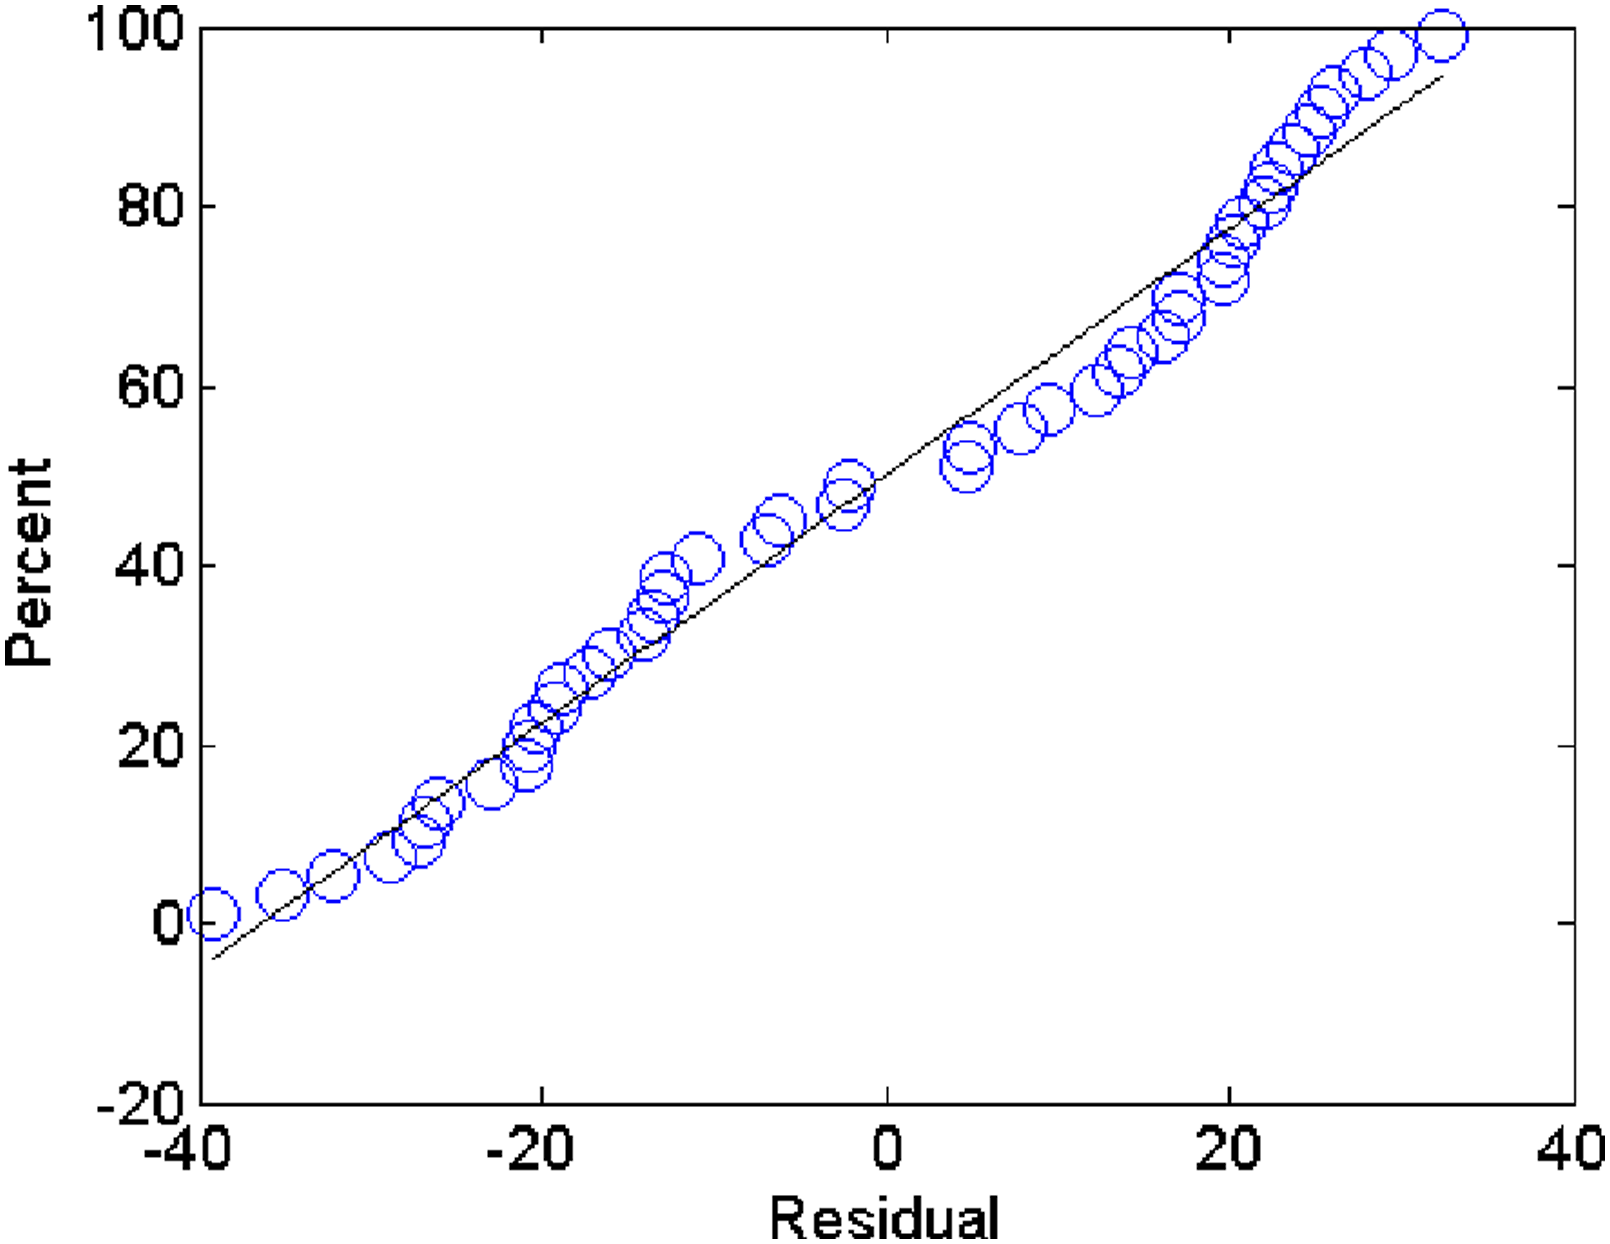
Percentage contributions
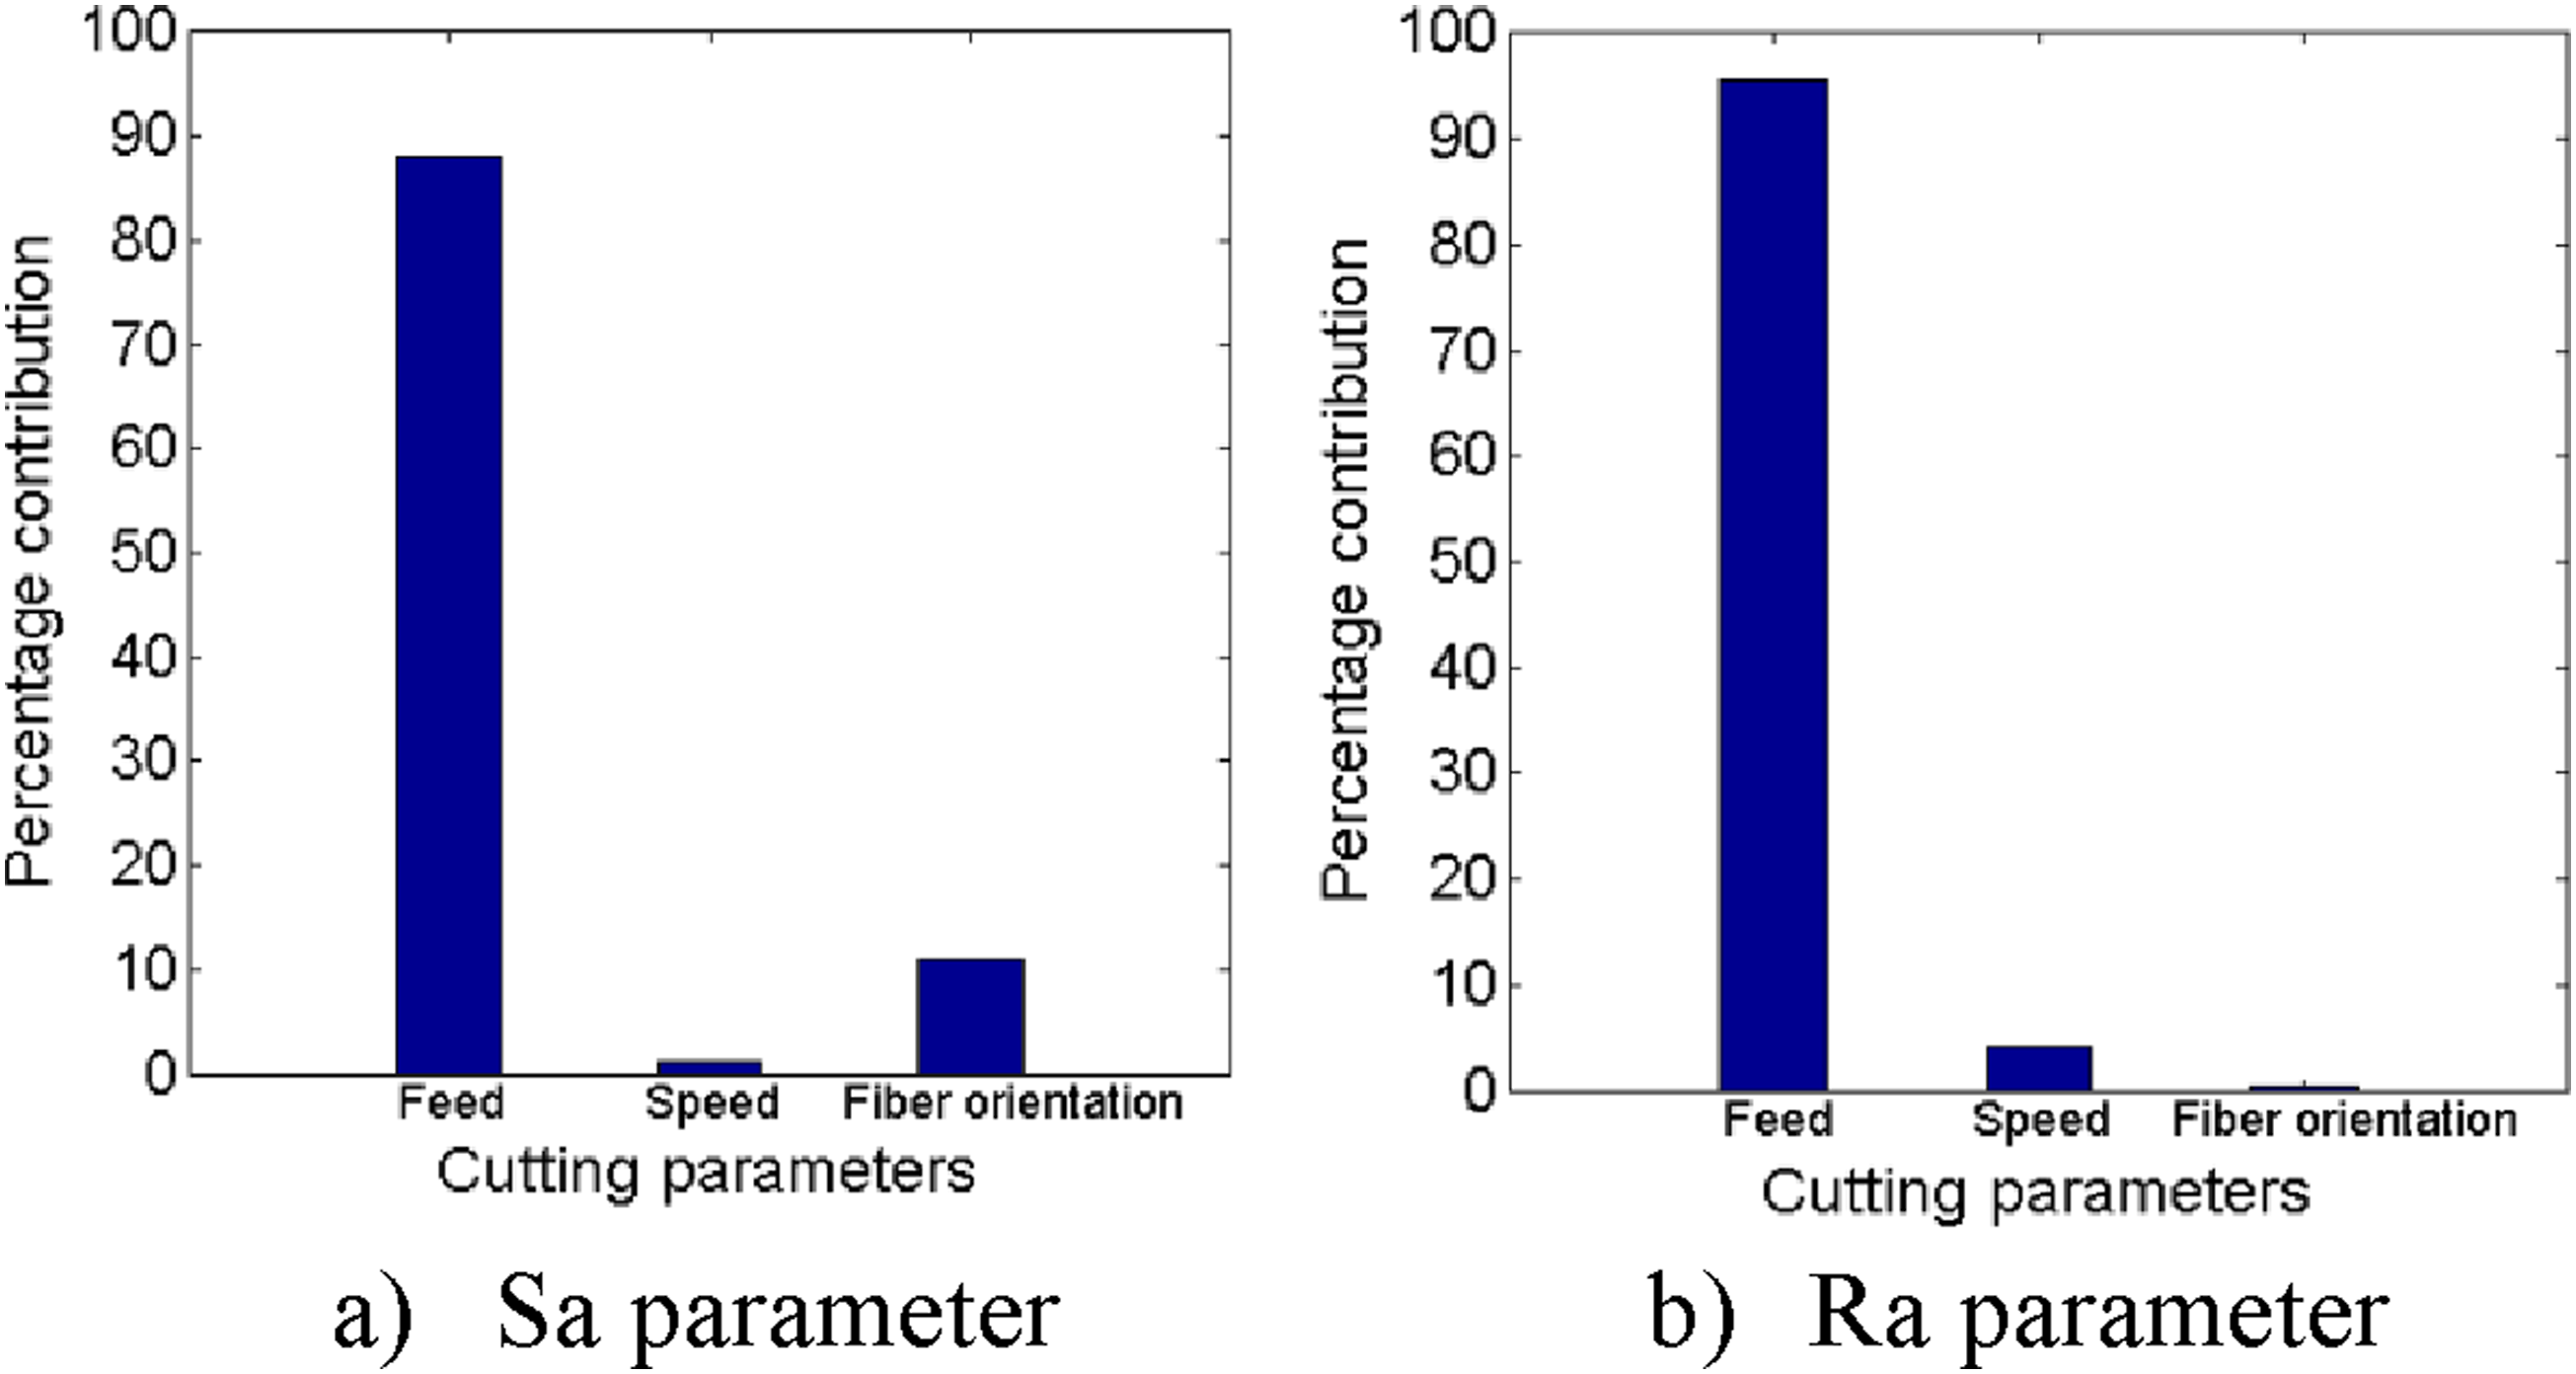
Figures 14 and 15 showcase the percentage contributions of feed rate, cutting velocity, and fiber orientation to various output responses, including feed force, normal force, passive force, surface roughness (Sa), and roughness (Ra). These percentage contributions offer insights into the relative impact of each parameter on the specified outcomes. Percentage contribution of cutting parameters on the cutting force components. (a) Feed force (Ff). (b) Normal force (Fn). (c) Passive force (Fp). Percentage contribution of cutting parameters on the Sa and Ra parameters. (a) Sa parameter. (b) Ra parameter.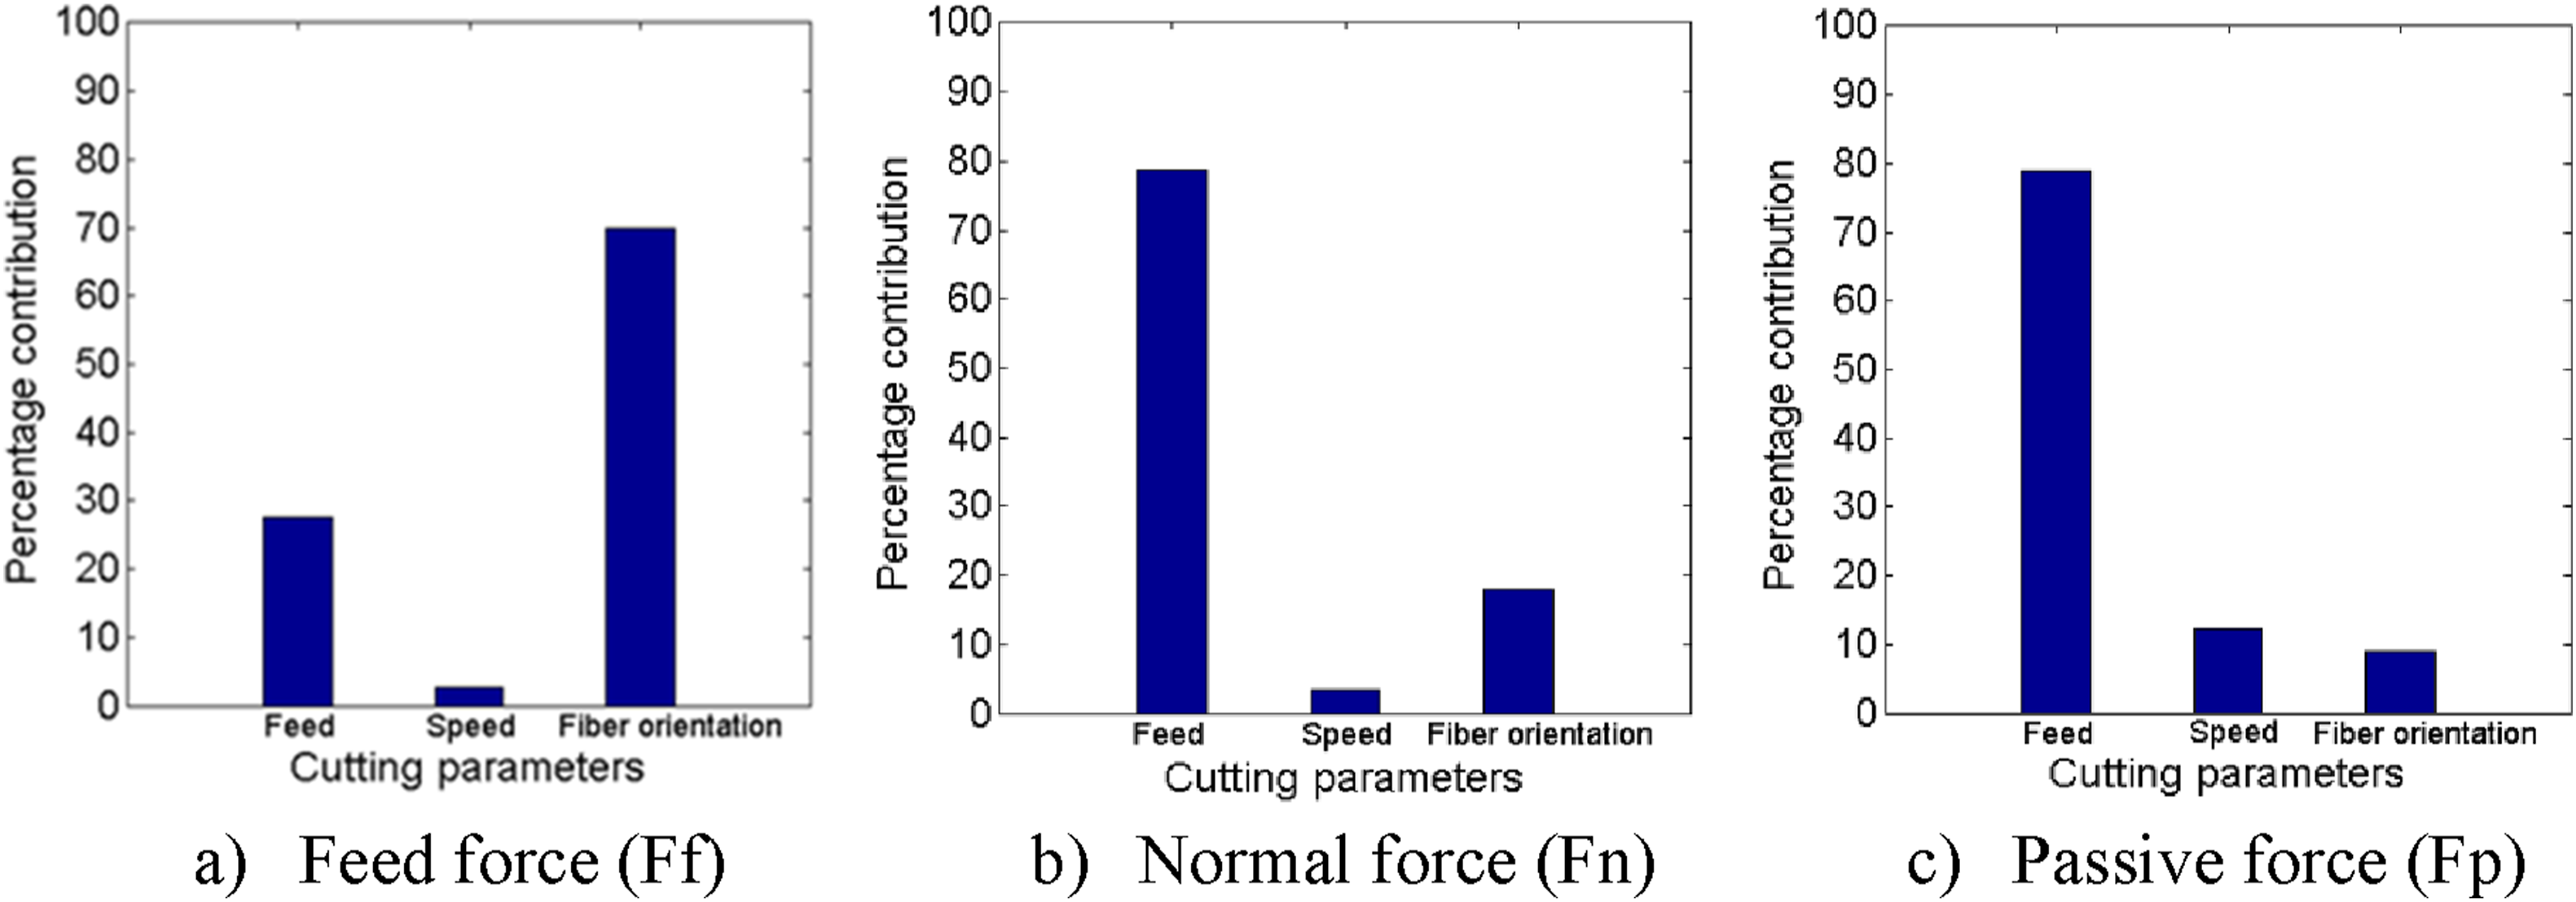
Starting with feed force (Figure 14(a)), the contributions reveal that fiber orientation has the most substantial influence at 69.79%, followed by feed rate at 27.63%, and cutting velocity with a minimal contribution of 2.58%. This suggests that fiber orientation plays a dominant role in determining feed force, while feed rate also holds significance.
Moving to normal force (Figure 14(b)), the largest contributor is feed rate at 78.66%, indicating its substantial influence. Cutting velocity contributes 3.31%, and fiber orientation has a small impact at 18.03%. This suggests that feed rate is the primary determinant of normal force, with cutting velocity and fiber orientation also playing roles, albeit to a lesser extent.
In the case of passive force (Figure 14(c)), the contributions highlight that feed rate has the most prominent influence at 78.84%, followed by cutting velocity at 12.23%, and fiber orientation with an 8.93% contribution. This indicates that feed rate is the primary factor influencing passive force, with cutting velocity and fiber orientation also contributing significantly.
For surface roughness (Sa), the largest contributor is feed rate at 88.06%, demonstrating its strong influence on this parameter. Cutting velocity contributes minimally at 1.03%, while fiber orientation holds a moderate contribution of 10.91% (Figure 15(a)). This indicates that feed rate is the dominant factor affecting Sa, while fiber orientation also plays a role.
Regarding roughness (Ra), the majority of the contribution comes from feed rate at 95.48%, indicating its substantial influence. Cutting velocity contributes 4.15%, and fiber orientation has the smallest impact at 0.37% (Figure 15(b)). This implies that feed rate has the most pronounced effect on Ra, with cutting velocity also playing a role, while fiber orientation has a relatively minor influence.
Correlation assessment
The correlation coefficients provide valuable insights into how different cutting parameters relate to surface roughness and cutting forces. These relationships can guide machining strategies and process optimization efforts, allowing for better control over the machining outcomes. To calculate the correlation coefficient between the variables, the corrcoef function in MATLAB was employed. This function computes the correlation coefficient based on the Pearson correlation coefficient, which is defined as the covariance of the variables divided by the product of their standard deviations. This approach provides a measure of the linear relationship between the variables, with values ranging from −1 to 1. It is important to note that these values are unitless.
Correlation coefficients between the input and output variables.
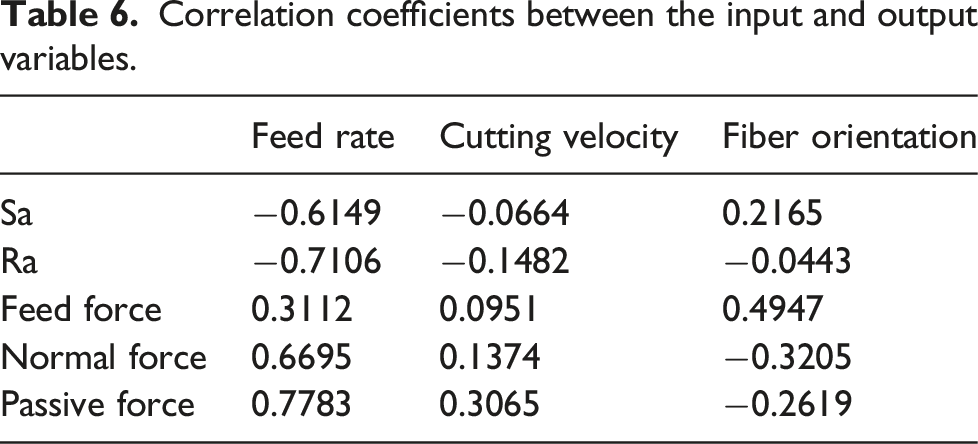
p-values results.
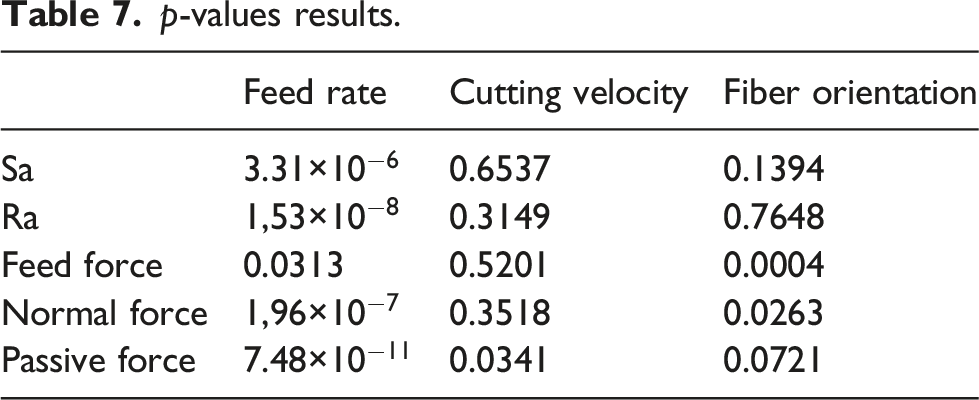
Starting with surface roughness (Sa) and cutting parameters, a negative correlation of −0.6149 with feed rate suggests that higher feed rates tend to be associated with lower Sa values, indicating that faster feed rates result in smoother surfaces. This correlation is highly statistically significant, with a p-value of
For surface roughness (Ra), negative correlations across all cutting parameters are observed. The stronger negative correlation of −0.7106 with feed rate indicates that higher feed rates contribute to lower Ra values, indicating smoother surfaces. This correlation is highly statistically significant, with a p-value of
Turning to cutting forces, feed force shows a positive correlation with feed rate (0.3112), indicating that higher feed rates lead to greater feed forces. This correlation is statistically significant (p-value = .0313). The small positive correlation of 0.0951 with cutting velocity implies a limited impact of velocity on feed force, although this correlation is not statistically significant (p-value = .5201). The moderate positive correlation of 0.4947 with fiber orientation indicates that specific orientations might result in higher feed forces, and this correlation is highly statistically significant (p-value = .0004).
Normal force exhibits positive correlations with both feed rate (0.6695) and cutting velocity (0.1374), suggesting that higher feed rates and velocities are associated with higher normal forces. These correlations are highly statistically significant, with p-values of
Passive force displays strong positive correlations with both feed rate (0.7783) and cutting velocity (0.3065), indicating that higher feed rates and velocities result in greater passive forces. These correlations are highly statistically significant, with p-values of
In summary, the correlation coefficients, along with their respective p-values, provide a comprehensive understanding of the relationships between variables and their statistical significance. Researchers should consider both the strength and significance of these correlations when interpreting the results.
Correlation coefficients between the Sa, Ra and cutting force components.
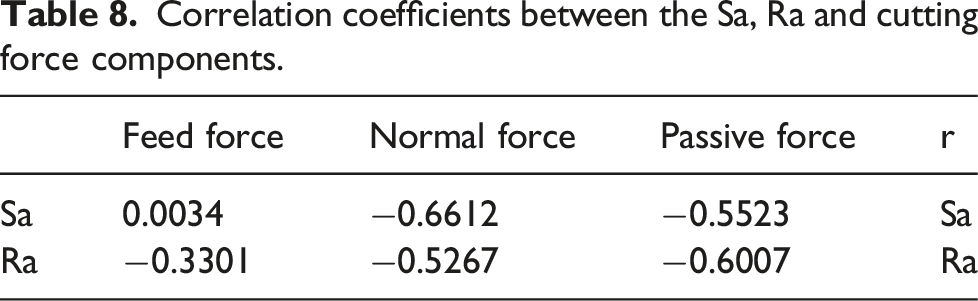
p-values results for Sa, Ra and cutting force components.
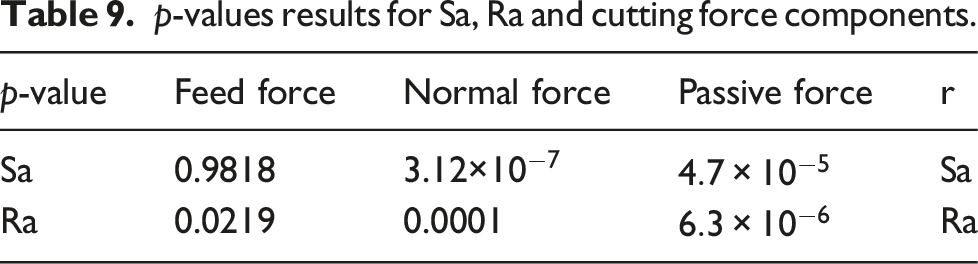
Turning to surface roughness (Ra), it demonstrates a moderately strong negative correlation of −0.3301 with feed force, indicating that higher feed forces are associated with smoother surfaces. This correlation is statistically significant, as indicated by a p-value of 0.0219. Ra displays a moderately strong negative correlation of −0.5267 with normal force, suggesting that higher normal forces are connected to smoother surfaces. This correlation is highly statistically significant, supported by a low p-value of 0.0001. Additionally, Ra exhibits a strong negative correlation of −0.6007 with passive force, indicating that higher passive forces tend to result in smoother surfaces. This correlation is highly statistically significant, with an extremely low p-value of
Analysis of the fluffing defects
There are several criteria other than surface roughness to assess the machining quality of composite materials, such as delamination and uncut fibers. In the study of grooving the FFRP plate, it was observed that there is no delamination after machining. However, the occurrence of fluffing defects on the lateral sides of the majority of the grooves was observed (See Figure 16). Machined grooves at different fibers orientations.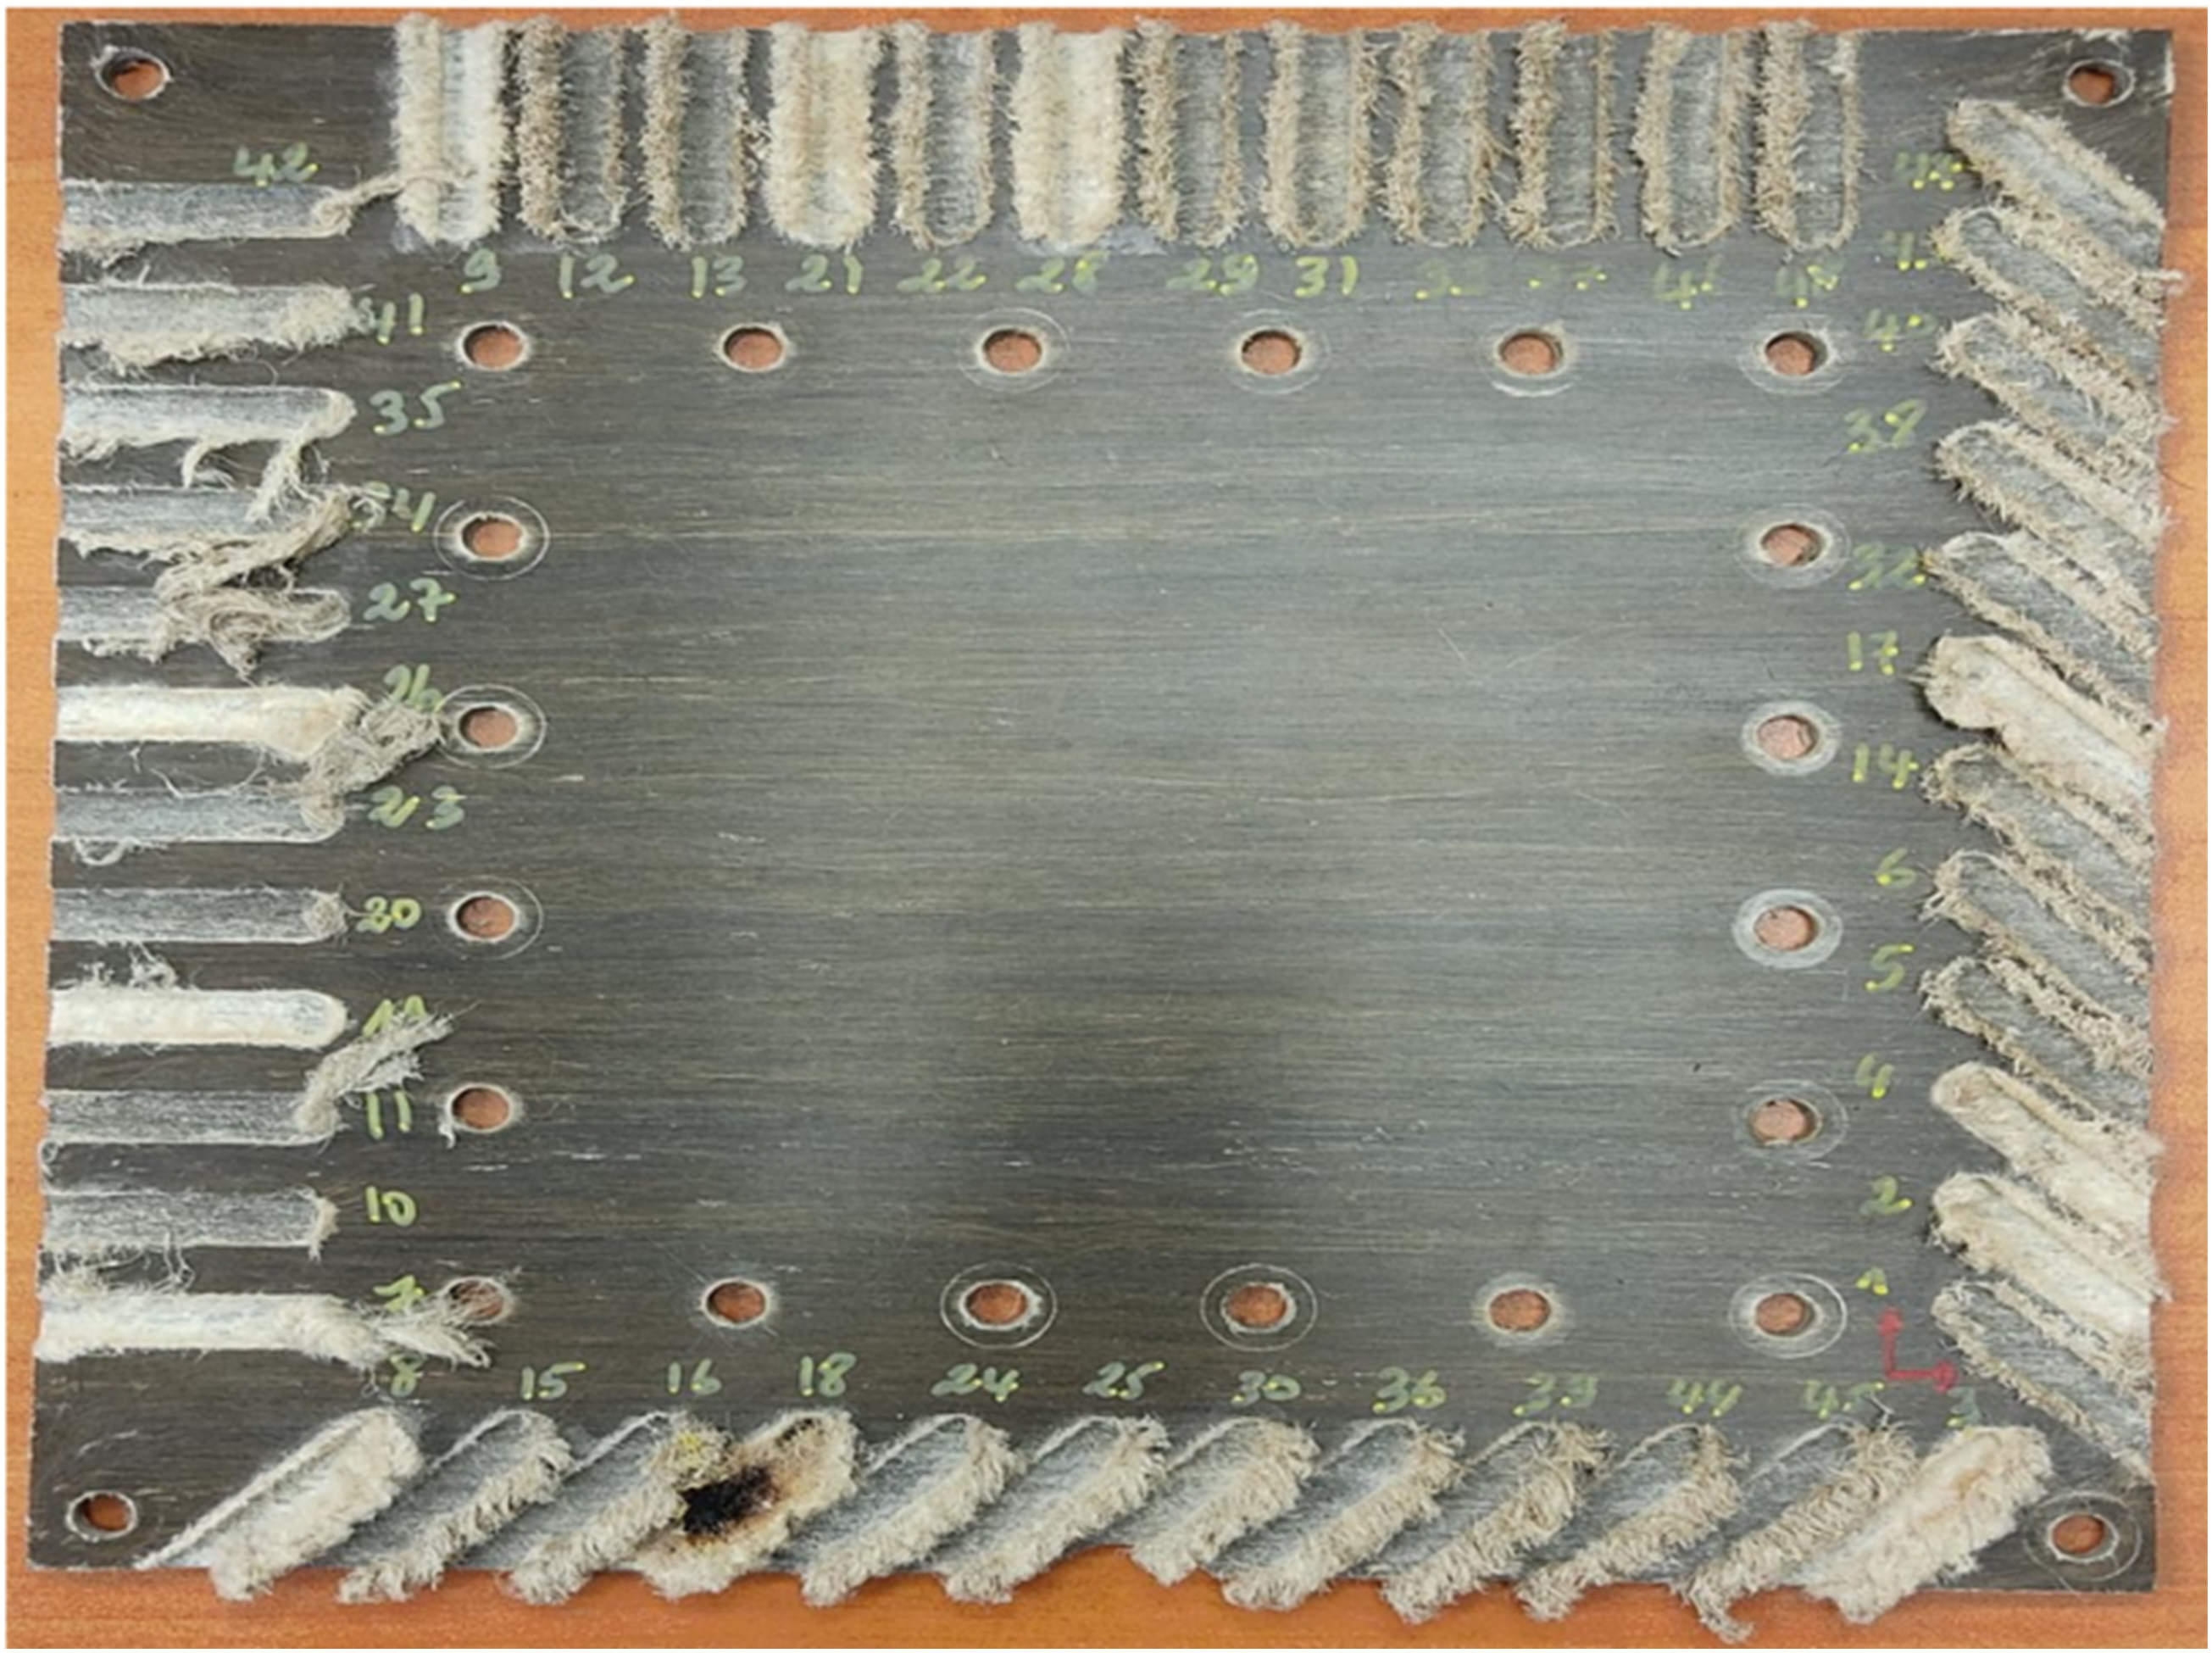
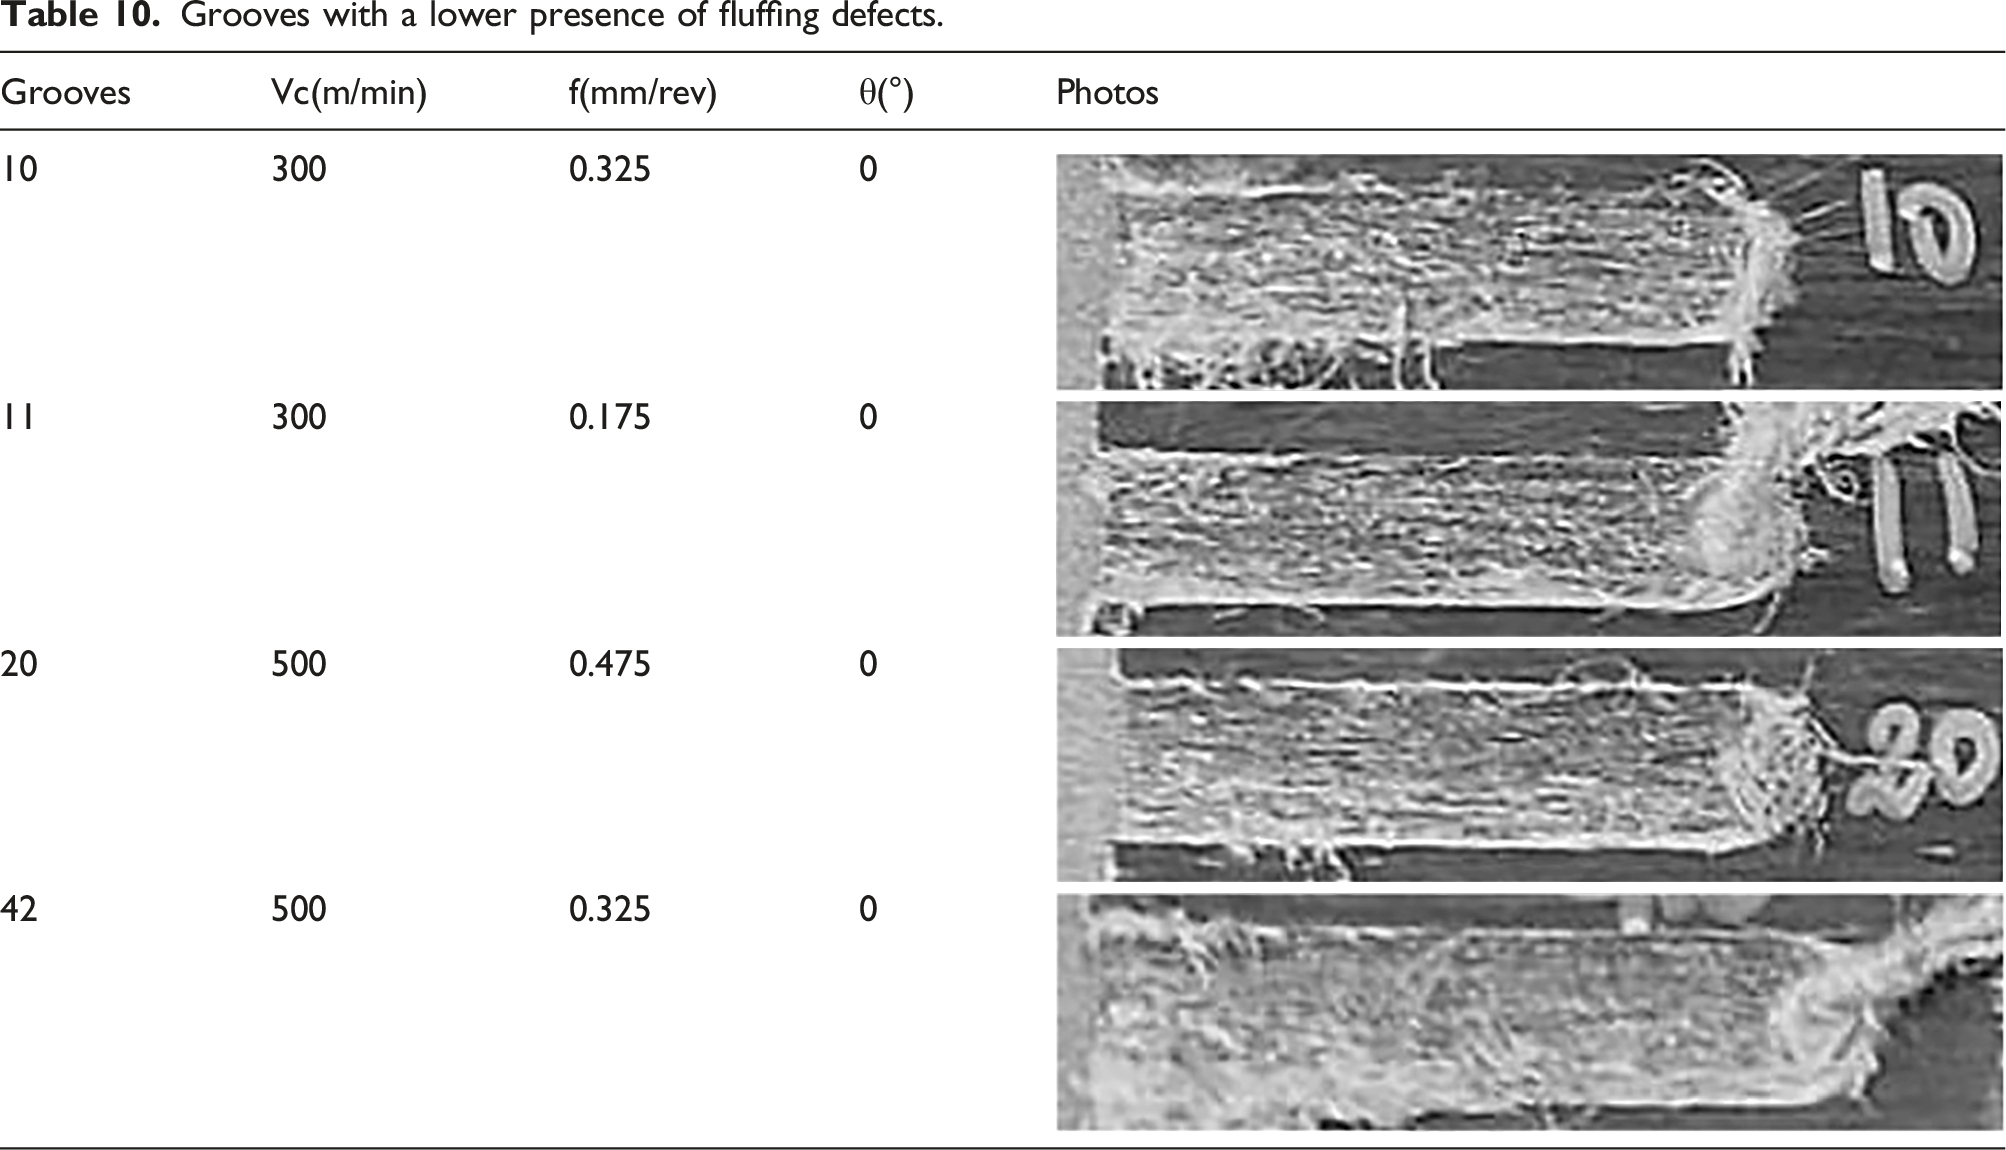
Grooves with a lower presence of fluffing defects.
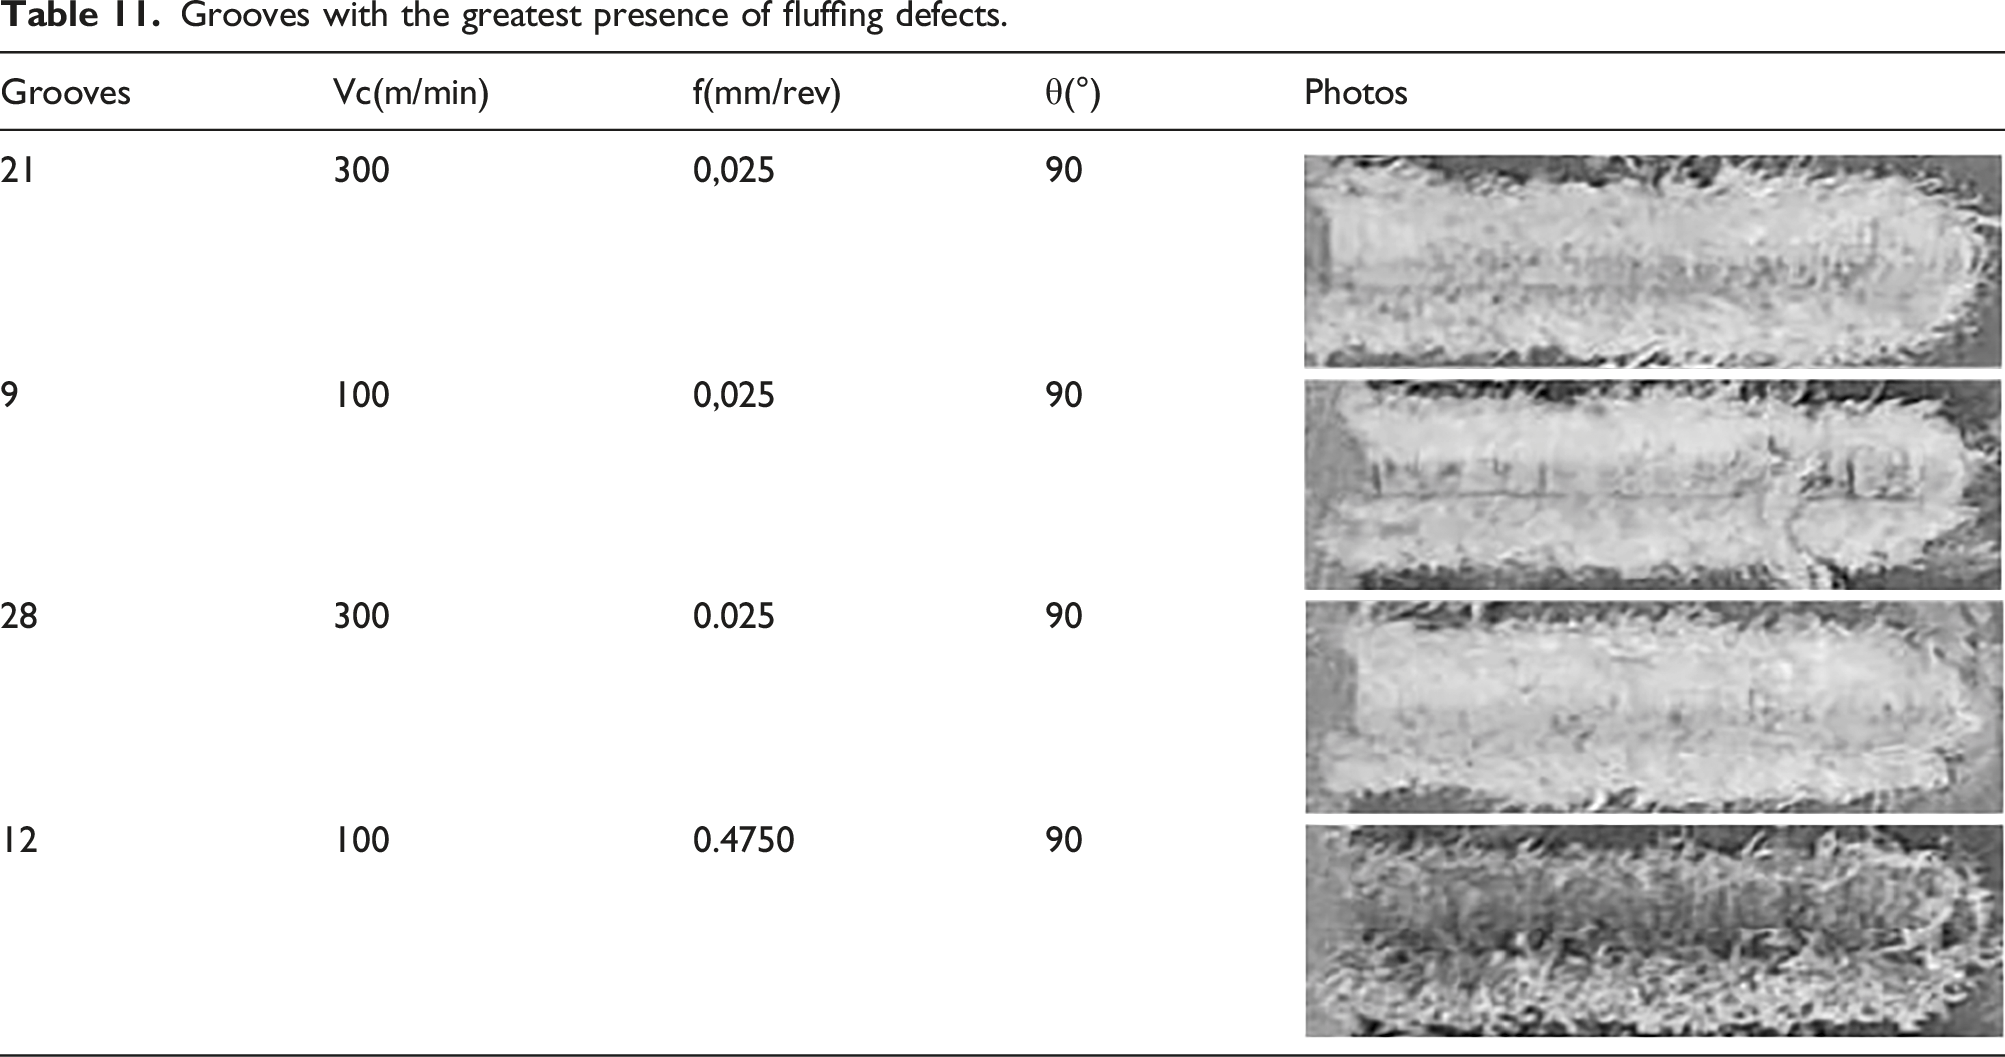
Grooves with the greatest presence of fluffing defects.
Additionally, it’s worth noting the presence of fluffing defects, especially when fibers are oriented at 0°, at the bottom of the grooves (Figure 16). This occurrence can be attributed to a reduction in the feed rate as the milling tool nears the groove’s bottom. When the feed rate decreases, the tool faces increased resistance from the material, which may, in turn, displace or push the fibers upwards, resulting in fluffing defects.
The detected burn marks appear precisely at slot 18 (Figure 16), which aligns with the highest cutting speed of 500 m/min and the lowest feed rate of 0.025 mm/min. This phenomenon is attributable to the interaction between low feed rates and high cutting speeds, causing an increase in temperature within the cutting zone. This elevated temperature leads to machining-induced heat, a predominant factor responsible for the observed burning.
During the process of slotting flax fiber-reinforced polymer (FFRP) composites, various defects have been identified, with their severity varying depending on the orientation of the fibers. Here, we delve into a more detailed analysis of these observations:
When the fibers are oriented at −45°, the occurrence of fluffing defects is nearly identical for both the up-milling and down-milling sides (Figure 17). This symmetry indicates that fiber orientation at −45° has a consistent effect on the distribution of fluffing defects during the milling process. The balance between the forces applied in up-milling and down-milling results in similar defect patterns. This suggests that the forces acting on the fibers exhibit a degree of symmetry. Consequently, the orientation of fibers at −45° may not introduce significant variations in the forces encountered during milling, leading to a uniform presence of fluffing defects. Grooves machined at −45° fibers orientation.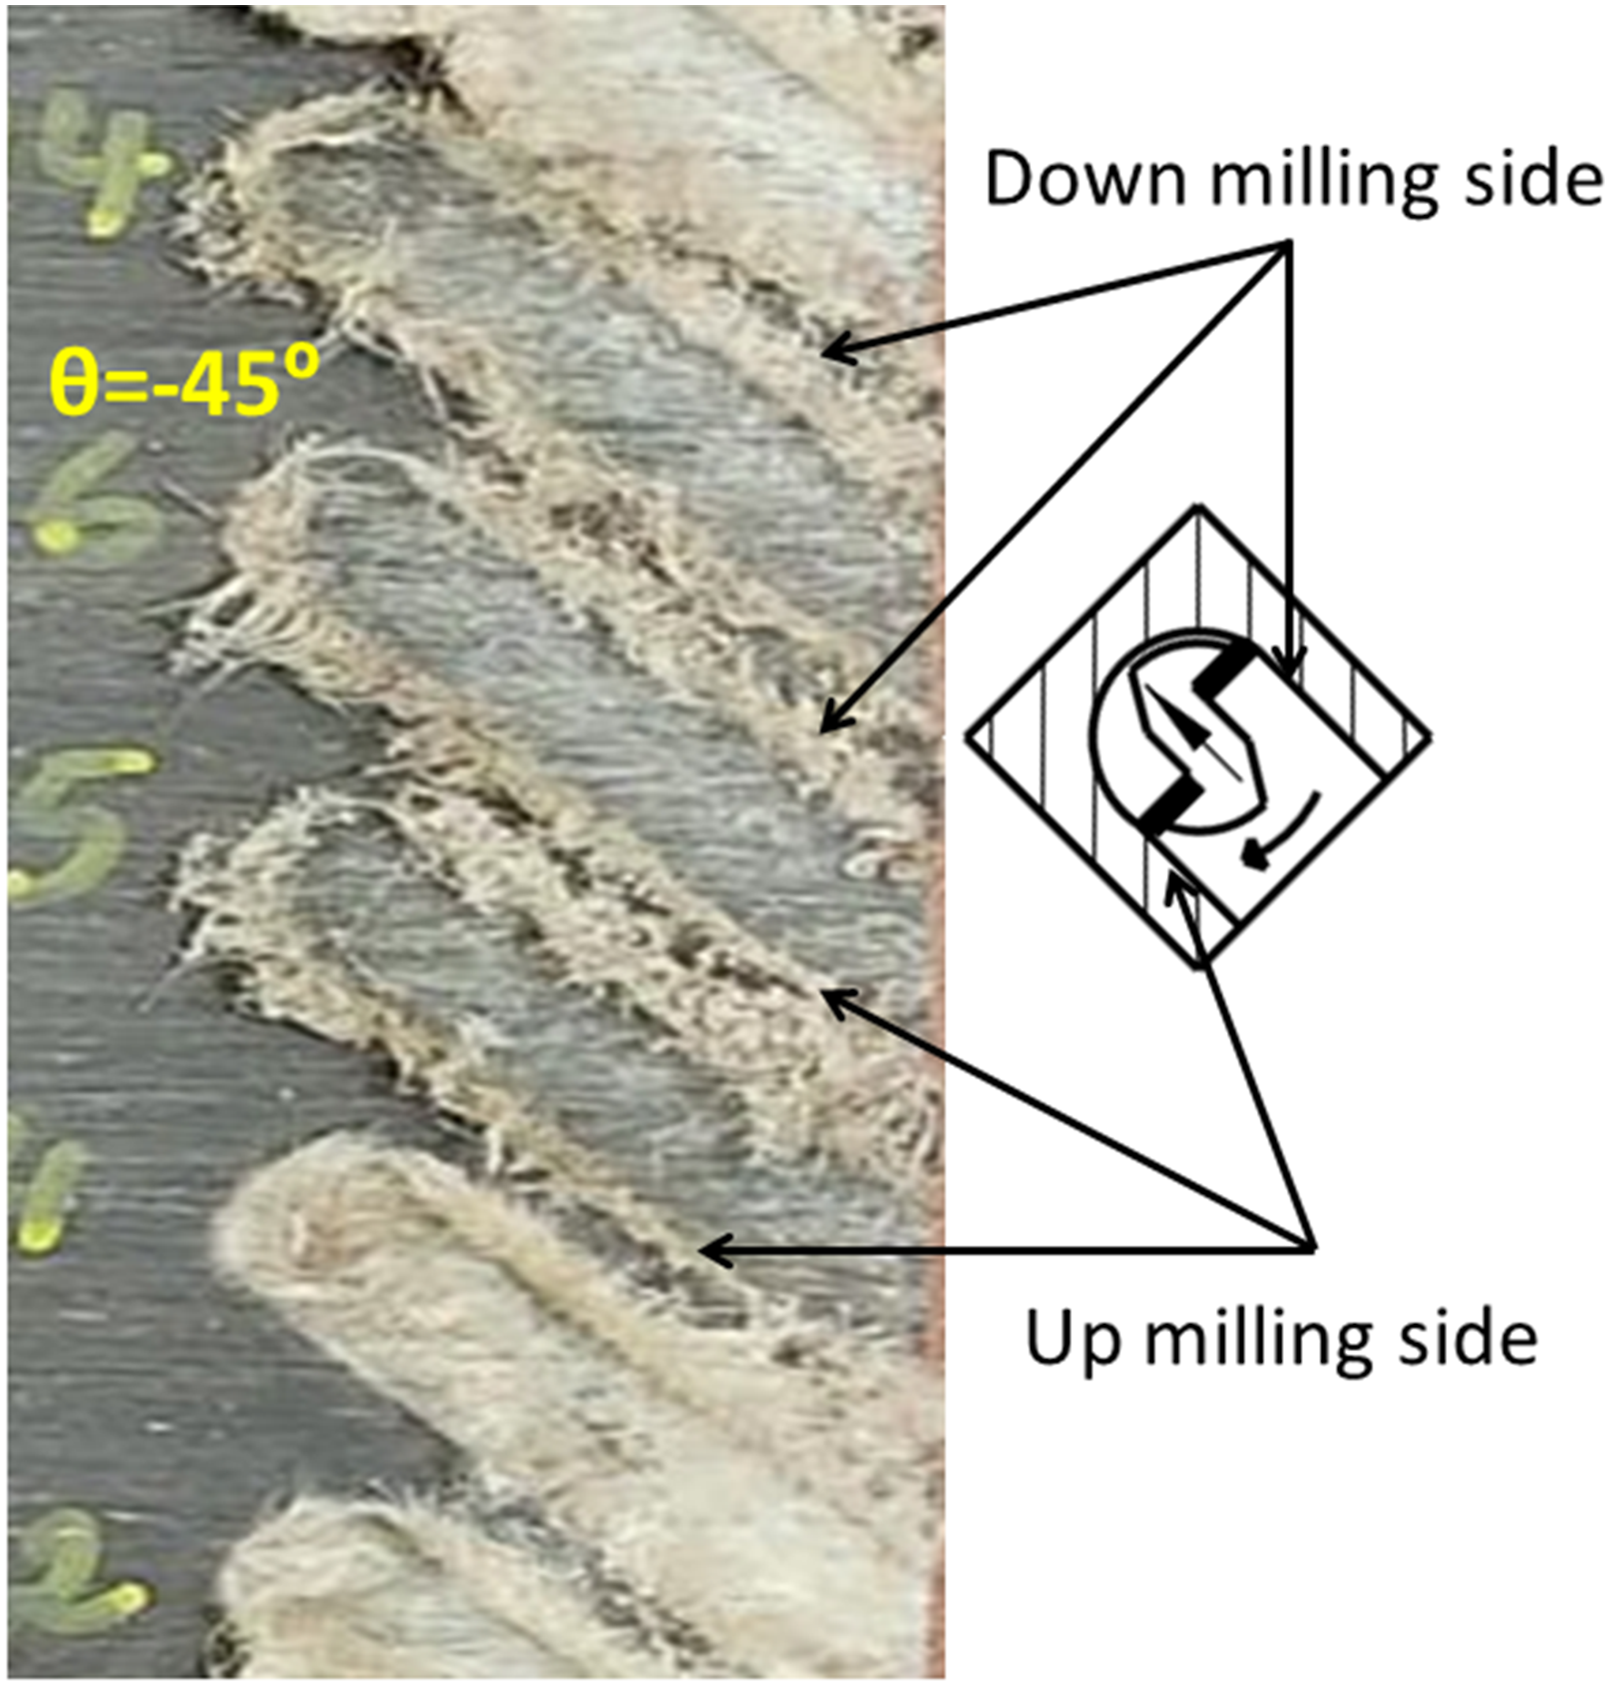
In the case of fibers oriented at 45°, a significant distinction becomes evident between the up-milling and down-milling sides (Figure 18). Few fluffing defects are observed on the up-milling side, suggesting that this orientation facilitates smoother milling in that direction. These results align with the findings of Chegdani et al.,
23
where a fiber orientation of θ = 45° exhibited optimal machinability characterized by efficient fiber shearing, minimal surface roughness, and reduced cutting energy dissipation from shearing and friction. This is attributed to the high shear stiffness associated with the 45° fiber orientation.
23
However, on the down-milling side, fluffing defects are notably more prevalent. This dissimilarity highlights the influence of fiber orientation on milling quality, with the 45° orientation distinctly favoring one milling direction over the other. The minimal occurrence of fluffing defects on the up-milling side and their abundance on the down-milling side at 45° fiber orientation suggest directional imbalances in forces. Fibers aligned at 45° may experience varying shear forces depending on the milling direction, resulting in more pronounced fluffing defects when milling downward, potentially due to fibers being pushed against the cutting direction. Grooves machined at 45° fibers orientation.
When fibers adopt a 0° orientation, the occurrence of fluffing defects is negligible on both the up-milling and down-milling sides (Figure 19). This outcome reflects a favorable milling condition where fiber alignment leads to reduced fluffing defects regardless of the milling direction. The 0° orientation appears to enhance milling uniformity, resulting in improved surface quality. The minimal presence of fluffing defects on both sides, with fibers oriented at 0°, suggests that the fibers align well with the milling direction. This alignment minimizes the likelihood of fibers getting entangled or displaced during milling, ultimately contributing to smoother surfaces. Grooves machined at 0° fibers orientation.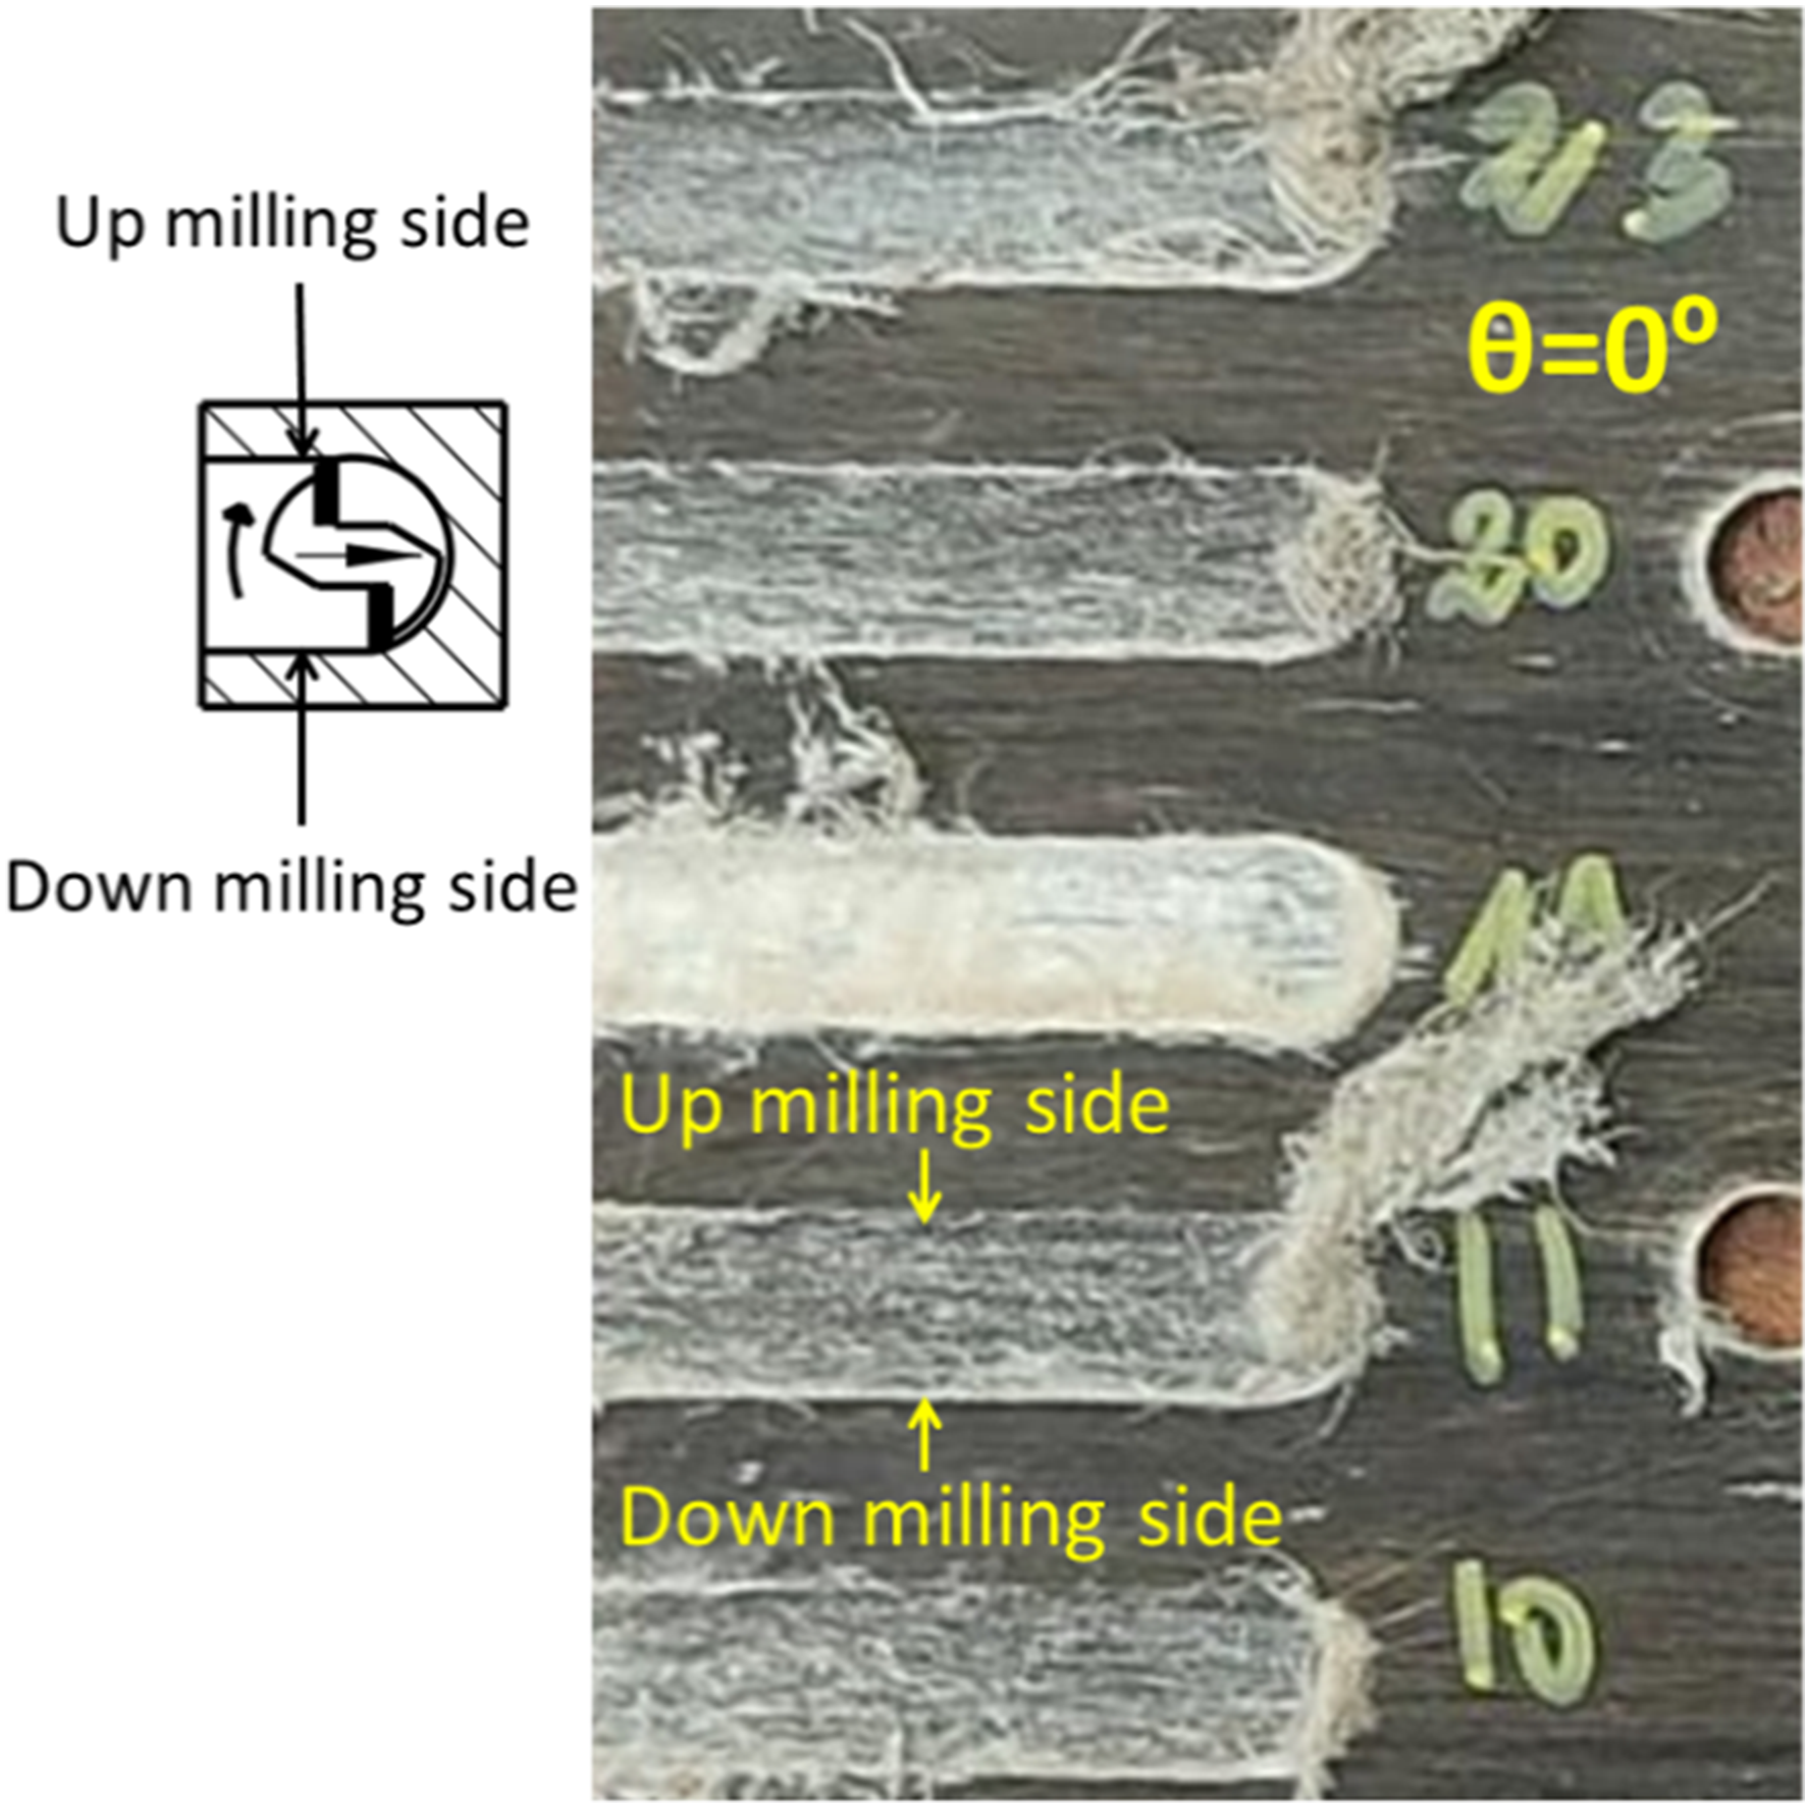
Lastly, when fibers are oriented at 90°, a similar directional bias is evident, but with distinct consequences. Fluffing defects are more noticeable on the down-milling side compared to the up-milling side, underscoring a heightened influence of fiber orientation on the down-milling aspect in this configuration (Figure 20). The milling dynamics appear to interact differently with fibers oriented at 90°, leading to a more substantial presence of fluffing defects during down-milling. Grooves machined at 90° fibers orientation.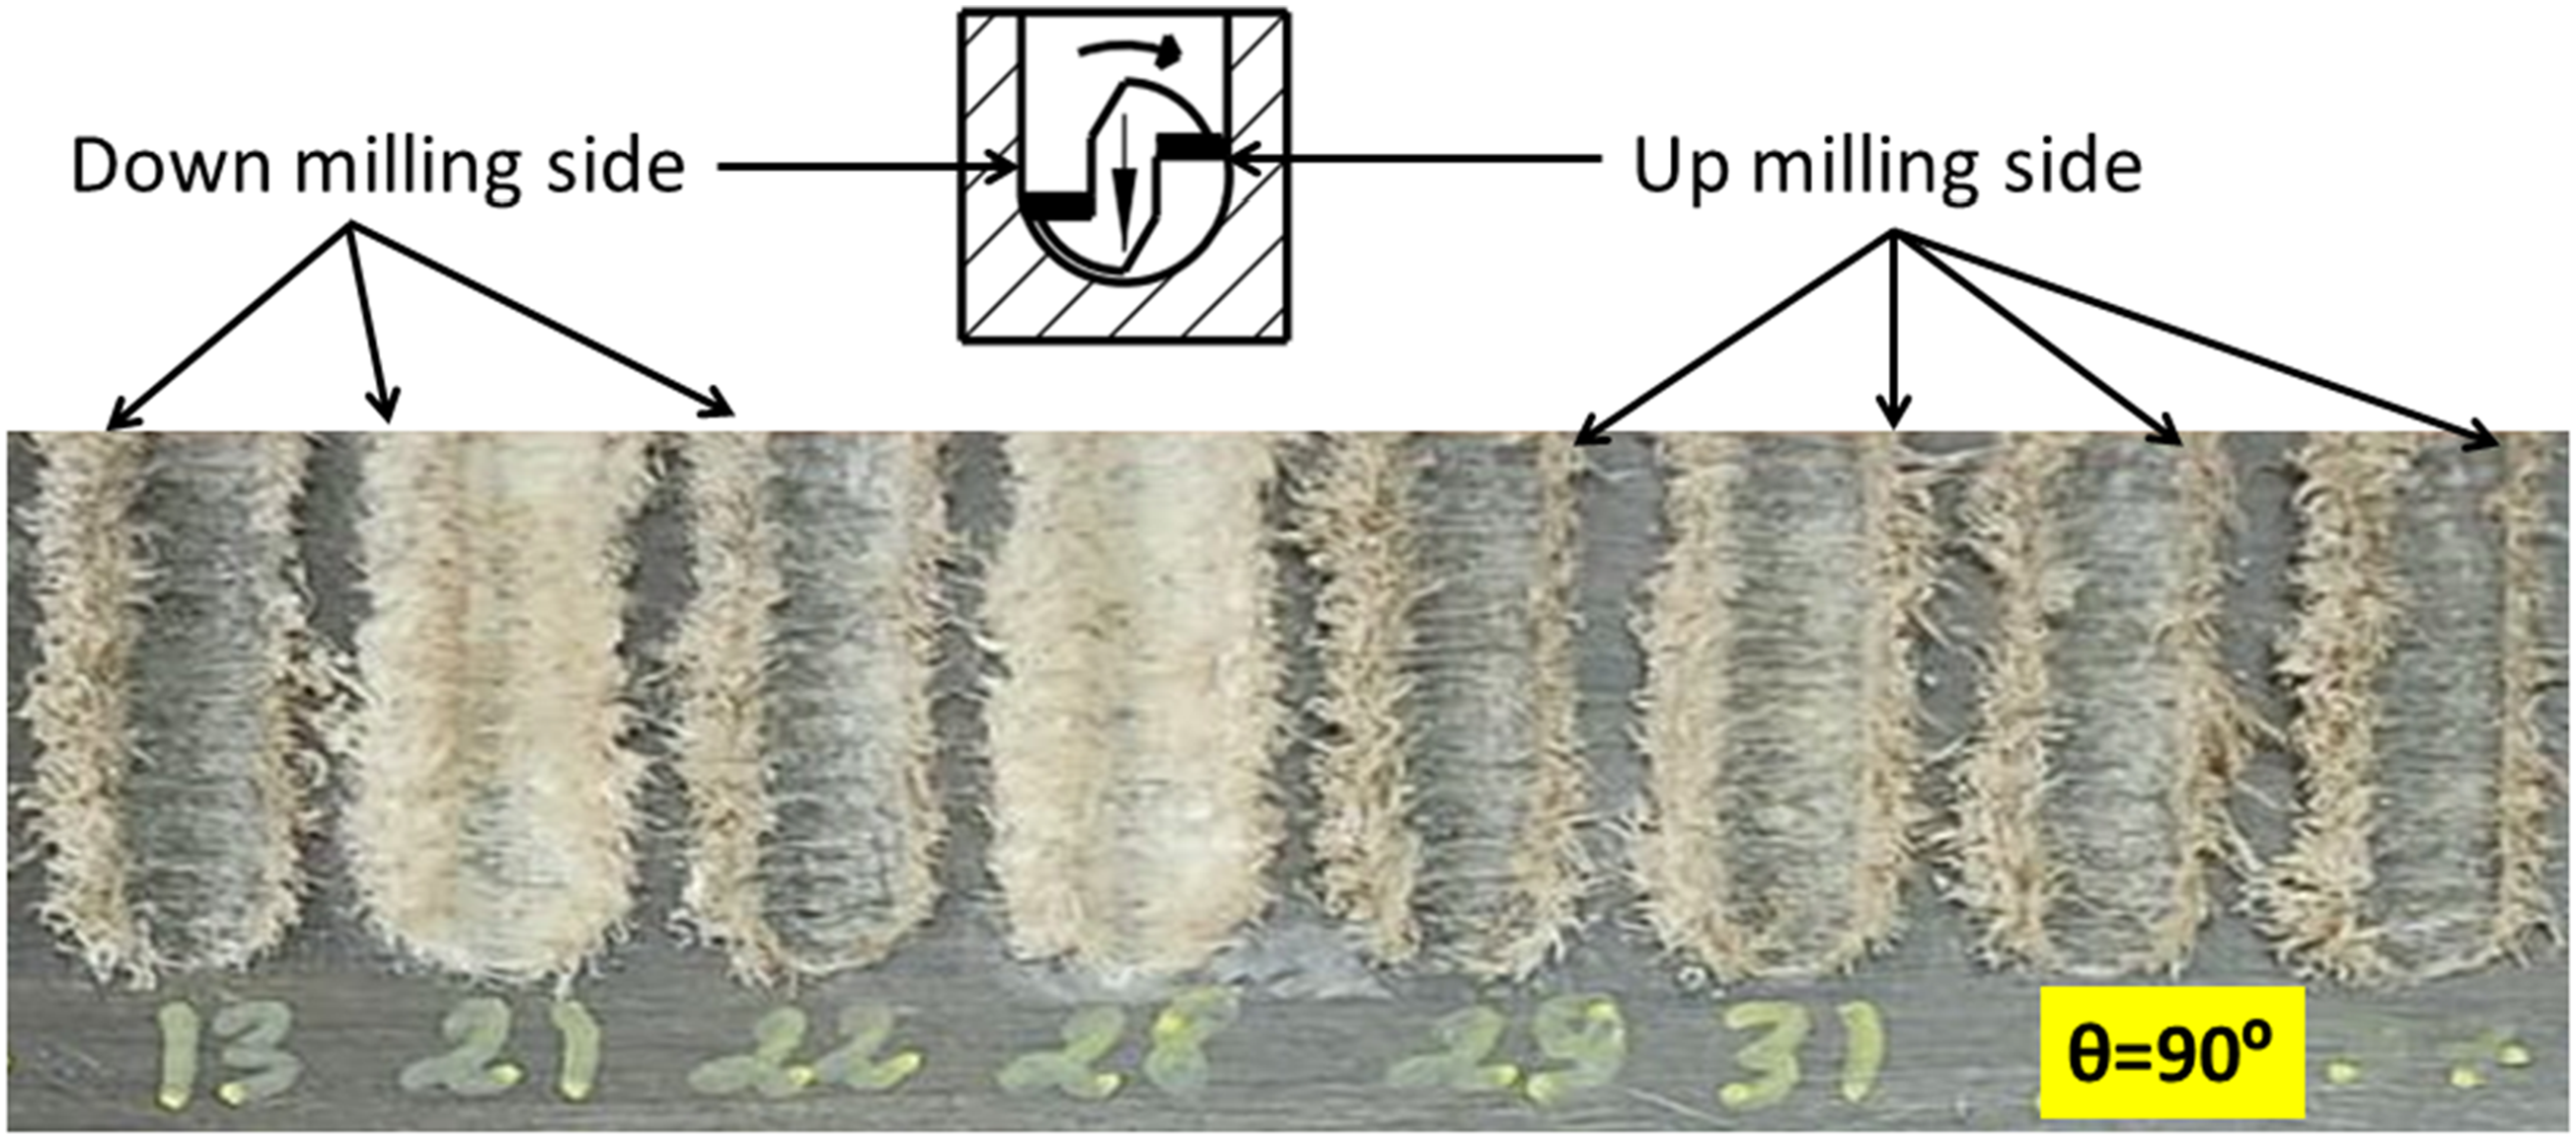
This heightened occurrence of fluffing defects on the down-milling side when fibers are oriented at 90° signifies sensitivity to directional forces. Fibers aligned at 90° may exhibit reduced flexibility or heightened vulnerability to shearing in a specific direction, leading to an amplified occurrence of fluffing defects during downward milling. Additionally, when fibers are positioned at 90°, the samples undergo significant strain due to the extensive transverse deformation of flax fibers. This complicates fiber shearing and substantially elevates the shearing energy required during the cutting process. 23
To sum up, the presence of fluffing defects in FFRP composite slotting is influenced by both fiber orientation and milling direction. A comprehensive understanding of these influences is vital for refining the milling process and attaining the desired surface quality in composite materials. The occurrence of fluffing defects at the groove’s base underscores the significance of meticulous control over milling parameters to mitigate such issues during composite machining. It’s crucial to acknowledge that fluffing defects can arise due to intricate interplays among various factors, including fiber characteristics, cutting tool design, feed rates, and milling directions. To optimize the milling process for FFRP composites, a thoughtful consideration of these elements is imperative to minimize fluffing defects and ensure the production of high-quality surfaces.
Analysis of the surface roughness
Figure 21 presents a detailed analysis of surface roughness, specifically comparing Average Roughness (Ra) with Arithmetic Mean Roughness (Sa) for different fiber orientations (0°, 90°, 45°, and −45°). Additionally, the standard deviation values for both Ra and Sa are included, offering insights into the variability of surface roughness within each orientation. Comparison of average roughness and uncertainty across different fiber orientations in up-milling mode.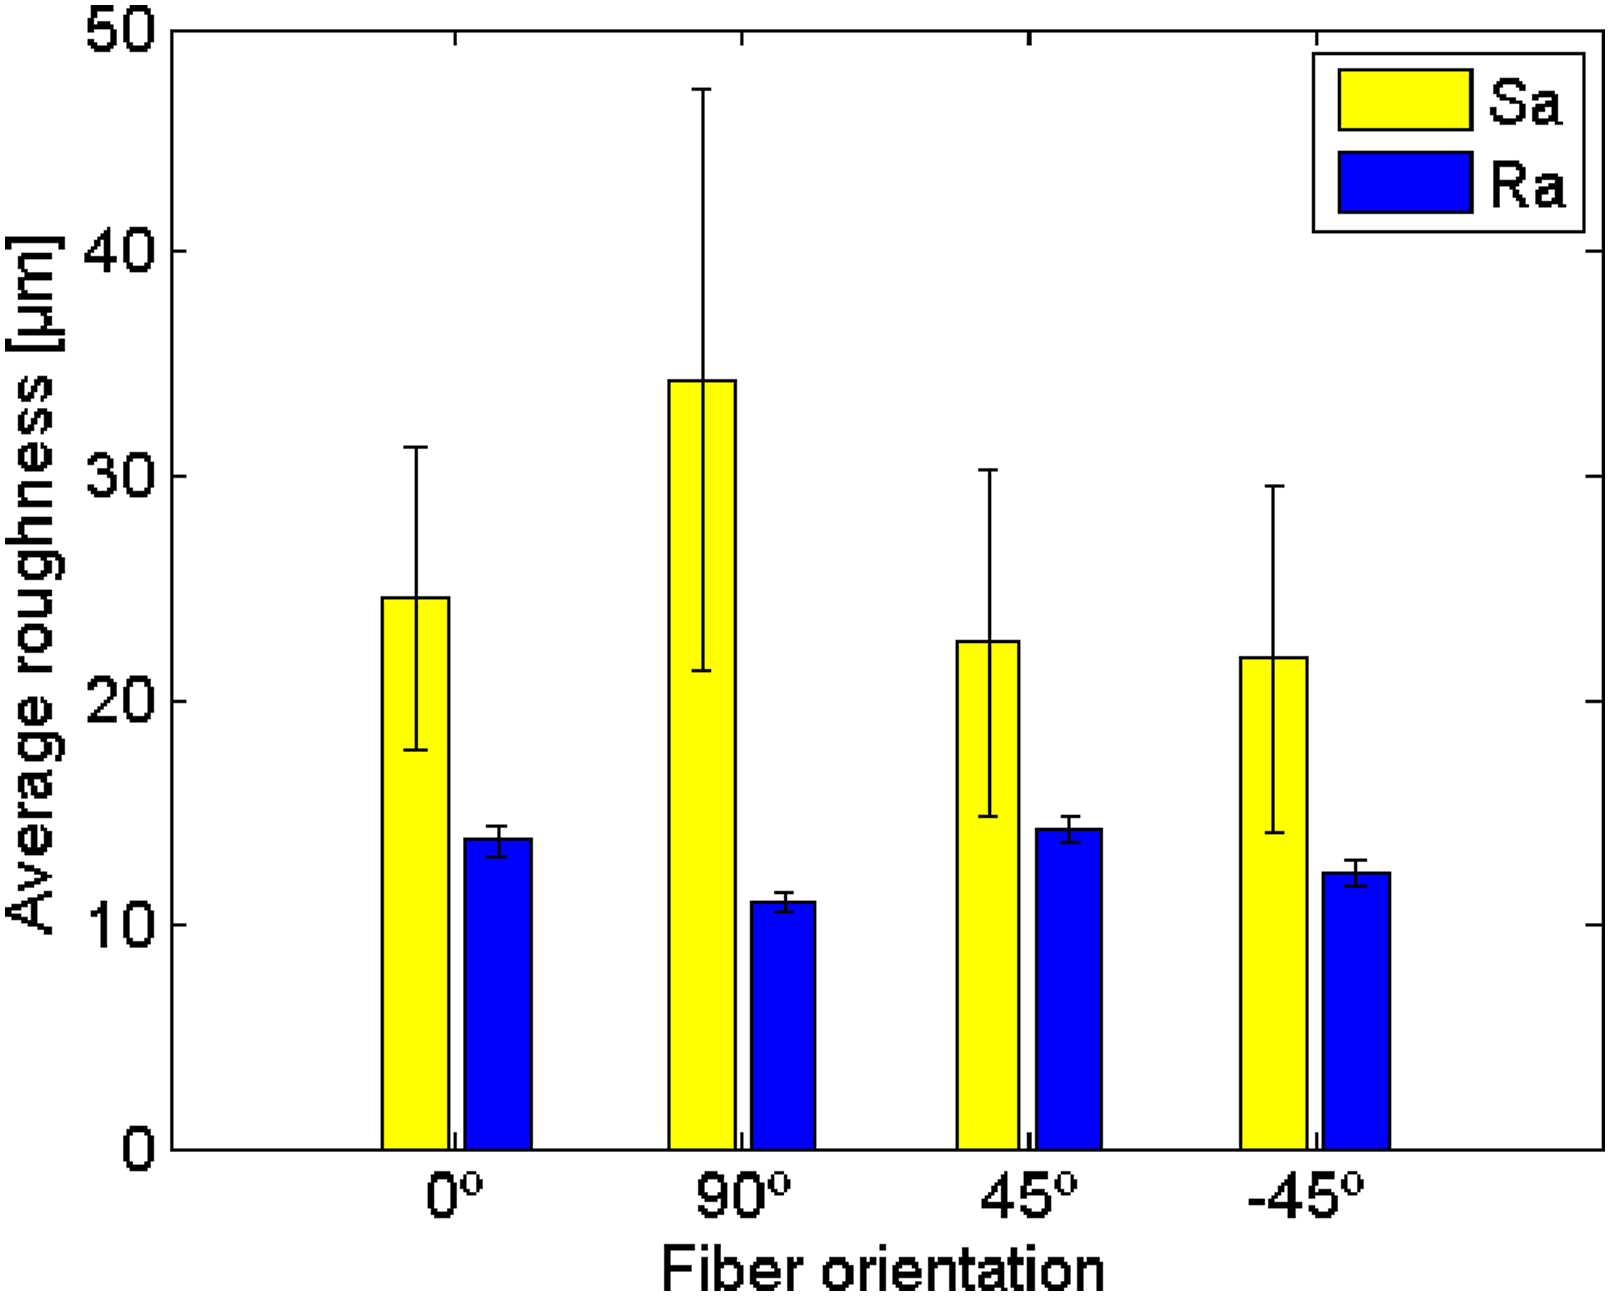
Figure 21 shows that for all fiber orientations, Sa values are consistently higher than their respective Ra values. This indicates that the Sa parameter tends to provide higher values for surface roughness compared to Ra, which is expected, as Sa considers a wider range of surface irregularities. Additionally, within the range of fiber orientations, the 90° orientation exhibits the lowest Ra value, signifying smoother surfaces. However, it concurrently presents the highest Sa value, indicating a broader spectrum of surface variations. This implies that while the average roughness is minimal, there might be more significant peaks and valleys on the surface. Interestingly, this finding contrasts somewhat with the results reported by Chegdani et al., 23 where the θ = 0° orientation was associated with the highest surface roughness.
Conversely, the 45° orientation exhibits the highest Ra, indicating a rougher average surface, but its Sa value is lower than that of 90°, suggesting a more limited range of surface irregularities.
The −45° orientation falls between 0° and 45° orientations in terms of both Ra and Sa, signifying intermediate surface characteristics. It’s noteworthy to mention that, typically, when machining CFRP, the poorest arithmetic surface roughness is often observed at −45° orientations.50–52
The standard deviation values for both Ra and Sa vary across orientations, with 90° orientation having the highest standard deviations. This implies greater variability in surface roughness within the 90° orientation group.
It’s notable that the variance in the measurements of Sa is quite significant, likely attributed to the non-uniformity of the grooved surface due to the presence of fluffing defects. Additionally, it’s essential to recognize that Sa measurements are taken over an area, unlike Ra, which is linear.
Analysis of the cutting force
Figure 22 vividly illustrates how cutting forces are affected by fiber orientation. These forces, encompassing feed force, normal force, and passive force, display substantial fluctuations contingent upon the orientation of fibers within the composite material. Effect of fiber orientation on cutting forces.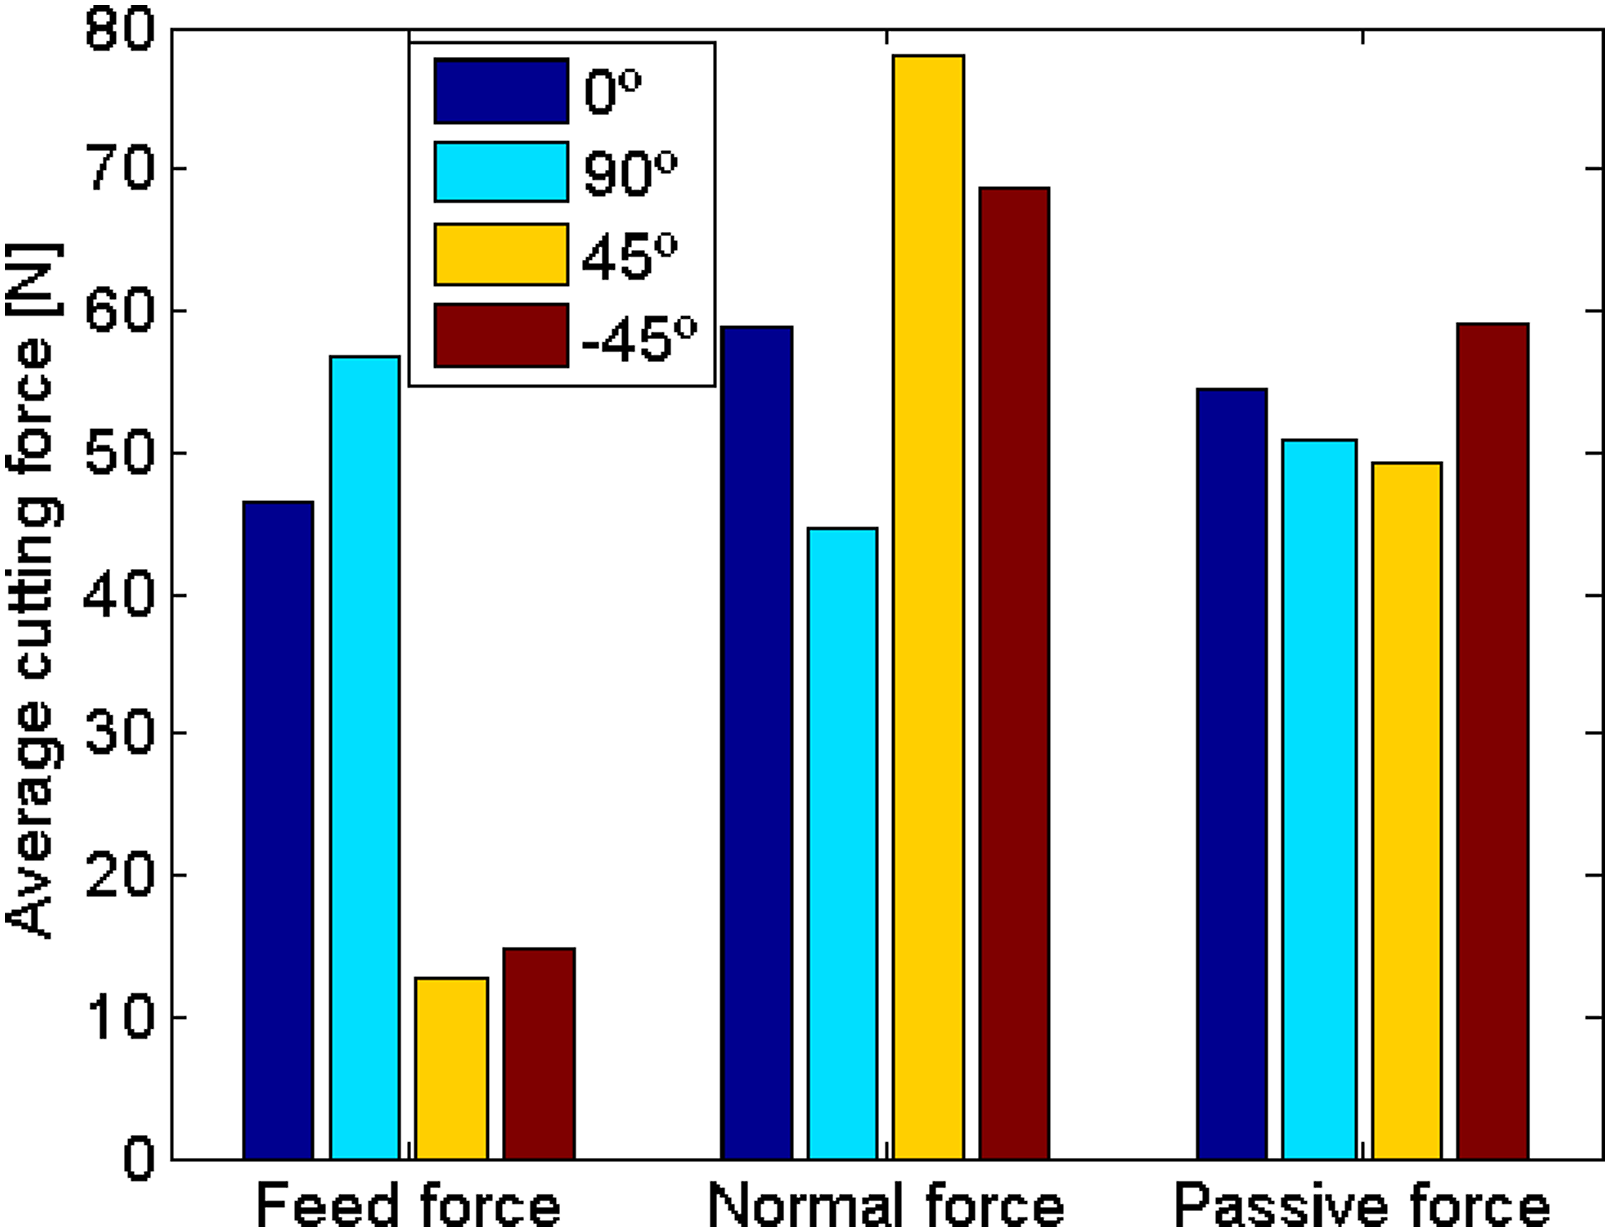
At an orientation of 0°, the feed force registers at 46.47 N, denoting moderate resistance during parallel cutting with the fibers. Conversely, at 90° orientation, the feed force experiences a significant surge, reaching 56.66 N, signifying substantial force prerequisites for perpendicular cutting against the fiber alignment. Notably, a sharp reduction in feed force occurs at 45° orientation, measuring a mere 12.67 N, indicating considerably reduced force demands when cutting at an angle to the fibers. A similar trend is observed at −45° orientation, where the feed force remains low, measuring 14.80 N, aligning with the findings at 45° orientation, signifying decreased force requirements for oblique fiber angles.
On the other hand, cutting at 0° orientation necessitates a high normal force of 58.86 N, spotlighting the significant resistance encountered when cutting perpendicular to the fiber arrangement. Conversely, at 90° orientation, the normal force experiences a substantial drop, registering at 44.68 N, indicating reduced resistance during parallel cutting with the fibers. A notable upswing in normal force is witnessed at 45° orientation, recording 77.95 N, emblematic of significantly heightened resistance when cutting obliquely through the fibers. At −45° orientation, the normal force remains relatively high at 68.77 N persisting resistances even at an oblique angle.
Regarding passive force, an orientation of 0° yields a measurement of 54.44 N, denoting resistance in the direction parallel to the fibers. At 90° orientation, a lower passive force of 50.95 N is documented, indicating reduced resistance when fibers align with the cutting direction. Meanwhile, the passive force at 45° orientation measures 49.35 N, signifying moderate resistance compared to 0° and 90° orientations. At −45° orientation, the passive force registers at 59.11 N, higher than at 0° and 90° orientations but lower than at 45°.
In essence, fiber orientation within the composite material exerts a profound impact on cutting forces. Cutting in parallel with the fibers (0° and 90° orientations) typically demands less force, albeit with a higher normal force requirement at 0° orientation. In contrast, oblique orientations (45° and −45°) mandate substantially higher forces, particularly at 45° orientation, which exhibits the highest normal force. These findings carry immense significance in fine-tuning cutting conditions for composite material machining processes, underscoring how fiber orientation shapes force requirements and, in turn, influences machining efficiency and quality.
Potential for fiber failure based on machining Parameters
In this study, the possibility of fiber failure in flax/epoxy composite materials is examined in relation to several key parameters: cutting forces (feed force, normal force, passive force), fiber orientation, and machining parameters such as feed rate and cutting speed. Understanding the conditions under which fiber failure occurs is crucial for optimizing machining processes and improving the integrity of the final product.
Influence of cutting forces
Cutting forces play a significant role in the potential for fiber failure. High cutting forces, particularly normal forces, can induce stress concentrations at the fiber-matrix interface, leading to fiber pull-out or breakage. Our findings indicate that oblique fiber orientations (45° and −45°) experience higher normal forces compared to parallel orientations (0° and 90°). Specifically, the 45° orientation exhibited the highest normal force, increasing the risk of fiber failure in this configuration.
Impact of fiber orientation
Fiber orientation directly affects the mechanical behavior of the composite during machining. Parallel orientations (0° and 90°) generally require lower cutting forces and result in less fiber damage. However, achieving these orientations consistently in all applications may not be feasible due to design constraints and the inherent complexity of composite layup processes. When fibers are oriented obliquely, the interaction between the cutting tool and fibers becomes more aggressive, elevating the likelihood of fiber failure. This is particularly evident at the 45° orientation, where both the highest cutting forces and the greatest variability in surface roughness (Ra and Sa values) were observed.
Effect of machining parameters
Machining parameters such as feed rate and cutting speed also influence fiber failure. Higher feed rates can lead to smoother surfaces (lower Ra and Sa values) but may also increase the likelihood of fiber breakage if not optimized properly. The balance between achieving a smooth surface and minimizing fiber failure requires careful consideration of these parameters. Lower feed rates and cutting speeds tend to reduce the cutting forces and stress on fibers, thereby mitigating the risk of fiber failure.
Practical implications and recommendations
Given the directional sensitivity of cutting forces and the associated risk of fiber failure, it is recommended that machining processes for flax/epoxy composites be tailored to the specific fiber orientations and application requirements. For applications where parallel fiber orientations are not feasible, it is essential to optimize machining parameters to minimize the risk of fiber failure. This may involve selecting appropriate cutting tools, adjusting feed rates, and employing strategies to control cutting forces.
By addressing these factors, manufacturers can improve the reliability and performance of flax/epoxy composites in various engineering applications, ensuring that the environmental benefits of using these sustainable materials are fully realized.
While the study demonstrates that parallel orientations (0° and 90°) generally result in lower cutting forces and improved surface roughness, it is important to acknowledge that achieving these orientations may not always be feasible for all applications. The alignment of fibers parallel to the machining direction depends on various factors, including design specifications, manufacturing processes, and application requirements. In some cases, specific applications may necessitate oblique or complex fiber orientations to meet structural and functional demands. Therefore, while parallel orientations offer certain machining advantages, the choice of fiber orientation must be tailored to the specific context of each application, balancing machining efficiency with the overall performance and requirements of the composite material. This consideration is essential for providing a comprehensive understanding of the practical implications and limitations associated with fiber orientation in flax/epoxy composites.
Conclusion
The investigation conducted in this study has provided a comprehensive understanding of how fiber orientation affects various aspects of the machining process for flax/epoxy composite materials. The subsequent conclusion encapsulates the key findings and their implications for machining practices in this field. Our investigation has revealed that: • Fiber orientation significantly affects cutting forces, with parallel orientations (0° and 90°) generally requiring less force than oblique orientations (45° and −45°). The 45° orientation imposes the highest normal force, emphasizing the directional sensitivity of cutting forces. • Surface roughness patterns vary across orientations, highlighting the trade-off between average roughness (Ra) and surface amplitude (Sa). • The 0° orientation yields an Ra of 13.72 µm with a standard deviation of 0.66 µm and an Sa of 24.6 µm with a standard deviation of 6.8 µm. • The 90° orientation results in a lower Ra of 10.97 µm with a standard deviation of 0.39 µm but a higher Sa of 34.25 µm with a standard deviation of 12.97 µm. • The 45° orientation displays the highest Ra of 14.2 µm with a standard deviation of 0.76 µm but a lower Sa of 22.6 µm with a standard deviation of 10.95 µm, while the −45° orientation shows an Ra of 12.3 µm with a standard deviation of 0.57 µm and an Sa of 21.8 µm with a standard deviation of 7.77 µm. This indicates a broader range of surface irregularities for 90° orientation and a narrower range for 45° orientation. • These findings hold practical implications for manufacturers and engineers working with eco-friendly fiber-reinforced composites like flax/epoxy. By carefully considering fiber orientation and selecting appropriate machining parameters, it is possible to enhance machining efficiency, reduce resource consumption, and improve the quality of machined components.
In the evolving field of composite materials, future research should investigate different end mill configurations, develop methods to quantify fluffing defects, expand the range of machining parameters, and explore various composite formulations. Addressing the anisotropic nature of flax fibers and ensuring defect-free surface integrity are critical challenges that require further study. Moreover, the impact of moisture in flax fibers on composite quality is an important topic that warrants detailed investigation. These research directions will contribute to the ongoing advancement of composite material machining, promoting sustainability and excellence in manufacturing practices.
Footnotes
Declaration of conflicting interests
The authors declare no competing interests.
Funding
The authors received no financial support for the research, authorship, and/or publication of this article.
Data Availability Statement
The data supporting the findings of this study are available upon request from the corresponding author.