
Abstract
This research investigates the electrical properties of micro silver polyurethane (Ag-PU) composite films with different degrees of agglomeration. Ag-PU composite films were prepared by adding micro silver particles (<3.5 μm) into the thermoplastic PU matrix using a solution mixing method, followed by spin-coating or casting techniques. For some composite preparation, the silver solution was shear-mixed in an ultrasonic bath before being added to the PU solution to obtain higher filler dispersion within the polymer matrix. This method produced several composite films with variable degrees of silver aggregation with concentrations from 0 to 14 vol%. All composites showed only electrical conductivity through thickness when compressed under pressure in a range from 0.5 to 20 kPa. Generally, the percolation threshold and conductivity values of the composite film prepared by spin-coating were lower than those of the casting composite. The maximum conductivity value found in these composites was about 2.45 S/m. All composites’ electrical performance was numerically simulated using the finite element analysis method based on the representative volume element model (FE-RVE) with Digimat software. A correlation was observed between the experiments and those simulations. A semi-analytical model was used to estimate the composite electrical parameters.
Introduction
Today, there is a growing demand for flexible, lightweight and inexpensive conductive materials.1–3 For this reason, over the years many materials have been investigated, such as silicon/gallium-based electronics and indium tin oxide (ITO).4–7 Among them, electrically conductive polymer composites (ECPC) composed of polymer matrices and conductive fillers are a suitable option. 8 Pure polymers have good mechanical properties such as good flexibility and deformation.9,10 However, the electrical conductivity of pure polymers is typically low, between 10−14 and 10−18 S/m. Therefore, a conductive filler is generally added into polymers to improve their electrical performance.8,11,12 The ECPCs have been used in many fields, such as in advanced displays, high-frequency antennas, fuel cell bipolar plates, flexible energy storage devices, medical devices, and modern wearable sensors or smart fabrics.13–17
The conductivity of ECPCs is governed by many factors, including the nature of the matrix, shape, size, distribution, orientation, and concentration of filler within the matrix.9,16,18 The electrical conductivity typically increases as the conductive filler content increases. The percolation theory can describe this phenomenon. When a minimum concentration of conductive filler in the polymer is achieved, referred to as the conductive percolation concentration, a conductive network can be created throughout the polymer matrix, and the polymer composite becomes conductive. Below the percolation threshold, the electrical conductivity is comparable to the conductivity of the polymer matrix because the filler particles are widely spread, so a conductive network is not formed. Beyond the percolation threshold, the conductivity increases as the filler concentration increases until it reaches a plateau. The degree of filler dispersion in the matrix also affects the electrical performance of the ECPC. 19 For instance, conductive networks might be created at lower percolation concentrations due to the formation of the filler aggregation in the polymer phase. 20 In addition, the chance of filler aggregation increases with decreasing filler particle size due to intermolecular van der Waals forces. However, the presence of filler aggregations could negatively affect the polymer’s elastic properties. 21 The challenge is finding the smallest filler concentration to achieve excellent electrical properties without deteriorating the mechanical properties.5,22
The dispersion of the nanomaterial and the creation of conductive pathways in the polymer matrix greatly depends on the ECPC preparation procedure. 17 Currently, three main methods of ECPC preparation have been developed: melt compounding, 23 in situ polymerization, 24 and solution mixing. 25 Each method has its advantages and disadvantages. The solution mixing method involves dissolving the polymer and metal filler into a solvent, thus resulting in a composite with good filler dispersion into the polymer. Once the polymer and the filler are dissolved, numerous 2D and 3D structures can be fabricated depending on the application of the electrical device. Films are one of the structures which can be produced with high uniformity and thickness. The simplest method is casting the solution onto a flat substrate and then leaving it dry to remove the solvent. Spin coating is another method that can be used to produce highly uniform films. 26 A polymer-filler solution is poured onto a revolving substrate using a spin coater, which causes the solvent to be expelled due to the angular momentum and therefore it accelerates the evaporation rate. In general, the spin-coating process has the characteristic of producing membranes with a thinner thickness than that of cast samples. Although the solution mixing method is a good technique for obtaining a good filler dispersion, agglomeration is often unavoidable with a high concentration of nanoparticles. Particularly, nanoparticles prefer to aggregate or form clusters due to their high intermolecular van der Waals interactions. Additional methods are used to enhance the dispersion of the particles inside the polymer, including sonication and high mixing shear. 19
Several numerical and theoretical models have been conducted to understand better the electrical behaviour of the ECPC.11,27 The effect of shape, size, orientation, aspect ratio and distribution of filler in composites have been introduced in these models. 28 These methods have been employed in three different scales, including molecular scale using Molecular Dynamics 29 and Monte Carlo, 30 then microscale utilizing Brownian Dynamics 31 and Dissipative Particle Dynamics, 32 and the largest scale or macroscale using Micromechanics 33 and Finite Element (FE) 11 methods. Furthermore, density functional theory (DFT) calculation has been used at the atomic scale to predict different properties of polymer composites, such as optical, electronic, and catalytic.34,35 One of the models that can estimate effective electrical conductivity of materials is the representative volume element (RVE) model. RVE has been defined as the smallest composite volume that contains the sample’s overall properties. 36 Tamayo-Vegas et al. 11 found a good correlation between experimental and simulation results with RVE-FE analysis for an epoxy-based composite loaded with multi-walled carbon nanotubes. The simulation technique showed a percolation threshold of 2 wt%, similar to the results from experiments. Khammassi et al. 27 conducted a simulation study to find the effect of exfoliated graphite sizes on the electrical, mechanical and thermal properties of an epoxy matrix. These works validated the experimental results of Debelak and Lafdi 37 and successfully proved the practicality of RVE-FE analysis to predict polymer composite properties. In our previous study, the effect of pressure and filler concentration on the electrical performance of the micro-copper-polyurethane composites was studied for the first time by RVE-FE analysis. 38 Nonetheless, the RVE-FE analysis technique can be used to evaluate several significant factors influencing the electrical properties of composites, such as filler aggregation.
Various substances have been used over the years as fillers to induce electrical properties, including carbonaceous materials, micro/nano metal particles, metal nanowires and mixtures of those.10,16,17 One of the most used metals is silver in various shapes and sizes, mainly silver nanowires (AgNW) and silver nanoparticles (AgNP), due to their properties, including chemical stability, abundance, and high conductivity.7,15,22,39 Nanosilver composites exhibit good electrical properties. However, the synthesis of nanosilver nanomaterial is expensive 40 and could prove to be a health hazard. 7 Therefore, replacing nano with micro silver could be an attractive option to improve the electrical properties of polymers. Few studies have dealt with the fabrication of micro-silver polymer composites. Yang et al. 18 incorporated a micro 3D dendritic silver filler into a polyester-based resin and achieved a low percolation concentration of around 0.97 vol% (8 wt%) due to the unique nano-sized rims of the metallic dendrites, which fuse together through a simple sintering process at low temperature. However, in general, controlling the dendritic fillers' hierarchical structure remains challenging.18,41 Tang et al. 3 investigated the effect of different shapes of silver (spherical, flake and dendrites) particles concentration in polydimethylsiloxane (PDMS) matrix. They found that the percolation threshold of spherical, flake and dendrites composites were 28, 23 and 13 vol% of filler, respectively. The lower percolation threshold for the silver dendrites composite was due to their high aspect ratio, hierarchical structure, and multiple contact points. Joseph et al. 42 investigated the effect of the micro silver particle (2–3.5 μm) on the composites of polyvinylidene fluoride loaded with micron and nano-sized BaTiO3 powders for electromagnetic interference (EMI) shielding applications. They found a percolation concentration of around 10 vol% of silver at a frequency of 1 MHz. Since conductivity increases with frequency, they concluded that a lower Ag concentration of 10 vol% was adequate to provide the necessary conductivity for efficient shielding. However, the incorporation of micro silver particles into the polymer matrices has been mostly limited to the preparation of electrically conductive adhesives to provide necessary conductive paths in the electronic devices. 43 Suriati et al. 22 studied the electrical conductivity, among other properties, for epoxy composites filled with nano and micro-silver particles, and they found percolation concentration for both systems of about 6 vol %. None of the cited studies have investigated the effect of the preparation method on the dispersion of micro silver into the polymer matrix that could affect the electrical conductivity performance of the composite. Neither the electrical behaviour of the composite materials has been previously modelled. Only Yang et al. have used Monte Carlo simulations to predict the percolation threshold [16]. In fact, computational simulations for studying the electrical properties of polymer micro-composite are incredibly scarce. 38
In this context, silver-polyurethane composites with different concentrations of silver microparticles were prepared using the solution mixing method with and without sonication. Subsequently, the solution was casted, or spin-coated to fabricate the films. Polyurethane was selected as the matrix because of its inherent biocompatibility, biostability, processability, and mechanical properties, which make it suitable for medical devices. 44 This work aims to determine the influence of the percentage and aggregation of silver particles on the electrical conductivity under pressure for silver-polyurethane composite films using experimental and numerical methods. The degree of agglomeration was characterized using an optical microscope. A developed set-up with a digital multimeter was used to measure the electrical conductivity of the composites. Numerical simulations were conducted using FE-RVE method using DIGIMAT software.
Materials and methods
Materials
Thermoplastic polyurethane (PU) pellets were supplied by BASF plc, UK, under trademark Elastollan® 1180 A 10 000. Silver microparticle (2–3.5 μm, ≥ 99.9% trace metals basis) was purchased from Sigma-Aldrich, UK. Merck Company, UK supplied N,N-dimethylformamide (DMF, anhydrous,> 99.8%). It should be noted that all chemicals were used as received.
Composite preparation
To prepare a film of micro-silver polyurethane (Ag-PU), a solution mixing procedure without or with sonication was used, followed by a casting or spin-coating techniques. The concentrations of silver in PU were 0.1, 0.55, 1.2, 2.6, 4.3, 6.6, 9.6, 13.7 vol%. In the supplementary information, Table S1 shows the percent in mass.
In a typical experiment with the sonication step, a certain amount of PU was dissolved in the DMF using a heating magnetic stirrer at 60°C and 300 rpm/min for 4 h. The concentration of the PU in the DMF was about 17 wt%. Then, a certain amount of Ag particles was weighted out based on the target concentration on the composite and added to the DMF. The Ag/DMF solution was sonicated for 2 min at room temperature with an ultrasonic bath. Then, Ag/DMF mixture was added to PU-DMF solution, so the PU/DMF final concentration was 11 wt%. Then, the mixture was stirred at 300 rpm/min and 60°C for 15 min. The sonication step was introduced to reduce the agglomeration of silver particles in the polymer. The dissolution procedure without the sonication step was carried out similarly. The main difference was that Ag was not mixed with the DMF; instead, it was added directly to a PU/DMF solution containing 11 wt% PU. A concentration of 11 wt% provided an optimal viscosity that is neither too high for the dispersion of the microparticles onto the polymer nor too low for the microparticles to precipitate and not become embedded on the polymer. The Ag/PU/DMF solution was immediately used for the casting or spin-coating technique for both processes. In the casting method, the solution was poured into a petri dish and kept under the fume hood at ambient conditions for 48 h to fully evaporate the DMF. Regarding the spin-coating method, about 0.3 mL of the solution was pipetted into a Teflon substrate (2.5 cm × 2.5 cm) and placed onto the spin-coater from Ossila. The selected speed was 1000 rpm/min, and the spinning time was 15 s. Once the spin coater stopped, the coated substrate was dried in a fume hood for 24 h at room temperature. Both composite films were then peeled from the Teflon substrate or petri dish for further characterization. A schematic of the processing is shown in Figure 1. Schematic diagram of composite fabrication.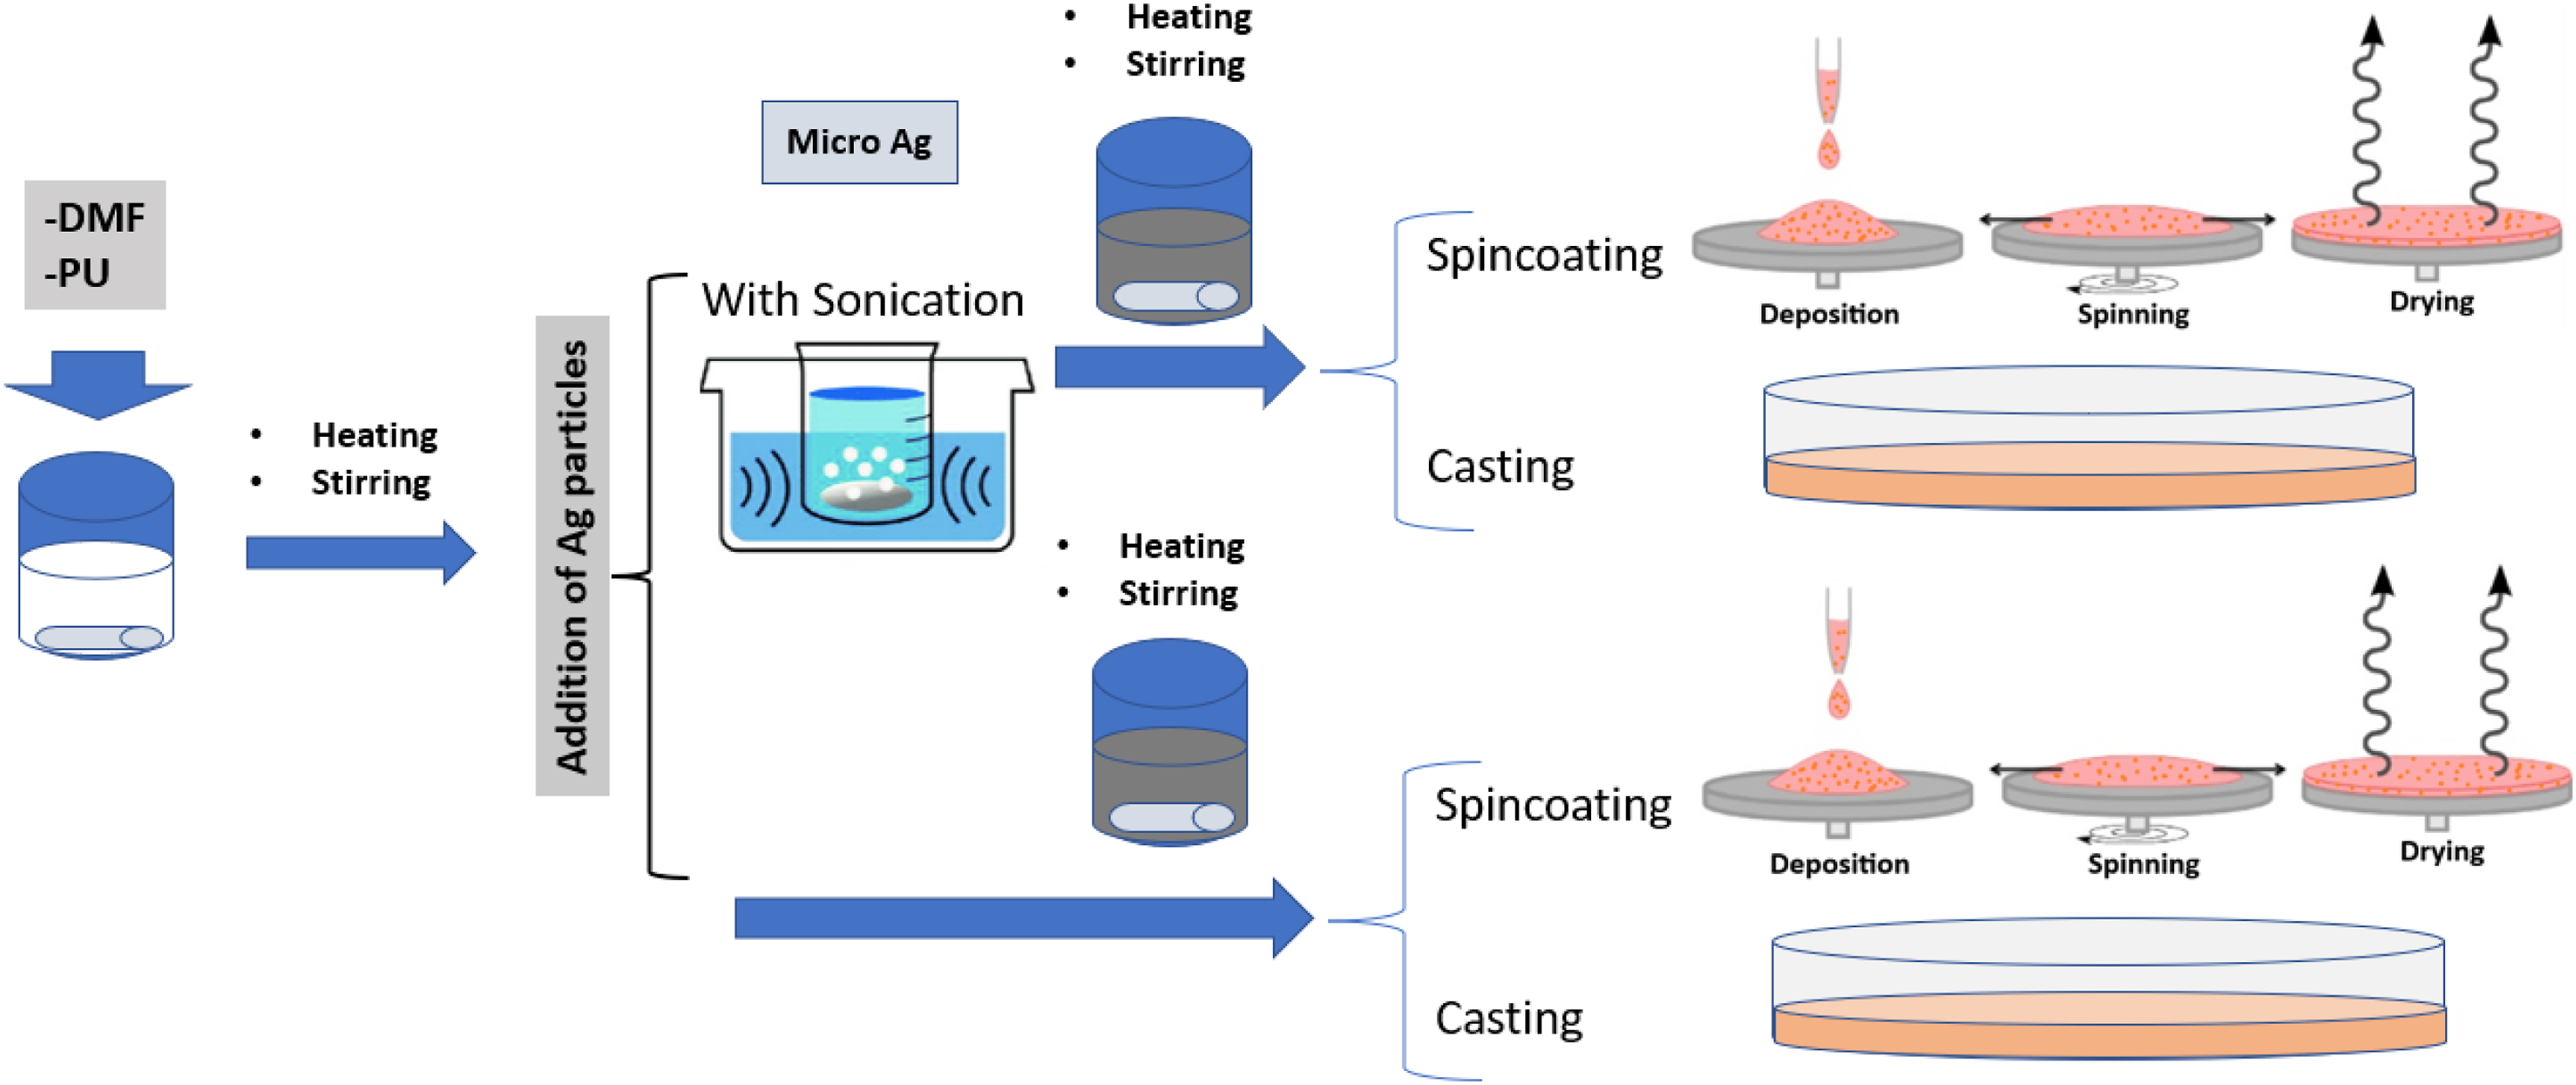
Materials characterization
The size and distribution of silver particles were analysed using a scanning electron microscope (SEM, MIRA 3). Initially, silver particles were fitted onto the specimen stage and coated with a 5 nm platinum layer to keep sample conductivity throughout the stage. The particle distribution of silver was evaluated using optical microscopy (Alicona® InfiniteFocus Optical Microscope) through-plane and through-thickness. A cold mounting technique was used to hold the composite films upright, so that images through the thickness could be taken with optical microscopy. Also, these images enable to measure accurately the thickness of the thin films obtained by the spin-coating and casting methods. The cold mounting process consisted of placing the film in the upright position on the centre of a moulding cup and then adding the mixture of resin (1. bisphenol-A-(epichlorhydrin) Epoxy resin and oxirane, mono [(C12-14-alkyloxy)methyl]) and hardener (Triethylenetetramine). Previously, the film was pasted with sellotape to keep it upright on the moulding cup. Then, the mixture was allowed to harden at room temperature for 24 h. The sample was sawed into two parts and washed with distilled water, then ground and polished so it was ready to place on the microscope.
The electrical conductivity of the composites under different pressures in z-direction (through-thickness) was measured using a developed multimeter set-up, previously reported. 38 Here a brief description of the procedure is given. The top and bottom sides of Ag-PU film were pasted with copper foils 1 x 1 cm2. Then, a cube of insulator material (1 × 1 × 1 cm3) was placed on top of the copper foils. Different calibrated weights, corresponding to 0.5, 1, 2, 5, 10, 15 and 20 kPa pressure, were put on top of the system to compress the composite film. Finally, the electrical resistance of the compressed composite film was measured in the plane and through the thickness of the composite using a digital multimeter (UNI-T, UT58A). Each measurement was repeated three times, and average numbers and standard deviations were reported. It should be noted that the conductivity of the Ag-PU composite films was tested in-plane by placing two probes of the multimeter 1 cm apart in the plane (x and y direction). However, the resistance values exceeded the multimeter range, indicating that the Ag-PU composites were non-conductive in the plane direction.
The measured electrical resistances through the thickness were used to calculate electrical conductivity based on the equation (1):18,22
To determine the thickness under pressure, the polyurethane’s stress-strain behaviour was measured using Dynamic Mechanical Analyzer (DMA) (PerkinElmer DMA8000, USA) worked at compression mode, 28°C and 1 Hz frequency. A neat PU with dimensions of 10 mm (length) × 8.6 mm (width) × 2.47 mm (thickness) was exposed to stress–strain curve with a controlled force method. The stress/strain curve was obtained and presented in Figure (S1) in Supplementary Information. The Young's modulus was obtained from the slope of the curve and it was E = 66,707 Pa. The reduction in thickness (δ) under pressure was calculated using equation (2). In the Equations 2, E is Young’s modulus, P, is pressure, A is cross-sectional area of applied pressure, d is thickness, and δ is a change or reduction of the thickness (m). The values are A = 86 mm2, and d = 2.47 m. Table S2 shows the reduced thicknesses under pressure. Therefore, the thickness of the composite under pressure can be estimated by subtracting the thickness reduction from the initial thickness determined using the optical microscope.
Numerical model
The electrical performance of the fabricated composite films was simulated using the commercial MSC Software Digimat-FE (e-Xstream engineering, 2021.3 version, Belgium). In this software, the finite element analysis (FE) was implemented based on the representative volume element (RVE) model. Generally, the software deploys the constituent Ohm's law to calculate the electrical conductivity of Ag-PU films. The software can create RVEs based on the input data and assumptions. For this research, the assumptions taken are the following: (a) Silver particles were assumed to be spherical with a size distribution of 1–3.5 μm based on the SEM results; (b) The initial thickness of spin-coated and casting samples were considered 10 μm and 20 μm, respectively, since RVE must comprehensively capture the key properties of genuine composites. This selection was based on the optical microscopy results; (c) Particles were randomly spatially distributed within the matrix; (d) To introduce the effect of agglomeration on the composite using the different process methods, it was assumed that only 40% of fillers agglomerated for composites when the sample was prepared using the sonication step, while 70% of fillers was considered agglomerated or formed random clusters when there was no sonication; This assumption was based on the optical microscopy images; (e) The distance between particles was set to be minimum. For this reason, the particles can be in contact from one to another; (f) The size of RVEs was set to be constant, 1000 and 8000 μm3 for spin-coated and cast composites, respectively; (g) The diminution of the thickness of the composite film under pressure was based on the DMA results; (h) The mesh was 512,000 number of elements based on our convergence studies. Figure 2 shows an example of the generated meshes. In this research, the effects of four different factors on the electrical conductivity of micro Ag-PU composites were simultaneously simulated, including the concentration of filler, pressure, agglomeration and size of fabricated film. A meshed 3D RVE of simulated PU-Ag composite with 9.6 vol% of Ag under 20 kPa for the sample obtained by casting technique with sonication step.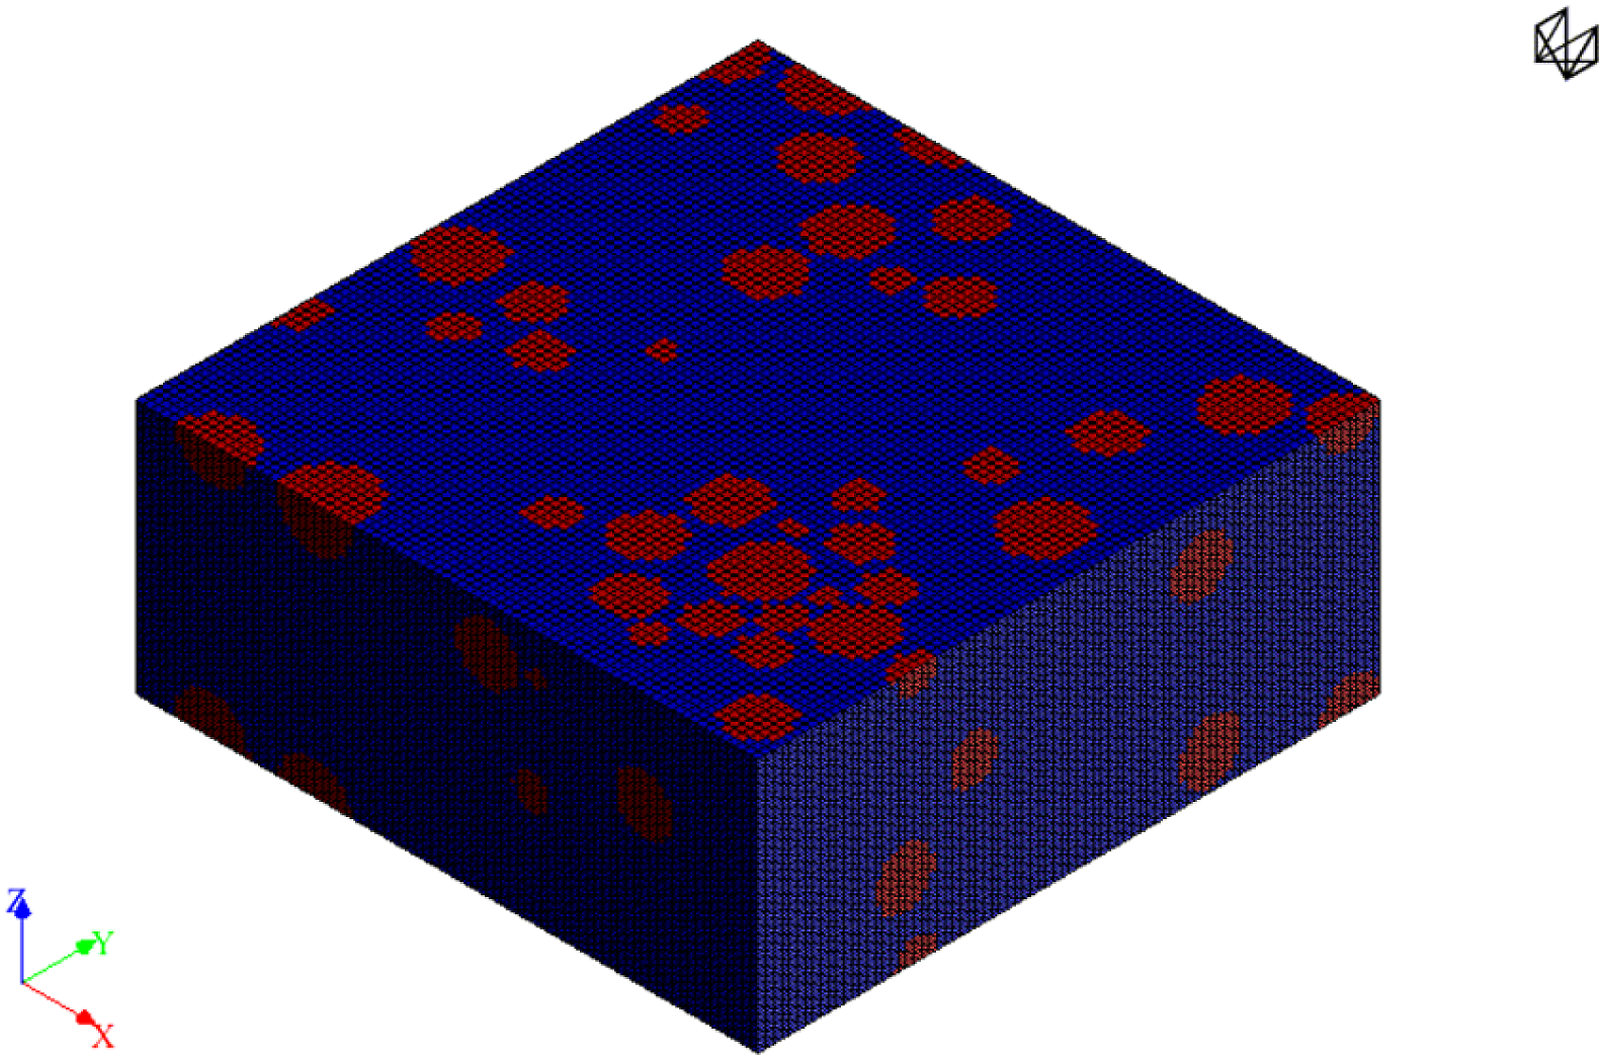
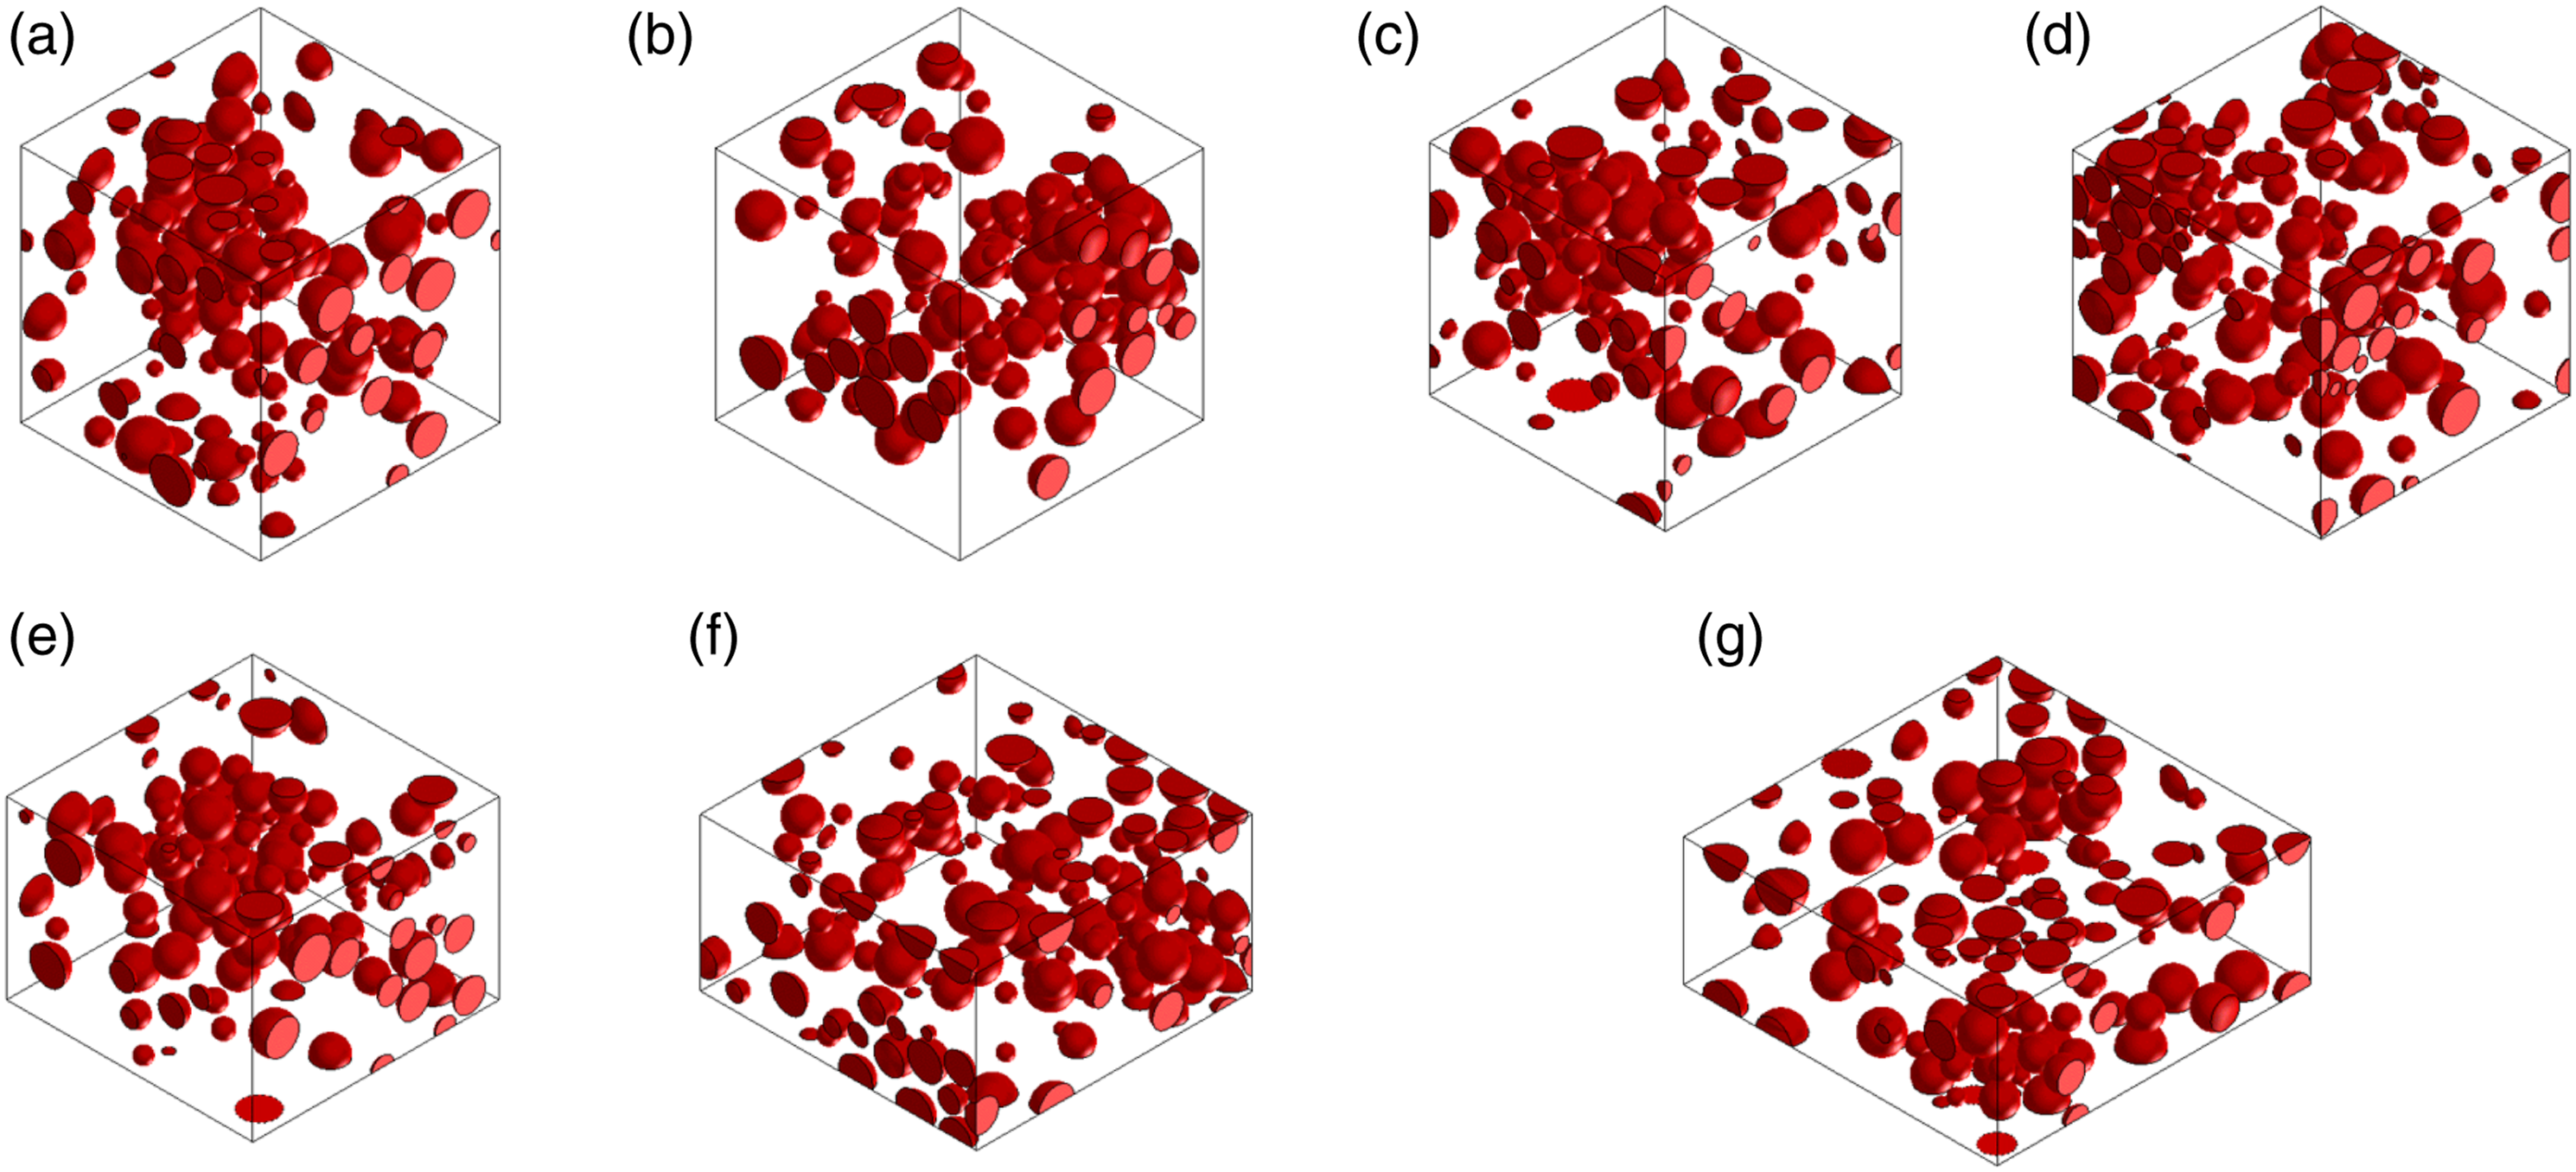
Figure 3 shows the effect of filler concentration on the geometry for a series of simulated cast composites without sonication. Figure 4 demonstrates the effect of pressures on the geometry of the simulated casting composite with sonication. In all simulations, the electrical conductivity was calculated in the z-direction (through-thickness- G33). The physical properties of the Ag-PU constituents are shown in Table S3, Supplementary Information. The 3D RVEs simulated geometries represent the composite film obtained by casting without sonication for different Ag concentrations in the PU: (a) 0.55 vol%, (b) 1.2 vol%, (c) 2.6 vol%, (d) 4.3 vol%, (e) 6.6 vol%, (f) 9.6 vol%, (g) 14 vol% and (h) 20 vol% under a pressure of 1 kPa. The 3D RVEs simulated geometries represent the composite film with 9.6 vol % obtained by casting with sonication under different pressures: (a) 0.5 kPa, (b) 1 kPa (c) 2 kPa, (d) 5 kPa, (e) 10 kPa, (f) 15 kPa, and (g) 20 kPa.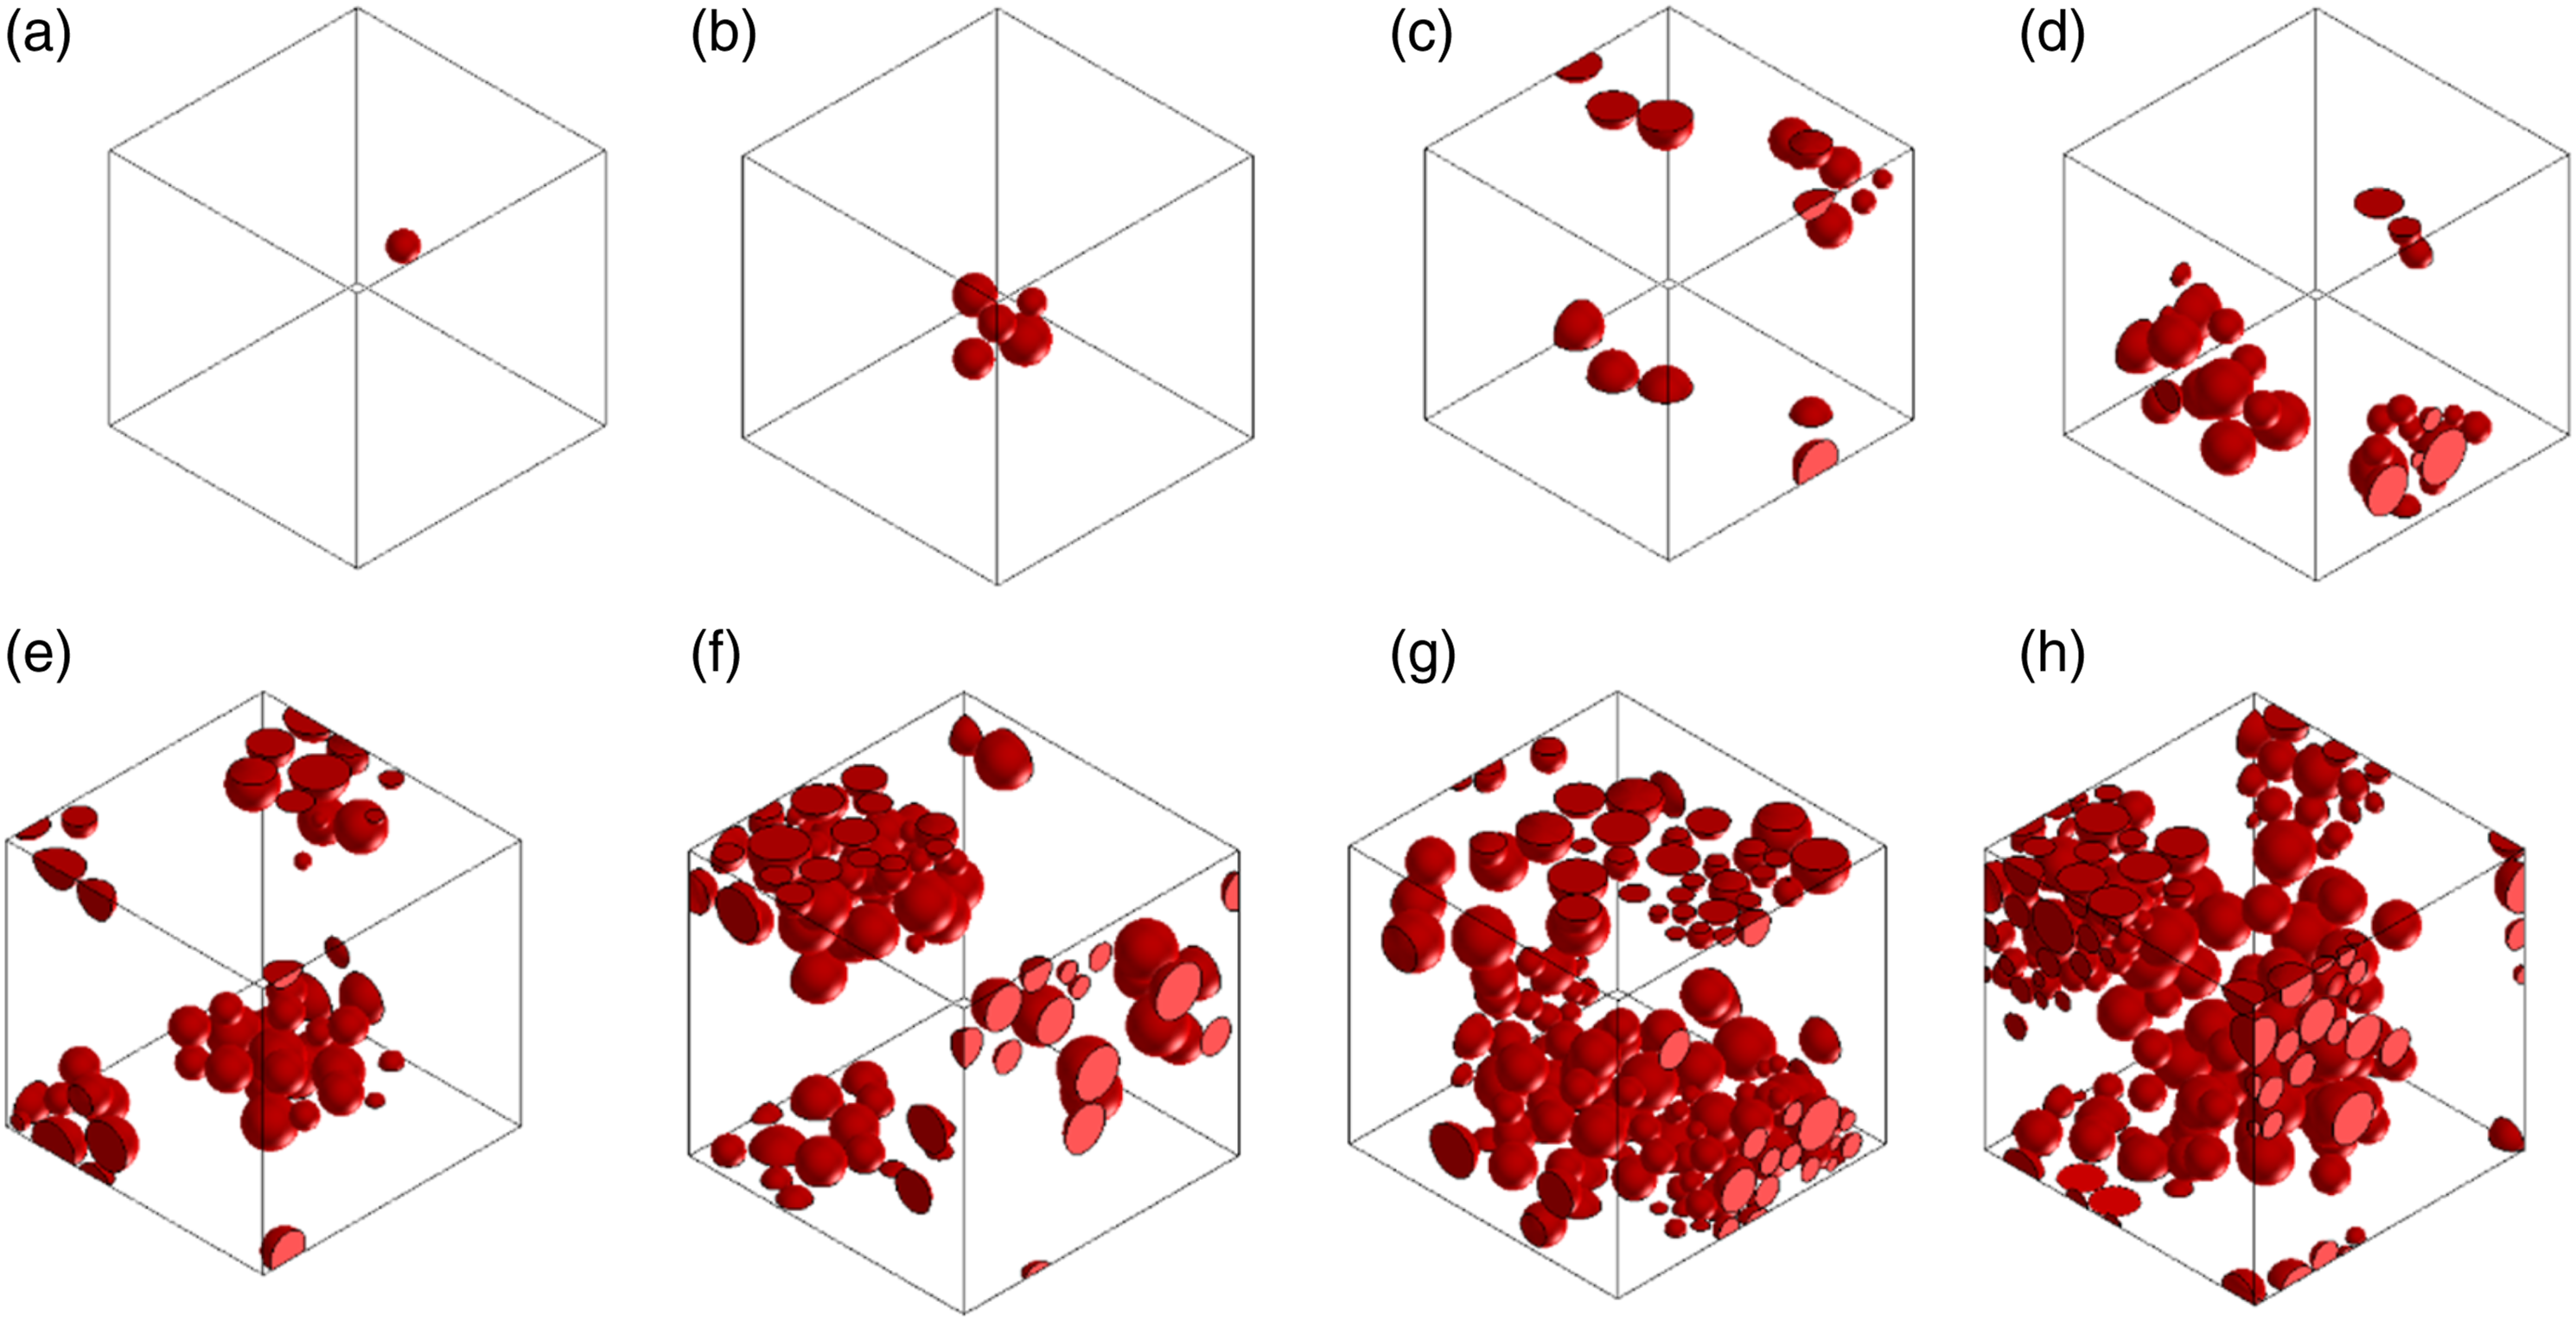
Results and discussion
Figure 5 shows SEM images of the silver particles as received and after sonication for 15 min. As shown in Figure 5, silver particles were agglomerated, which caused relatively low dispersion in the final composites. In contrast, after the sonication, particles were separated, and clusters were broken up into single particles, so the dispersion of silver in the composite was improved. The size distribution of Ag obtained by SEM ranges from 1 to 3.5 μm. SEM images of the silver particle as received (a) and after sonication condition (b).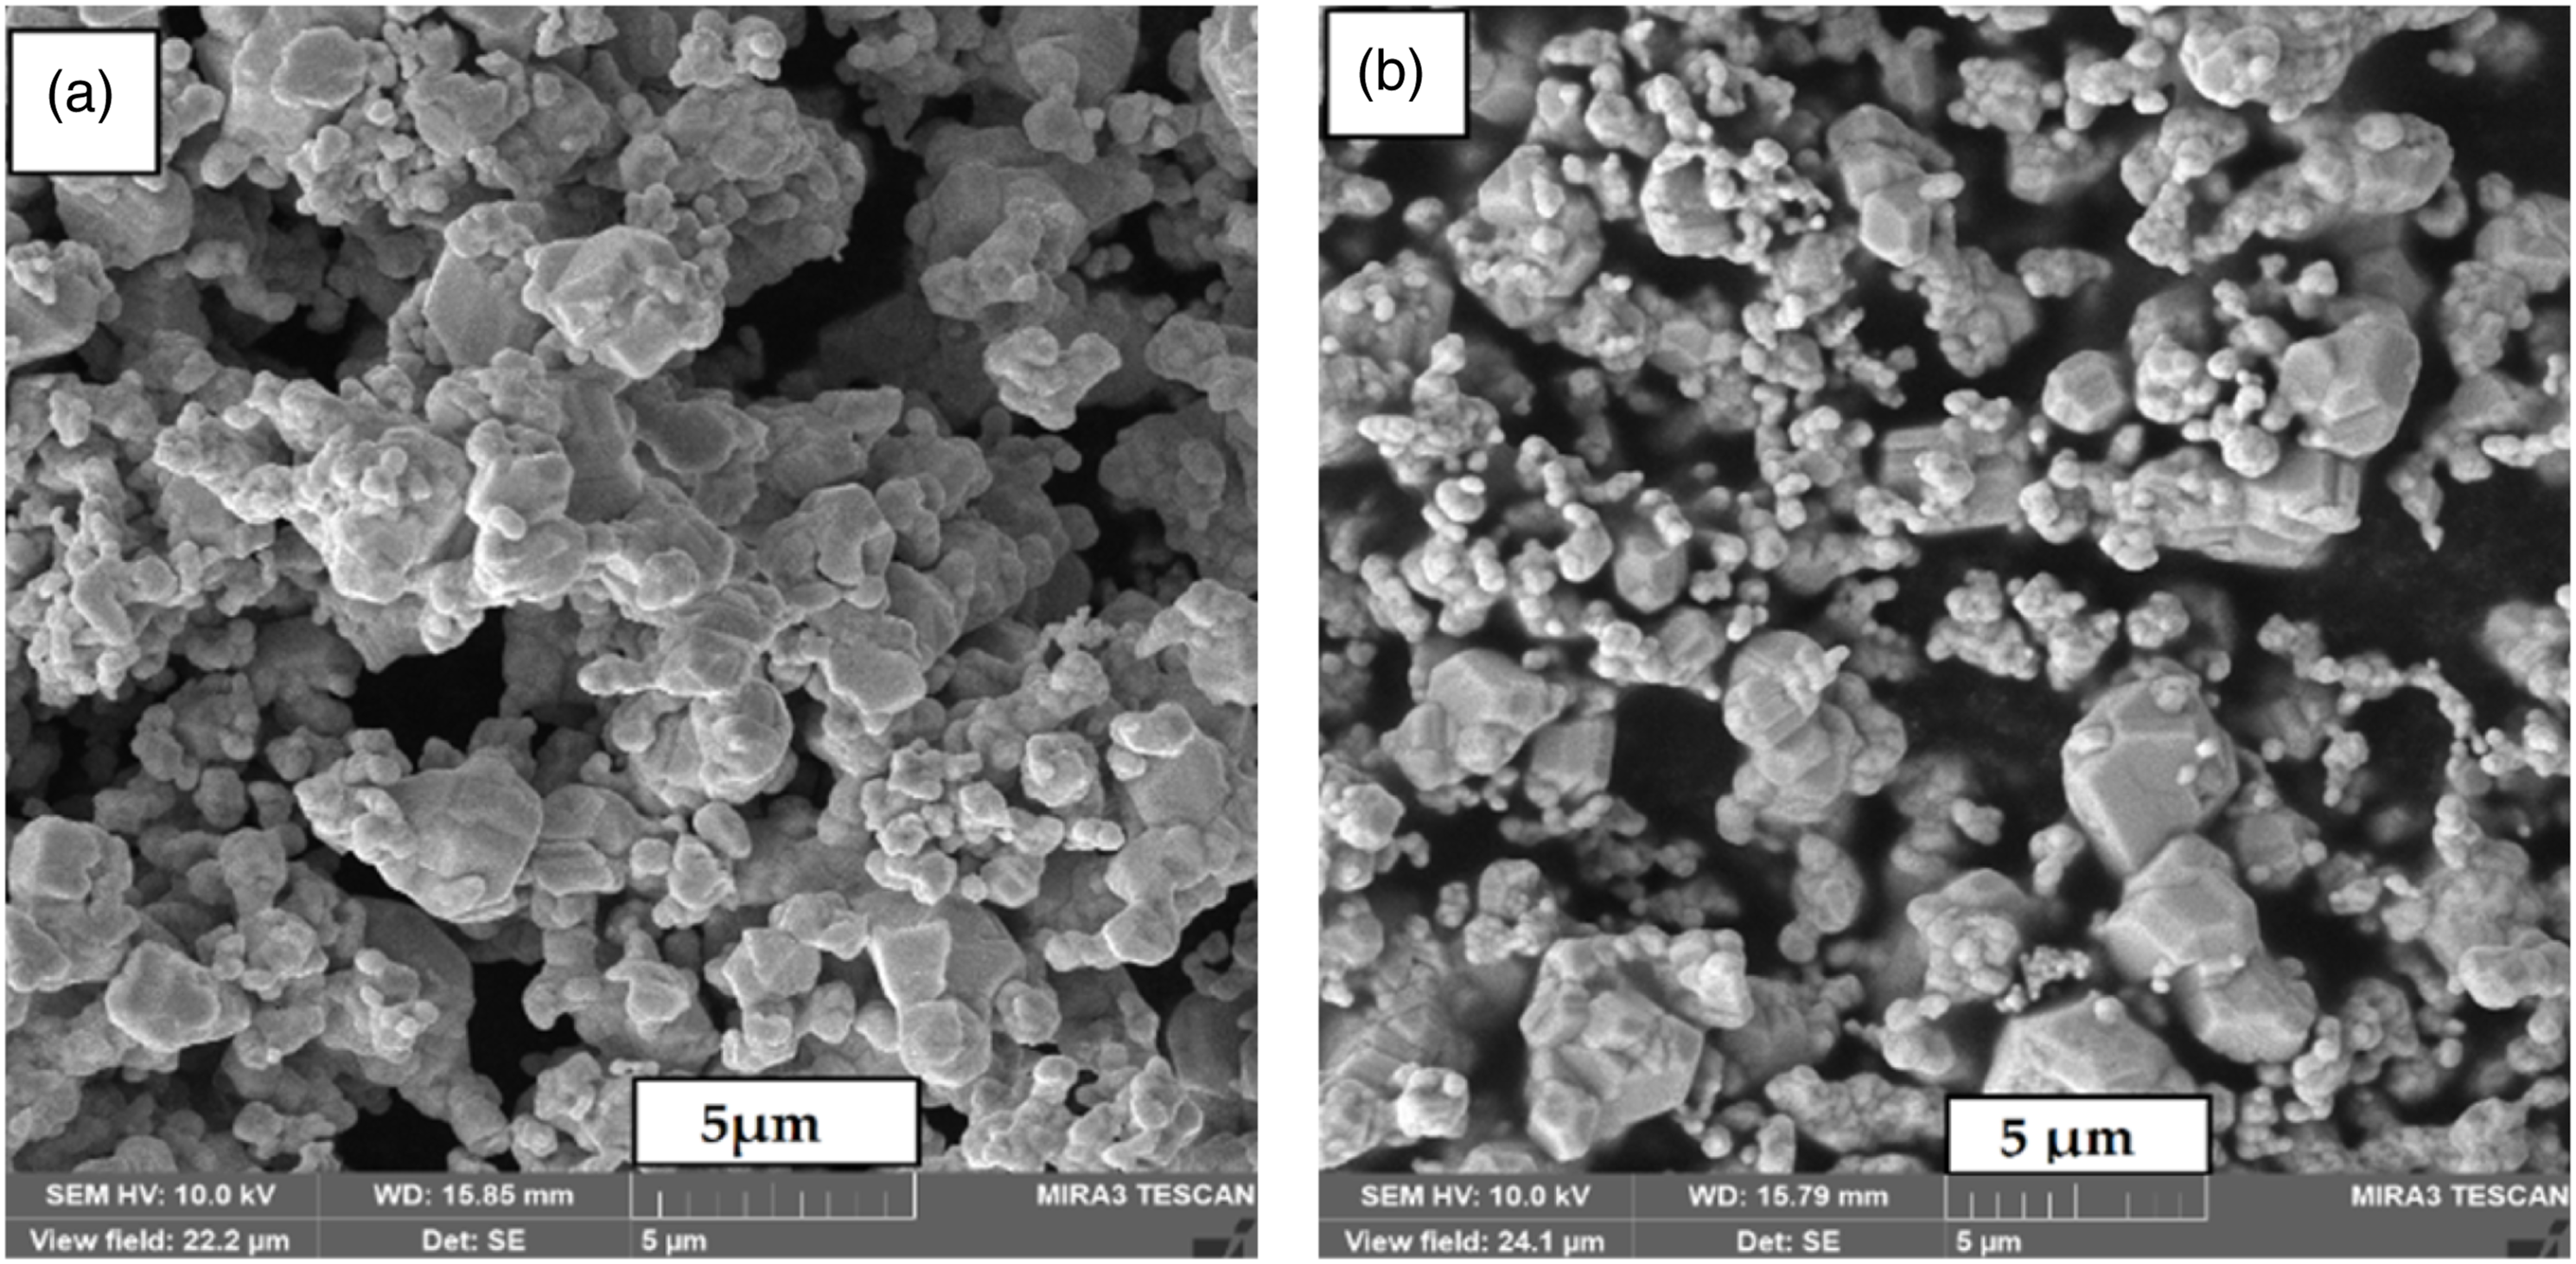
Figure 6 shows representative optical microscopy images of 4.5 vol% Ag-PU composites, as an example, for the four procedures: (a) casting with sonication, (b) casting without sonication, (c) spin-coating with sonication and (d) spin-coating without sonication. Figure 6(a) and (b) show a significant impact of sonication on the dispersion of the filler for the casting samples. From the image, large clusters can be observed, sometimes larger than 100 μm for the sample prepared without sonication, whereas only small agglomeration, with agglomerates that rarely reached 30 μm, were present in the sample obtained with the sonication step. For the composites fabricated by the spin-coating technique (Figure 6(c) and (d)), it is also observed a reduction in the size and number of agglomerated sites after the sonication step, but the effect of sonication in dispersing the filler was weaker. Lin et al. have found similar effects of sonication in the dispersion of silver particles on polymer matrix.
45
Optical microscopy images in-plane for Ag-PU with 4.5 vol% filler obtained by four different procedures: (a) casting with sonication, (b) casting without sonication, (c) spin-coating with sonication, and (d) spin-coating without sonication.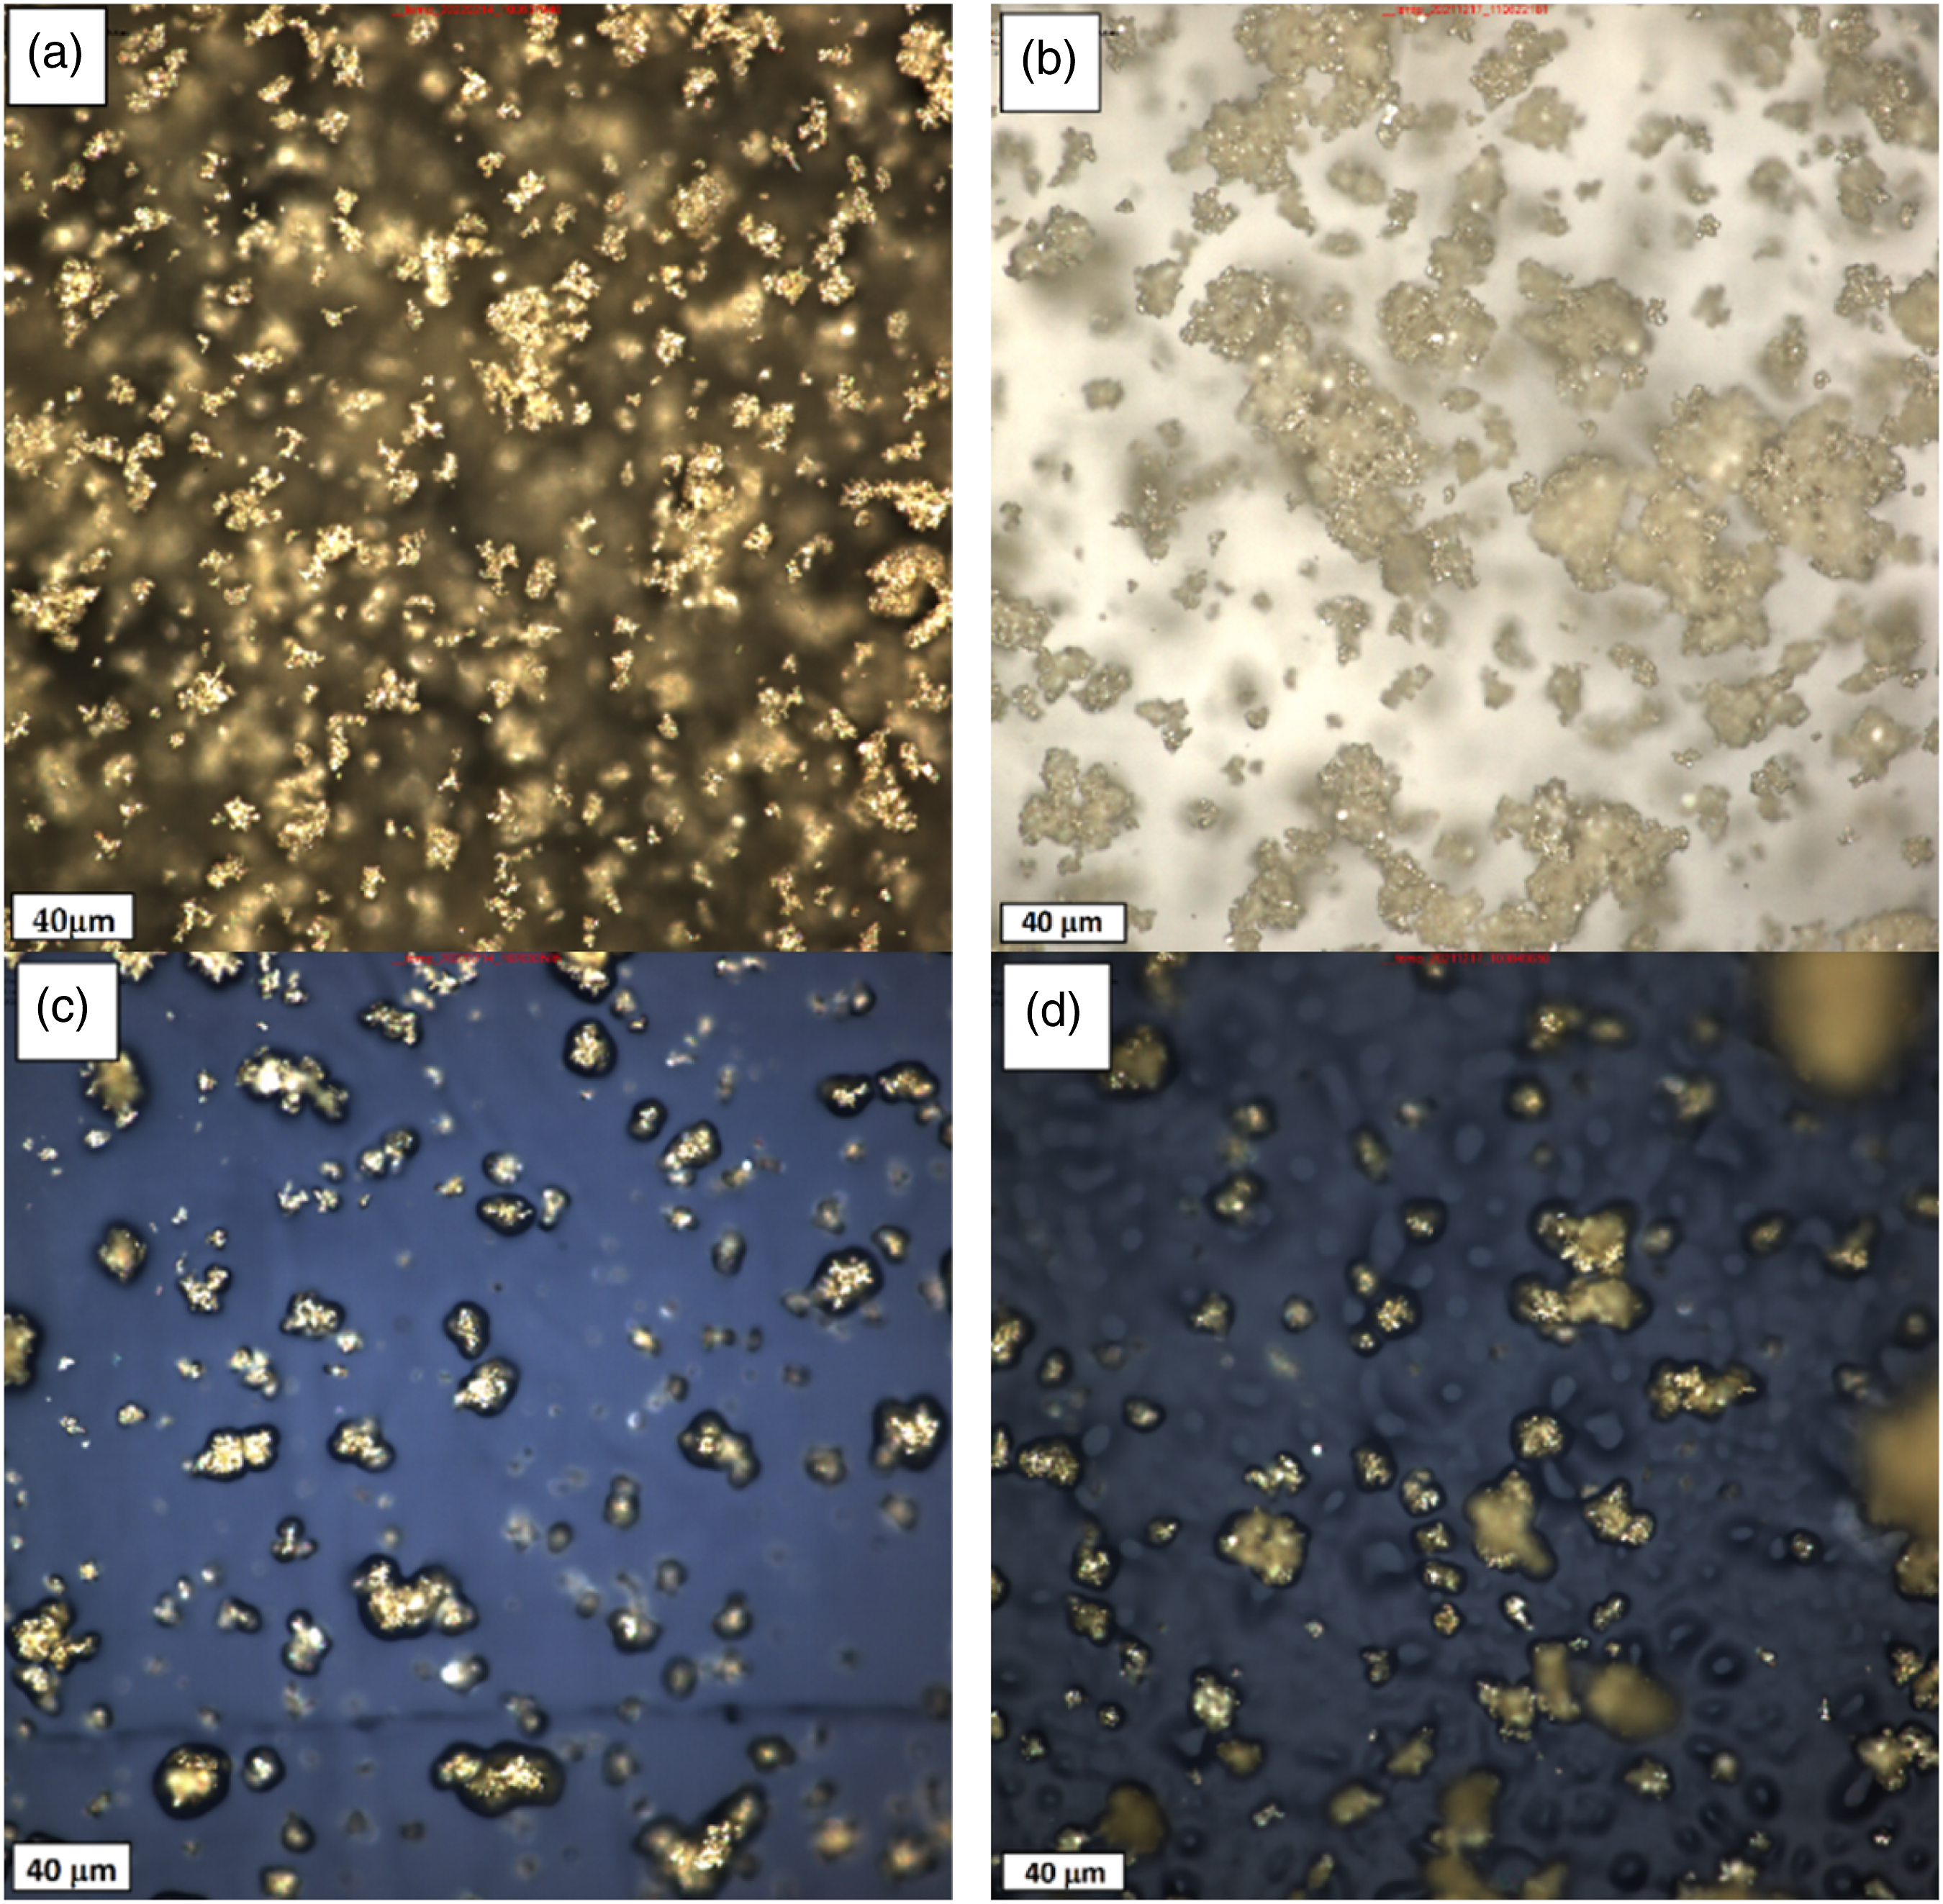
The cross-sectional images of 4.5 vol% Ag-PU composites obtained by the four procedures are shown in Figure 7. The samples obtained by the spin-coating are half as thick as those obtained by the casting process, resulting in the reduction of the number of fillers. For composites with sonication (Figure 7(a) and (c)), the silver particles are dispersed uniformly throughout the thickness. However, for composites without sonication (Figure 7(b) and (d)) more agglomerated particles can be observed that would allow the formation of conductive network.17,26 Cross-sectional optical microscopy images of 4.5 vol% filler in Ag-PU composite, obtained by four different procedures: (a) casting with sonication, (b) casting without sonication, (c) spin-coated with sonication, and (d) spin-coated without sonication.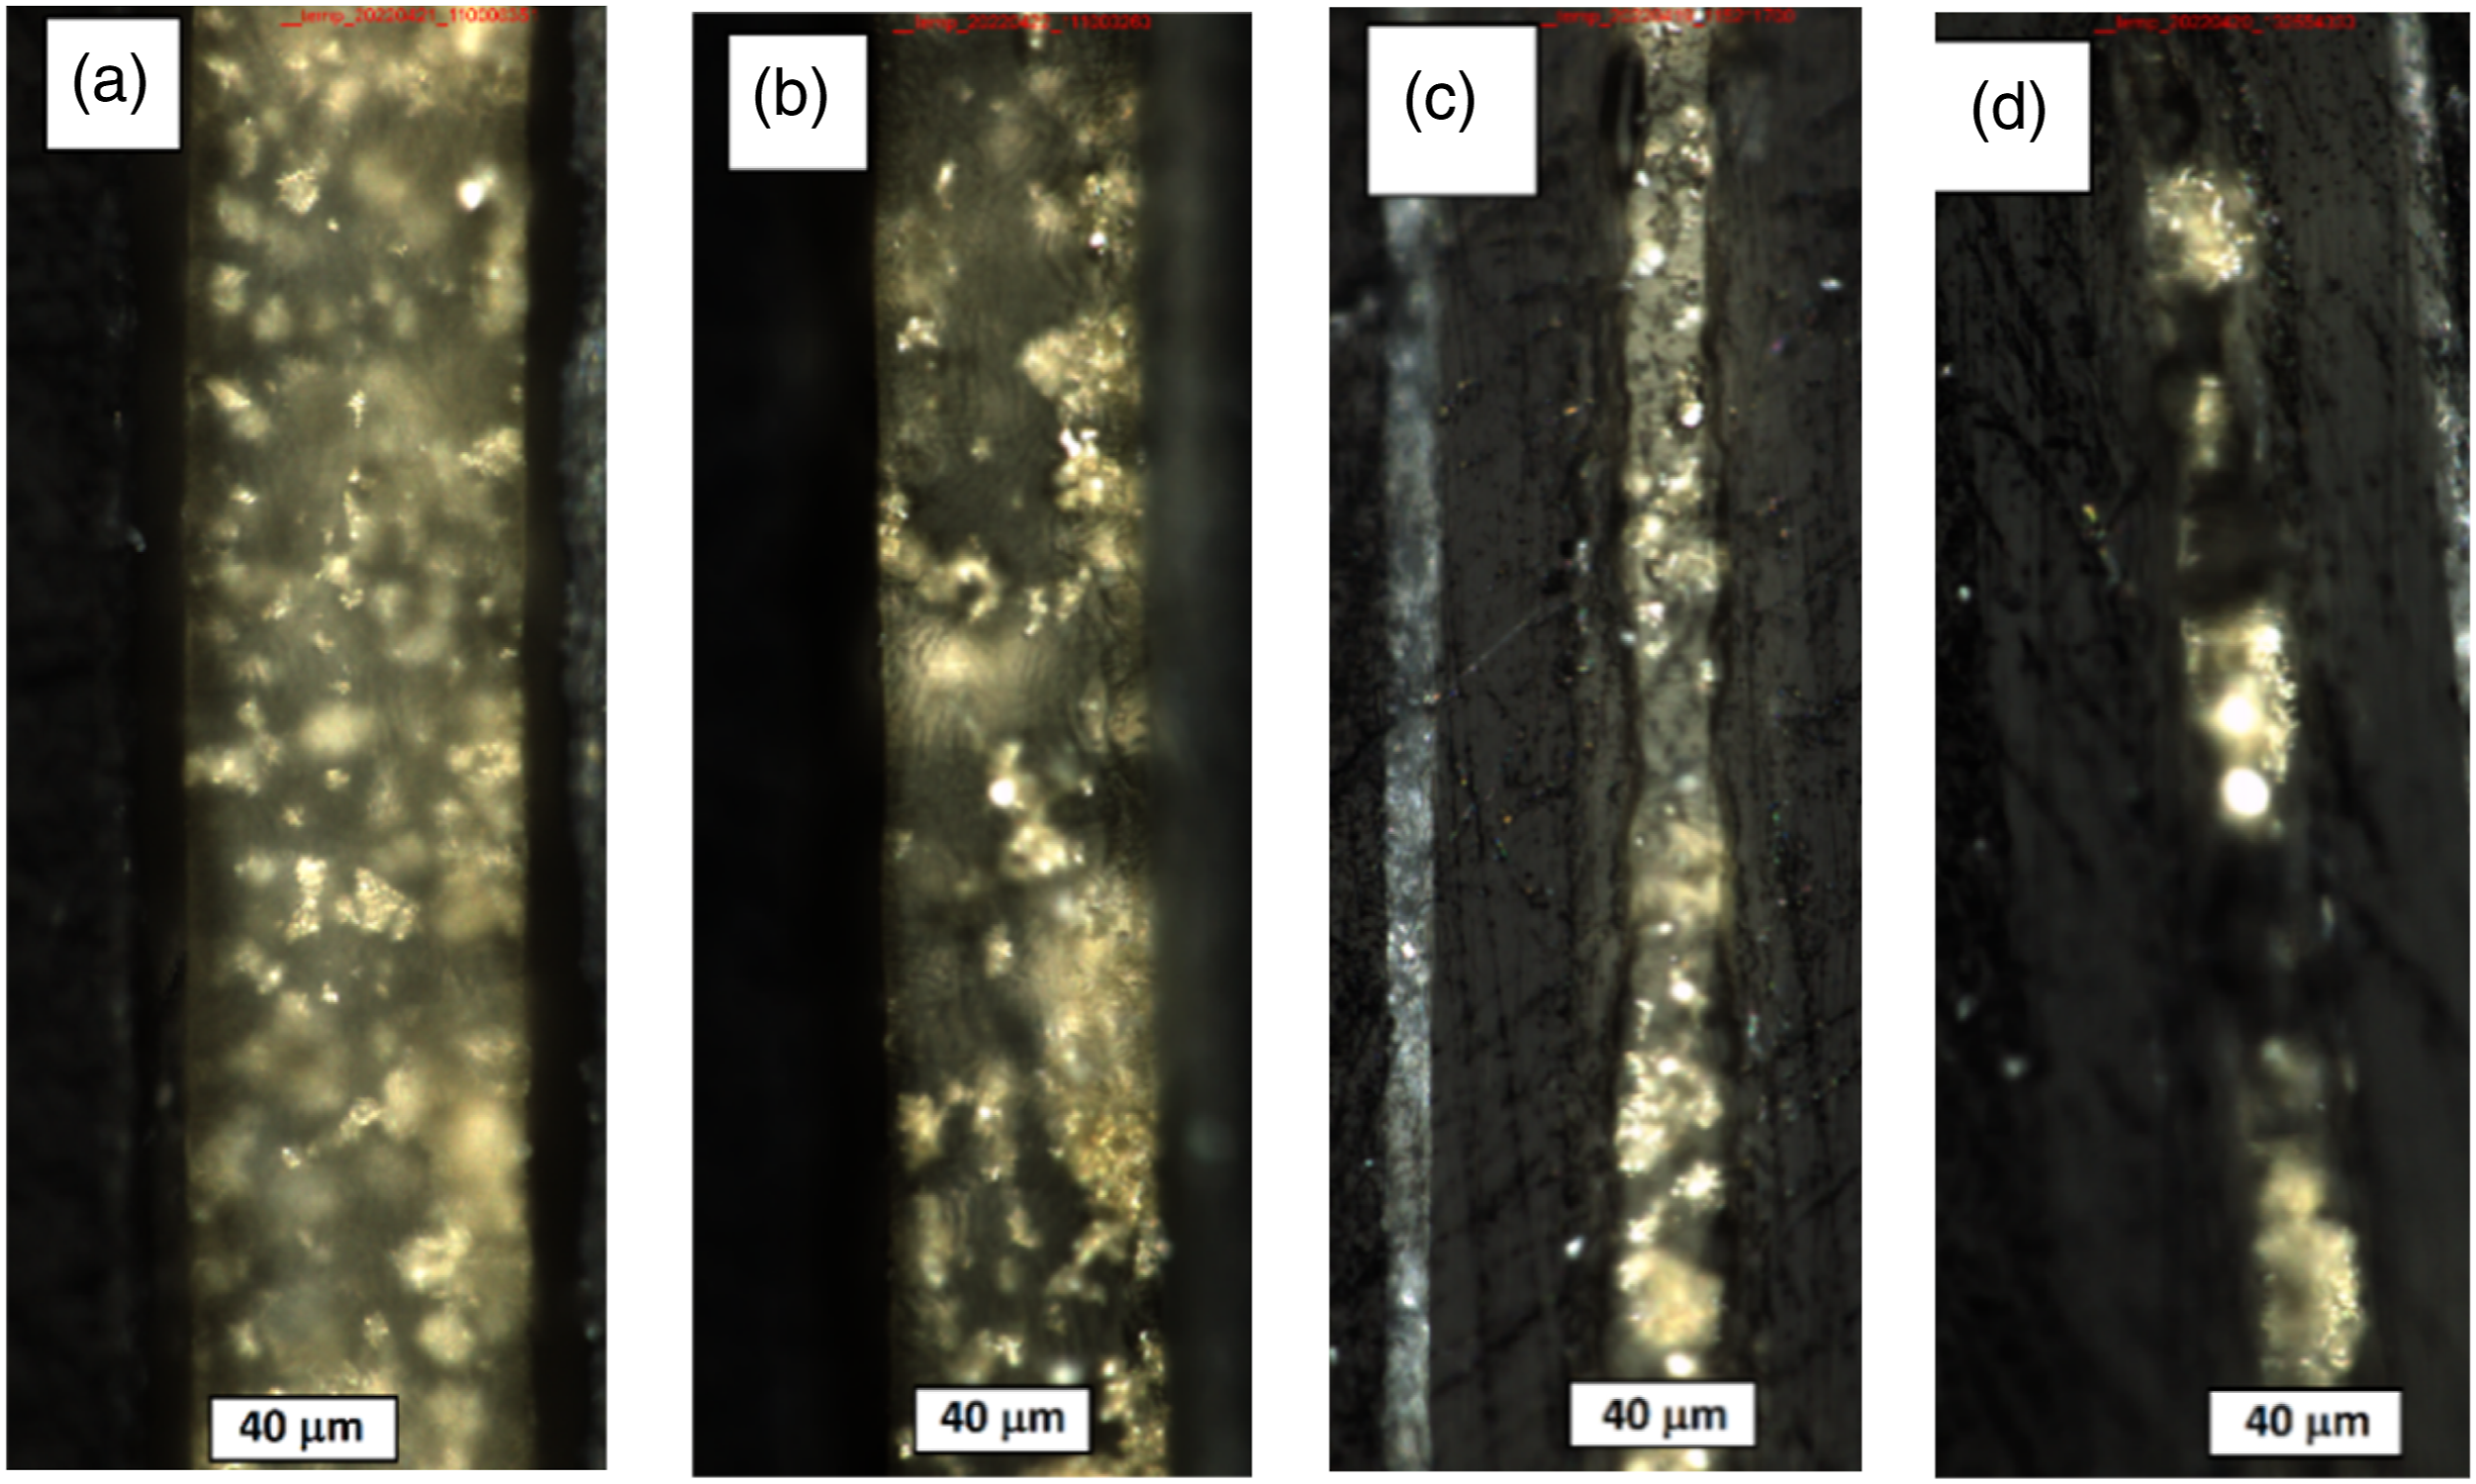
Figures 8 and 9 show experimental results of electrical conductivity measurement of micro Ag-PU composites versus different concentration of filler under several pressures, fabricated using the casting and the spin-coating techniques, respectively. In general, the conductivity increased with the increase in filler concentrations at constant pressure. As can be seen from the figures, the conductivity remained constant or with a minimum increase until it reached a specific concentration for which the conductivity sharply increased several orders of magnitude, and then, the change in conductivity was insignificant or constant.
9
This significant increment in conductivity at a specific concentration of filler is known as the percolation threshold (PT), which is one of the fundamental parameters in designing conductive materials.3,9,11 This behaviour is based on the percolation theory. At the percolation threshold point, the chance of constructing inner pathways for electron transportation increases.
11
For the samples obtained by spin-coating, the percolation threshold ranges from 0.1 to 1.2 vol% (10 to 1 wt%) for both with and without sonications. Whereas for the samples obtained by casting, the PT ranges from 2.6 to 6.6 vol% (20 to 40 wt%) when sonication was used and from 4.3 to 6.6 vol% (30 to 40 wt%) without sonication. Some similar values of PT have been found in the literature. Ramli et al.
15
found that the PT was around 30 wt% for Polysiloxane–Silver composites. Also, Kwag et al
20
reached to a 63.3 wt% (14.8 vol%) PT for silver composites, and when they introduced a certain amount of boron nitride to the composite, the PT decreased to 52.0 wt% (9.53 vol%). Tang et al.
3
reported different PTs for spherical, flake and dendrite silver microparticles of 28, 23 and 13 vol% loaded in PDMS, respectively. The PTs are generally greater than what we found in our sample, possibly due to the composite's different shape and matrix. Experimental measured electrical conductivity of cast micro Ag-PU composites fabricated (a) without sonication and (b) with sonication step for different applied pressures: Experimental measured electrical conductivity of spin-coating micro Ag-PU composites fabricated (a) without sonication and (b) with sonication step for different applied pressures;  , 0.5 kPa;
  , 1 kPa;
  , 2 kPa;
  , 5 kPa;
  , 10 kPa;
  ,15 kPa; and
  , 20 kPa.
 , 0.5 kPa;
  , 1 kPa;
  , 2 kPa;
  , 5 kPa; and
  , 10 kPa.
For the same filler concentrations in samples obtained by both techniques, increasing the pressure resulted in an increase in the conductivity. The electrical behaviour of conductive composites under pressure has been described by some authors in the literature. 46 For example, Dig et al. explained the electrical behaviour of carbon black-filled silicone rubber composite under pressure in terms of the shell structure theory. 47 They commented that the influence of uniaxial pressure results in some effects on the conducting pathways. The uniaxial pressure may reduce the distance between black carbon molecules that are in an effective conducting path or not, enhancing conductivity. But also, the pressure may expel some carbon black from the effective conductive path, so the conductivity of the composite decreases. Zhang et al. 48 studied the time dependence of piezoresistance for metal-filled polymer composites. They developed a model to predict piezoresistance based on interparticle separation. They supposed that the resistance on the composite depends on the number of conducting particles and the number of conducting paths, and the tunnelling current may flow through particles when the separation is small. Then, the resistance varies if stress is applied to the sample because the interparticle separation changes due to the differential in compressibility between the filler particle and the matrix. In our study, we suppose that the pressure produced a deformation of the composite thus reducing the gaps between the silver particles, hence promoting the formation of more conductive pathway, and so, increasing the electrical conductivity of the material.
In addition, the increase of pressure causes a decrease in the percolation threshold concentration. This phenomenon is known as the pressure-induced percolation transition (PIPT). 49 For example, for the samples prepared by casting with sonication, Figure 8(b), the percolation threshold reduces from about 6.5 vol% of filler at 0.5 to 2.5 vol% at 10 kPa and does not decrease further when the pressure increases beyond this point. For both techniques, the percolation thresholds of samples prepared with sonication are higher than those obtained without sonication. This difference is more noticeable for composites obtained by casting. This behaviour can be related to the reduction in the agglomeration and increase in the dispersion of silver particles when sonication was used (see Figure 7(a)).
Furthermore, the percolation thresholds are lower for the spin-coating composites than the casting ones. For example, for the samples compressed by 1 kPa (Figures 8a and 9(a)) PT is around 6.5 vol% for the casting composites and 1.2 vol% of silver for the spin-coating composite. The probability of forming conductive networks is higher for the spin-coating samples because the thickness of the films produced by spin-coating is smaller (around 20 μm) than those produced by casting (higher than 50 μm). However, the conductivities of the composite films fabricated by casting were higher than those produced by spin-coating. As can be seen from equation (1), the higher conductivity in the casting material was also affected by thickness, the thicker the material is, the higher is their conductivity. The maximum conductivity of 2.45 S∙m−1 was observed for the composite film with 13.7 vol % prepared by casting without sonication when 20 kPa were applied.
Simulations
Figure 10 shows the simulation and experimental electrical conductivity under different pressures versus volume fraction of Ag for micro Ag-PU composite films fabricated by casting technique with and without sonication step (Figure 10(a)–(f), respectively). The experiments and simulations were conducted on the composite film under 0.5, 1, 2, 5, 10, 15, and 20 kPa. However, for clarity, Figure 10 only plots the results for 1, 10 and 20 kPa. The rest of the results are presented in the supplementary section (Figure (S2)). It can be seen from Figure 11 that the FE-RVE model had the ability to predict the electrical behaviour of composite films under different pressures for all concentrations except a concentration close to zero vol%. It might be due to the fact that the Digimat software may recognize the effective conductivity of the composites with lower filler concentrations as pure polymer (10−14 S∙m−1). While our set-up has the limitation on measuring high resistance higher than 200 MΩ. However, the simulation can predict the experimental percolation threshold, which is the filler concentration for which the conductivity increases by several orders of magnitude. For example, in Figure 10(a) simulated and experimental PTs at 1 and 20 kPa were 6.6 and 4.3 vol% of silver in the PU matrix, respectively, for composite films obtained with sonication that was considered only 40% of agglomeration in the simulation. In samples prepared without sonication (Figure 10(b)), the agglomeration (or clustering) was defined around 70% of filler particles; the simulated PTs agree with the experimental counterparts for compressed composites between 6.6 and 2.6 vol% under 1 and 20 kPa. The results showed that the PIPT phenomenon can also be predicted with this numerical simulation technique. For higher concentrations of silver and/or higher applied pressures simulation results were more accurate, as shown in Figure 10(b), (c) and 10(e), (f) for pressures higher than 10 kPa. In conclusion, the simulation approach can predict the conductivity and the percolation threshold for all composite films produced using the casting process. Comparison between the experimental and simulated electrical conductivity of Ag-PU obtained by the casting technique using sonication (a, b, c) and without sonication step (d, e, f) under several pressures (a), (d) 1 kPa, (b), (e) 10 kPa, (c), (f) 20 kPa. The orange curve-points represent simulated conductivity, and the blue curve-points represent experimental conductivity. Comparison between the experimental and simulated electrical conductivity of Ag-PU obtained by the spin-coating technique using sonication (a, b, c) and without sonication step (d, e, f) under several pressures (a), (d) 1 kPa, (b), (e) 5 kPa, (c), (f) 10 kPa. The orange curve-points represent simulated conductivity, and the blue curve-points represent experimental conductivity.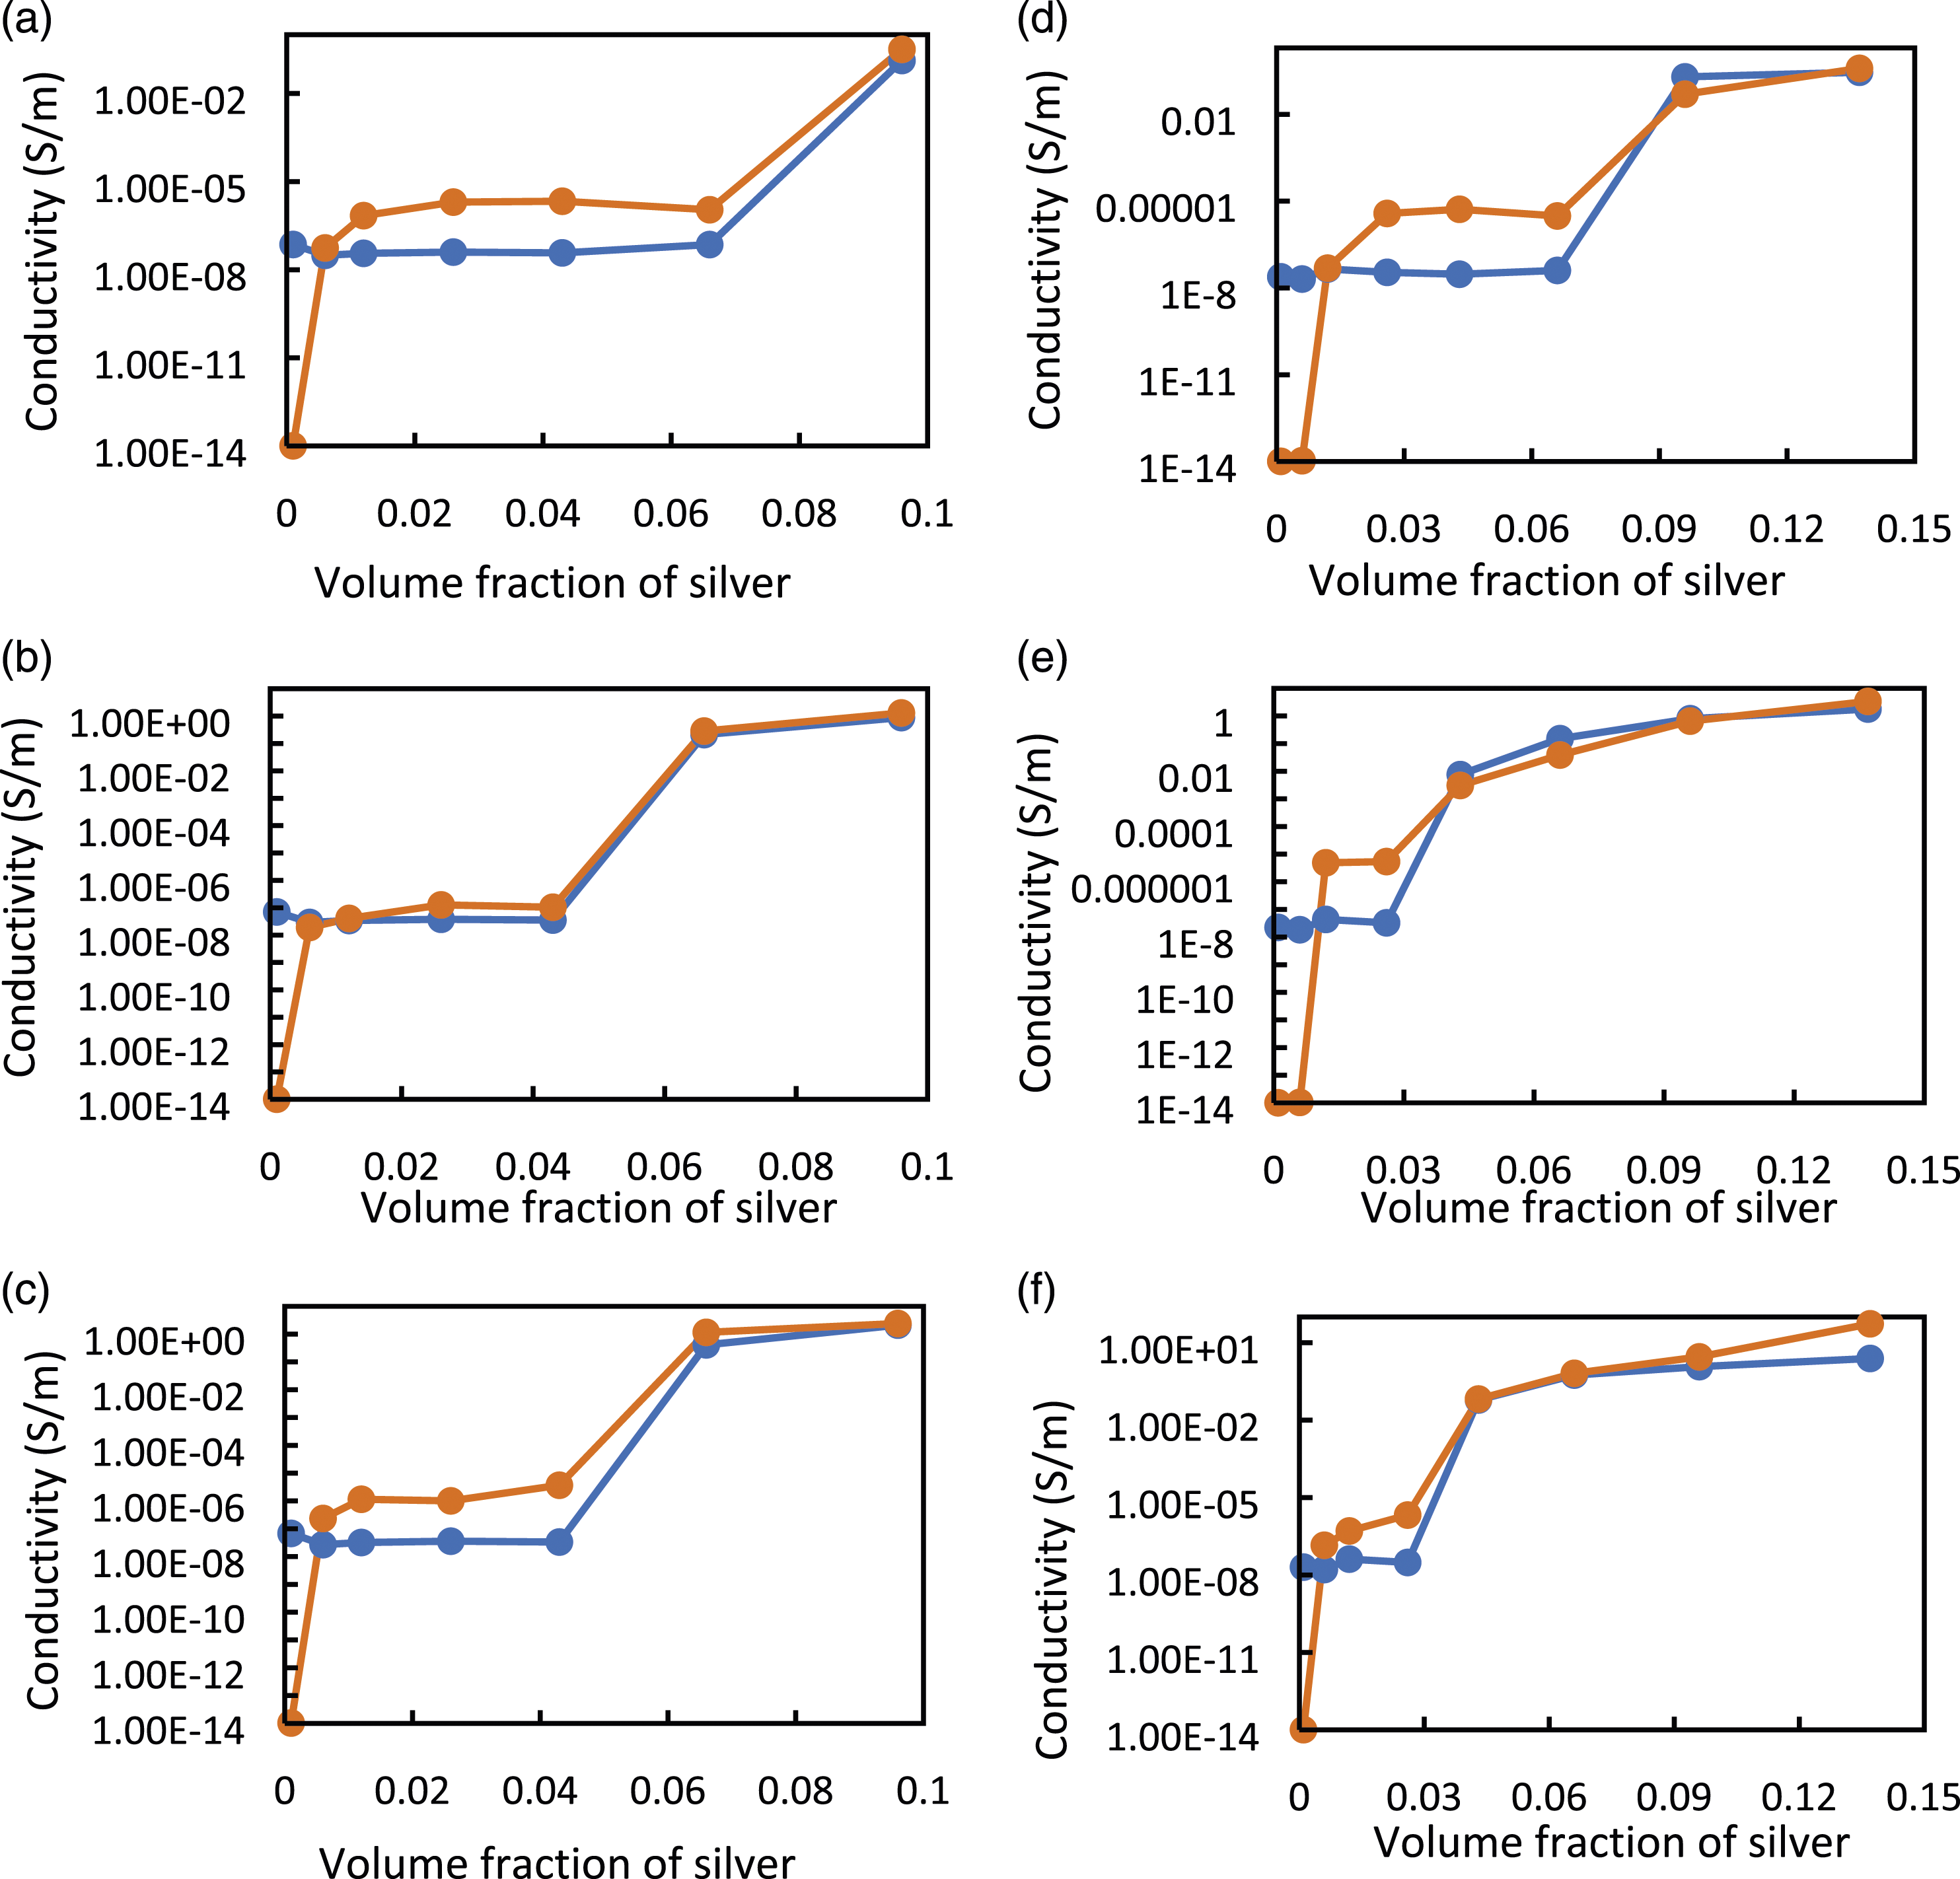
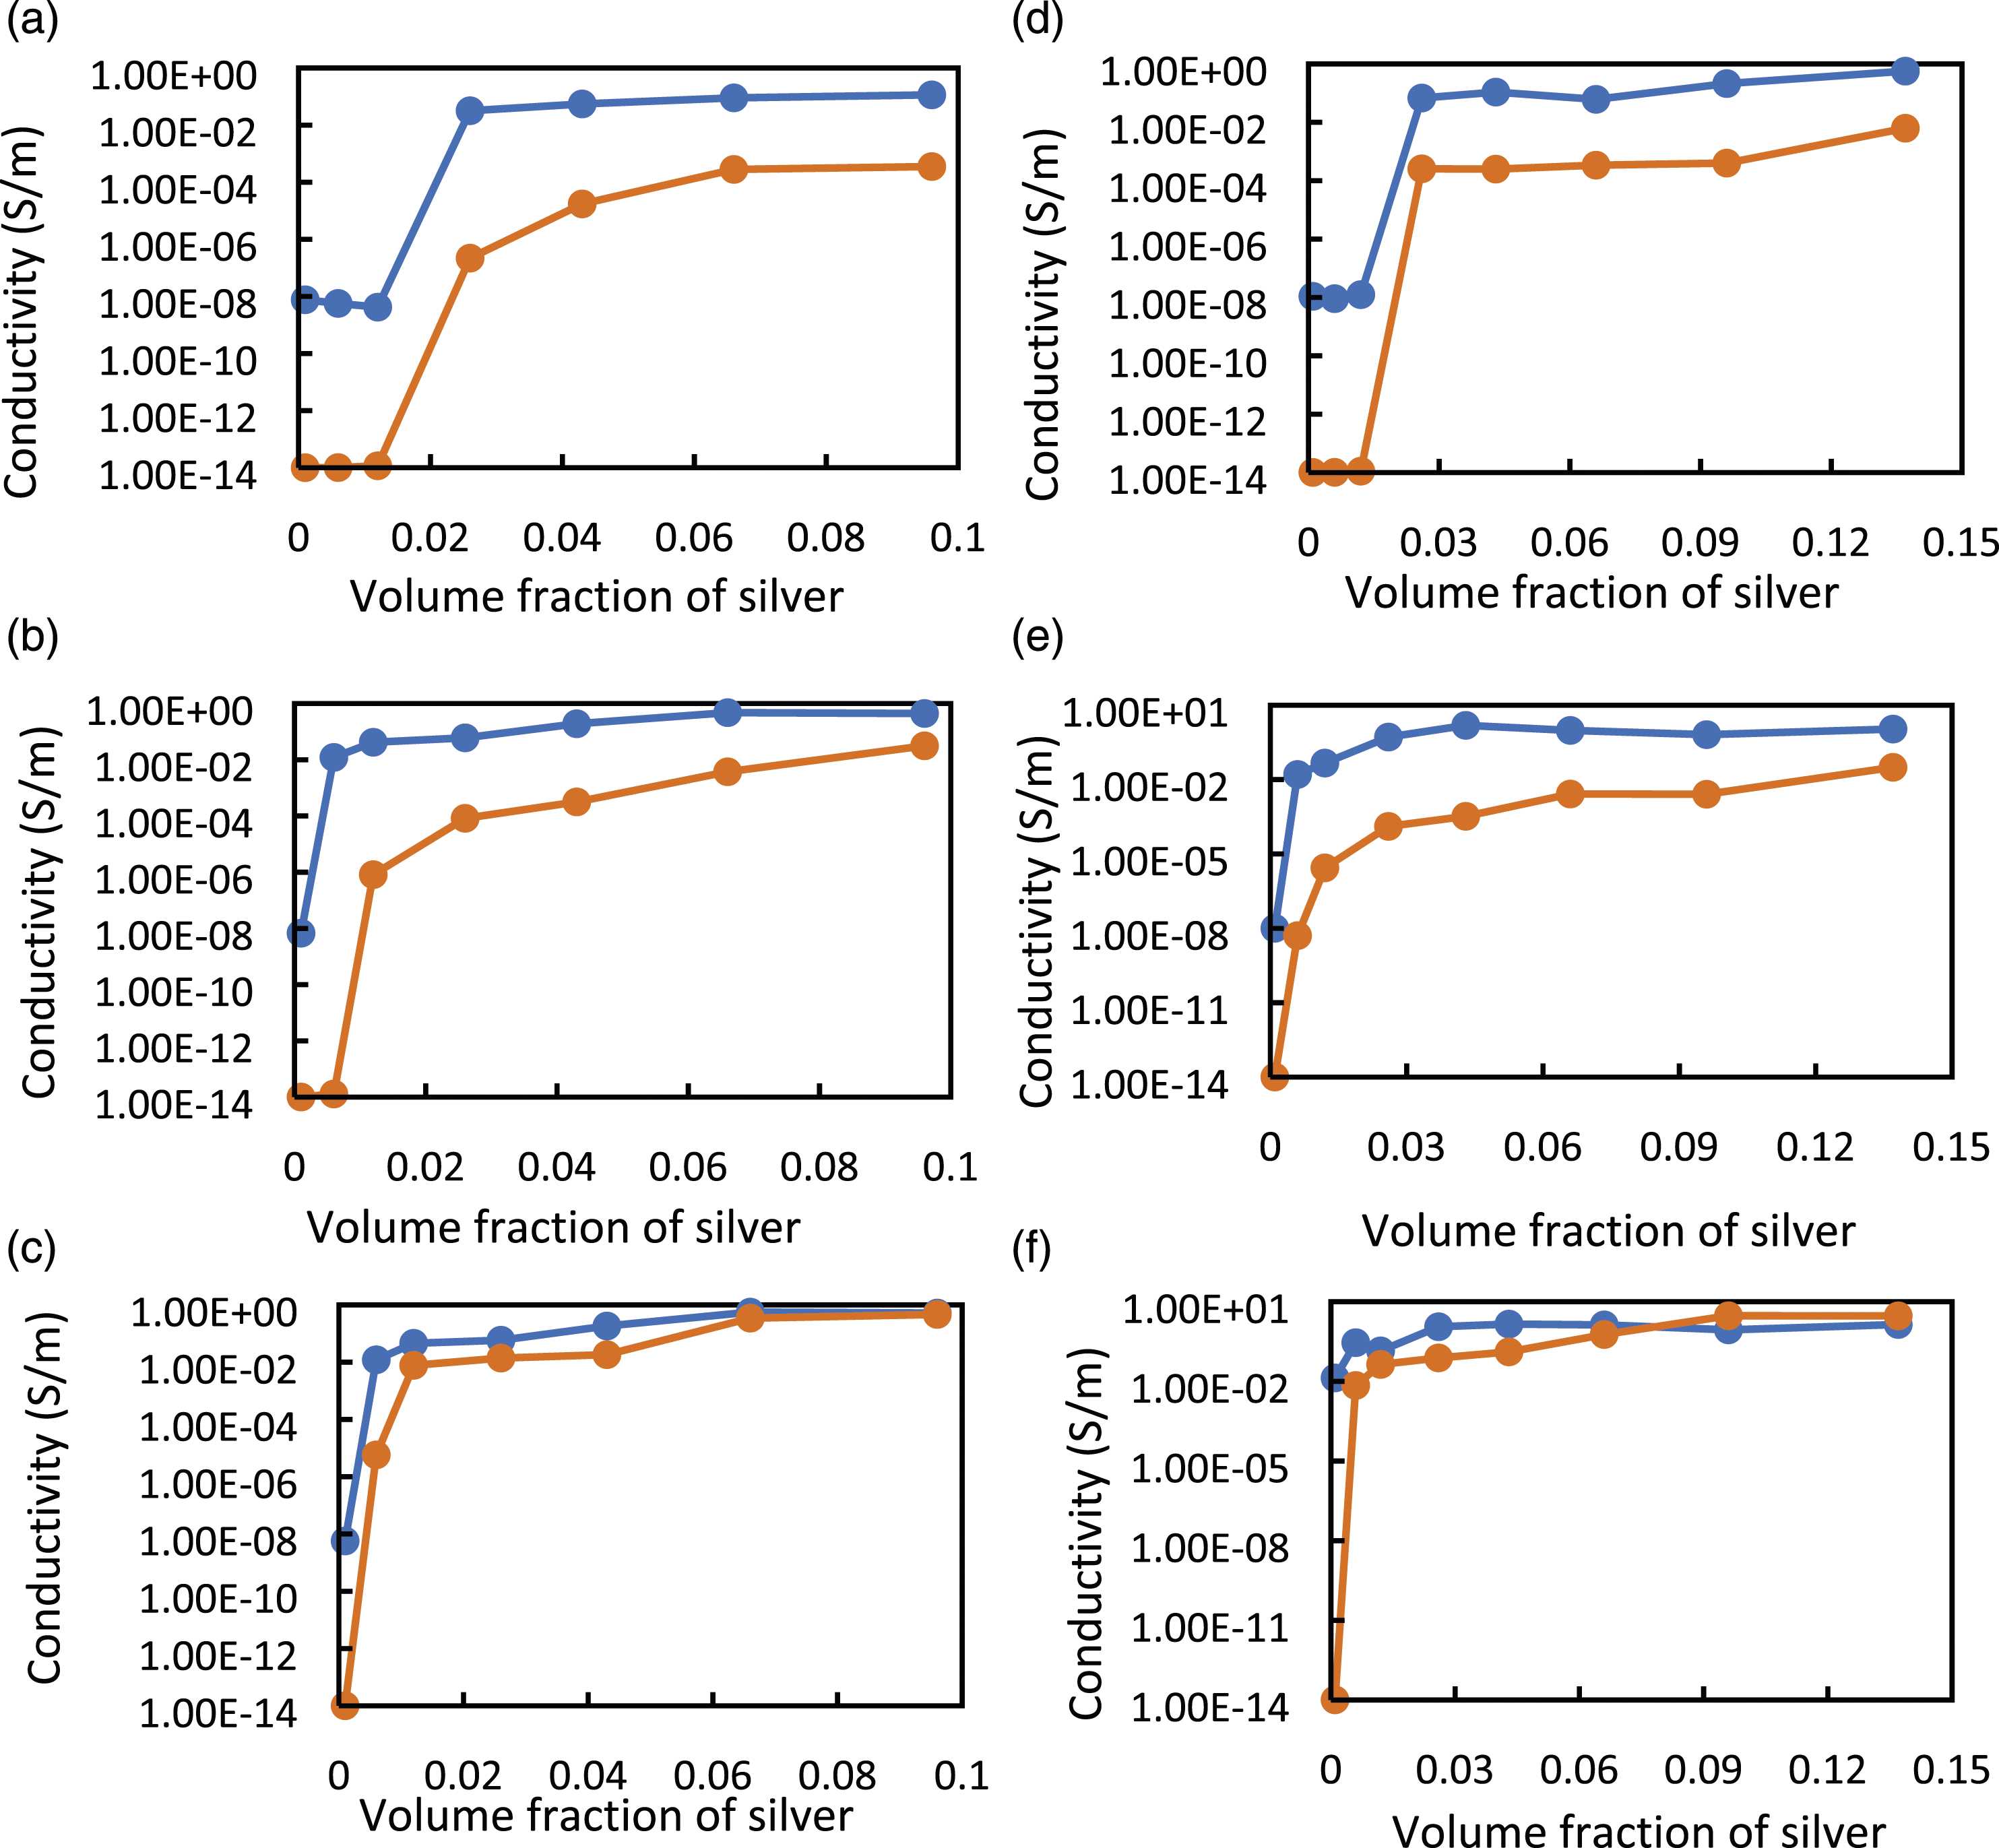
Figure 11 compares experimental and simulation results obtained from micro Ag-PU composite films using spin-coating technique for both with (Figure 11(a), (b) and (c)) and without sonication (Figure 11(d)–(f)). In this figure, the electrical conductivity of composites was simulated for all the silver fractions at 0.5, 1, 2, 5 and 10 kPa. Again Figure 11 shows data for 1, 5 and 10 kPa for clarity, and other results were presented in the supplementary section (Figure S3). The simulations could predict the PT of spin-coated composites under pressures, see Figure 11. For the spin-coating technique, the RVE was assumed to be 1000 μm3 and with this assumption, the simulated conductivity was lower than the experimental results for pressures lower than 5 kPa. At a higher pressure (10 kPa), the predicted conductivity was closer to experimental ones. Therefore, it can be deduced that the simulation results are more reliable for more conductive materials.
To summarize, for both spin-coating and casting techniques the finite element method based on the RVE model can accurately predict the PT, but the simulated conductivity at a concentration close to zero was below the experimental conductivity in all cases. The reliability of the implemented model (FE-RVE) and assumptions have a higher accuracy for the more compressed samples (loads higher than 10 kPa) for both casting and spin-coating procedures. It seems that the model can predict electrical performance when the composite shows relatively high conductivity. The models also capture the influence of agglomeration of the particles introduced into the composite by the use or absence of sonication step in both techniques.
Analytical model
In this work, a semi-analytical model introduced by Krupa and Chodák
50
was implemented to model and predict the electrical properties of fabricated Ag-PU composite films. Previously, this model was used by Boudenne et al. and Mehvari et al. for copper-polymer composites.38,51 In this semi-analytical model, the relative conductivity is an exponential function of the volume fraction of filler, which is described as below:
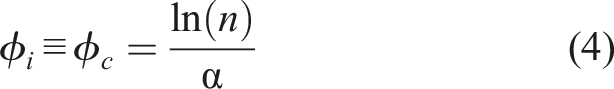
The maximum conductivity of composite at the highest experimental concentration of filler (

The pressure, p, calculated threshold concentration percolation
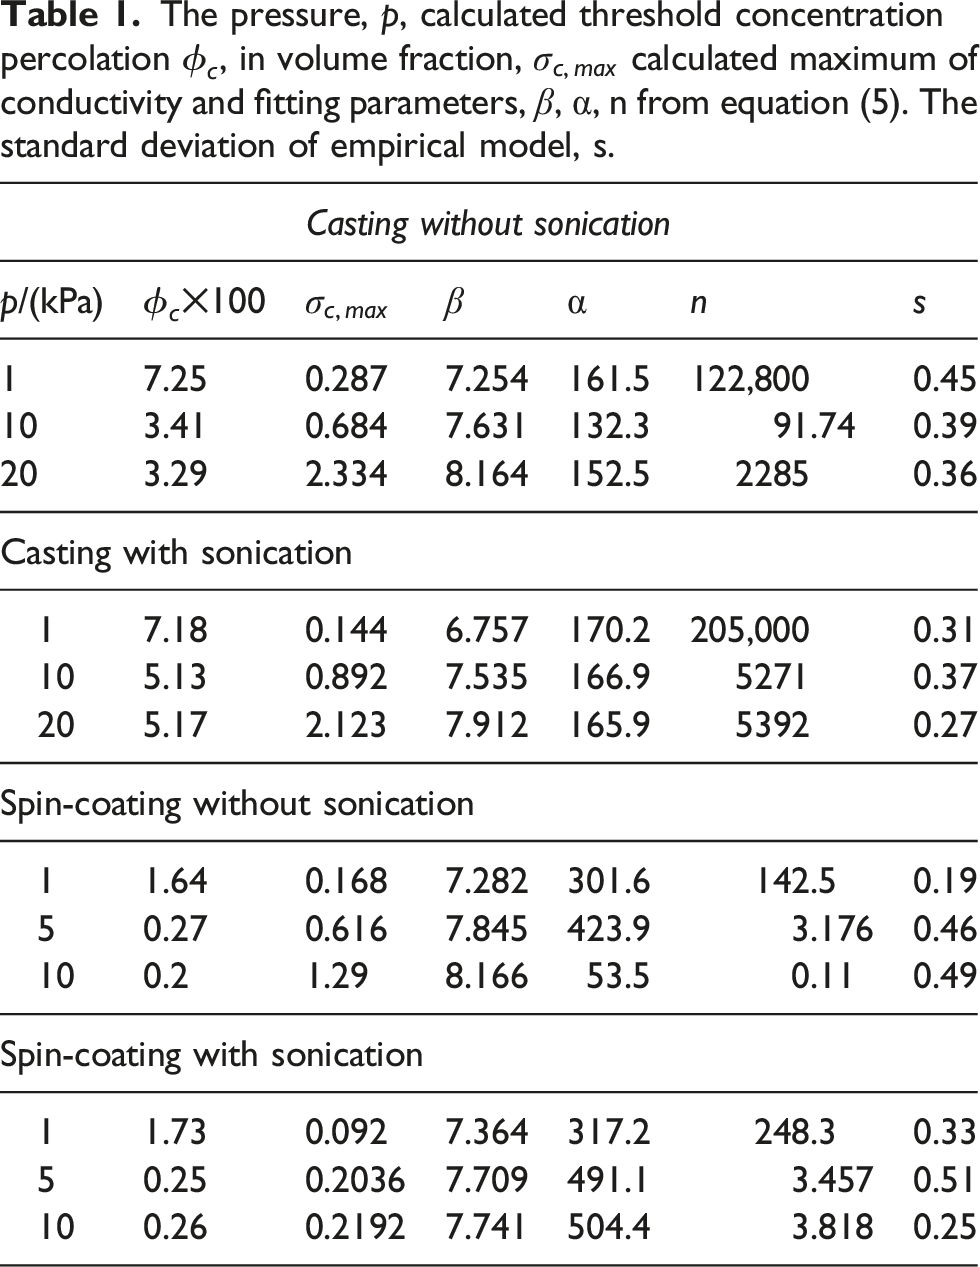
From Table 1, it can be deduced that this model can successfully obtain the electrical performance of metal-polymer conductive composites. All the calculated PTs are similar to experimental results.
Conclusions
This study uses experimental and numerical approaches to examine the electrical behavior of micro silver polyurethane (Ag-PU) composite films with several levels of agglomeration obtaining by spin-coating and casting technique. The imaging of the composite films has shown that the silver particle agglomeration decreases when the sonication step was introduced into the fabrication process. The conductivity can change from 10−9 to 2.5 S·m−1 depending on the applied pressure (1 to 20 kPa) and the fabrication technique. The pressure effect is due to that when the materials were compressed, the gaps between the silver particles narrowing, creating more conductive pathways. For both techniques, the percolation threshold (PT) of samples prepared using the sonication step was higher due to reduction of the agglomeration of silver particles during sonication. Furthermore, the PT and conductivity were lower for the spin-coating composites than the casting ones. This was attributed to the thickness of the film; when the material is thicker, the conductivity becomes larger, but the probability of forming conductive networks is lower. Micro-Ag-PU composite films with different electrical properties depending on the pressure and fabrication techniques can be used for developing devices that require flexible and conductive materials. The FE-RVE model could accurately predict the PT of micro-Ag-PU composites obtained by both techniques. The prediction of conductivity was accurate for the composites produced by the casting and spin-coating techniques at pressures higher than 10 MPa. The model seems to predict the electrical performance when the composite exhibits relatively high conductivity. The models additionally captured the effect of particle agglomeration introduced into the composite by the presence or absence of the sonication step in both procedures.
Supplemental Material
Supplemental Material - Effect of processing methods on the electrical conductivity properties of silver-polyurethane composite films (experimental and numerical studies)
Supplemental Material for Effect of processing methods on the electrical conductivity properties of silver-polyurethane composite films (experimental and numerical studies) by Saeid Mehvari, Benjamin Goodhew, Sergio González, Khalid Lafdi and Yolanda Sanchez-Vicente in Journal of Composite Materials.
Footnotes
Acknowledgements
The authors thank Rebecca Payne, Pietro Maiello, and Simon Neville for their technical support. We also thank M. R Agha Kashkooli and S Tamayo-Vegas for useful discussions in the implementation of analytical model and simulations. We also acknowledge research support from Northumbria University, and MCE QR Steering Funds from the Department of Mechanical and Construction Engineering.
Declaration of conflicting interests
The author(s) declared no potential conflicts of interest with respect to the research, authorship, and/or publication of this article.
Funding
The author(s) received no financial support for the research, authorship, and/or publication of this article.
Data availability statement
Data will be made available on request.
Supplemental Material
Supplemental material for this article is available online. Tables for concentration of silver in the polyurethane, reduced thickness and physical properties of polyurethane and silver. Analytical model and comparison between the experimental and simulated electrical conductivity of obtained Ag-PU composites under pressures of 0.5 kPa, 2 kPa, 5 kPa and 15 kPa.
References
Supplementary Material
Please find the following supplemental material available below.
For Open Access articles published under a Creative Commons License, all supplemental material carries the same license as the article it is associated with.
For non-Open Access articles published, all supplemental material carries a non-exclusive license, and permission requests for re-use of supplemental material or any part of supplemental material shall be sent directly to the copyright owner as specified in the copyright notice associated with the article.