
Abstract
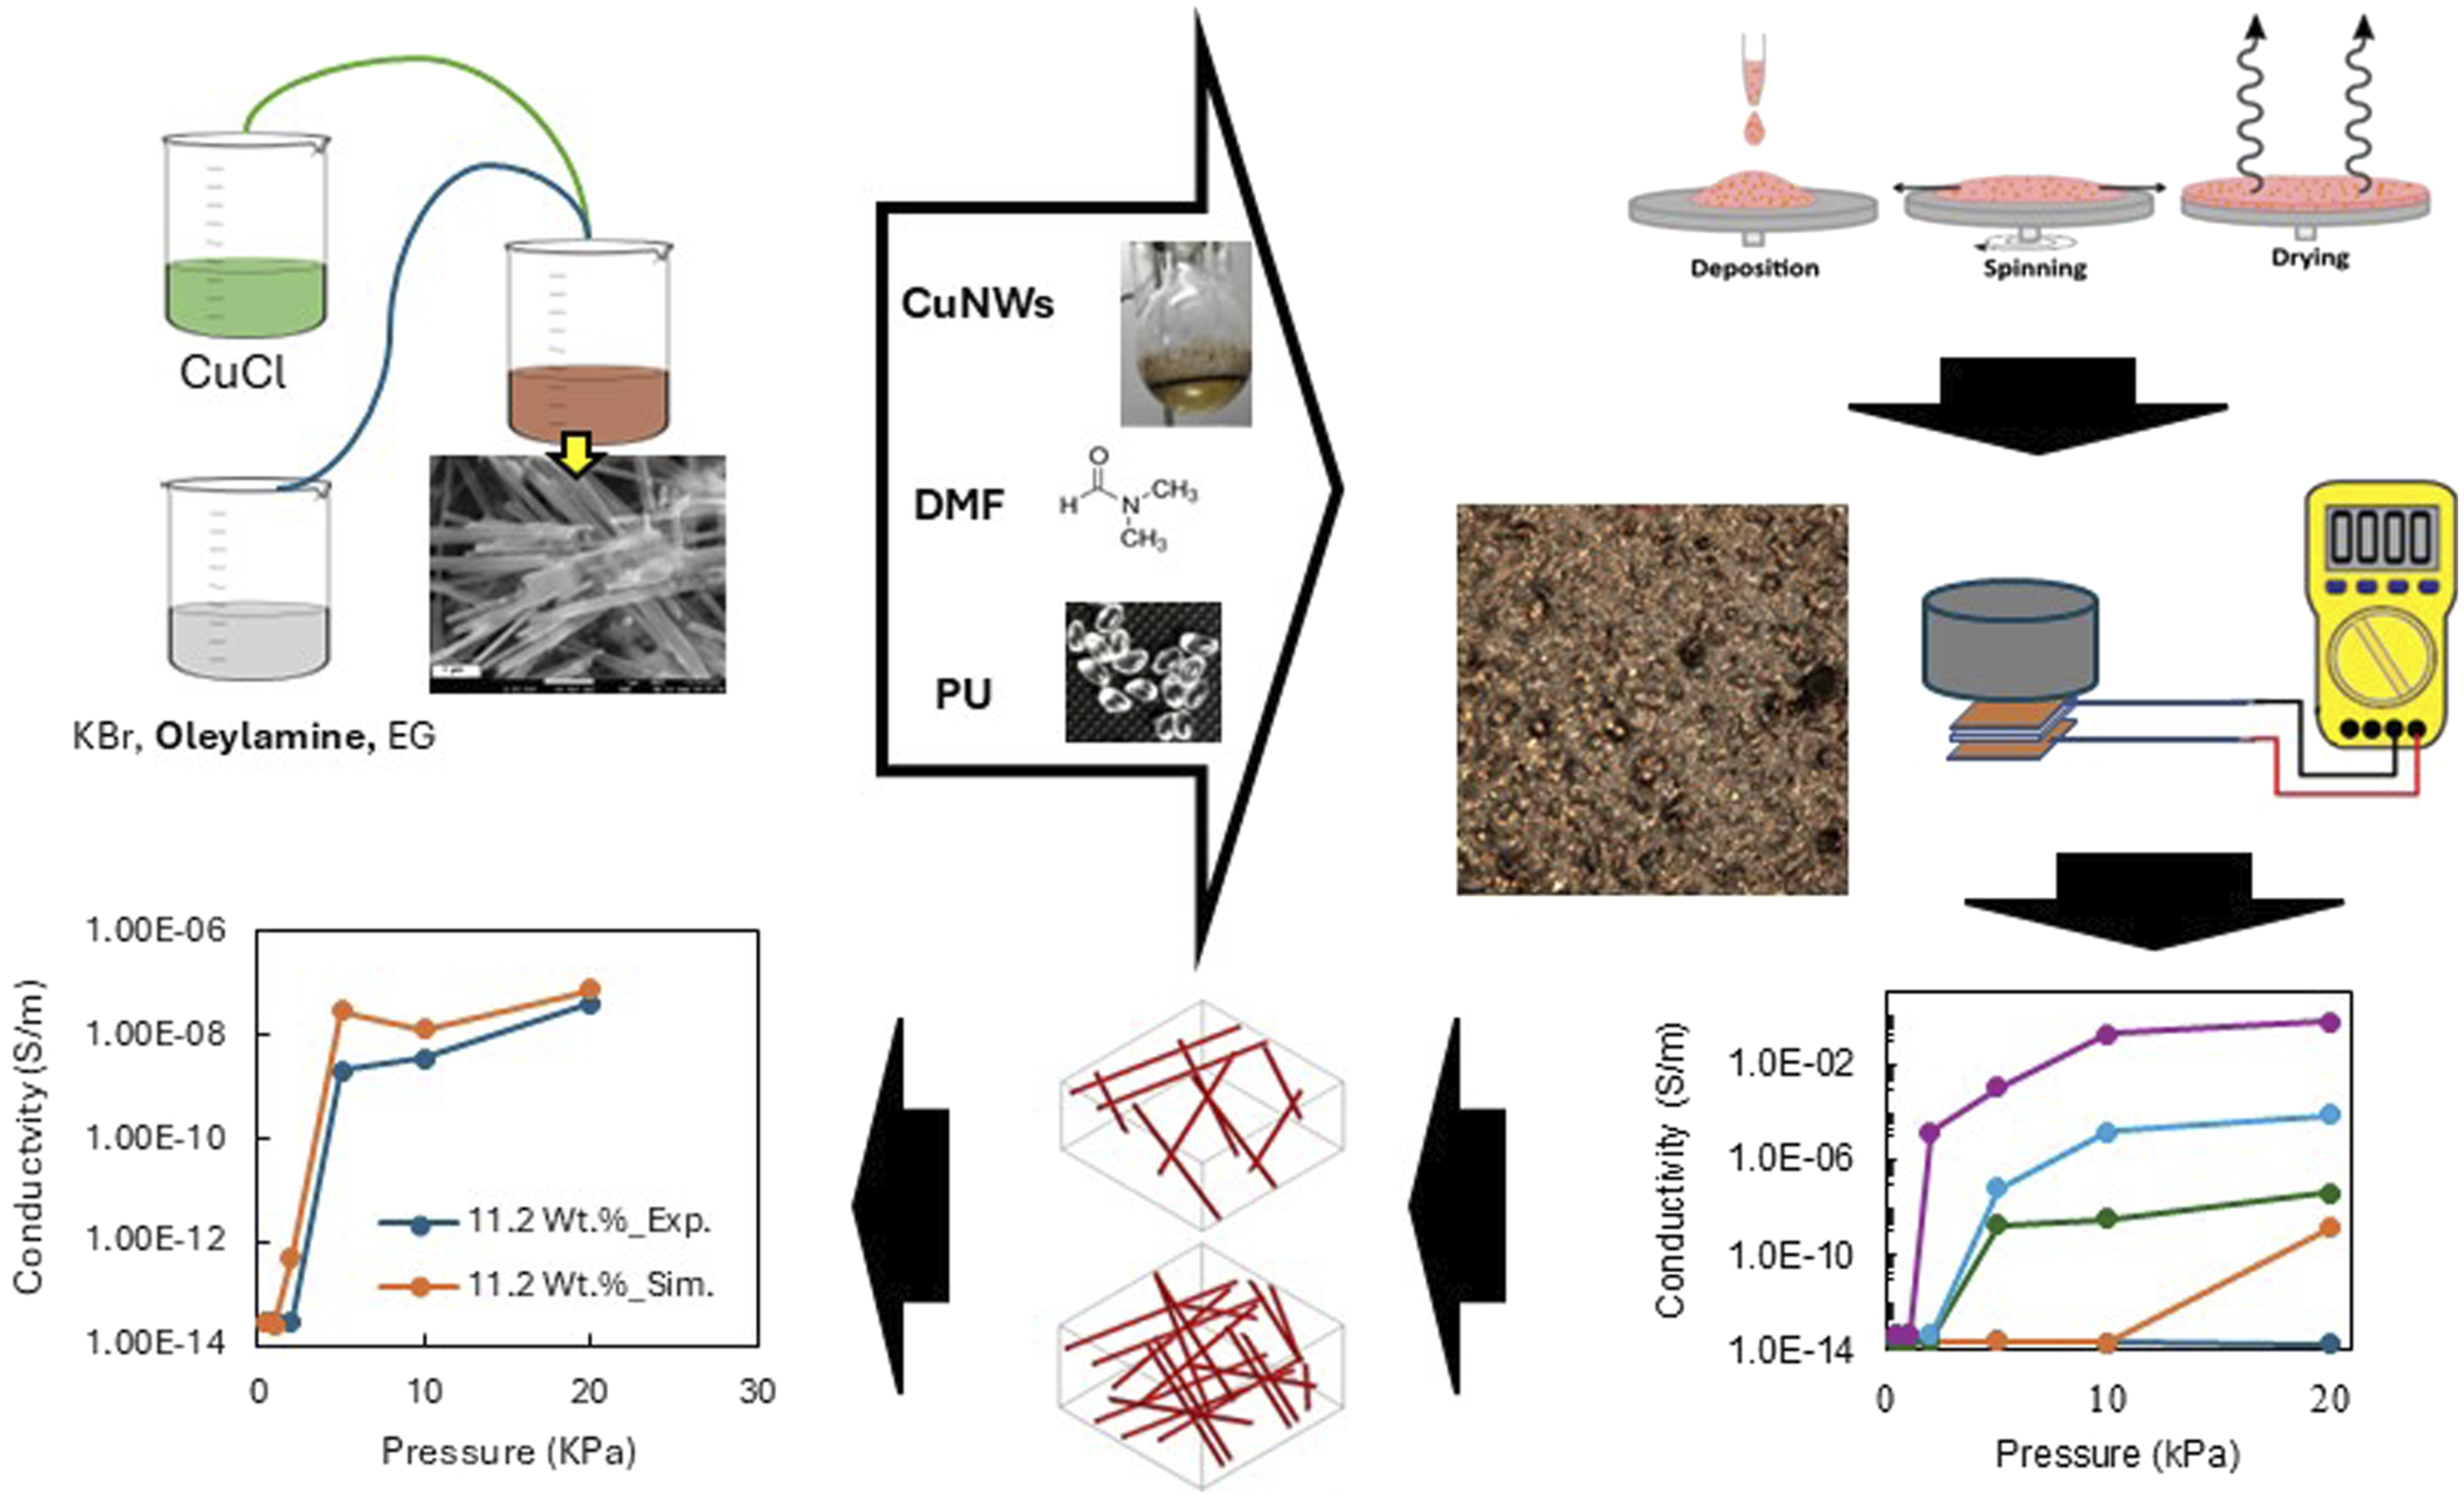
This work investigates the electrical behaviour under pressure of thin-film nanocomposites combined of synthesised copper nanowires (CuNWs) and thermoplastic polyurethane (PU) using experimental and numerical approaches. CuNWs (∼15 μm length, 70 nm diameter) were chemically synthesised. The scanning electron microscopy (SEM) analysis confirms their uniform and elongated structure of CuNWs, while energy-dispersive X-ray spectroscopy (EDS) and X-ray diffraction (XRD) indicate high copper purity. CuNWs were integrated into the PU matrix using a solution mixing approach, and the resulting mixture was spin-coated to form a thin film exhibiting uniform CuNW dispersion, as confirmed by optical microscopy. Nanocomposite films are prepared with CuNWs concentrations ranging from 3 wt% to 18.5 wt%, exhibiting thermal stability up to 290°C. The electrical conductivity of the thin films under controlled pressure was measured, revealing that the electrical conductivity increased with CuNW concentration, reaching a maximum value of 0.61 S/m for 18.5 wt% CuNW in the nanocomposite under a pressure of 20 kPa. The percolation threshold shifts significantly with pressure (from 15 wt% at 1 kPa to 3 wt% at 20 kPa), governed by pressure-induced percolation transition (PIPT). Finite element method (FEM) simulations capture the combined influence of nano-additive content, nanowire orientation, and pressure-induced densification on macroscopic conductivity.
Introduction
The demand for lightweight, flexible, and multifunctional conductive nanocomposites is increasing in electronics, aerospace, electromagnetic interference shielding (EMIS), automotive, energy storage and wearable technologies.1,2 Electrically conductive polymer nanocomposites (ECPCs), which integrate conductive fillers like metals or carbon-based materials with polymer matrices, are ideal candidates for these technologies since they offer a combination of electrical conductivity, mechanical flexibility, and reduced mass. 3 Among the polymers used to fabricate ECPCs, polyurethane (PU) is widely used as a matrix since it is flexible, durable, mechanically strong, and easy to process. Furthermore, PU is chemically compatible with various conductive materials that produce well-dispersed and homogeneous ECPCs. Polyurethane-based ECPCs that combine flexibility and enhanced conductivity are well-suited for applications in flexible electronics, wearable sensors, smart textiles 2 and electromagnetic interference shielding. 4
A range of conductive fillers is employed in ECPCs, including carbon-based fillers such as carbon nanotubes, and graphene; metal-based fillers such as copper or silver; and hybrid fillers that combine metals and carbon.5,6 One of the most used metal fillers is silver, due to its exceptionally high conductivity (σ = 6.30 × 10⁷ S·m−1), though it is expensive. As a more cost-effective alternative, copper offers comparable electrical performance (σ = 5.96 × 10⁷ S·m−1)7,8 and is relatively abundant compared to precious metals such as silver and gold.3,9 Copper exhibits good mechanical properties, such as good strength, malleability and ductility, that enhance the composite’s overall mechanical structural integrity 10 and also can be obtained in various forms, such as powders, flakes, and nanostructures.3,11–13 Among these, copper nanowires (CuNWs) stand out for their high aspect ratios (length/diameter ratio) that enable electron transfer pathways formation at minimal filler content. Several methods exist for synthesising CuNWs with precise control over nanowire length and diameter. The vapour-liquid-solid mechanism consists of depositing copper vapour onto a catalytic substrate.14,15 In electrochemical deposition, the nanowires are formed by adjusting the electric field and electrolyte composition. 16 In addition, template-based methods can also grow them within the pores of a template. 17 Finally, chemical reduction is a cost-effective, flexible method that can be easily implemented to synthesise CuNWs with varied sizes and shapes by using metal salts, reducing agents and surfactants.8,18
The ECPCs can be obtained by melt compounding, in situ polymerisation and solution mixing. Solution mixing involves dissolving both the polymer and conductive fillers, such as copper nanowires, in a solvent to achieve a homogeneous dispersion of fillers throughout the polymer matrix. Following mixing, the resulting dispersion can be followed by other techniques such as spin coating, casting or extrusion, depending on the intended final product. 19 Spin coating involves depositing the polymer dispersion containing conductive fillers onto a substrate and then spinning it at high speeds to achieve uniform thin films with precise thickness. The centrifugal force generated during spinning ensures an even distribution of the dispersion across the substrate. This combination of solution mixing and spin coating is particularly effective for producing high-quality, uniform films with well-controlled conductive properties for thin-film electronics such as robotic smart textiles and transparent electrodes.20–24 It has been the preferred technique for producing nanocomposite films, such as polyimide/fullerene nanocomposite films. 25
In the literature, the fabrication and characterisation of ECPCs based on CuNWs have been reported. Ravindren et al. used CuNWs with a diameter of 150 nm and a length of 5 µm, commercially available in Poly (ethylene-co-methyl acrylate)/Ethylene-octene copolymer (EMA/EOC) 50/50 wt% binary blend system. The composite was prepared using solution mixing techniques, and the concentration of copper varied from 1 to 15 wt%. The percolation threshold concentration was found to be 4.78 wt%. Beyond this threshold, the conductivity was about 102 S cm−1 26. Huang et al. incorporated chemically synthesised CuNWs with diameters around 45 nm and lengths exceeding 100 μm into poly (styrene-block-butadiene-block-styrene) (SBS) at various concentrations up to 50 wt% using the mixing solution method. Composite reported a conductivity of 1858 S cm−1 and a break elongation of 165 % for 50 wt% CuNWs so it can be printed on paper for flexible circuits. 27 Similarly, Lin et al. investigated polystyrene/copper nanowire composites, where CuNWs were synthesised via electro-deposition in an alumina template, and the composite was prepared using a solution mixing method. They found that the electrical percolation threshold of the nanocomposites is based on the scale of CuNWs production, occurring at concentrations between 0.50 and 1.00 vol% for small-scale synthesis and between 1.00 and 2.00 vol% for large-scale synthesis. 28 Subsequently, the same group found that polystyrene/CuNW composites can be effectively applied for EMI shielding. These composites achieved a percolation threshold at low concentration of CuNWs (0.67 vol% to 0.24 vol% CuNWs) with electrical conductivities of up to 104 S m-1 7,12,29. Higher aspect ratio of CuNWs forms electrical networks at lower loadings due to their ability to connect with fewer contacts. Flexible transparent electrodes have also been prepared using CuNWs. Cheng et al. employed a solvothermal method to synthesise CuNWs for fabricating stretchable electrodes. The preparation of the composite electrode involves two steps: first, prefabricating a CuNW film on a glass substrate, and second, transferring this film onto an elastic poly (acrylate) matrix through in situ photopolymerisation. The resulting flexible composite exhibits a typical sheet resistance of 220 Ω/sq with 91.5% transparency, making it suitable for applications in wearable optoelectronic devices. 13 Mayousse et al. also utilised hydrothermal synthesis to produce long CuNWs for composite integration with polyethylenenaphthalate (PEN) by applying pressure. The resulting composite demonstrated impressive electrical performance, achieving sheet resistances of 46 Ω/sq with 93% transparency. This high-performance material was applied in the development of flexible, transparent electrodes for capacitive touch sensors. 30 A transparent and stretchable composite electrode was fabricated by embedding CuNW into the surface layer of a polyurethane (PU) matrix, achieving low sheet resistance (<102 Ω/sq). 31 The transparency in those nanocomposite is maintained due to the very low filler content and possibly the homogeneous dispersion, as indicated in a review paper by Wildner and Drummer. 32 In addition to electrical applications, copper nanowires (CuNWs) and polyurethane foam have been integrated with paraffin wax to develop phase change materials exhibiting superior thermal conductivity and stability compared to pure wax.33,34
The electrical performance of CuNWs-based ECPCs relies on optimal CuNWs concentration and dispersion within the polymer matrix to reach the percolation threshold for effective electron transport. Other factors that enhance network connectivity include nanowire orientation, aspect ratio, sizes, length, electrical properties, quality, purity and surface treatment of the filler, the tunnelling distance, filler waviness, the interaction between the matrix and the filler, etc. 35 Understanding the effect of these factors is crucial to optimise ECPC electrical properties.12,13 Several numerical models have been used to understand the effect of these parameters on the electrical conductivity in composites.36,37 Among them, the Finite Element (FE) method in combination with the representative volume element (RVE) is particularly effective in predicting electrical properties. Tamayo-Vegas demonstrated that the RVE-FE model can be used to study the effects of concentration and agglomeration on the electrical conductivity of epoxy composites reinforced with multi-walled carbon nanotubes.38,39 In our previous work, we investigated the effects of concentration and agglomeration on the electrical conductivity of polyurethane composites embedded with micro-silver and micro-copper particles.11,19 Building on that, we also employed FE-RVE simulations to predict the electrical behaviour of polyurethane composites containing nano-silver particles and to examine the impact of impurities on the conductivity of these composites. 40 Using electrical conductivity data obtained from a carbon-fabric-reinforced polyetherketoneketone (C/PEKK) composite, FE analysis was employed to predict temperature profiles in induction heating simulations. 41 The thermal conductivity of polymer composites, such as tin-filled high-density polyethylene (HDPE) with varying filler concentrations, was evaluated using the commercial software ANSYS. 42 Numerical models were also developed to investigate the mechanical properties of thermoplastic composites.43–45 These examples demonstrate that the FE method is a powerful and versatile tool for predicting the electrical, thermal, and mechanical properties of composite materials.
As evident from the literature, the electrical behaviour of polyurethane thin-film composites with embedded CuNWs fabricated via spin-coating remains unexplored, despite their potential applications in flexible and wearable electronics 46 as well as transparent electrodes. 23 Moreover, optimizing the electrical properties of polyurethane thin-film composites requires a fundamental understanding of the effects of CuNW concentration and orientation. RVE-FE approaches provide a powerful framework for investigating these effects. However, to our knowledge, no studies in the literature have applied the FE methodology to investigate the electrical behaviour of CuNWs embedded in PU as a thermoplastic.
The present work addresses these gaps by fabricating novel PU–CuNW thin films and evaluating their electrical conductivity through both experimental measurements and simulation analyses, highlighting their potential for device applications. CuNWs were chemically synthesized, and their structure was characterized by XRD and SEM. The CuNWs were dispersed in polyurethane using the solution mixing method followed by spin-coating, resulting in CuNW-PU thin films. The electrical conductivity was then measured at different concentrations under pressure, demonstrating that conductivity increases with concentration while the percolation threshold decreases with pressure. Furthermore, FE-RVE simulations were applied for the first time to study the effects of nanowire concentration and orientation on electrical conductivity. 47
Materials and Methods
Materials
Copper(I) chloride (CuCl, ≥99%, Sigma-Aldrich) was used as copper source; potassium bromide (KBr, ACS reagent, ≥99.0%, Sigma-Aldrich) served as a stabilising agent; 2-propanol (ACS reagent, ≥99.5%, Sigma-Aldrich) and hexane (≥98%, GC, LiChrosolv®, Supelco) were utilised as solvents. Oleylamine (Sigma-Aldrich, ≥98%) was used as a capping agent. Ethylene glycol (EG, anhydrous, 99.8%, Sigma-Aldrich) was employed as a reducing agent. Thermoplastic polyurethane pellets, identified by the trademark Elastollan® 1180 A 10,000, were supplied by BASF plc, UK. N, N-Dimethylformamide (DMF, anhydrous, >99.8% purity) was sourced from Merck, UK. In this research, all chemicals were used without further purification.
Cu Nanowires Synthesis
In this study, the synthesis of CuNWs was carried out using the method outlined by Yin et al.
18
In a standard synthesis procedure, copper(I) chloride (CuCl, 2 mmol), potassium bromide (KBr, 2 mmol), and oleylamine (6 mmol) were dissolved in ethylene glycol (EG, 30 mL) within a 100 mL round-bottom flask, forming a Cu-amine complex. The mixture was stirred magnetically for 10 minutes, after which the temperature was gradually increased to 110°C to degas the solution and improve its purity. This temperature was maintained for 30 minutes. Subsequently, the reaction temperature was elevated to 198°C at a heating rate of 9°C/min, and the mixture was refluxed for 1 hour. Upon completion of the copper nanowire synthesis, the reaction products were rapidly quenched by the addition of cold water. The resulting CuNWs were washed with hexane and subjected to centrifugation at 10,000 r/min for 3 minutes; the process was repeated three times. Finally, the nanowires were re-dispersed and stored in n-hexane. The entire synthetic process was conducted under ambient pressure, without the use of an inert or protective atmosphere. Images of different steps of this synthesis are shown in Figure 1. Laboratory preparation images of CuNWs synthesis, (a) mixing the precursors, (b) formation of blue Cu-amine complex, (c) finishing the synthesis and quenching, (d) after cooling and centrifugation, and (e) keeping in hexane.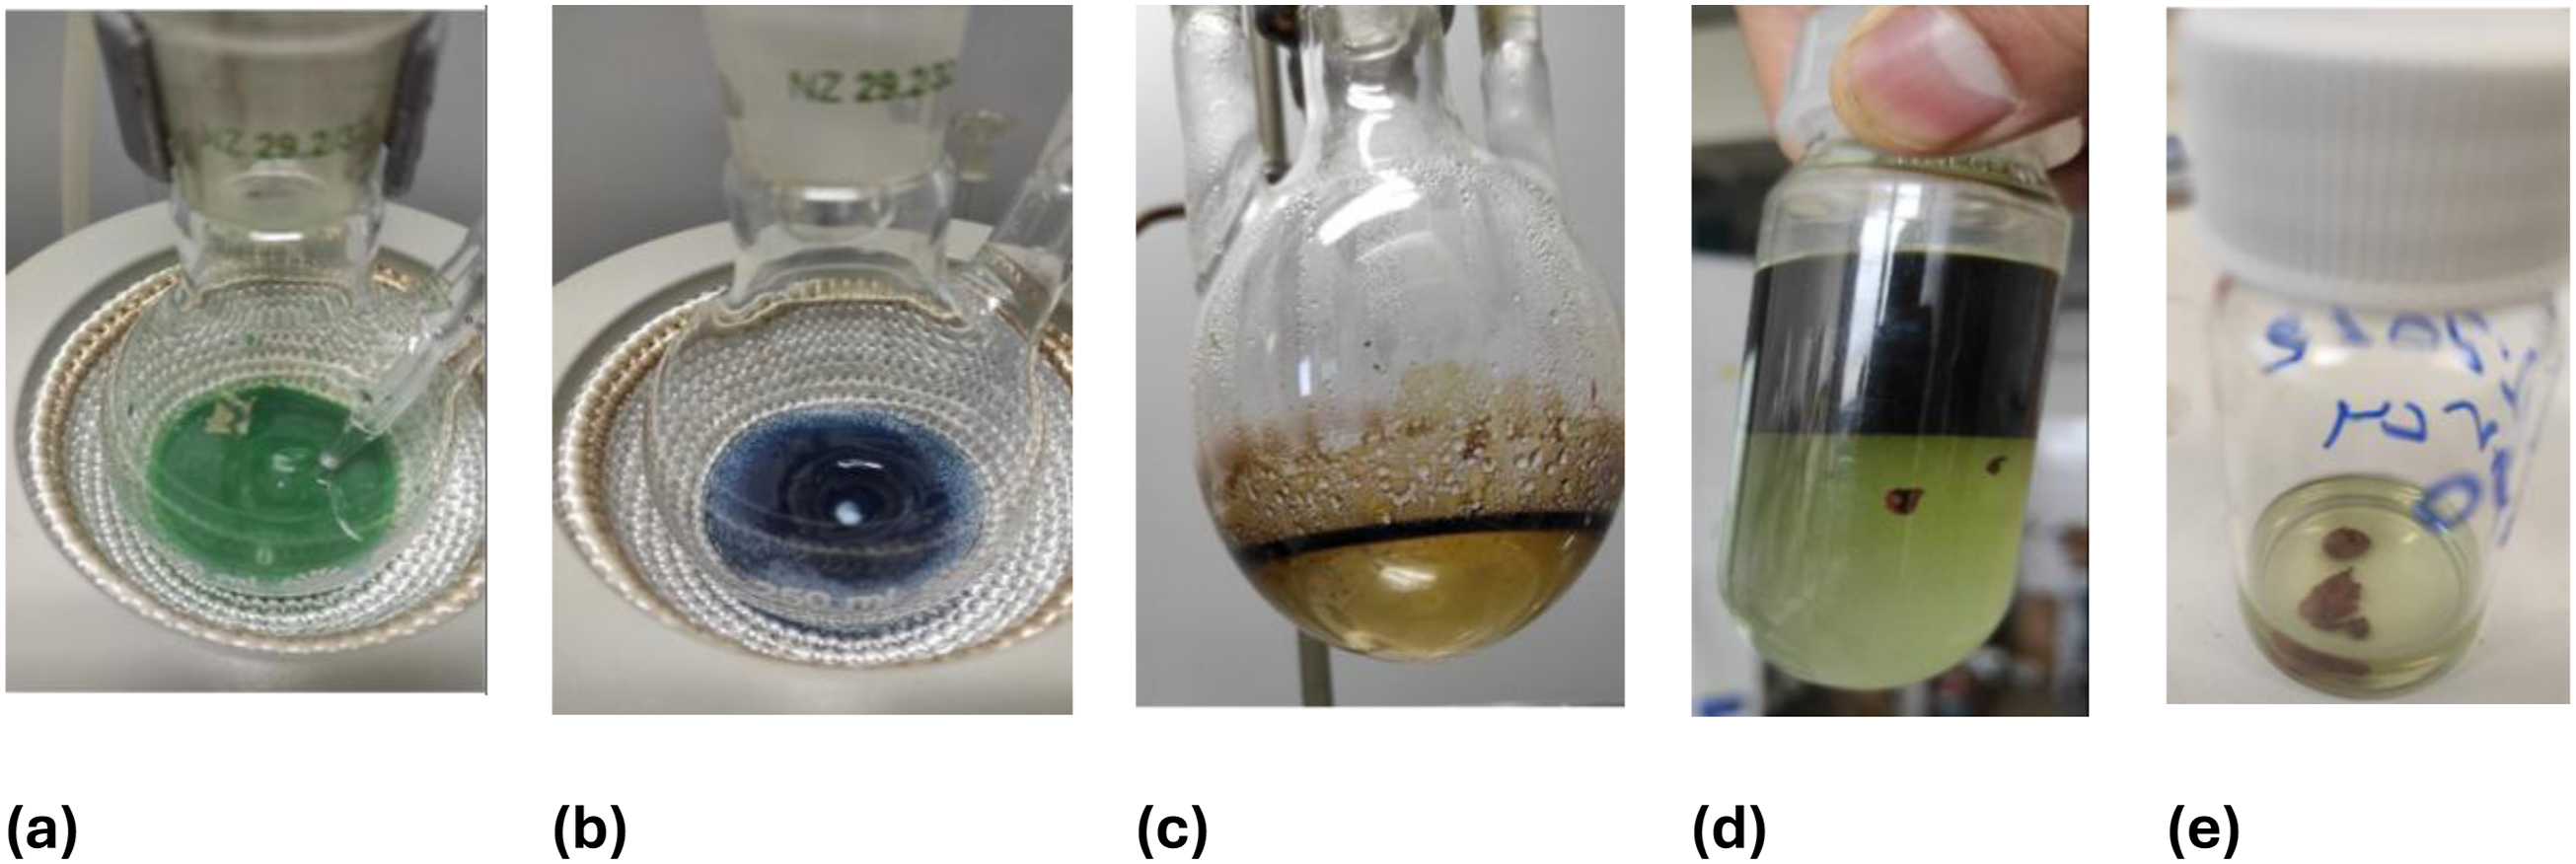
Composite Fabrication
CuNWs-PU composites were fabricated using a solution mixing technique, followed by spin coating.11,19 The initial step involved dissolving 10 g of PU pellets in about 60 mL of dimethylformamide (DMF) to form a solution with a 15 wt% concentration of PU. This dissolution process occurred under continuous stirring at 65°C for approximately 4 hours. Once the PU solution reached uniform consistency, it was stored in a sealed container for further use as a matrix. In the subsequent step, synthesised CuNWs, which were stored in hexane to prevent oxidation, were prepared for dispersion. After centrifuging to remove the hexane, a certain amount of CuNWs was added to 4 mL of DMF and sonicated for 20 minutes to ensure thorough dispersion and reduce aggregation of nanowires. The defined amount of dispersed CuNWs was then incorporated into the prepared PU solution, which was stirred at 400 r/min and 70°C to remove excess DMF for about 10 minutes, yielding a mixture with optimal viscosity for spin coating. For the spin coating process, 0.4 mL of the CuNWs-PU dispersion was pipetted onto a PTFE base and manually spread using a rounded glass rod. The dispersion was then spun at 1200 r/min for 15 seconds. After spin coating, the sample was left under a fume hood to dry for 24 hours. A total of 6 composites were prepared, with CuNWs concentrations ranging from 3 to 18.5 wt%.
Material Characterisation
An Alicona® InfiniteFocus
The size and morphology of the synthesised CuNWs were analysed using a JEOL JSM-7610F
The method employed to measure
Mathematical Approach for the Finite Element (FE) Simulation Model
Homogenisation of a Representative Volume Element (RVE) provides a rigorous bridge between microscale fields (e.g., current density J and electric field E) and their effective macroscopic counterparts. In composites with two distinct phases—matrix and inclusions (filler)—volume averaging yields the overall conductivity tensor, directional conductivities, and scalar effective conductivity. This section details the underlying mathematics, drawing on classical theories of continuum micromechanics48–50 used in this work to simulate the CuNWs-PU films.
Governing Equations and Volume Averaging
Considering a heterogeneous RVE domain

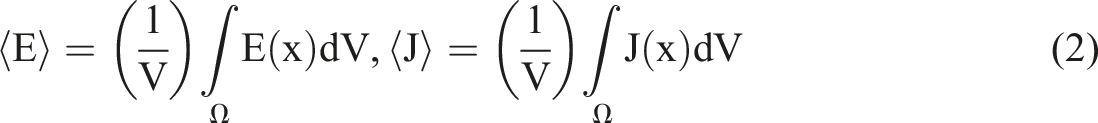
A Python code has been developed to read Abaqus® field outputs for the electrical current-density components (ECD) and electrical potential gradient (EPG) and then computes volume-weighted sums following equation (2).
By definition, the macroscopic conductivity tensor
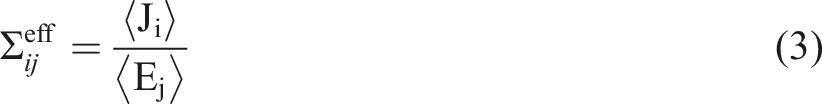
Provided each
Numerical Implementation
Figure 2 illustrates the steps followed for the numerical simulation. The process begins with the input of material data, which is then used to generate an RVE using Digimat®. This RVE is analysed by running a finite element (FE) simulation using Abaqus®. The results from the simulation are processed using a custom Python script to extract the effective material properties. These computed properties are then validated against experimental results. If the validation is unsuccessful, the loop returns to the RVE generation step for adjustments and re-analysis. Flow chart for numerical implementation.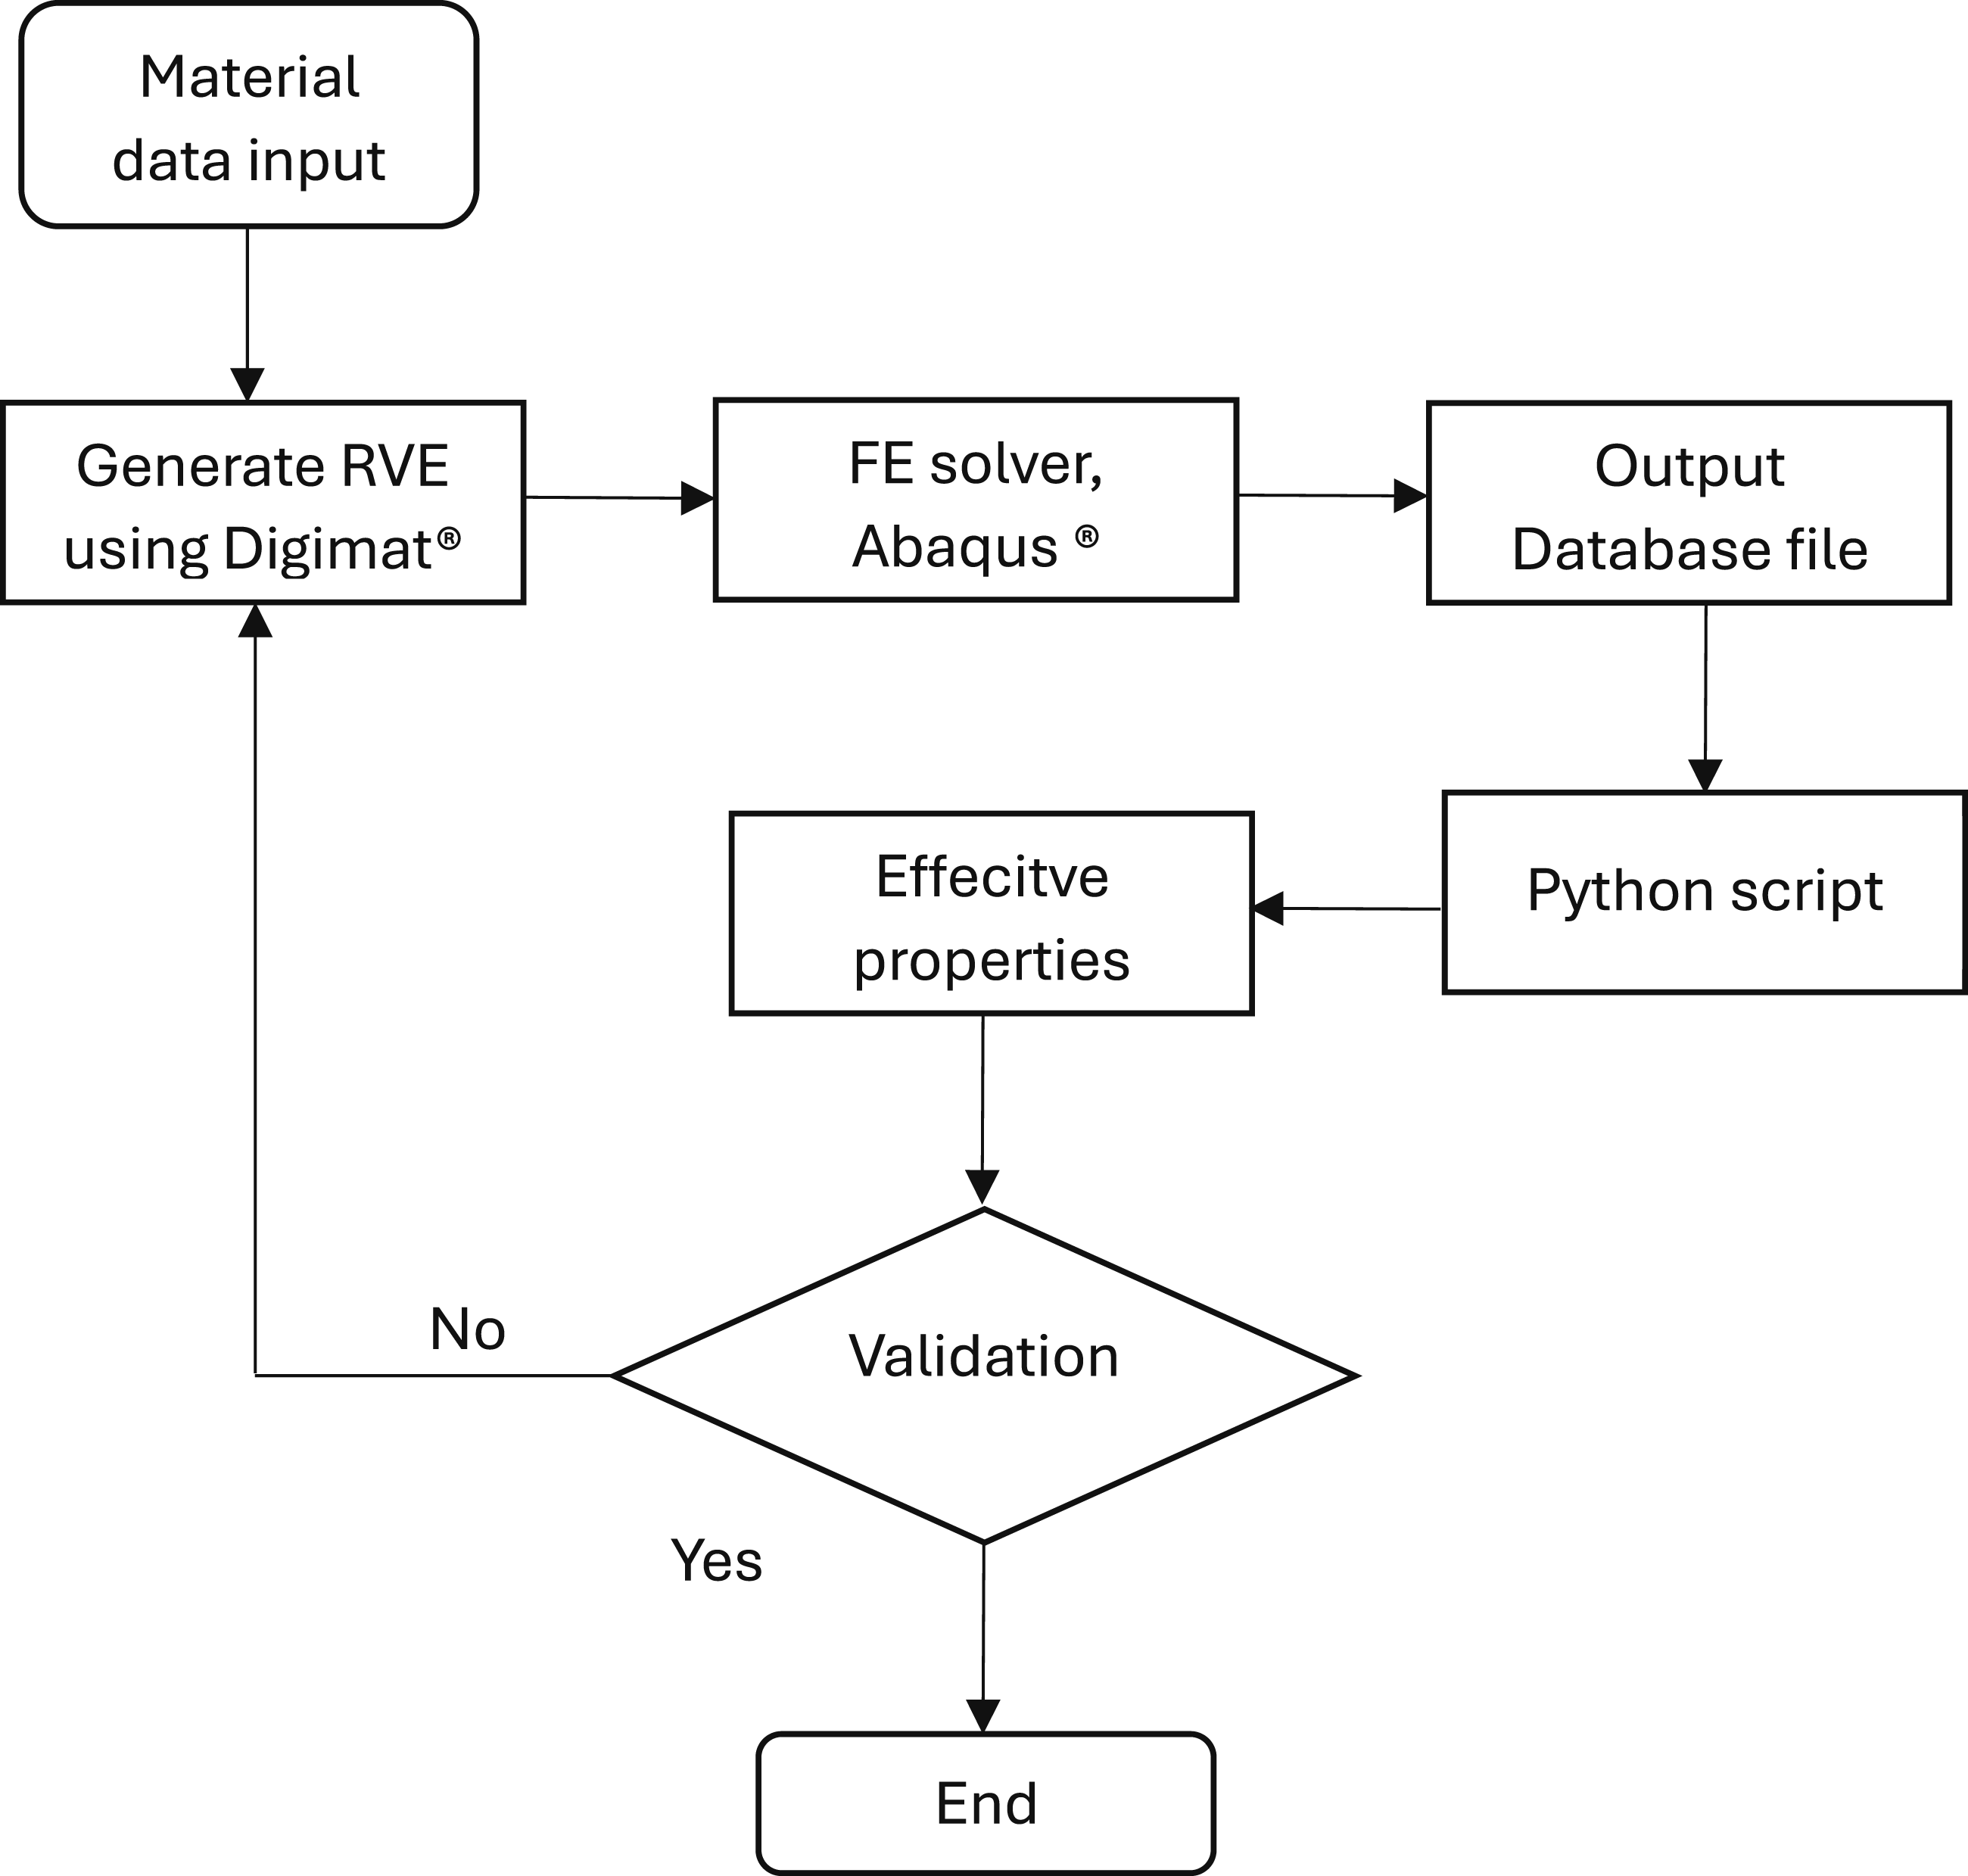
In Abaqus, local fields (1) Loops over matrix and inclusion sets. (2) Accumulates (3) Computes (4) Builds conductivity tensors and effective conductivities.
Abaqus solver was selected as the finite element solver due to its ability to handle very low electrical conductivity values, down to 10−14 S/m. This was essential for accurately modelling the insulating behaviour of the polymer matrix. In contrast, the Digimat® solver imposes a lower bound of approximately 10−9 S/m, which would artificially overestimate the matrix conductivity and compromise the realism of the simulation results. Hence, Abaqus provides the necessary flexibility for capturing the true electrical contrast between the conductive inclusions and the insulating matrix.
Results and Discussion
Copper Nanowires Evaluation
The reaction mechanism proceeds as follows: CuCl reacts with oleylamine in ethylene glycol (EG), forming a blue Cu-amine complex. At elevated temperatures (around 180°C), EG reduces these Cu-amine complexes.18,52 Typically, the surface energy hierarchy of face-centred cubic metals follows the order {110} > {100} > {111}.
53
When the {111} plane, having the lowest surface energy, dominates the crystal surface, decahedral-shaped copper seeds form.
54
Concurrently, bromide ions selectively cap the {100} plane during the Cu seed growth, stabilising its surface energy. As the seed growth rate and the molar ratio of capping molecules reach an optimal balance, the copper seeds begin to expose the {100} plane, stabilising further by capping agents, and grow along the {110} direction.
55
The synthesis conditions and mechanisms described above resulted in the successful production of uniform CuNWs with an average length of approximately 15 μm and a diameter of 70 nm, as shown in SEM images of Figure 3. (a) SEM image of the synthesised CuNWs, and (b) details of the selected area of image (a).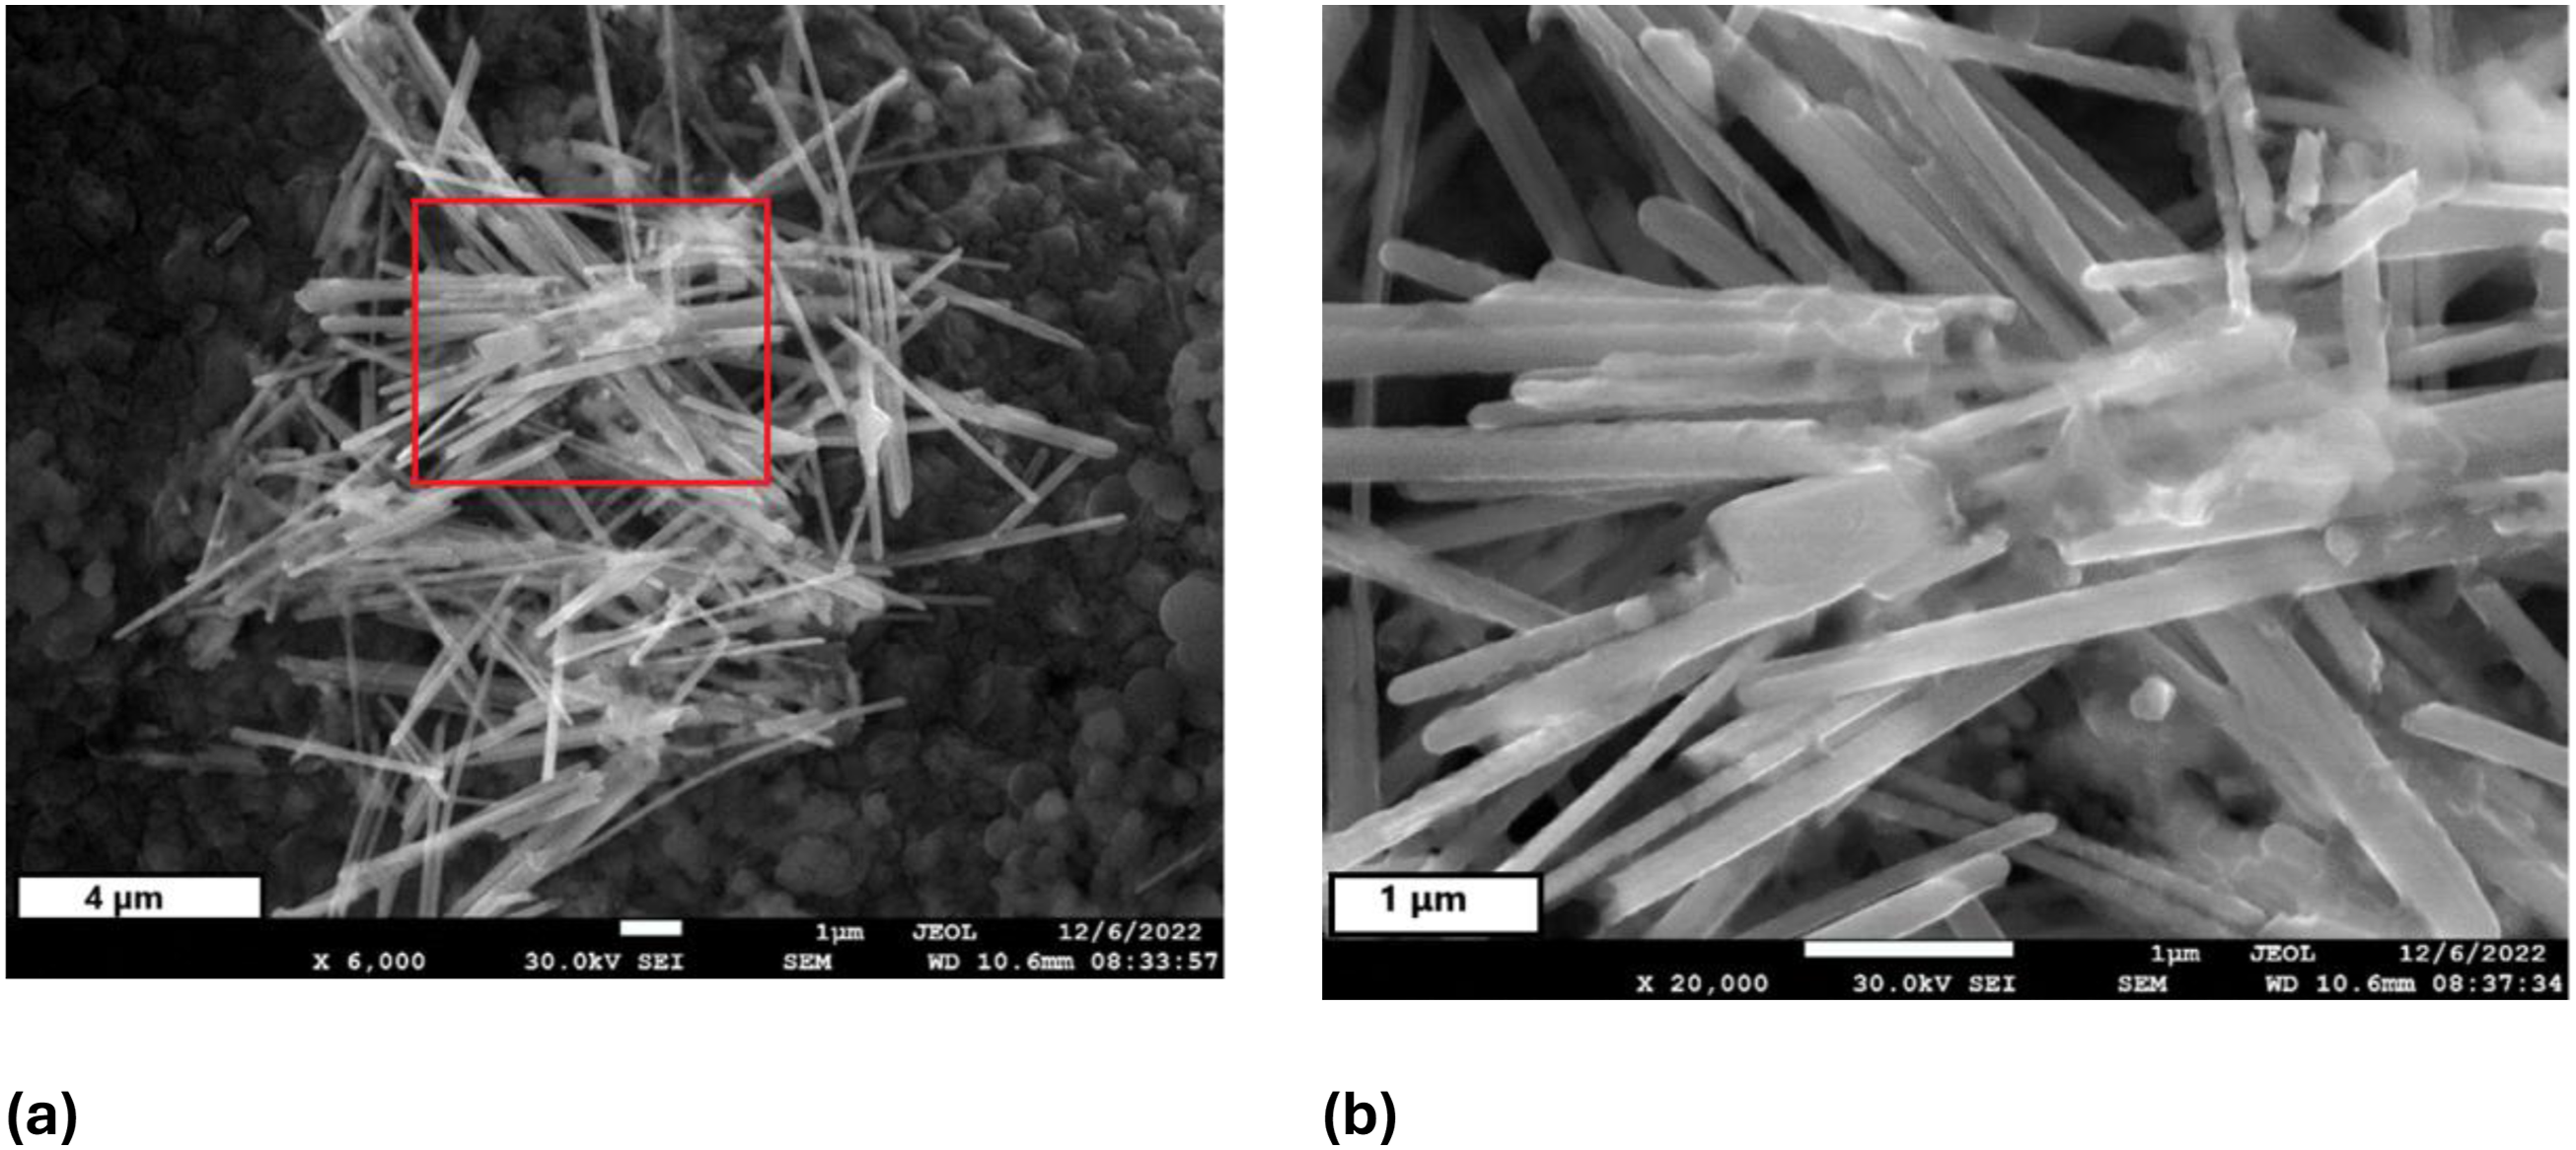
Figure 4 presents a detailed characterisation of the synthesised CuNWs using SEM and EDS. Panels (a), (b), and (d) show representative electron micrographs of the nanowires, illustrating their smooth surfaces, uniform morphology and no significant structural defects. Panel (c) displays the EDS point analysis, which was used to assess the elemental composition at a selected location on a single nanowire. Due to the known tendency of EDS to overestimate the presence of low atomic number elements and the associated high sigma value, carbon was excluded from the quantitative analysis to ensure more accurate interpretation. The resulting spectrum confirmed the predominant presence of high-purity copper, with only minor signals from bromide or oxygen, likely residues from the synthesis process or surface contaminants, demonstrating the precision and selectivity of the synthesis method. Additionally, the elemental mapping shown in panel (e) provides spatial distribution data that supports the compositional uniformity of the nanowires. The mapping confirms that copper is homogeneously distributed along the entire length of the nanowires, which aligns with the expectations for monoelemental CuNW systems and further validates the effectiveness of the synthesis protocol. These findings align as well with previous reports where oleylamine, employed as a capping agent, effectively stabilised the nanowires and prevented oxidation and agglomeration during synthesis.56,57 It was reported by Yin et al.
18
that synthesised CuNWs exhibit strong oxidation resistance when prepared in ethylene glycol solution at high temperatures, such as 198°C. The effective binding of capping molecules to the CuNW surface during this process reduces surface energy, stabilising the nanowires and preventing oxidation. Electron micrographs of CuNWs (a), (b), (d) and energy dispersive X-ray spectroscopy results – (c) point analysis and elemental mapping (e) confirming elemental composition of nanowires. In spectrum (c) carbon was eliminated from the calculation due to the overestimation of elements with lower atomic numbers and high sigma value.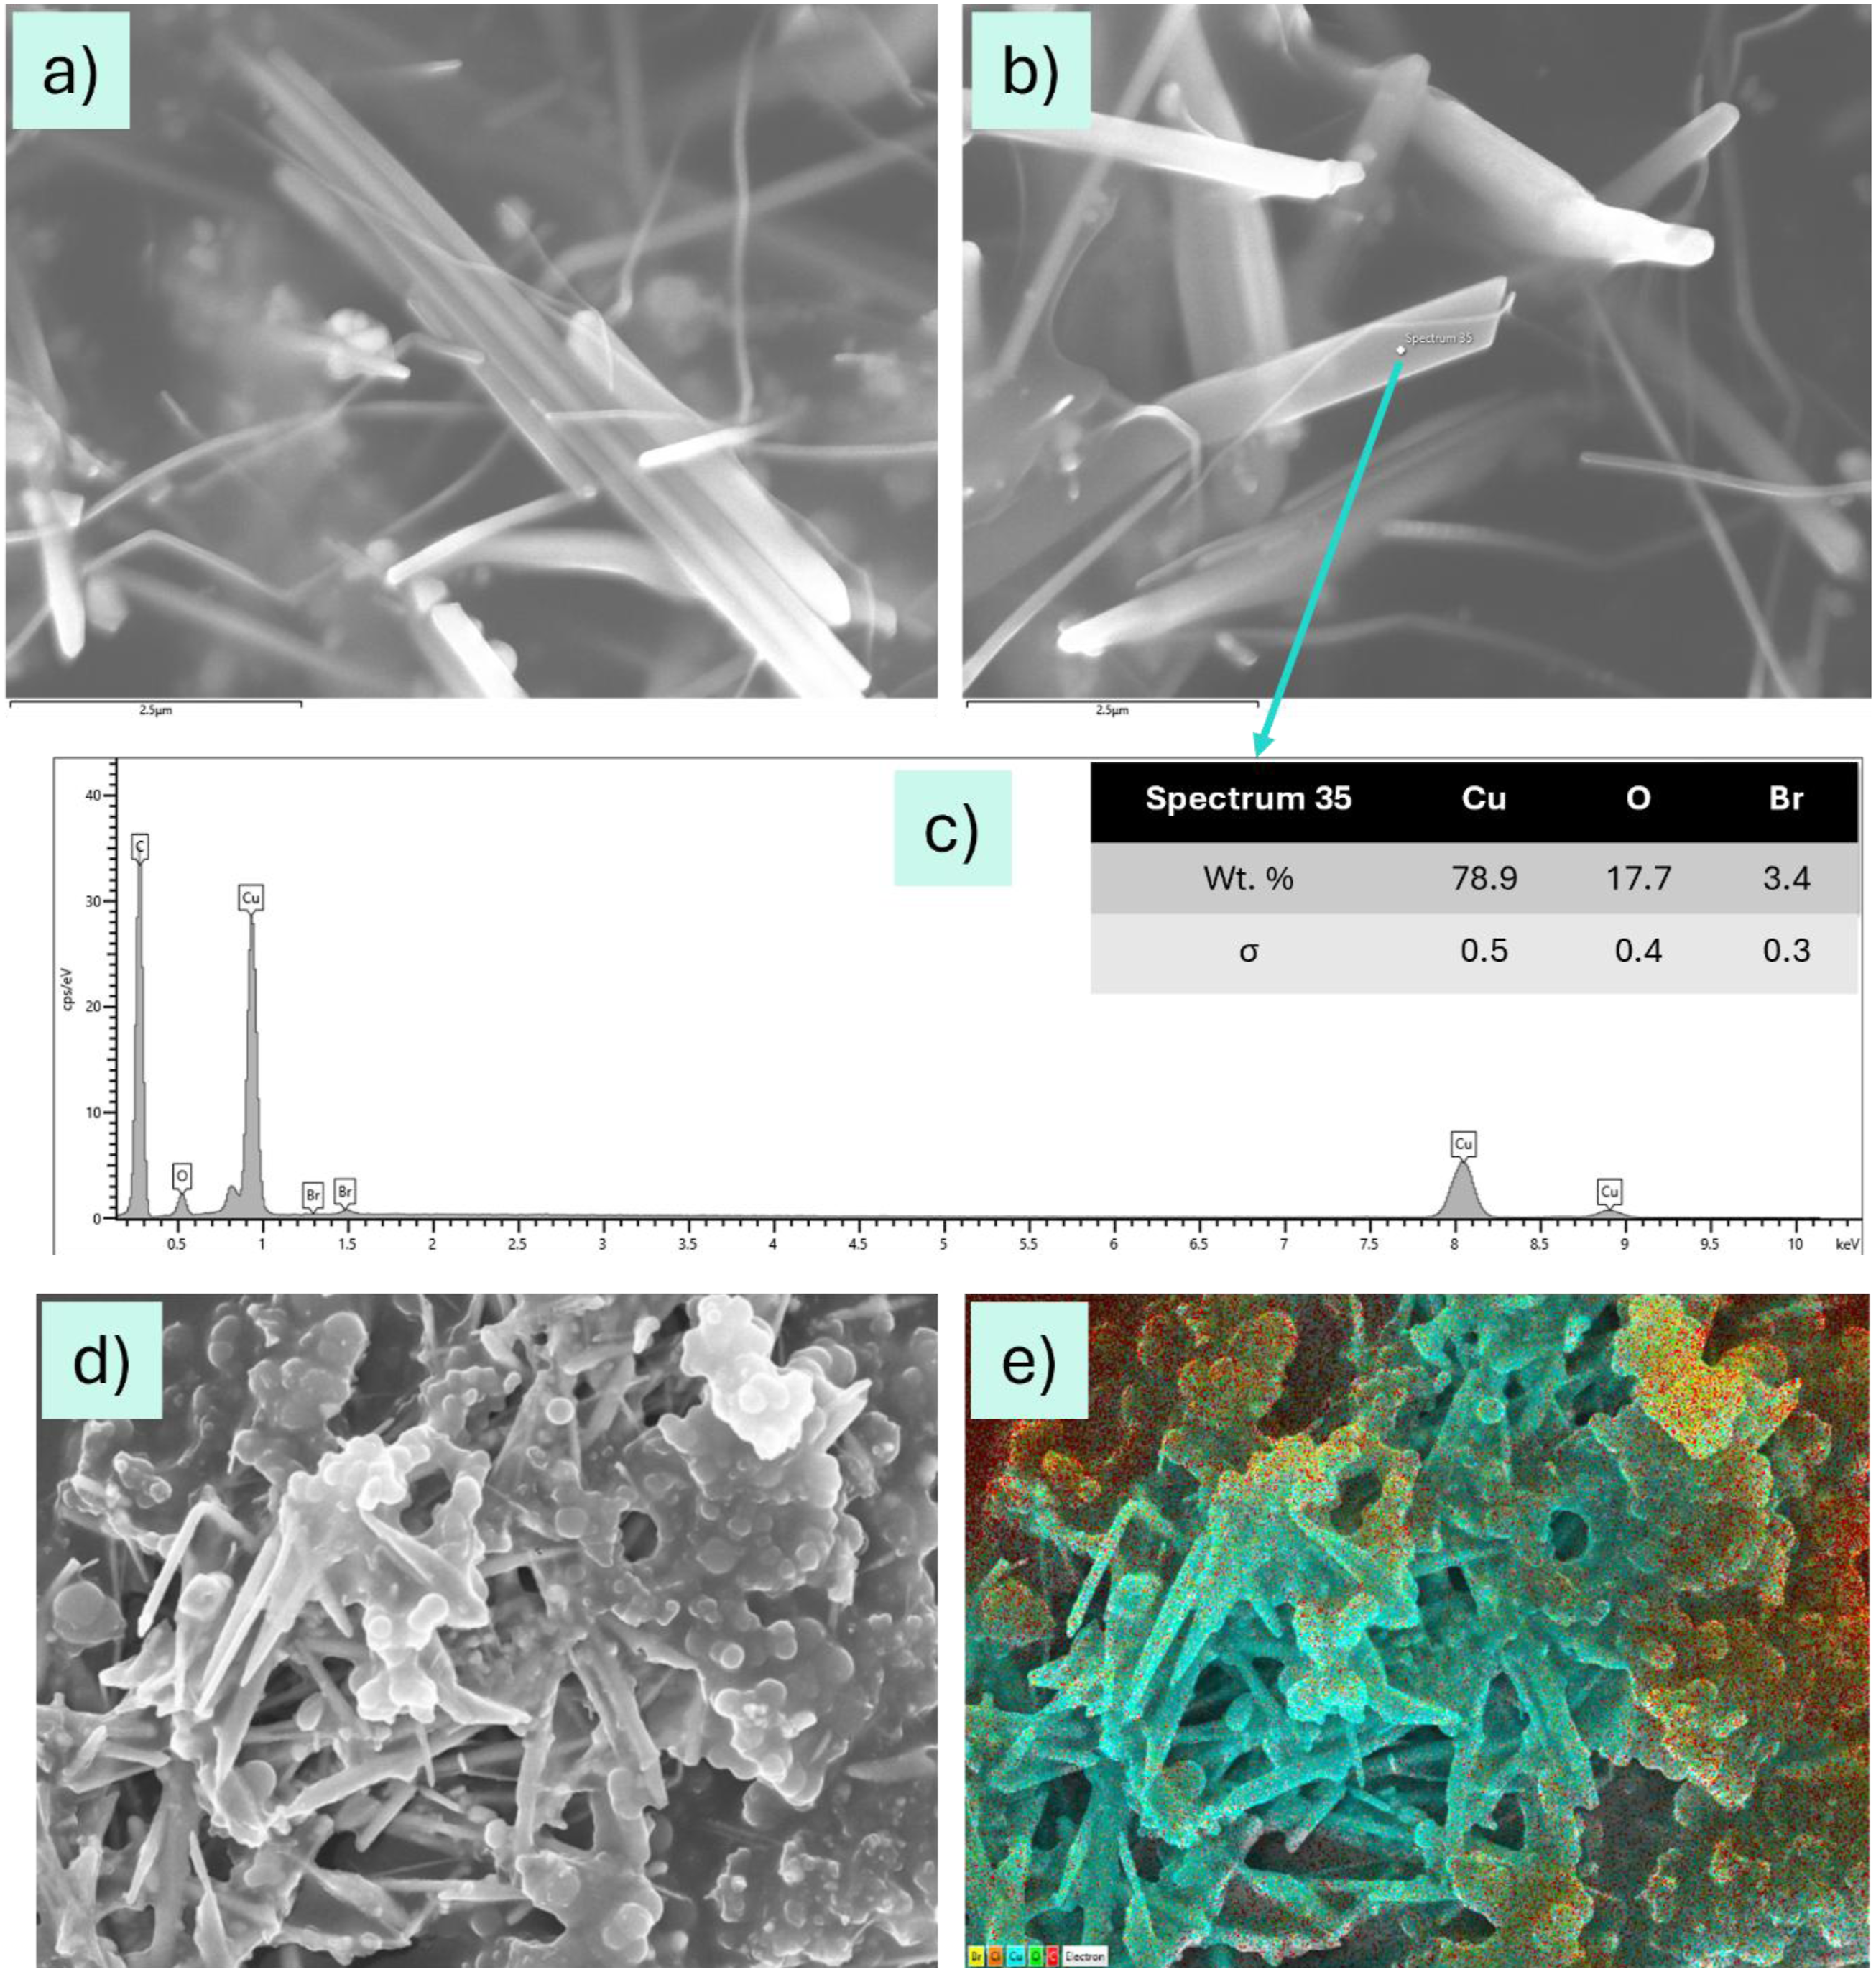
As shown in Figure 5, XRD analysis confirms the presence of a pure Cu - face-centered cubic (fcc) phase in the sample, as indicated by the match with PDF 01-071-4610. The relatively high crystallinity of the sample is evident from the absence of significant broadening in the Cu (111) peak. The observed peaks at approximately 43°, 51°, and 74° are indexed to the (111), (200), and (220) crystallographic planes of Cu, respectively. The absence of additional peaks confirms that no impurities or secondary phases such as copper oxides (CuO, Cu2O) are present in the sample. The result correlates with SEM/EDS findings. XRD pattern of as-synthesized Cu nanowires in the range of 20–75° 2θ. Peaks are labeled with the corresponding interlayer distances of the diffracting planes.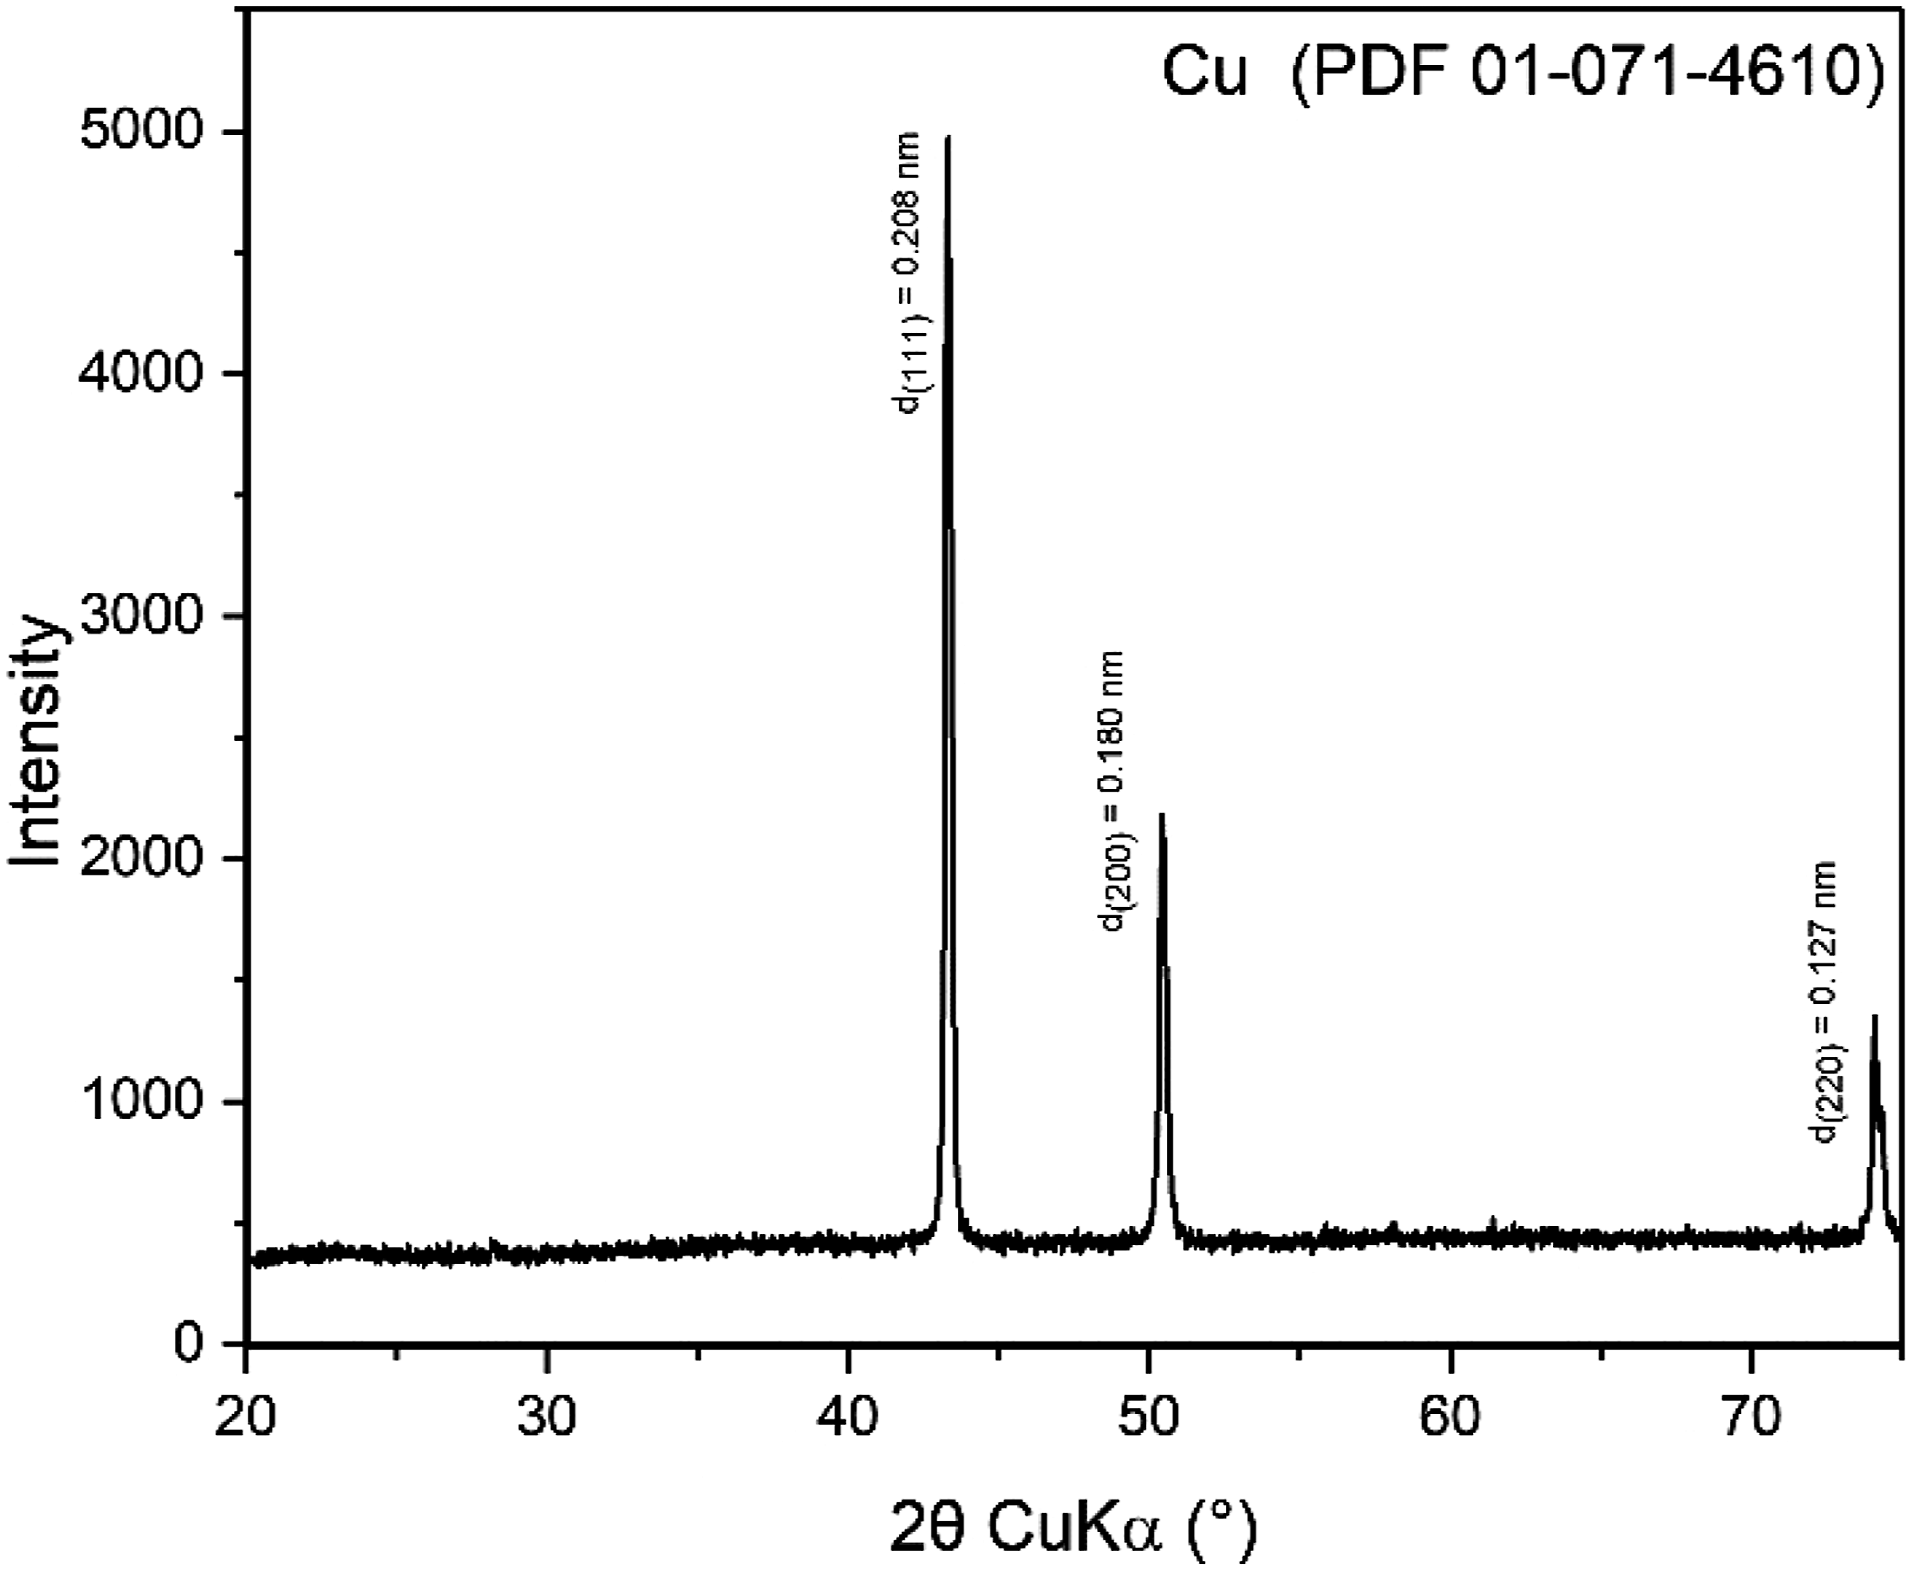
Copper Nanowire–polyurethane Nanocomposite
The CuNWs-PU composites were fabricated with various CuNWs concentrations. The concentration of fillers within the composites and thermal stability were measured using TGA. Figure 6 shows the TGA results, and they revealed significant mass losses mainly due to the decomposition of the PU. A significant weight loss stage was observed in the first derivative curve (Figure 6(b)) between 290°C and 490°C, corresponding to the degradation of PU.
58
In more detail, thermal degradation of PU exhibits two primary mass loss events at 290-390°C and 390-490°C, corresponding to different decomposition mechanisms (see in Figure 6(b)). The lower temperature range may be associated with dissociation of urethane chains into isocyanates and alcohols (-R-NH-CO-O-R'→-R-NCO + HO-R'), whereas the higher temperature range might involve decomposition into secondary amines and carbon dioxide (-R-NH-CO-O-R'→-R-NH-R'+CO2).
59
Additionally, it was noted that the intensity of the peaks decreased as the PU concentration decreased in the nanocomposite. For all the nanocomposites studied, a residual mass was observed after approximately 490°C, corresponding to the CuNWs content in the nanocomposite, ranging from 3 to 18.5 wt%, as shown in Table 1. After 500°C, no weight loss was observed for the CuNWs-PU composite. The results confirm that the nanocomposite exhibits thermal stability up to approximately 290°C, significantly exceeding the temperature range encountered in typical wearable and flexible electronic applications (40–60°C).
46
This high thermal tolerance ensures reliability even under localized heating conditions, such as in processors or power circuits, where temperatures may rise to 80–120°C. (a) Thermal gravimetric analysis (TGA) and (b) the first derivative of TGA curves for CuNWs-PU composite films with a concentration of CuNWs: 3.0 wt % (purple), 6.3 wt% (blue), 11.2 wt% (green), 15 wt% (orange) and 18.4 wt% (dark blue). The concentration of CuNWs in CuNWs-PU composite films obtained by TGA. Percent of mass fraction (wt.%) and volume fraction (vol%).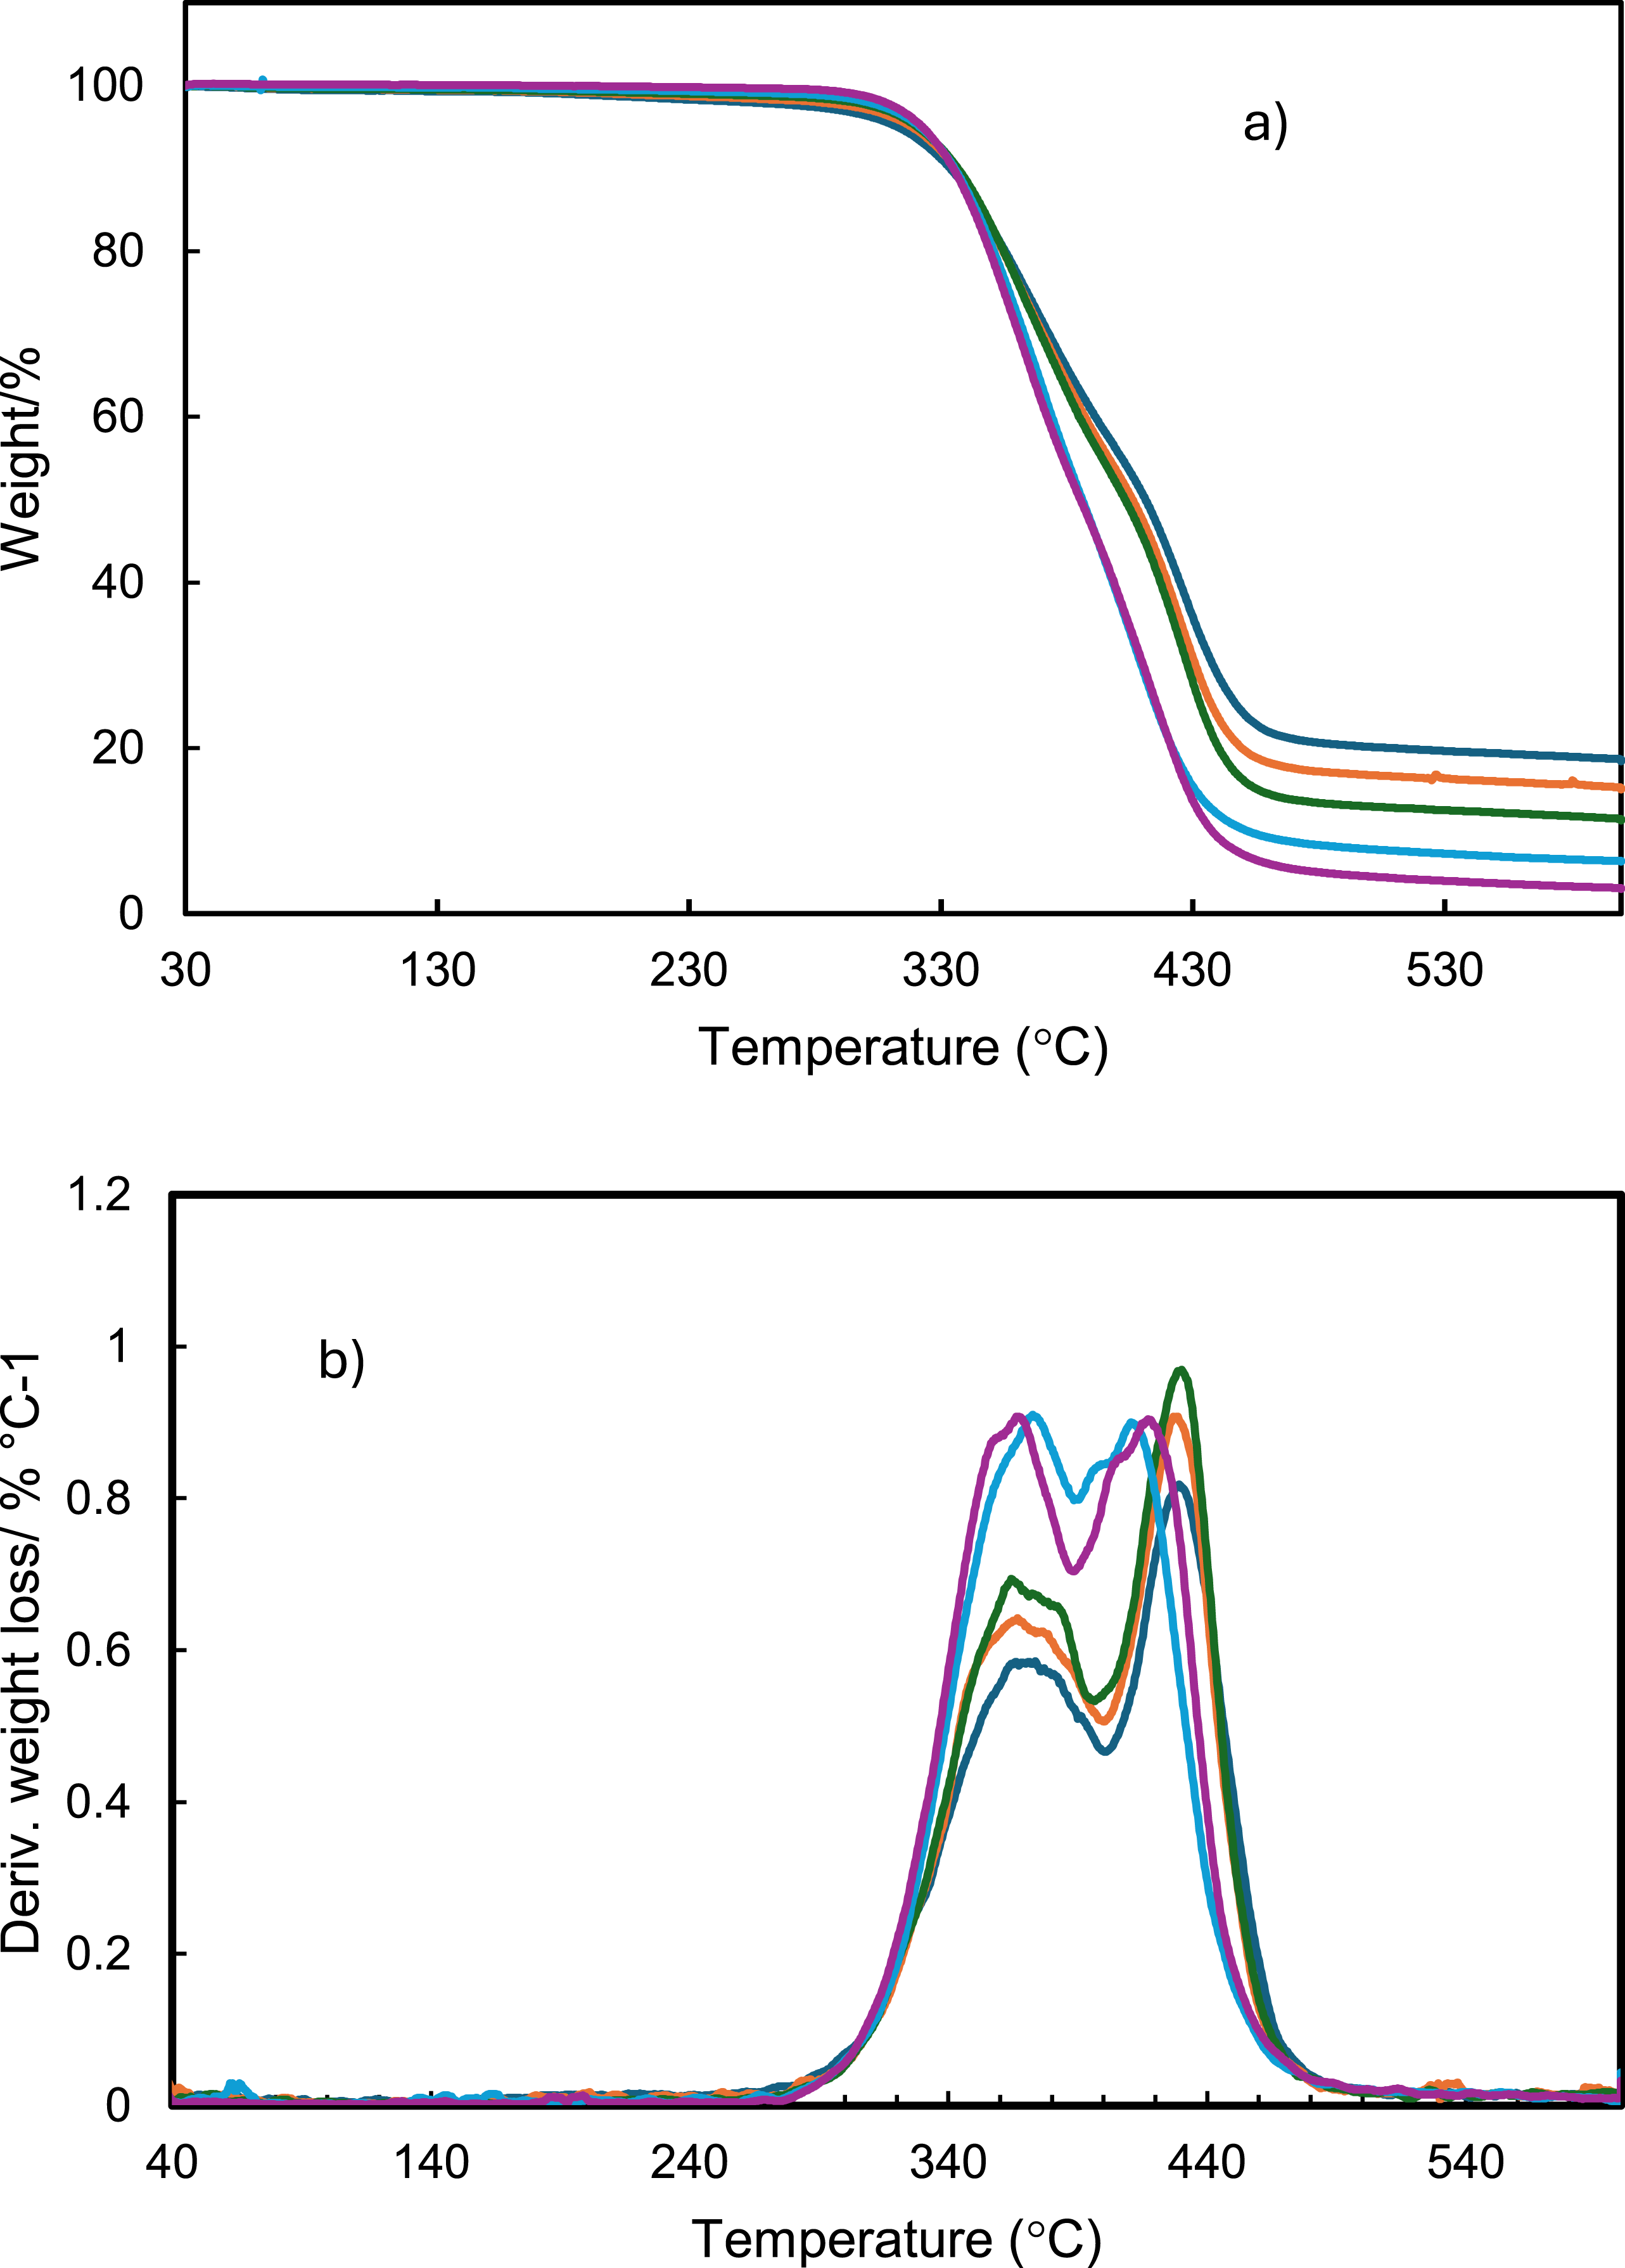
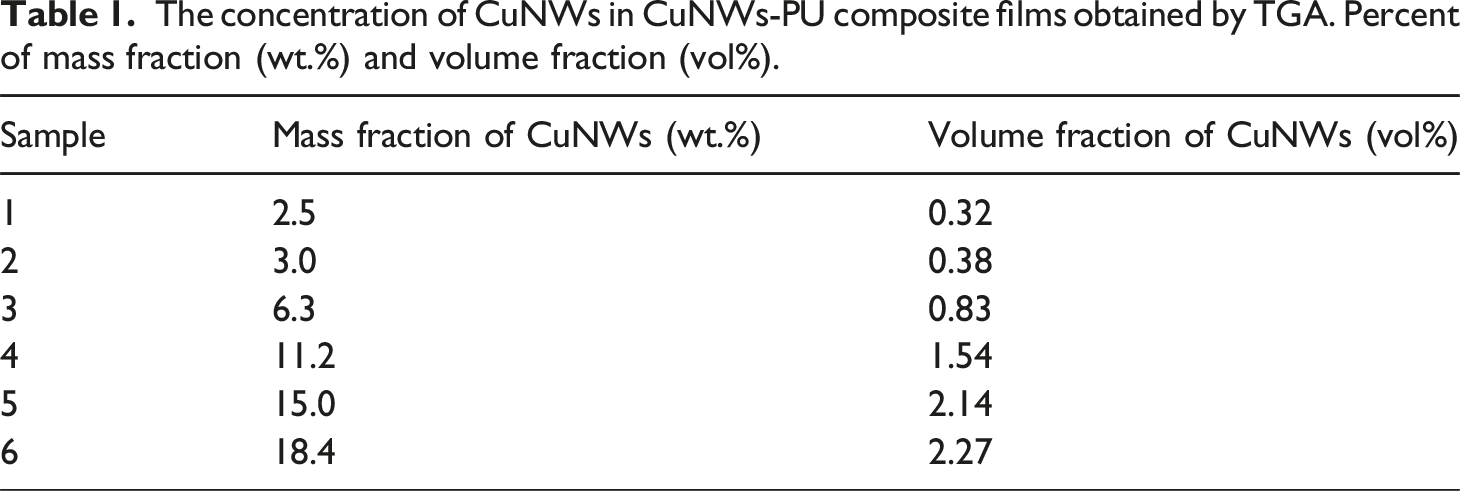
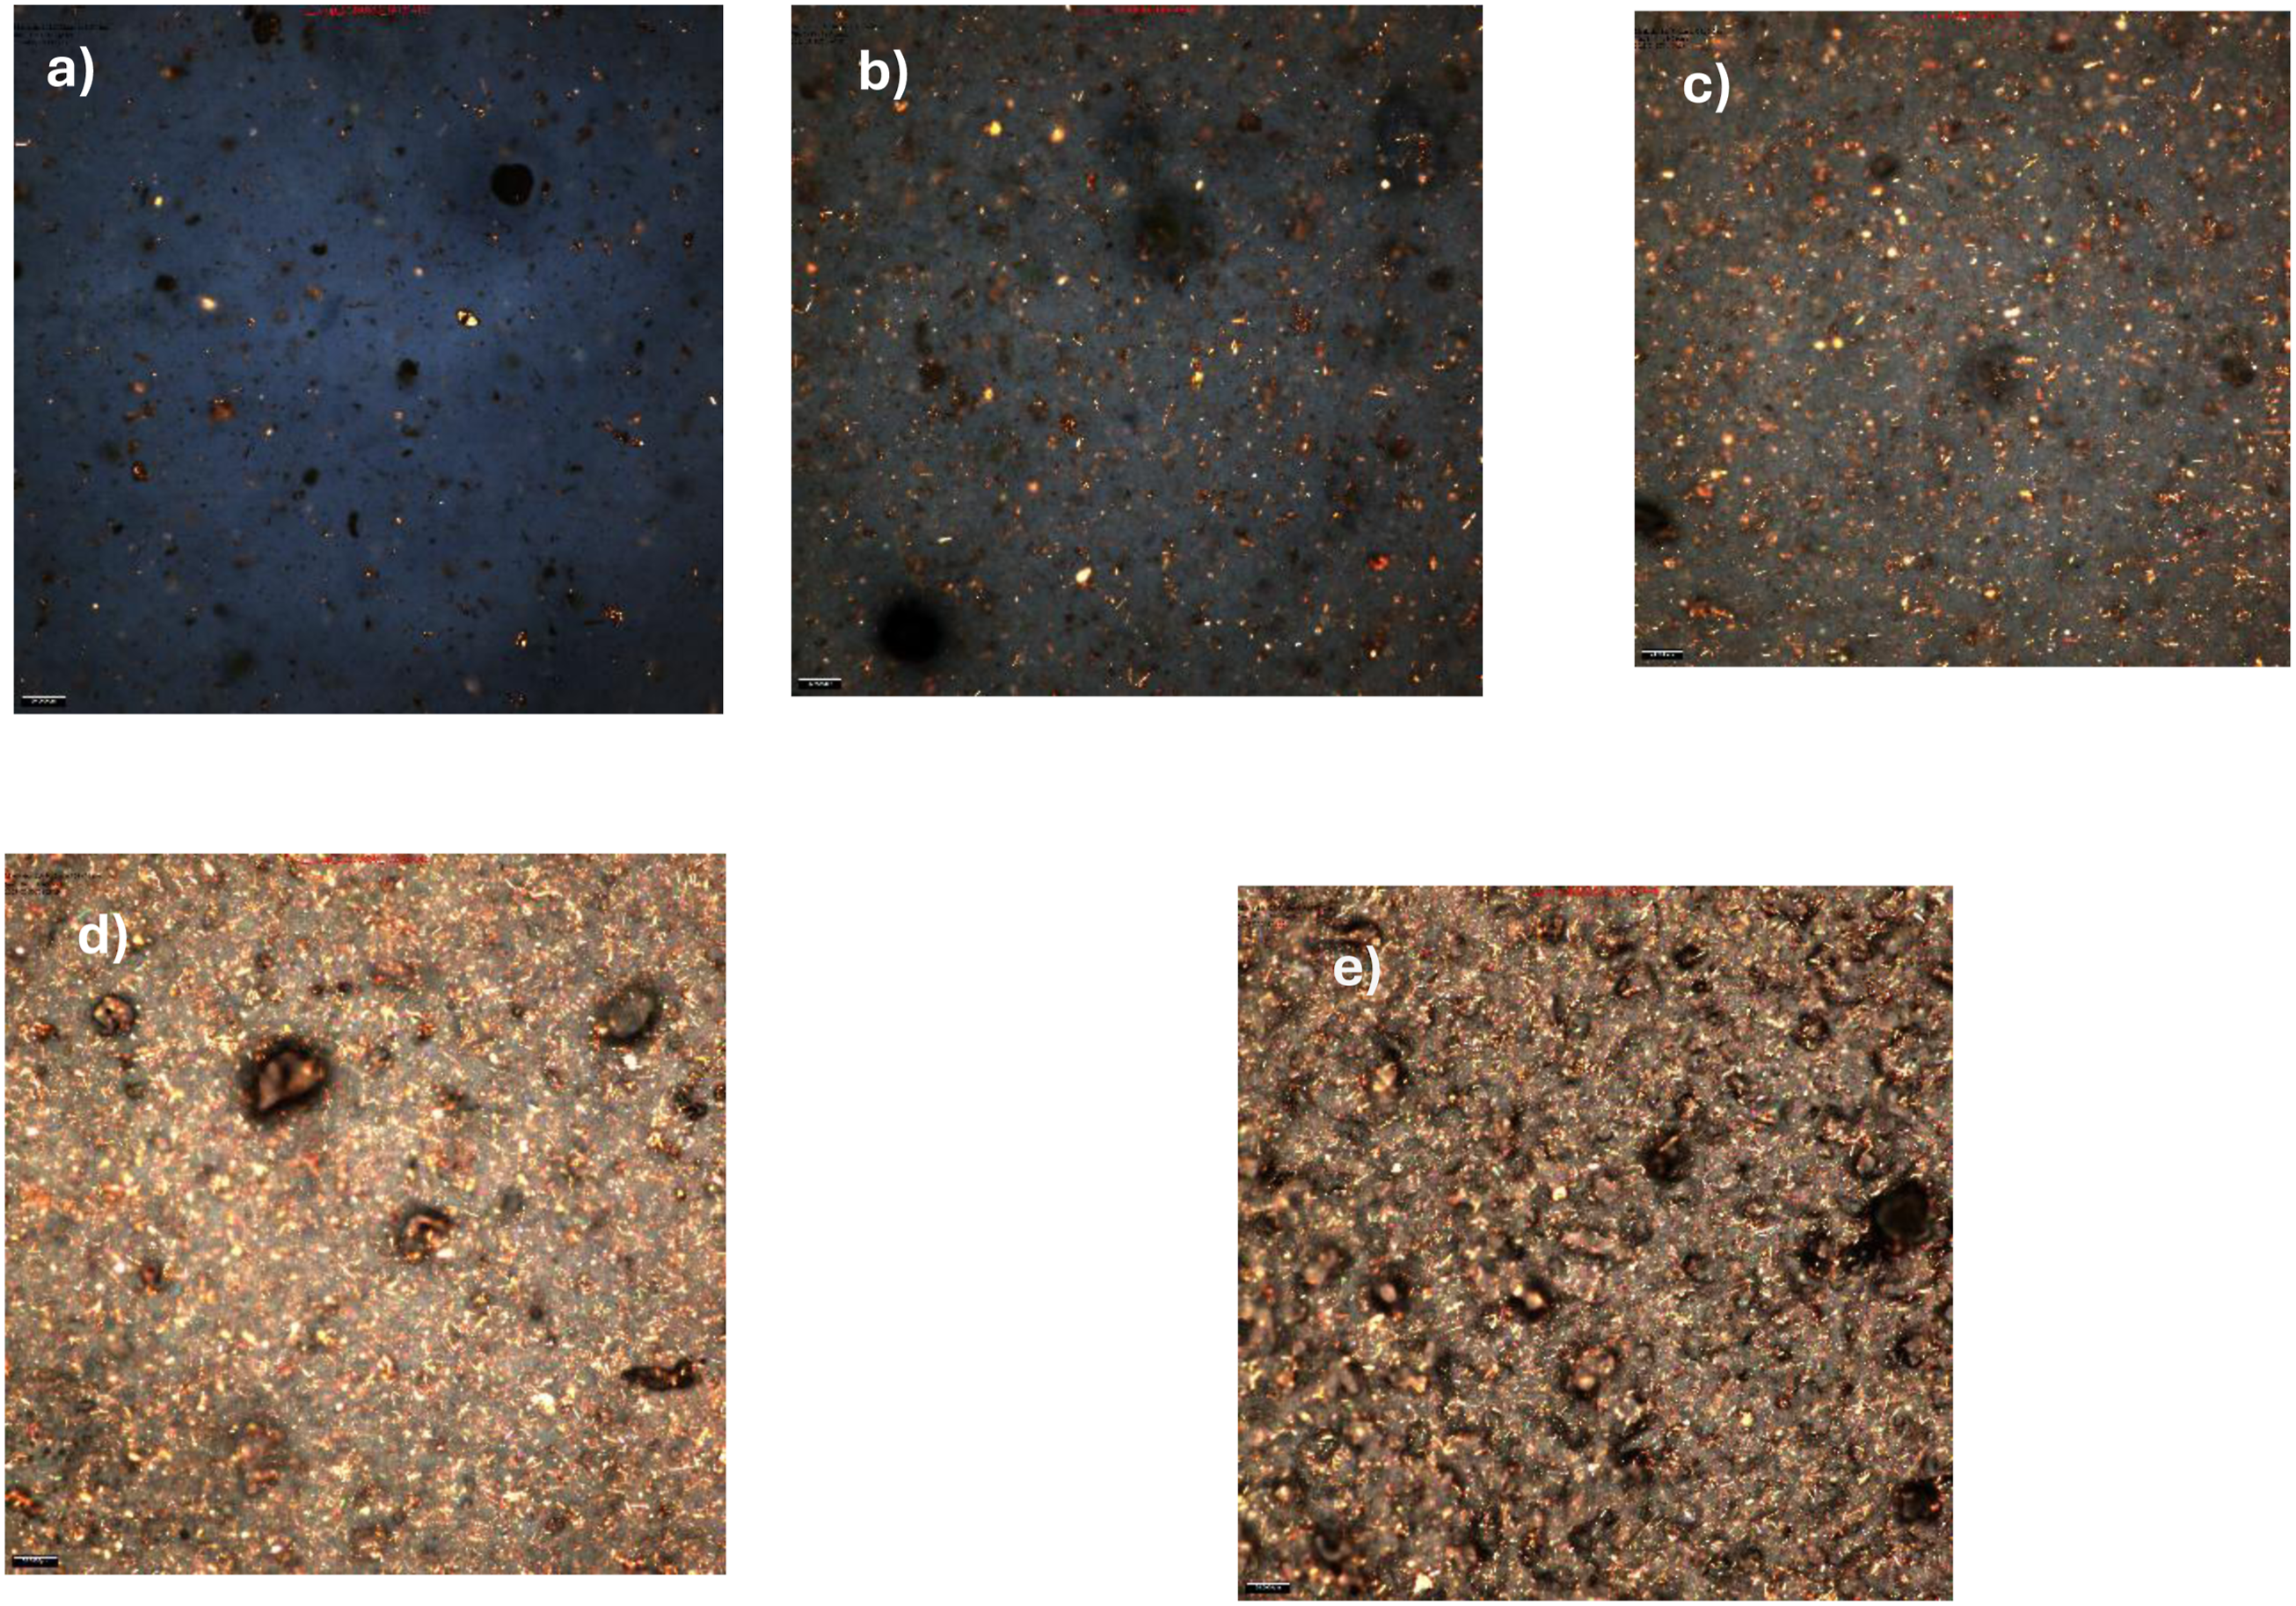
Figure 7 presents images of CuNWs-PU composite films fabricated with different CuNWs concentrations, which show that the composites maintain structural integrity. It should be noted that 18.5 wt% represents the maximum concentration that could be added to the PU matrix, as further increases of CuNWs led to issues in homogeneity, poor dispersion of the nanowires and structural integrity. Figure 8 presents the optical microscope images of the fabricated composites, demonstrating uniform filler dispersion across all samples. Even at the higher concentration of 18.5 wt%, the films retained a high quality with no significant aggregation of CuNWs. In particular, the films with 15 wt% and 18.5 wt% CuNWs show close contact between nanowires, which increases the likelihood of direct electron conduction through the composite. These observations are consistent with our previous studies where increased filler content in PU matrices led to improved conductive pathways.11,19,40 Fabricated CuNWs-PU composites, (a) 18.4 wt%, (b) 15.0 wt%, (c) 11.2 wt%, (d) 6.3 wt%, (e) 3.0 wt%. Light microscopy in-plane images for CuNWs-PU nanocomposite showing different content of CuNWs dispersed in PU for concentration of CuNWs: (a) 3.0 wt%; (b) 6.3 wt%; (c) 11.2 wt%; (d) 15 wt%; (e) 18.4 wt%.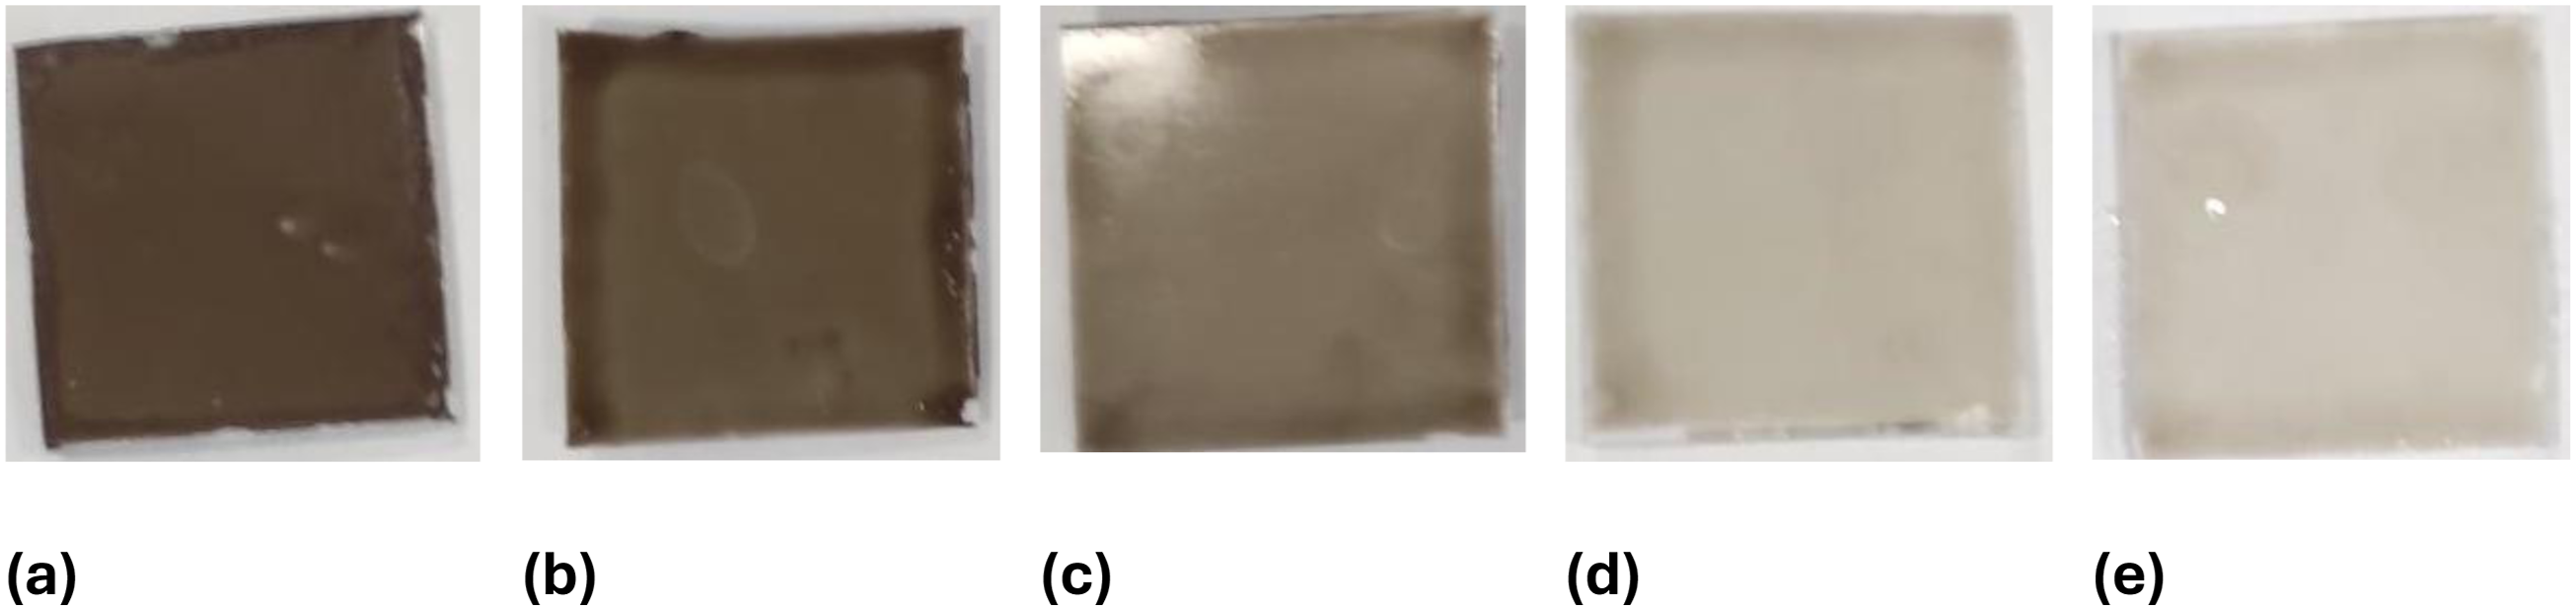
It should be noted that XRD analysis was not performed on the composites since their preparation involves only physical mixing at mild temperatures (section 2.3) without altering the Cu nanowire crystal structure. Composite XRD patterns would show diminished Cu peak intensities and increased background from the polyurethane matrix (see Figure 5).
Regarding the electrical conductivity of CuNWs-PU, a high resistance was measured in-plane direction using a multimeter, indicating insulating behaviour in that direction. Furthermore, we attempted to measure the conductivity through the thickness without applying any pressure; however, the multimeter showed a high resistance, indicating insulating behaviour without pressure. But when perpendicular pressure is applied into the composite, it becomes conductive in the z-direction, or through the thickness. Figure 9 presents the experimental electrical conductivity of CuNWs-PU composite films through thickness under several pressure. For the composite with the lowest filler content of 3 wt% (blue curve), increasing pressure had no significant effect on electrical conductivity. This is because neither tunnelling between adjacent fillers nor the contact between particles under pressure was sufficient to induce conductivity. For the composite with 6 wt% CuNWs (orange curve), although a very slight increase in conductivity was observed at pressures above 10 kPa, the composite remained largely non-conductive with a conductivity of approximately 1.5 × 10⁻⁹ S/m. Experimental electrical conductivity versus vertical pressures for CuNWs for five concentrations of CuNWs: (dark blue) 3 wt%; (orange) 6.3 wt%; (green) 11.2 wt%; (light blue) 15 wt%, and (purple) 18.4 wt%.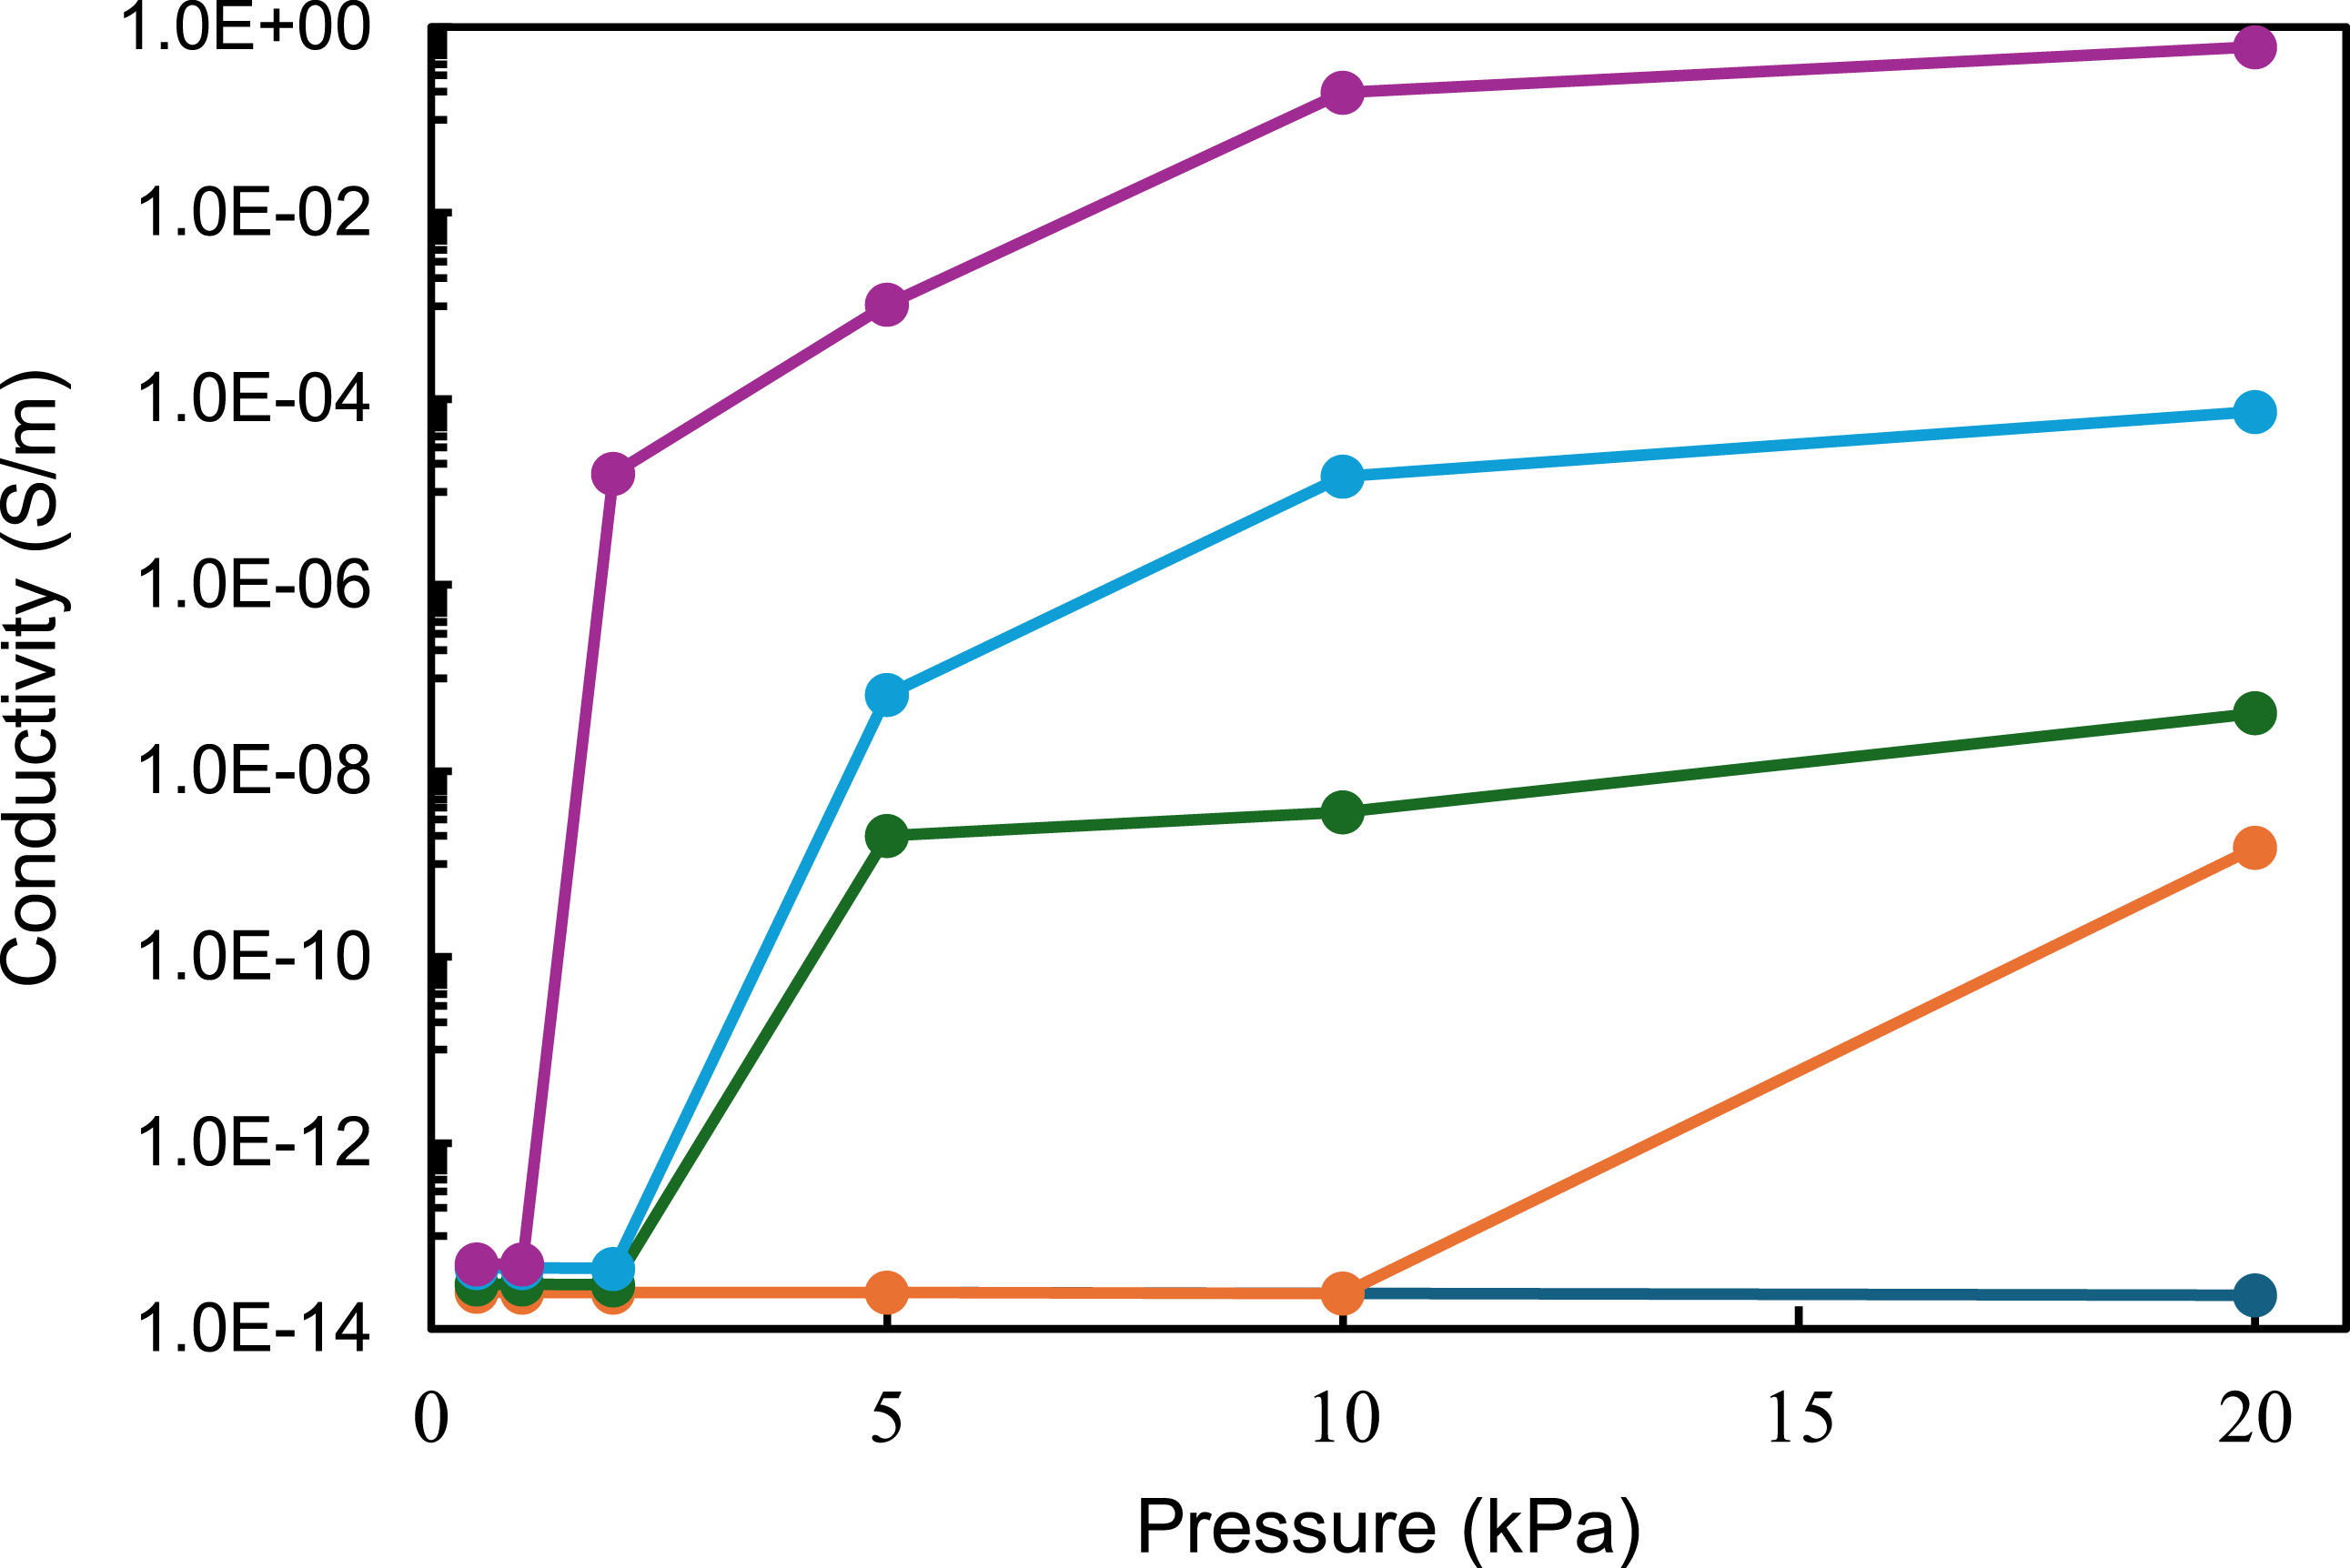
In contrast, the composite with a medium filler loading of around 11 wt% (green curve) showed a more noticeable response to applied pressure, exhibiting a low conductivity of less than 4 × 10⁻⁸ S m−1 at 5 kPa, which remained almost constant even at 20 kPa. However, the behaviour of the composites with the two highest CuNWs concentrations was markedly different. The composite with 18.5 wt% CuNWs showed an increase of nine orders of magnitude in conductivity at just 2 kPa, transitioning from an insulating state (10−14 S/m) to a conductivity of 1.5 × 10⁻⁵ S/m. The conductivity continued to rise with increasing pressure, ultimately reaching 0.61 S/m. Similarly, the composite with 15 wt% CuNWs followed the same trend, with a maximum conductivity of 7.3 × 10⁻⁵ S/m and the most significant change occurring at 5 kPa. In comparison with other studies in the literature, Ravindren et al. found a similar value of conductivity for EMA/EOC filled with CuNWs, as well as the group of Sundararaj et al. have found similar values for copper nanowire polystyrene nanocomposites.12,26 Moreover, in all cases, once the applied pressure was removed, the composites reverted to their original insulating state, demonstrating the reversibility of their electrical properties. This reversibility supports the potential of these composites for applications in pressure-sensitive devices. 60
The correlation between CuNW concentration and electrical conductivity in the composites under different pressures is shown in Figure 10. At low CuNW concentrations, the electrical conductivity was minimal, similar to that of the polymer matrix. Beyond a specific CuNW concentration, referred to as the percolation threshold, conductivity increased significantly. This threshold was found to depend on pressure. The results indicate that the maximum conductivity was not reached within the studied concentration range, so it is likely that it is continuing to increase at higher concentrations. The lowest conductivity across all concentrations was observed at the lowest applied pressure of 1 kPa. At 2 kPa, conductivity sharply increased beyond the percolation threshold of 15 wt% CuNWs, reaching a value of 1.56 10−5 s m−1. At 5 kPa and 10 kPa, the CuNWs percolation threshold decreased to approximately 6.3 wt%, achieving a maximum conductivity of 1.03 10−5 s m−1. At 20 kPa, the percolation threshold further decreases to around 3 wt % CuNWs, with a maximum conductivity of 0.612 s m−1. Overall, for all applied pressures, increasing the CuNWs concentration in the PU composite led to higher conductivity due to the increased likelihood of forming conductive pathways.
61
In the literature, Sundararaj’s group reported an electrical percolation threshold for polystyrene/copper nanowire composites comparable to that observed in our composite.7,12,28,29 It should be noted that the percolation threshold depends on several factors, including filler orientation, polymer deformation, filler size, and the geometry of the composite itself. These factors vary for each composite presented in the literature, so an exact comparison is not possible. As can be seen in Figure 10, the percolation threshold decreased with increasing pressure, shifting from 15 wt% at 2 kPa to 3 wt% at 20 kPa. (a) Electrical conductivity versus concentration of CuNWs for the CuNWs composite at the different pressures: (orange), 1 kPa; (dark green), 2 kPa; (blue), 5 kPa; (purple), 10 kPa and (light green) 20 kPa.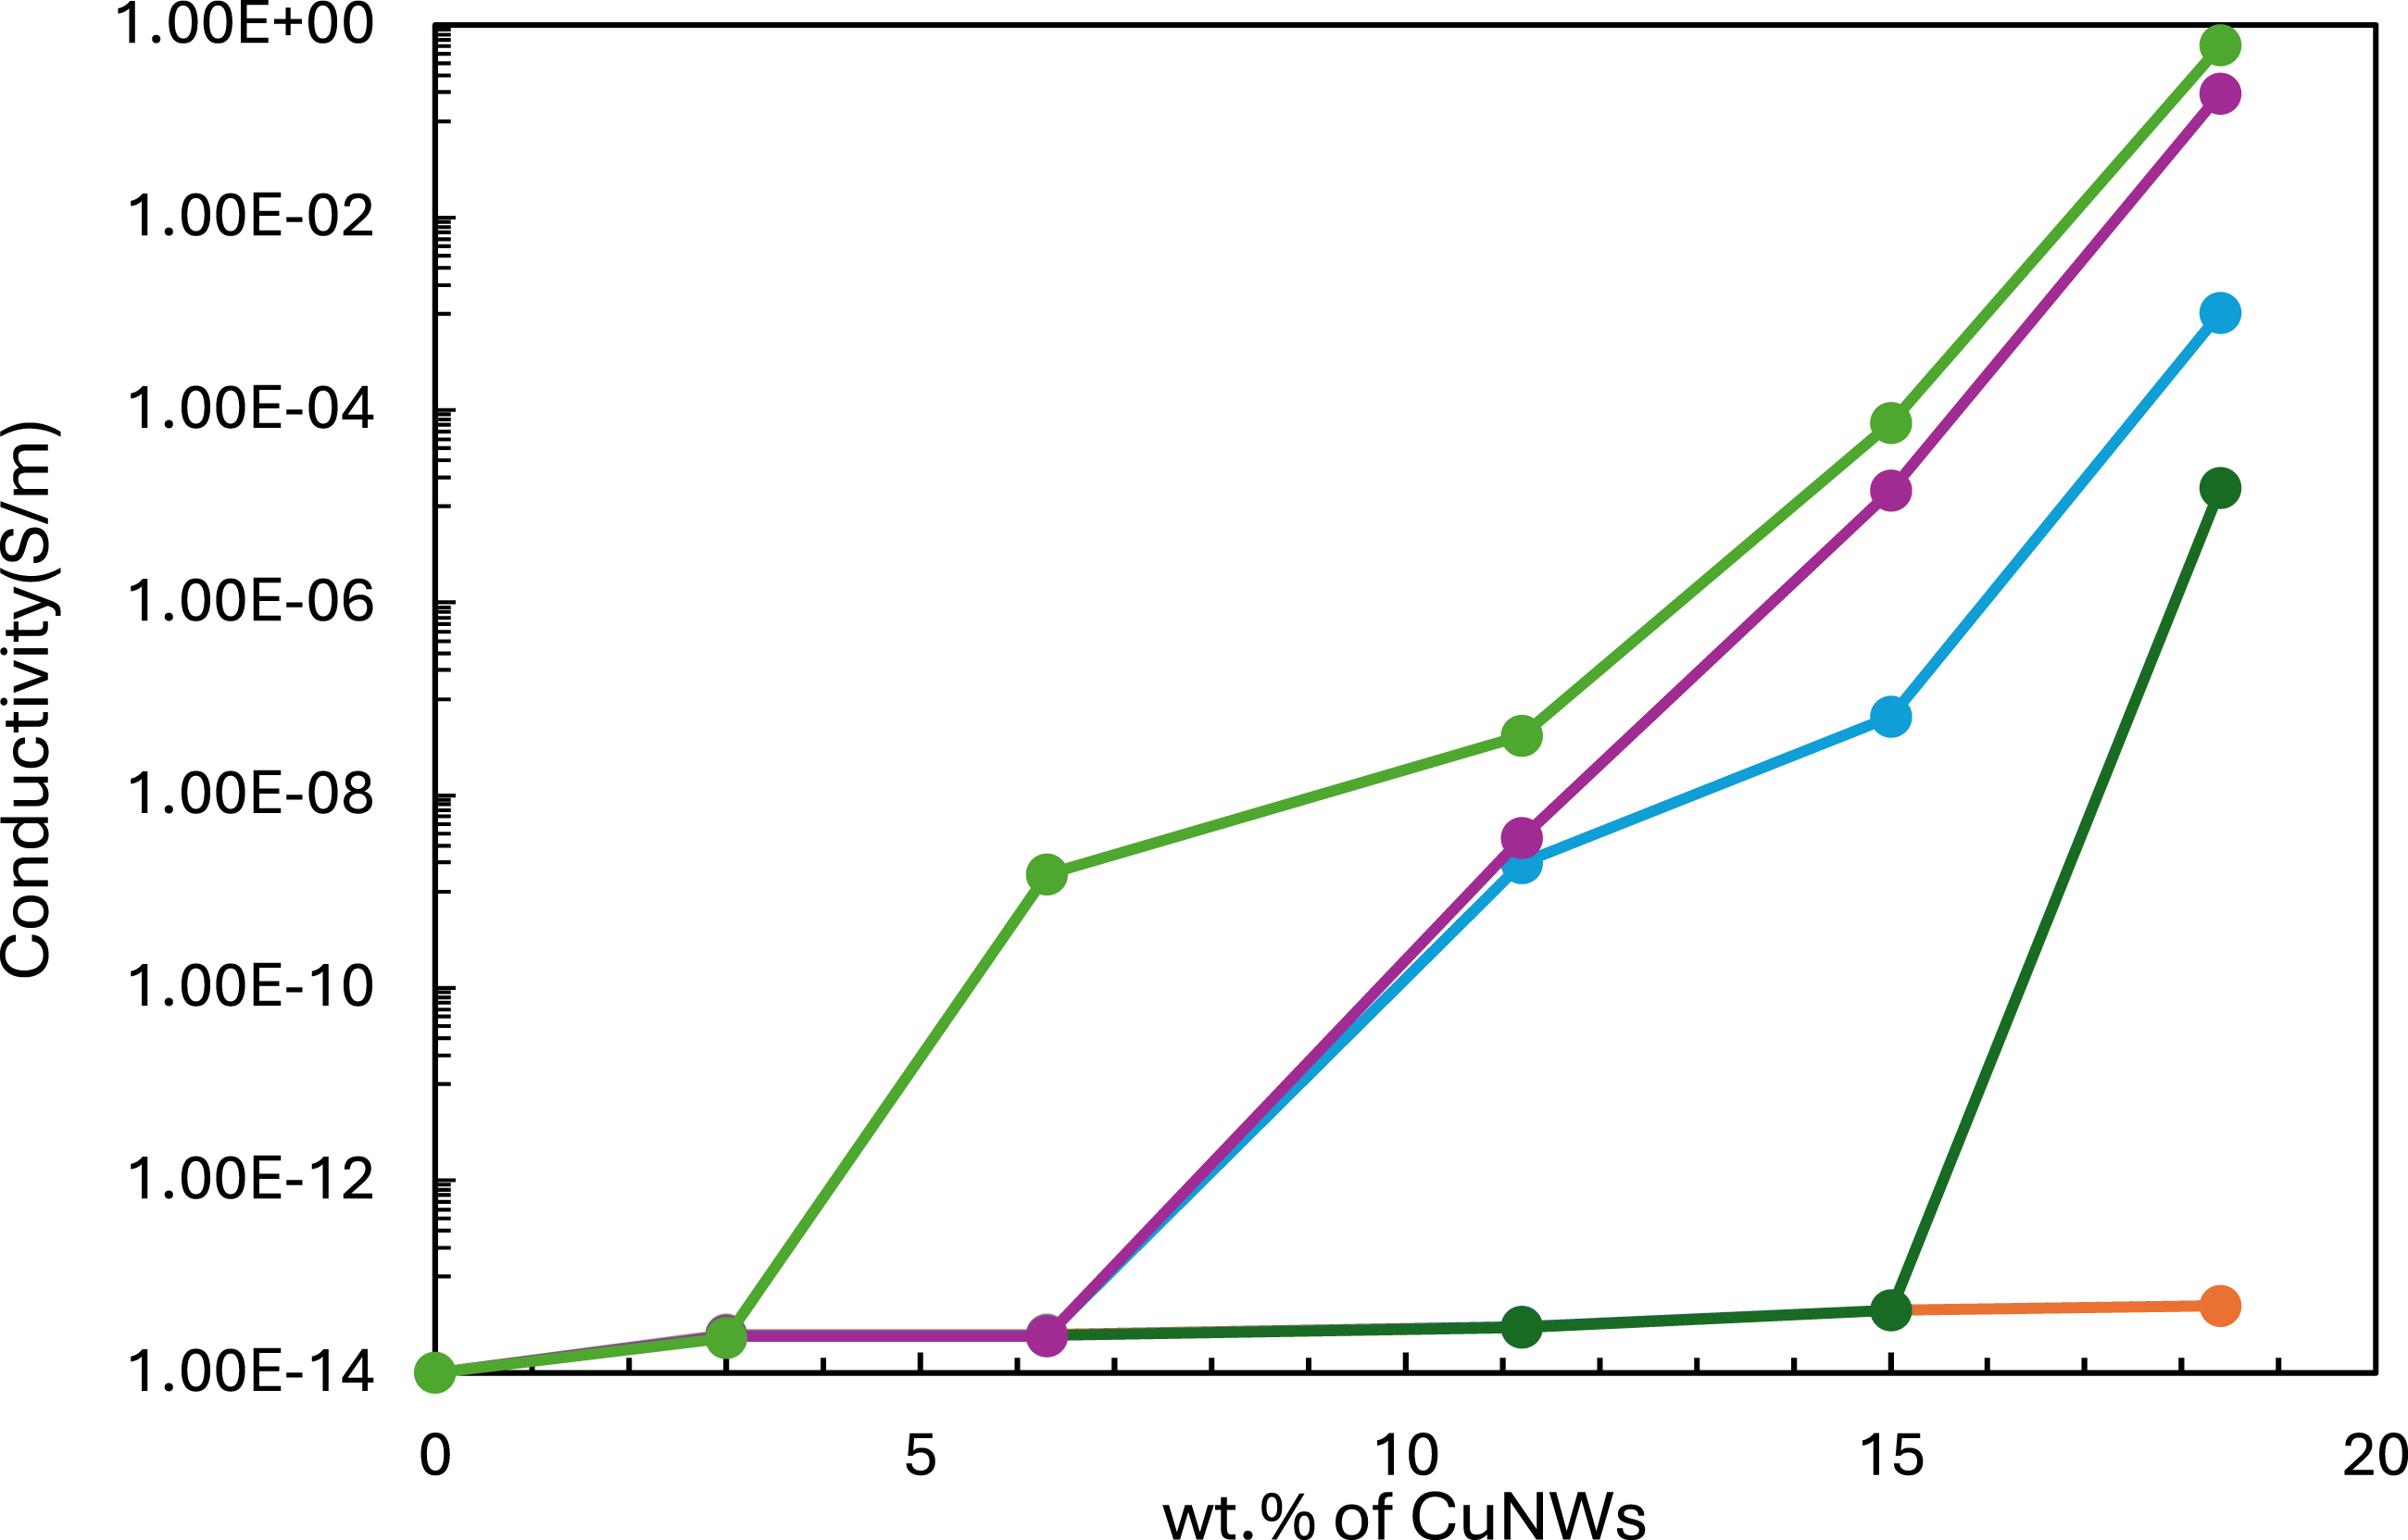
In summary, pressure-induced percolation transition (PIPT) and the percolation threshold are the two dominant phenomena governing the electrical behaviour of these fabricated composites. 11 PIPT refers to the process in which external pressure enhances the connectivity between dispersed conductive particles, promoting the formation of conductive pathways and lowering the percolation threshold. 62 Given the reversible nature of the composites, they are well-suited for practical applications in pressure-sensitive devices, such as flexible sensors, piezo-resistive materials, and other smart materials. 63
Numerical Modelling of Copper–Nanowire Polyurethane Nanocomposites
Constituent materials properties of the CuNWs-PU film composite. 11
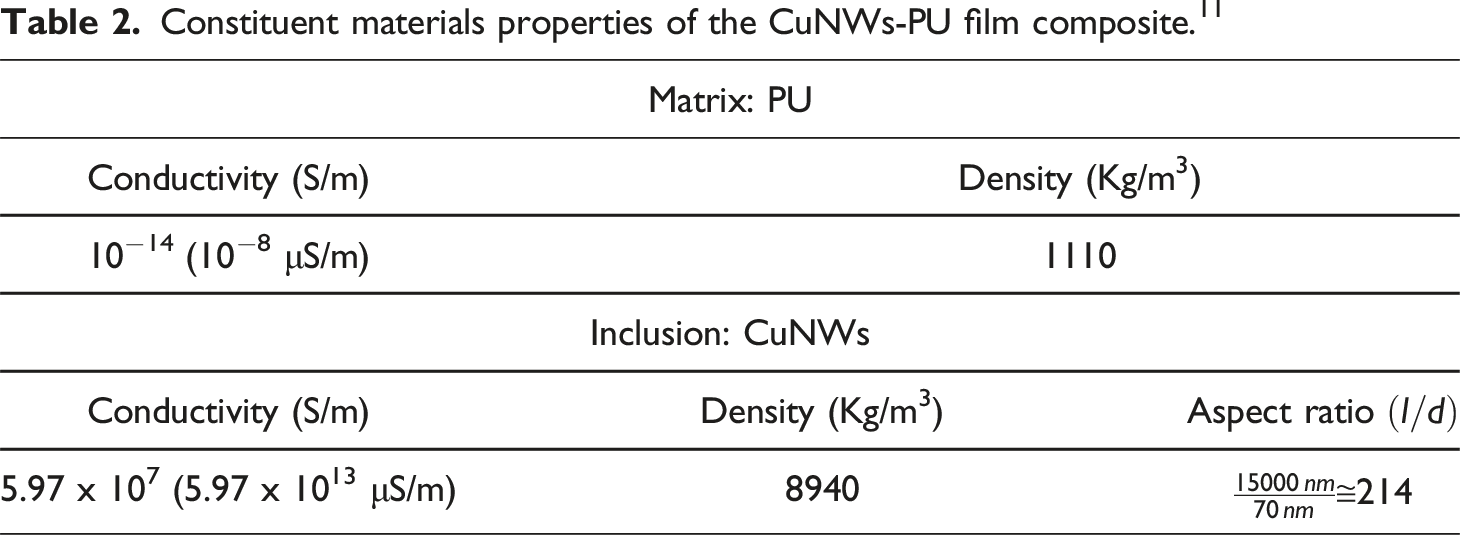
Figure 11 depicts the progression of sample thickness reduction under varying applied pressures. For each RVE corresponding to a given concentration, the overall volume was maintained constant. The total number of elements generated in the finite element mesh varied depending on the concentration of CuNWs, ranging from approximately 500,000 to 1.5 million elements. This increase is attributed to the higher CuNWs content, which introduces more intricate geometrical features within the RVE that require finer discretisation to capture the microstructural details accurately. As the inclusion density rises, a finer mesh is necessary to resolve the small-scale features and interfaces between phases, resulting in a significant growth in the element count. Correlation between experimentally observed thickness reductions under applied pressure.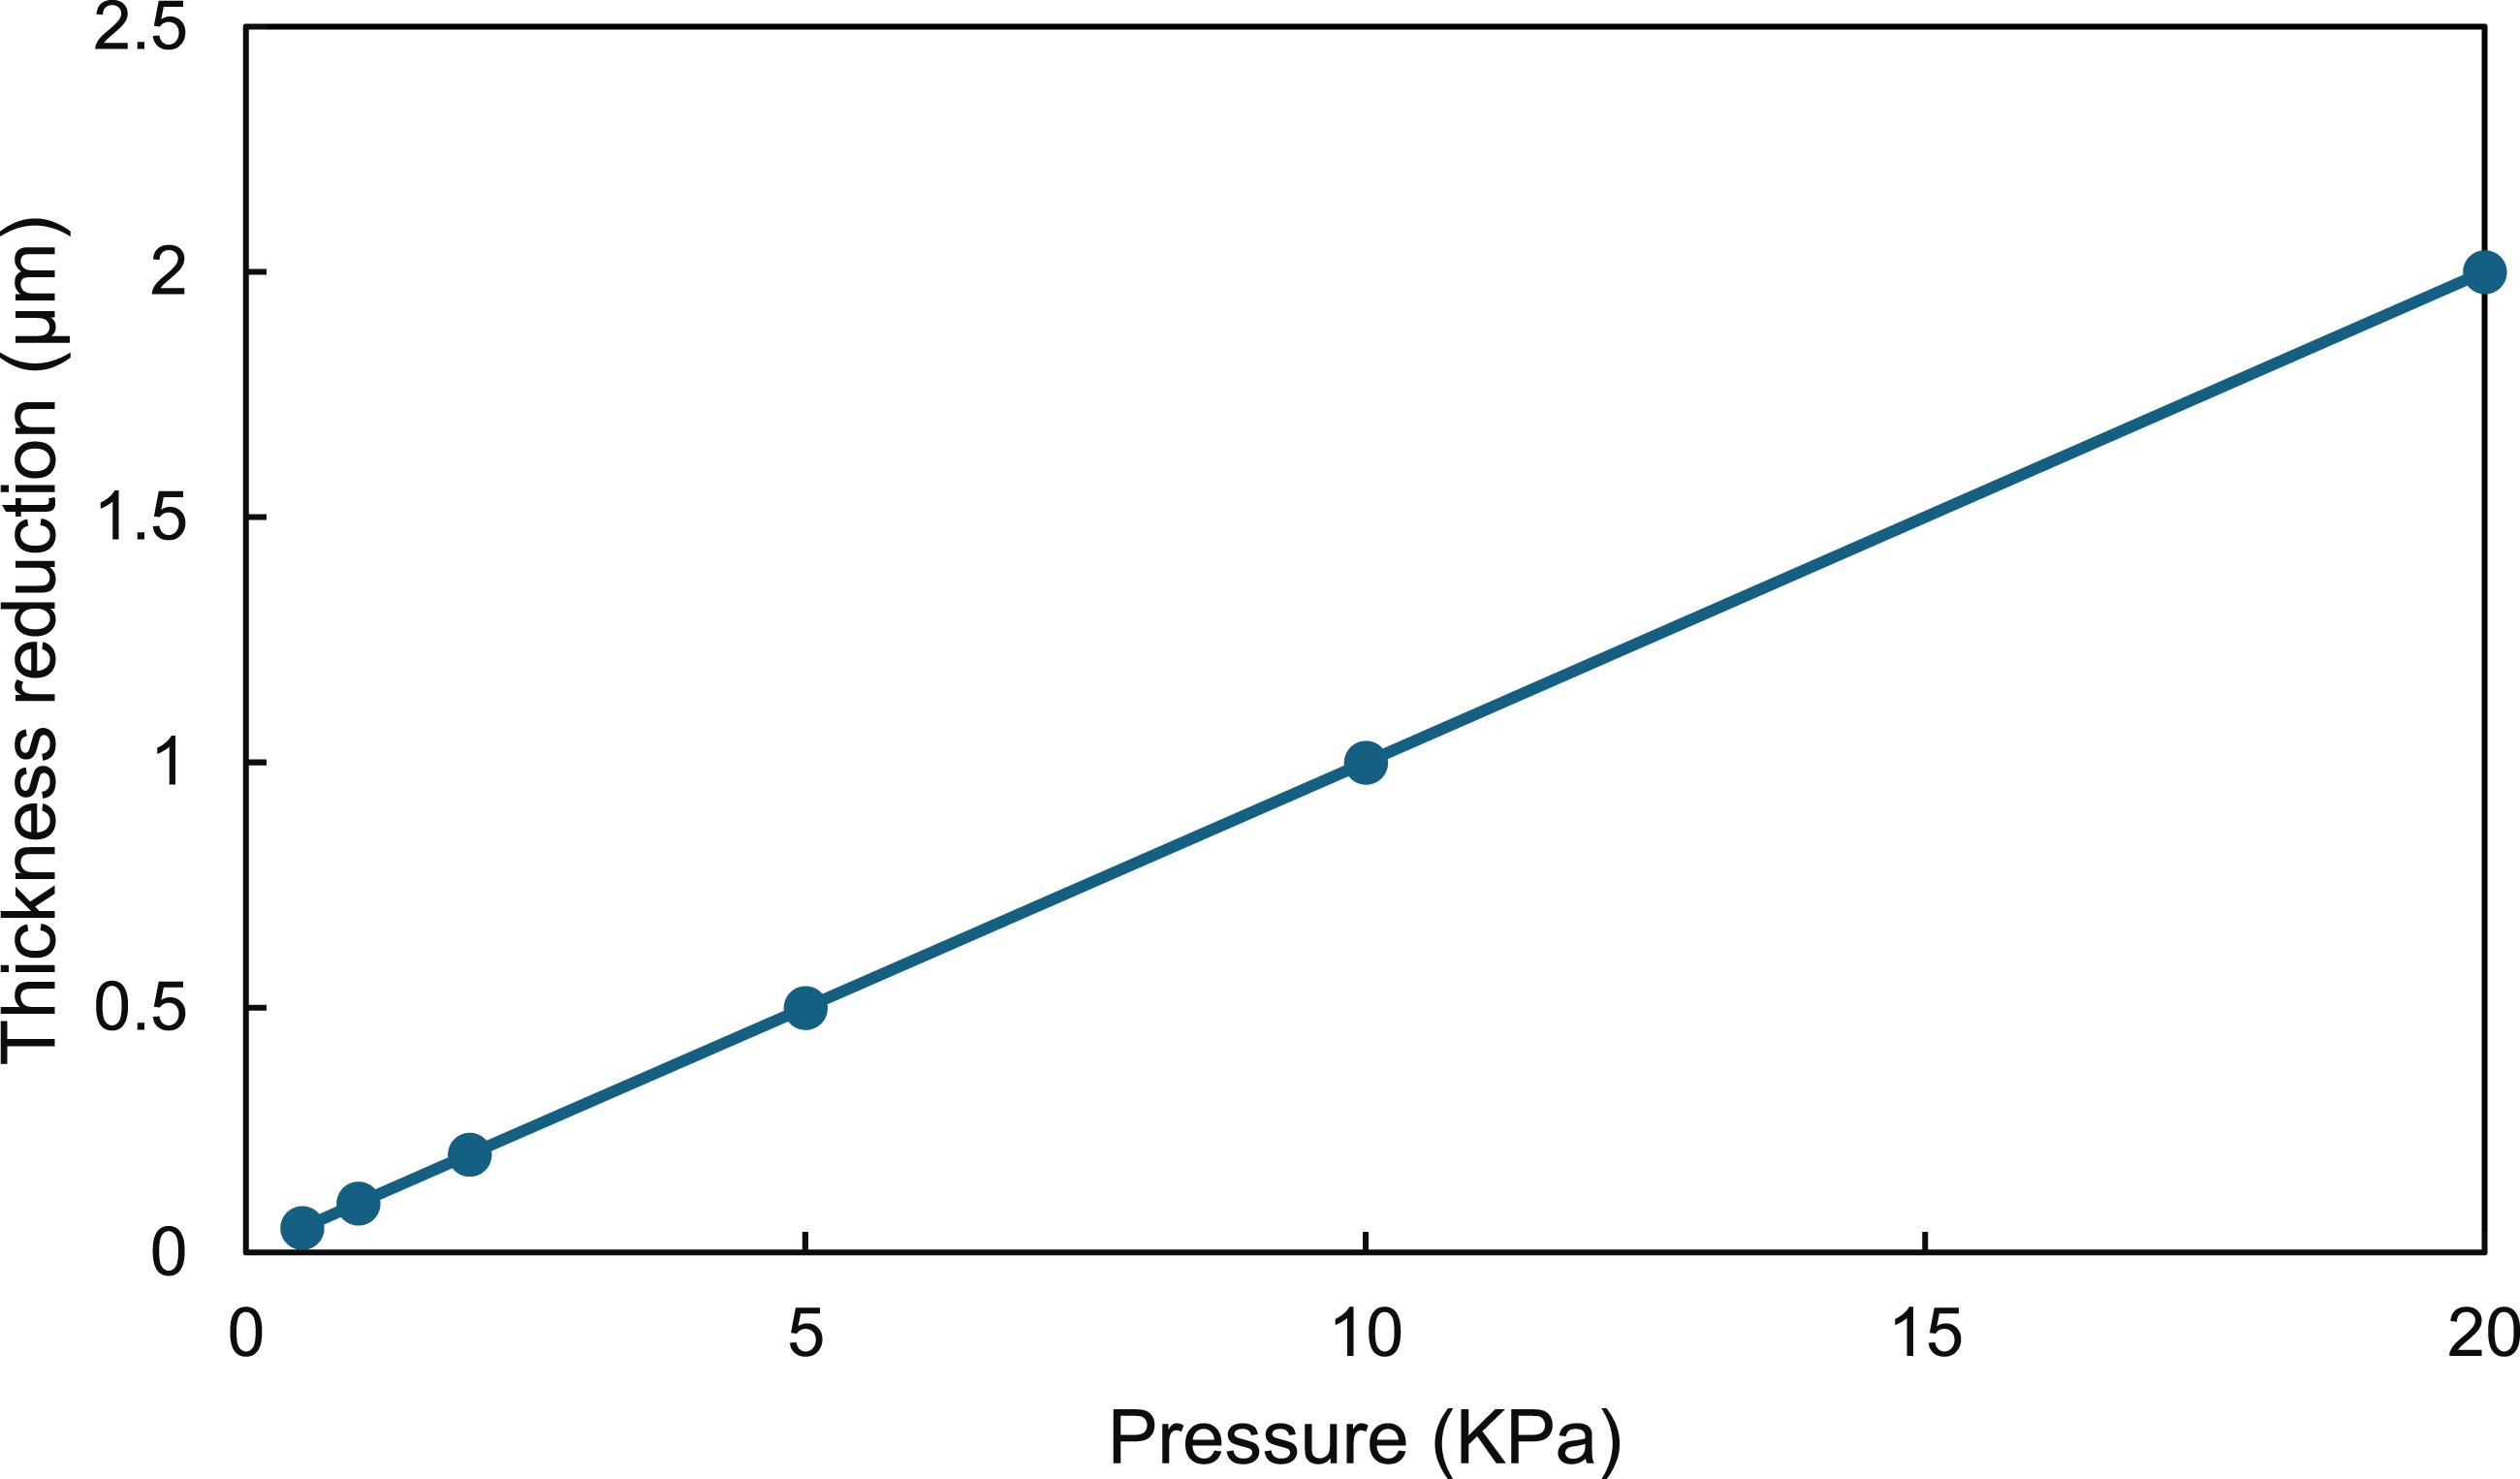
To emulate the experimentally observed thickness reductions under applied pressures (Figure 11), RVE geometries were correspondingly altered. However, sometimes the manual adjustment of the RVE thickness, e.g., at 10 and 20 kPa in the 3 wt% case (Figure 12(a)), introduced numerical instability. To circumvent this, fibre orientations were re-randomised while ensuring isotropy and maintaining minimum spacing and random orientation controls during RVE generation to mitigate mesh issues and avoid instabilities.
67
For other concentrations (Figure 12(b)–(e)), orientation changes enabled better alignment between simulated and experimental conductivity values. Despite these adaptations, conductivities exceeding ∼10−9 S/m could not be accurately captured within the simplified RVE framework. This limitation can be attributed to phenomena not captured in our simulations, such as electron tunnelling and contact resistance between nanowires,12,68 interfacial polarisation and space charge layers,
69
agglomeration effects that alter percolation pathways61,70 or dynamic restructuring under pressure, which requires real-time meshing—beyond current model scope.71,72 To compensate, orientation adjustments were employed iteratively in a quasi-calibrated manner, consistent with similar finite element micromechanics studies.73,74 Evolution of RVE geometry and mesh with varying CuNW concentration and applied thickness reduction.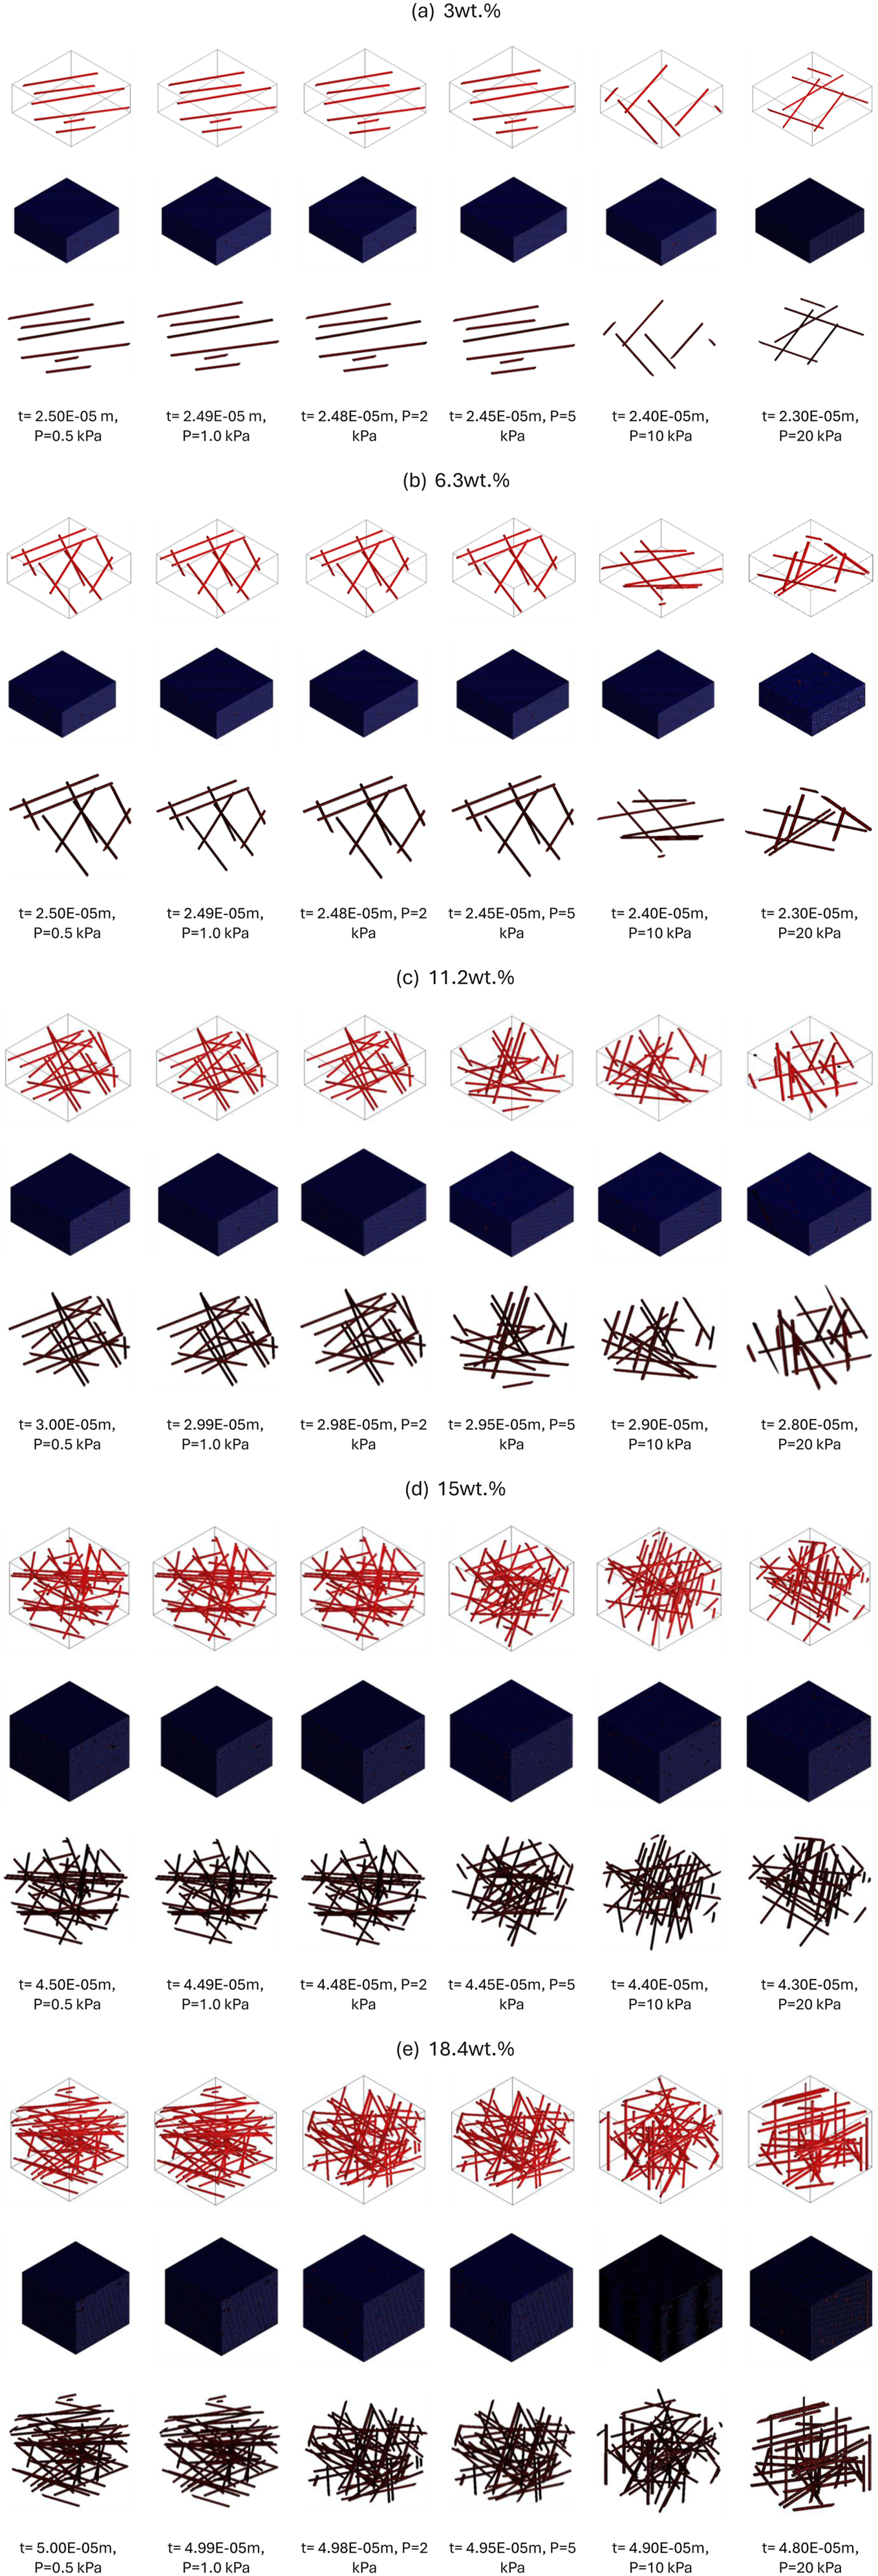
As shown in Figure 13, for low concentrations (3–6.3 wt%), the simulation results were within a factor of ∼2 of the experimental conductivity, improving with pressure. For intermediate concentrations (11.2 wt%), simulations accurately captured the trends but often overestimated conductivity at higher pressures. For high concentrations (15–18.4 wt%), the simulated conductivity increases sharply with pressure, exceeding experimental values—likely due to RVE limitations and the neglect of certain physical phenomena. The under-prediction at low wt.% arises from the absence of tunnelling/contact effects and imperfect modelling of the percolation network. While over-prediction at high wt.% stems from idealised assumptions regarding fibre dispersion, RVE scaling, and fibre contacts, neglecting real-world agglomeration or insulation breakdown. Pressure-induced structural changes beyond simple thickness reduction—such as nanowire bending or micro-cracking—are not modelled. Comparison between the experimental (dark blue) and simulated electrical conductivity (orange) for five concentrations of CuNWs in PU: (a) 3 wt%, (b) 6.3 wt%, (c) 11.2 wt%, (d) 15 wt% and (e) 18.4 wt%.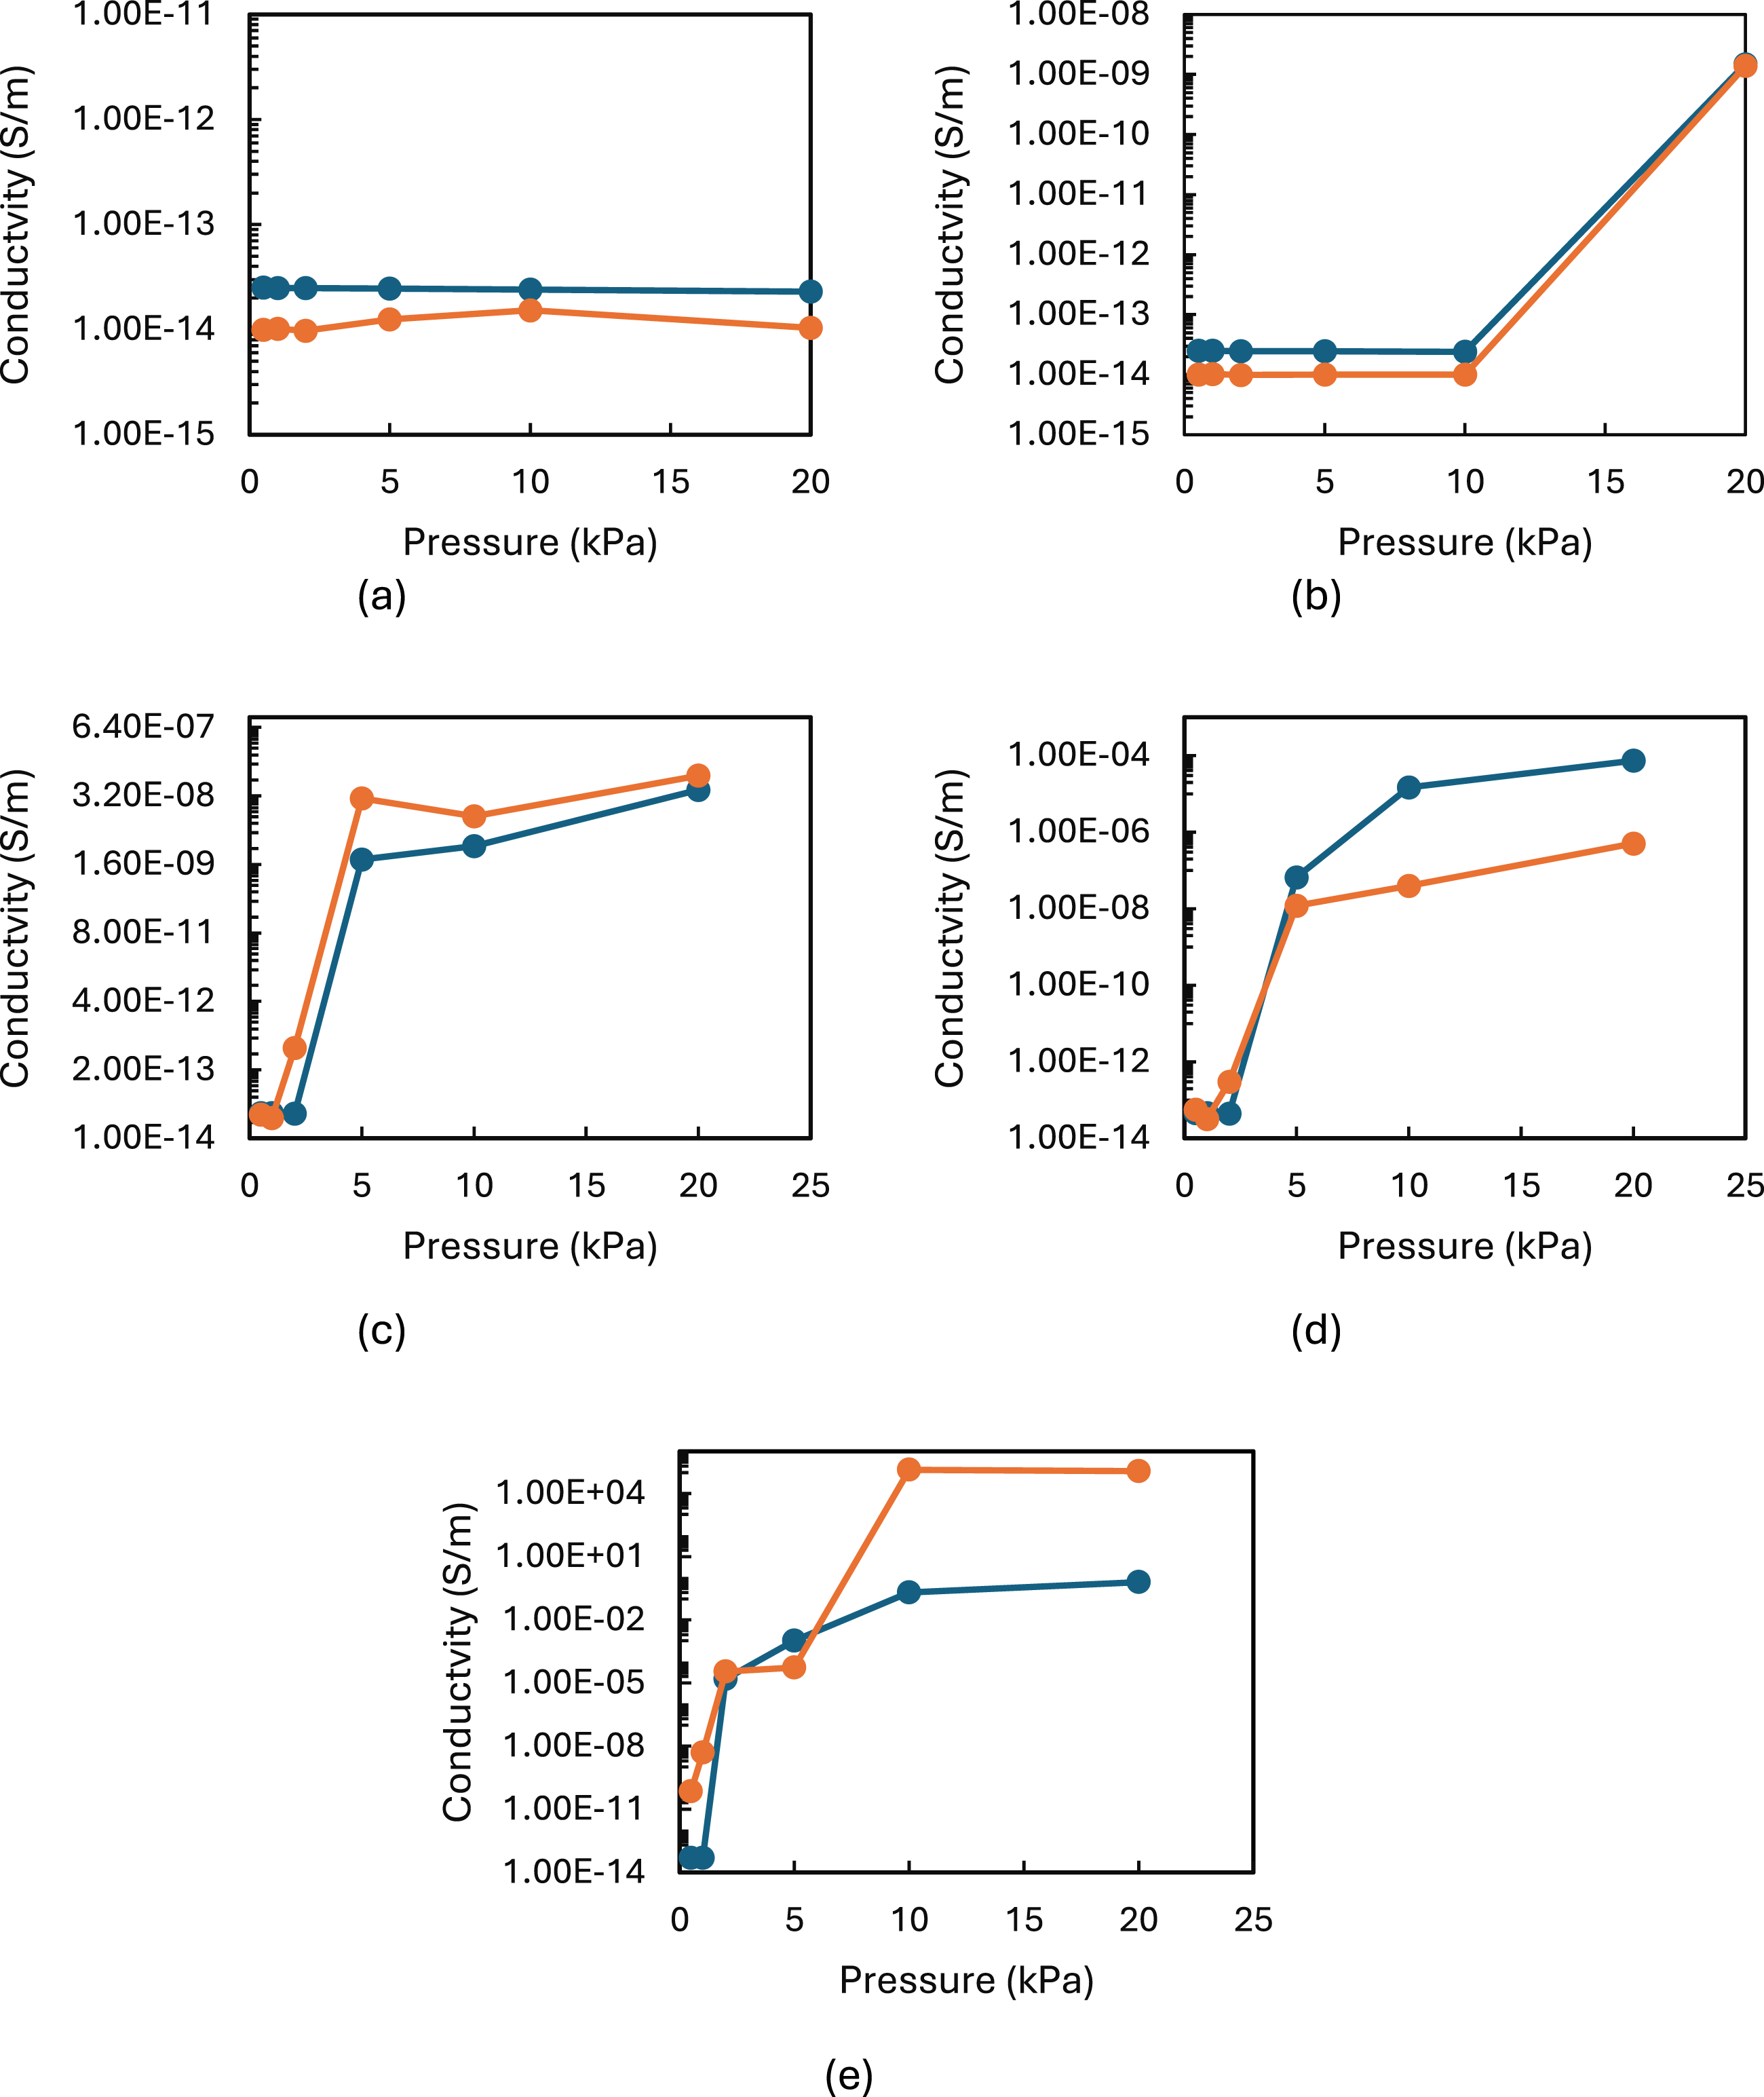
While the combined geometric adjustment and orientation tuning method aligns well with mid-tier experimental data (6–11.2 wt%), future refinement should involve incorporating electron tunnelling and interfacial resistance via hybrid RVE-microscale frameworks, including pressure-dependent interphase properties or adaptive meshing to simulate the evolution of the fibre network better and validating against larger-scale mechanical-electric coupling experiments.
Conclusion
CuNWs embedded in the PU form a conductive network that becomes active when pressure is applied. The percolation threshold decreased with increasing pressure, shifting, for example, from 15 wt% at 2 kPa to 3 wt% at 20 kPa. Moreover, the pressure at which the conductivity sharply increases decrease with the increase of CuNW concentration in the nanocomposite. In all cases, once the applied pressure was removed, the composites reverted to their original insulating state. The pressure-dependent conductivity and reversibility of electrical properties in CuNWs-PU nanocomposites indicate their potential application in flexible electronic sensors and piezoresistive devices.
We developed a multiscale simulation framework that combined geometric adjustment and orientation tuning method to predict the effective electrical conductivity of CuNW-PU composites under compressive pressure. Despite computational constraints, the simulated conductivity evolution with pressure and concentration agreed well with experimental data in the mid-concentration range (6.3–11.2 wt%). Deviations arose from idealized assumptions regarding nanowires dispersion, RVE scaling, nanowire contacts, and neglecting real-world agglomeration or insulation breakdown. Nevertheless, the framework achieves a valuable balance between computational efficiency and predictive accuracy, providing a foundation for future enhancements incorporating physical phenomena such as pressure-dependent network dynamics.
Footnotes
Acknowledgements
This paper was created as part of the project No. CZ.02.01.01/00/22_008/0004631. Materials and technologies for sustainable development EH22_008/0004631 within the Jan Amos Komensky Operational Program financed by the EU and state budget of the Czech Republic. Further acknowledgement has to be given to the financial support of the EU under the REFRESH – project number CZ.10.03.01/00/22_003/0000048 via the Operational Programme “Just Transition”. This research was also supported by Northumbria University and the MCE QR Steering Funds from the Department of Mechanical and Construction Engineering. S.M. gratefully acknowledges the Turing Scheme for funding his visit to the Technical University of Ostrava. The authors also extend their thanks to Rebecca Payne, Pietro Maiello, and Simon Neville for their valuable technical assistance.
Author Contributions
K.L and Y.S.-V.,: conceptualisation. S.M., G.K. and G.S.M.: methodology. A. R. E.: simulations. S.M., G.S.M., G.K., Y.S.-V., A. R. E., and K.L.: investigation. S.M., G.S.M., G.K., Y.S.-V., and A.R.E.: formal analysis. Y.S.-V., G.S.M., and K.L.: supervision. G.S.M., G.K., and Y.S.-V.: resources. S.M., A. R. E. and Y.S.-V.: writing–original draft preparation. Y.S.-V., G.S.M., G.K., and K.L.: writing–review and editing. All authors have read and agreed to the published version of the manuscript.
Declaration of conflicting interests
The authors declared no potential conflicts of interest with respect to the research, authorship, and/or publication of this article.
Funding
The authors disclosed receipt of the following financial support for the research, authorship, and/or publication of this article: This work was supported by the Czech Republic; EH22_008/0004631, European Union Studies Association; CZ.02.01.01/00/22_008/0004631, European Union Studies Association; CZ.10.03.01/00/22_003/0000048.
Data Availability Statement
The data that support the findings of this study are openly available in repository ZENODO at ![]() .
75
.
75