
Abstract
With the advancement in Fused Filament Fabrication (FFF), its application is increasing widely across different industries such as aeronautical, biomedical, robotics, etc. The internal structure is becoming more complex and intricate with varying materials of reinforcement which are used to improve mechanical properties. Current measurement techniques like Digital Image Correlation (DIC) are non-destructive testing methods that do not provide enough information on the behaviour of internal microstructure for anisotropic FFF materials. Digital Volume Correlation (DVC) is non-destructive testing technique which provides full field internal 3D deformation and strain fields. Copper particle filled PLA samples manufactured using FFF method with 20, 40, 60 and 80 infill percentages were loaded in tension inside Micro-CT. X-rays were passed through the sample to get a volumetric dataset for different loadings. Using DVC method on the dataset, internal displacement and strain fields were generated for 20, 40, 60 and 80 infill percentage FFF sample.
Keywords
Introduction
With the increasing use of fused filament fabrication (FFF) in various industries, FFF has become the most widely used 3D printing process. 1 FFF is an additive manufacturing (AM) process where a filament is passed through a heated nozzle to form a solid body. Geometry is created from the layer-by-layer deposition of molten thermoplastic filament onto a build plate. FFF is widely used for part replacements, prototypes, moulds, and even load-bearing structures like in the field of aeronautics, 2 construction 3 and biomedicine.4–6 The materials commonly used are thermoplastic polymers like Polylactic Acid (PLA) or acrylonitrile butadiene styrene (ABS), both of which do not have high strength capacity. Various studies have been done to reinforce PLA or ABS with reinforced materials with fibres or metal particles to improve the strength further. 7 Haijun He et al. fabricated a 3D printed nanocomposite using the FFF technique; both the filament and the nanofibres were manufactured with PLA, the latter through electrospinning. 8 It was found that the tensile strength of 3d printed nanocomposite with 10.1% nanofibre content increased from 55.6 to 64.8 Mpa, an increase of 16.55%. Mohammadizadeh et al. studied on tensile strength of 3D printed fibre-reinforced nylon composites. 9 And it was found that carbon fibre (CF) reinforced 3D with a volume fraction of 60% has a tensile strength of 446.87 MPa, an increase of 2231% from the strength of Nylon and greater than the strength of Aluminium 6061. These studies clearly show how introducing reinforcements improve the strength of FFF structures.
3D printed parts with reinforced material require an understanding of internal microstructure for which Micro-Computed Tomography (Micro-CT) is ideally suited. Micro-CT is a non-destructive method that uses X-rays to image an object’s internal microstructure. 10 The X-ray beams are ejected through the X-ray tube towards the sample. The resulting image is based on the attenuation coefficient of the material. The attenuation coefficient is the measure of how easily beams are absorbed and transmitted with different intensities. 11 The detectors are placed at the end, which collects the transmitted X-rays, which is the 2D projection of the sample. The sample is rotated 180 or 360 degrees to acquire numerous projections from different angles. After the projections are collected, an image reconstruction process gives a stack of cross-sectional images of the sample. S Sommacal et al. used Micro-CT to understand the voids in a 3D printed carbon-reinforced PEEK sample and the filament feedstock. 12 The paper finds that the printing process had a minor effect in removing the voids present in the filaments. However, the depositional printing process greatly affected the internal void and fibre distribution microstructure. Yu et al. examined the microstructure of basalt fibre-reinforced PLA using Micro-CT. 13 The result shows the effect of printing direction on the voids formation and microstructural anisotropy, which can lead to customized elastic modulus depending upon the printing direction.
AM parts have complex structures with different printing parameters. Printing parameters include raster orientation, infill percentage, and layer height. Due to these factors, the mechanical properties of AM parts are highly dependent on printing parameters.14,15 To understand the behaviour of printing parameters on loading conditions, various surface measurement techniques like Digital Image Correlation (DIC) have been used.16,17 DIC is a contact-free optical measurement technique to measure a specimen’s outer surface deformation and strain fields. However, DIC has limitations. For example, surface deformation behaviour does not correlate with the internal microstructure of the FFF part. H Gonabadi et al. studied the effect of build orientation, infill density, and pattern using DIC. 18 They used a single camera to acquire images during tensile and shear testing. The authors found that 0° on-edge build orientation, a specimen manufactured on the edge of the sides with the plate support instead of a face, has better mechanical properties than other build orientations. But the mechanical behaviour for different infill patterns was similar. The increase in infill density leads to an increase in tensile properties in a quadratic manner. However, it does not depict the microscopic behaviour inside the sample, which is more prone to failure than the shell. Therefore, there is a need for full-field strain measurement, which correlates strain and deformation behaviour with the internal microstructure of FFF components.
Digital Volume Correlation (DVC) is an advanced measurement technique to measure the 3D deformation and strain of an object; DVC is similar to DIC but in a 3D space. DVC can use volumetric data such as X-ray CT or magnetic resonance imaging (MRI) data to measure deformation and strain.19,20 DVC was first developed by Bay et al. on a trabecular bone placed under compressed loading to study the internal strain. 21 DVC was initially used for biomechanical applications and later extended to solid mechanics. 19 Wang et al. used DVC for a porous 3D structure printed using stereolithography to find the deformation fields and relate the microstructure with the macrostructure. 22 Timpano et al. studied the full-field internal displacement and the strain tensor of 100% infill density FFF sample with +45/−45° raster orientation. 23 The result shows strains’ development along the printed sample’s internal raster. Despite initial work on the examination of FFF samples using the DVC method, further investigation using this technique is required.
The paper aims to study the effects of 20, 40, 60 and 80% infill percentages on a FFF part. This is achieved with the help of a Micro-CT machine and integrated testing stage to capture the cross-sectional images of a specimen under tensile loading of 50 N with a step loading of 150 N. After collecting Micro-CT image data, the DVC method will correlate different infill percentages to map full-field volumetric deformation and strain fields. The study will provide great insight into the complex structure of FFF, and the relation of microstructure with macrostructure behaviour can be established. Further, it can support validating Finite Element Analysis models for FFF specimens.
Methodology
3D printing
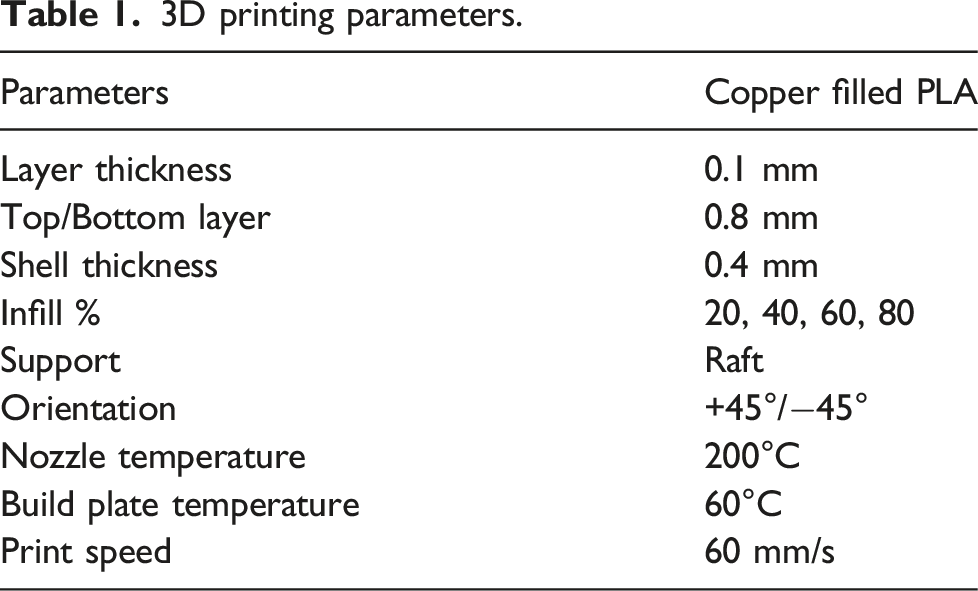
A modified ASTM D638-14 type V, as shown in Figure 1(a), was modelled for the given analysis. A solid model is generated using the given dimensions in CAD software (Solidworks 2020, Dassault Systèmes, France). Then the file is further imported into a 3D printing software (Prusa Slicer 2.2.0, Czech Republic) to define printing parameters like infill percentage and layer thickness described below in Table 1. Based on the parameters, specimens with 20, 40, 60 and 80 infill percentages are printed using an open-source 3D printer (Prusa i3 MK2, Czech Republic) by FFF. The filament used for printing is copper metal particle reinforced PLA (Metal filled PLA, CCTree-Mech Solutions LTD, Concord, Ontario). Figure 1(b) describes the cross-sectional view of the specimen and Figure 1(c) highlights the internal raster orientation between 20, 40, 60 and 80 infill percentages. (a) Modified ASTM D638-14 type V Dimensions (b) shows the cross-section of geometry, which includes shell, upper/bottom layer and infill region (c) Infill pattern of (i) 20% (ii) 40% (iii) 60% (iv) 80%. 3D printing parameters.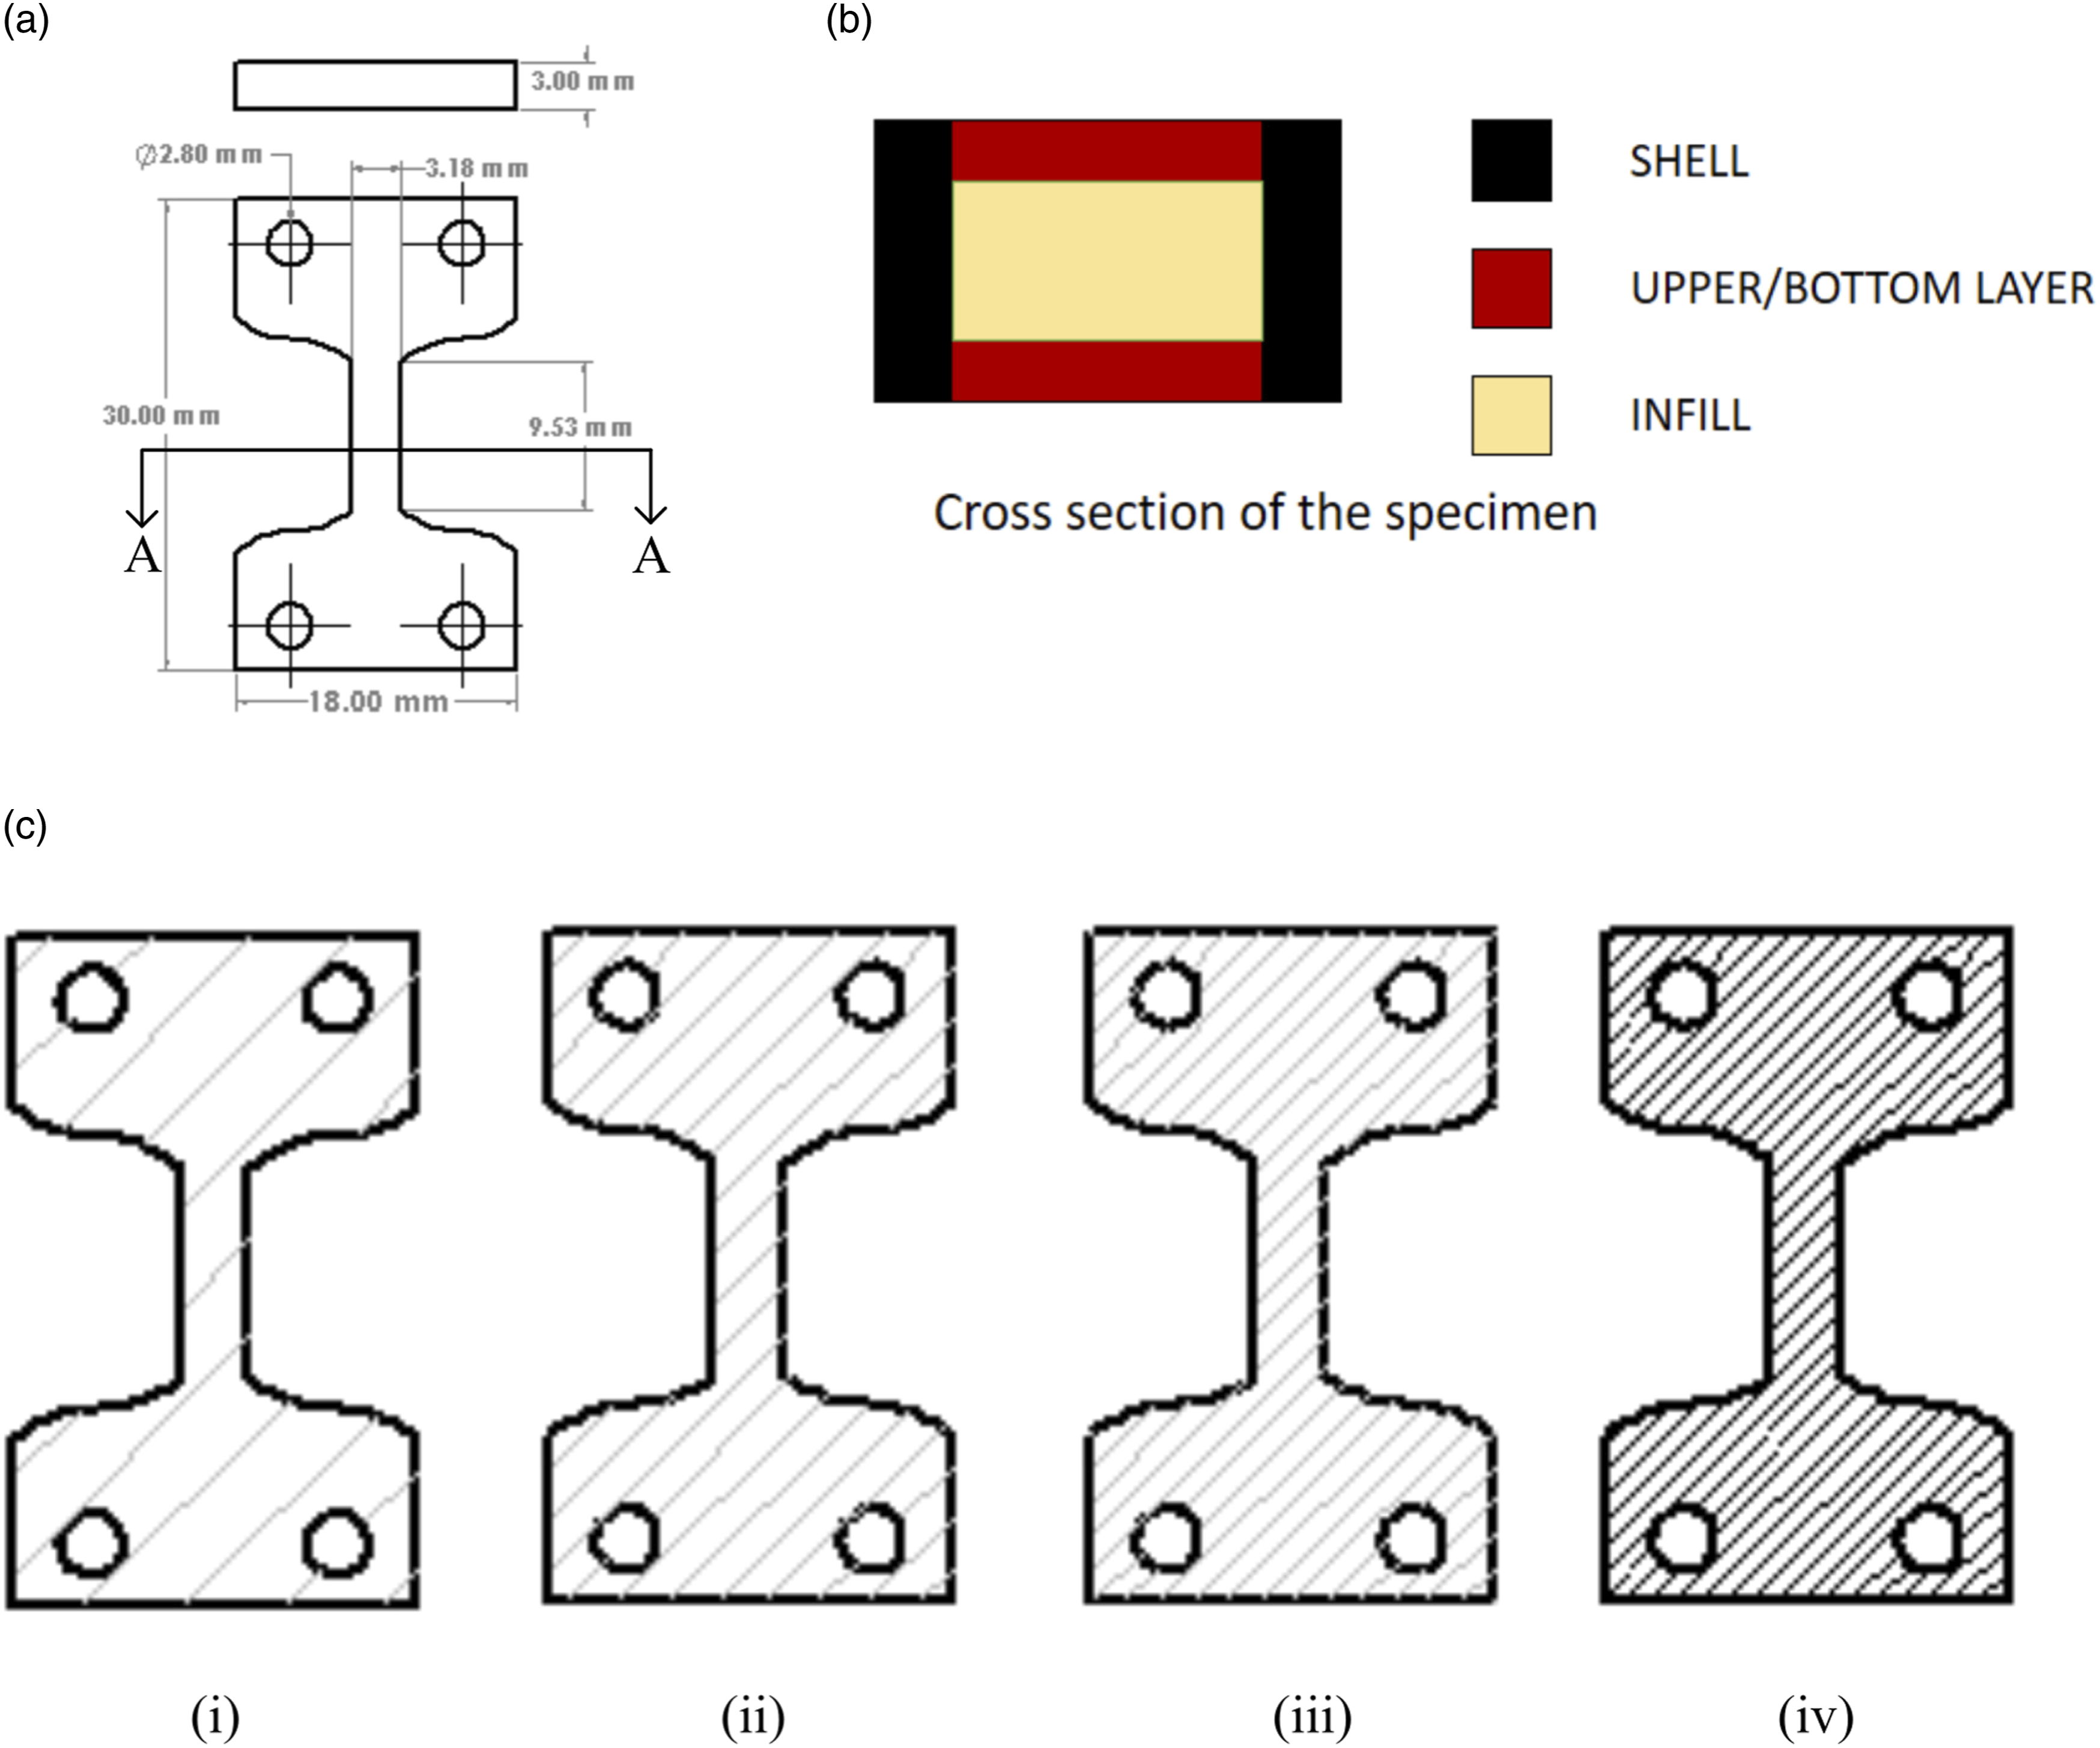
Microscopic image
A magnified image of a 3D printed part section with infill patterns was captured using a microscope (Elikliv DM4, China). Cross-section images were captured to verify the Micro-CT results and to provide initial insights into the cross-section of the FFF components. The narrow section of the structure with a 60% grid infill pattern was captured, as shown in Figure 2(a). However, only a single image of the infill pattern was captured. The image was first converted into an 8-bit grayscale image, and using ImageJ (National Institutes of Health, Bethesda, Maryland, USA) ROI manager, the pore boundary was drawn manually. Further, using the overlay and mask in-built functions, the final image with pores in the white and solid region in black was generated, as shown in Figure 2(b). The porosity of the 2D image was calculated for a 60% grid infill pattern using image processing software CTAN (1.16, Bruker, Belgium). Steps for processing image (a) Captured microscopic image of 60% infill part (b) Final masked image for calculating porosity.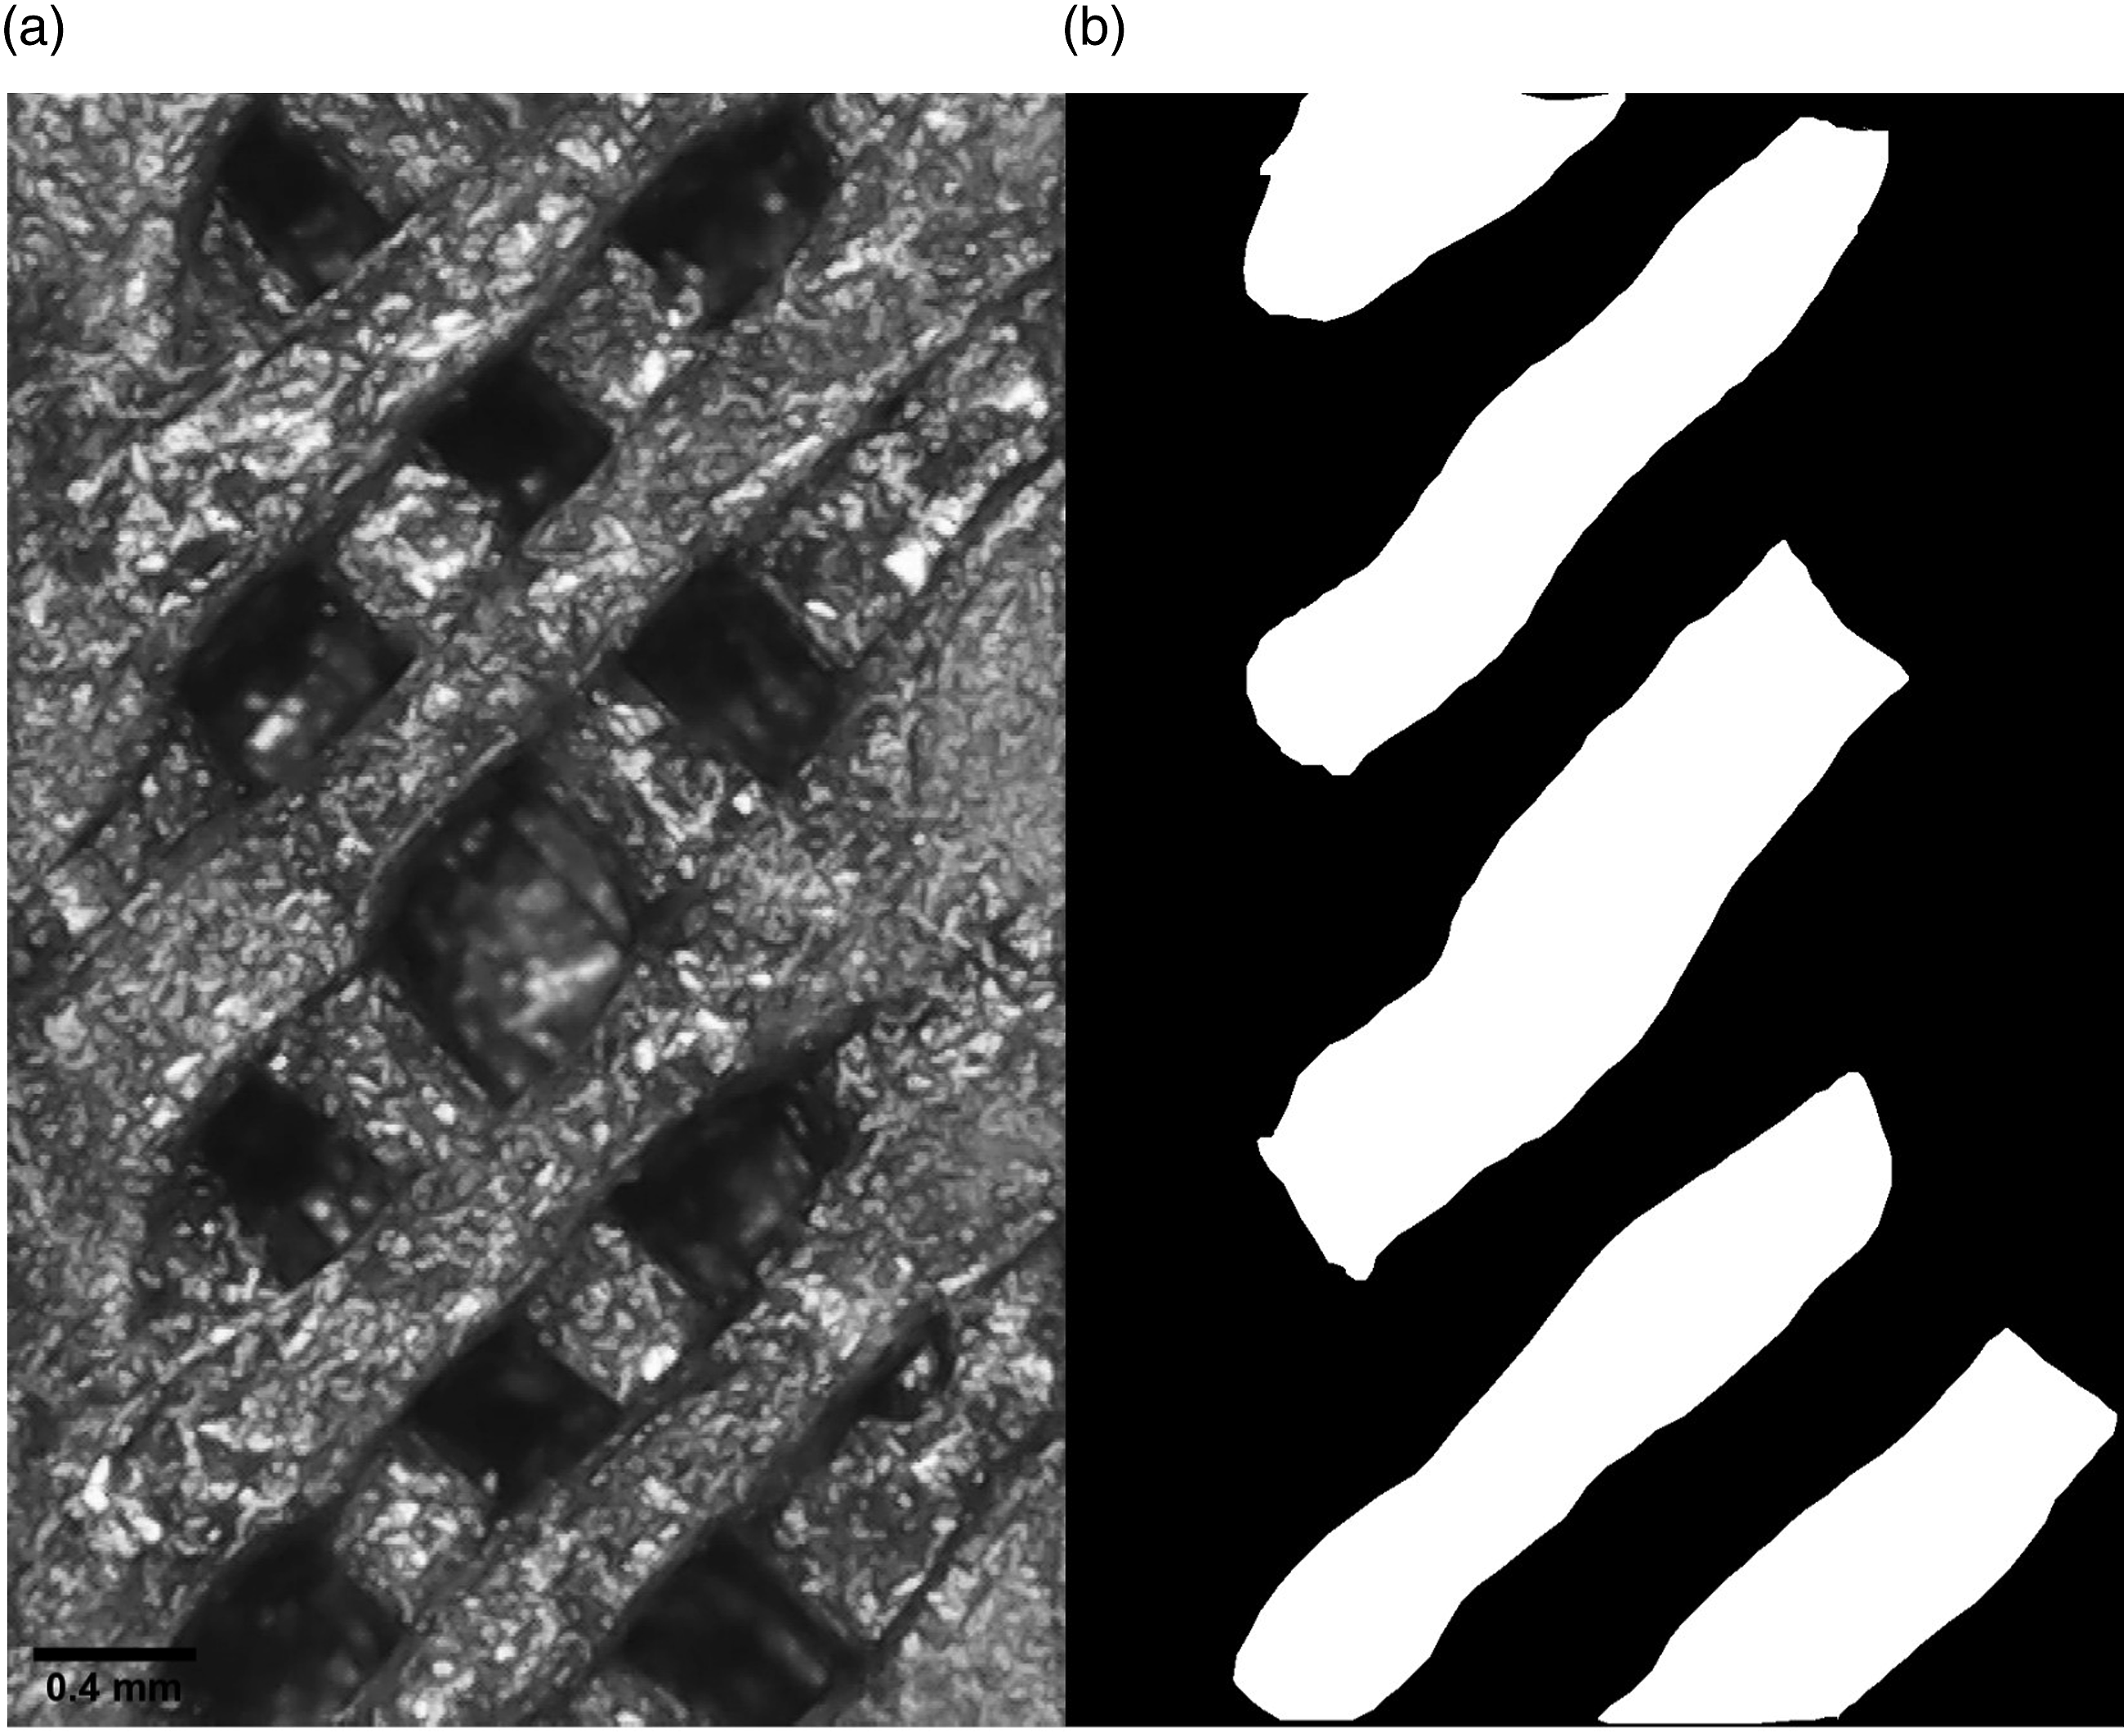
Micro-CT scans
Micro-CT scan parameters.
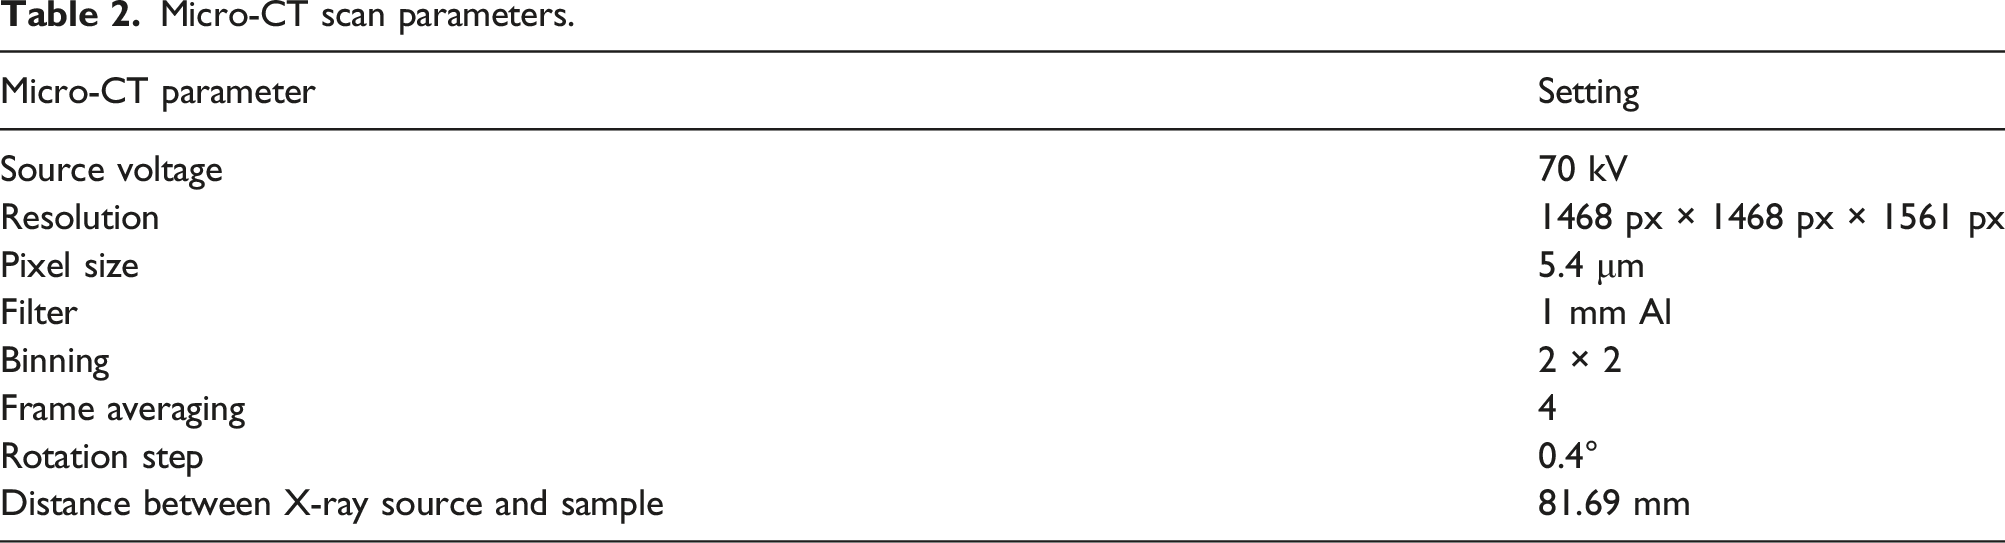
Material Testing Stage (440 N integrated test stage, MTS2, Bruker, Belgium) parameters are adjusted after setting up the specification of scans. First, the load cell platen is fully extended. The sample is loaded into the sample holder, and then the sample holder is placed over the chuck in MTS, as shown in Figure 3. The MTS is operated in tensile mode for the in-situ test, and the load is increased slightly. Batch scanning is done to obtain multiple scans of the same object during deformation. A preload of 50 N was applied so that the sample remained rigid, and a step load of 150 N was applied. A loading rate of 4 mm/s was used to apply load to the test samples, and a delay of 180 s was used to ensure consistent results between loading steps. Setup view of the material testing stage (MTS) inside the Micro-CT.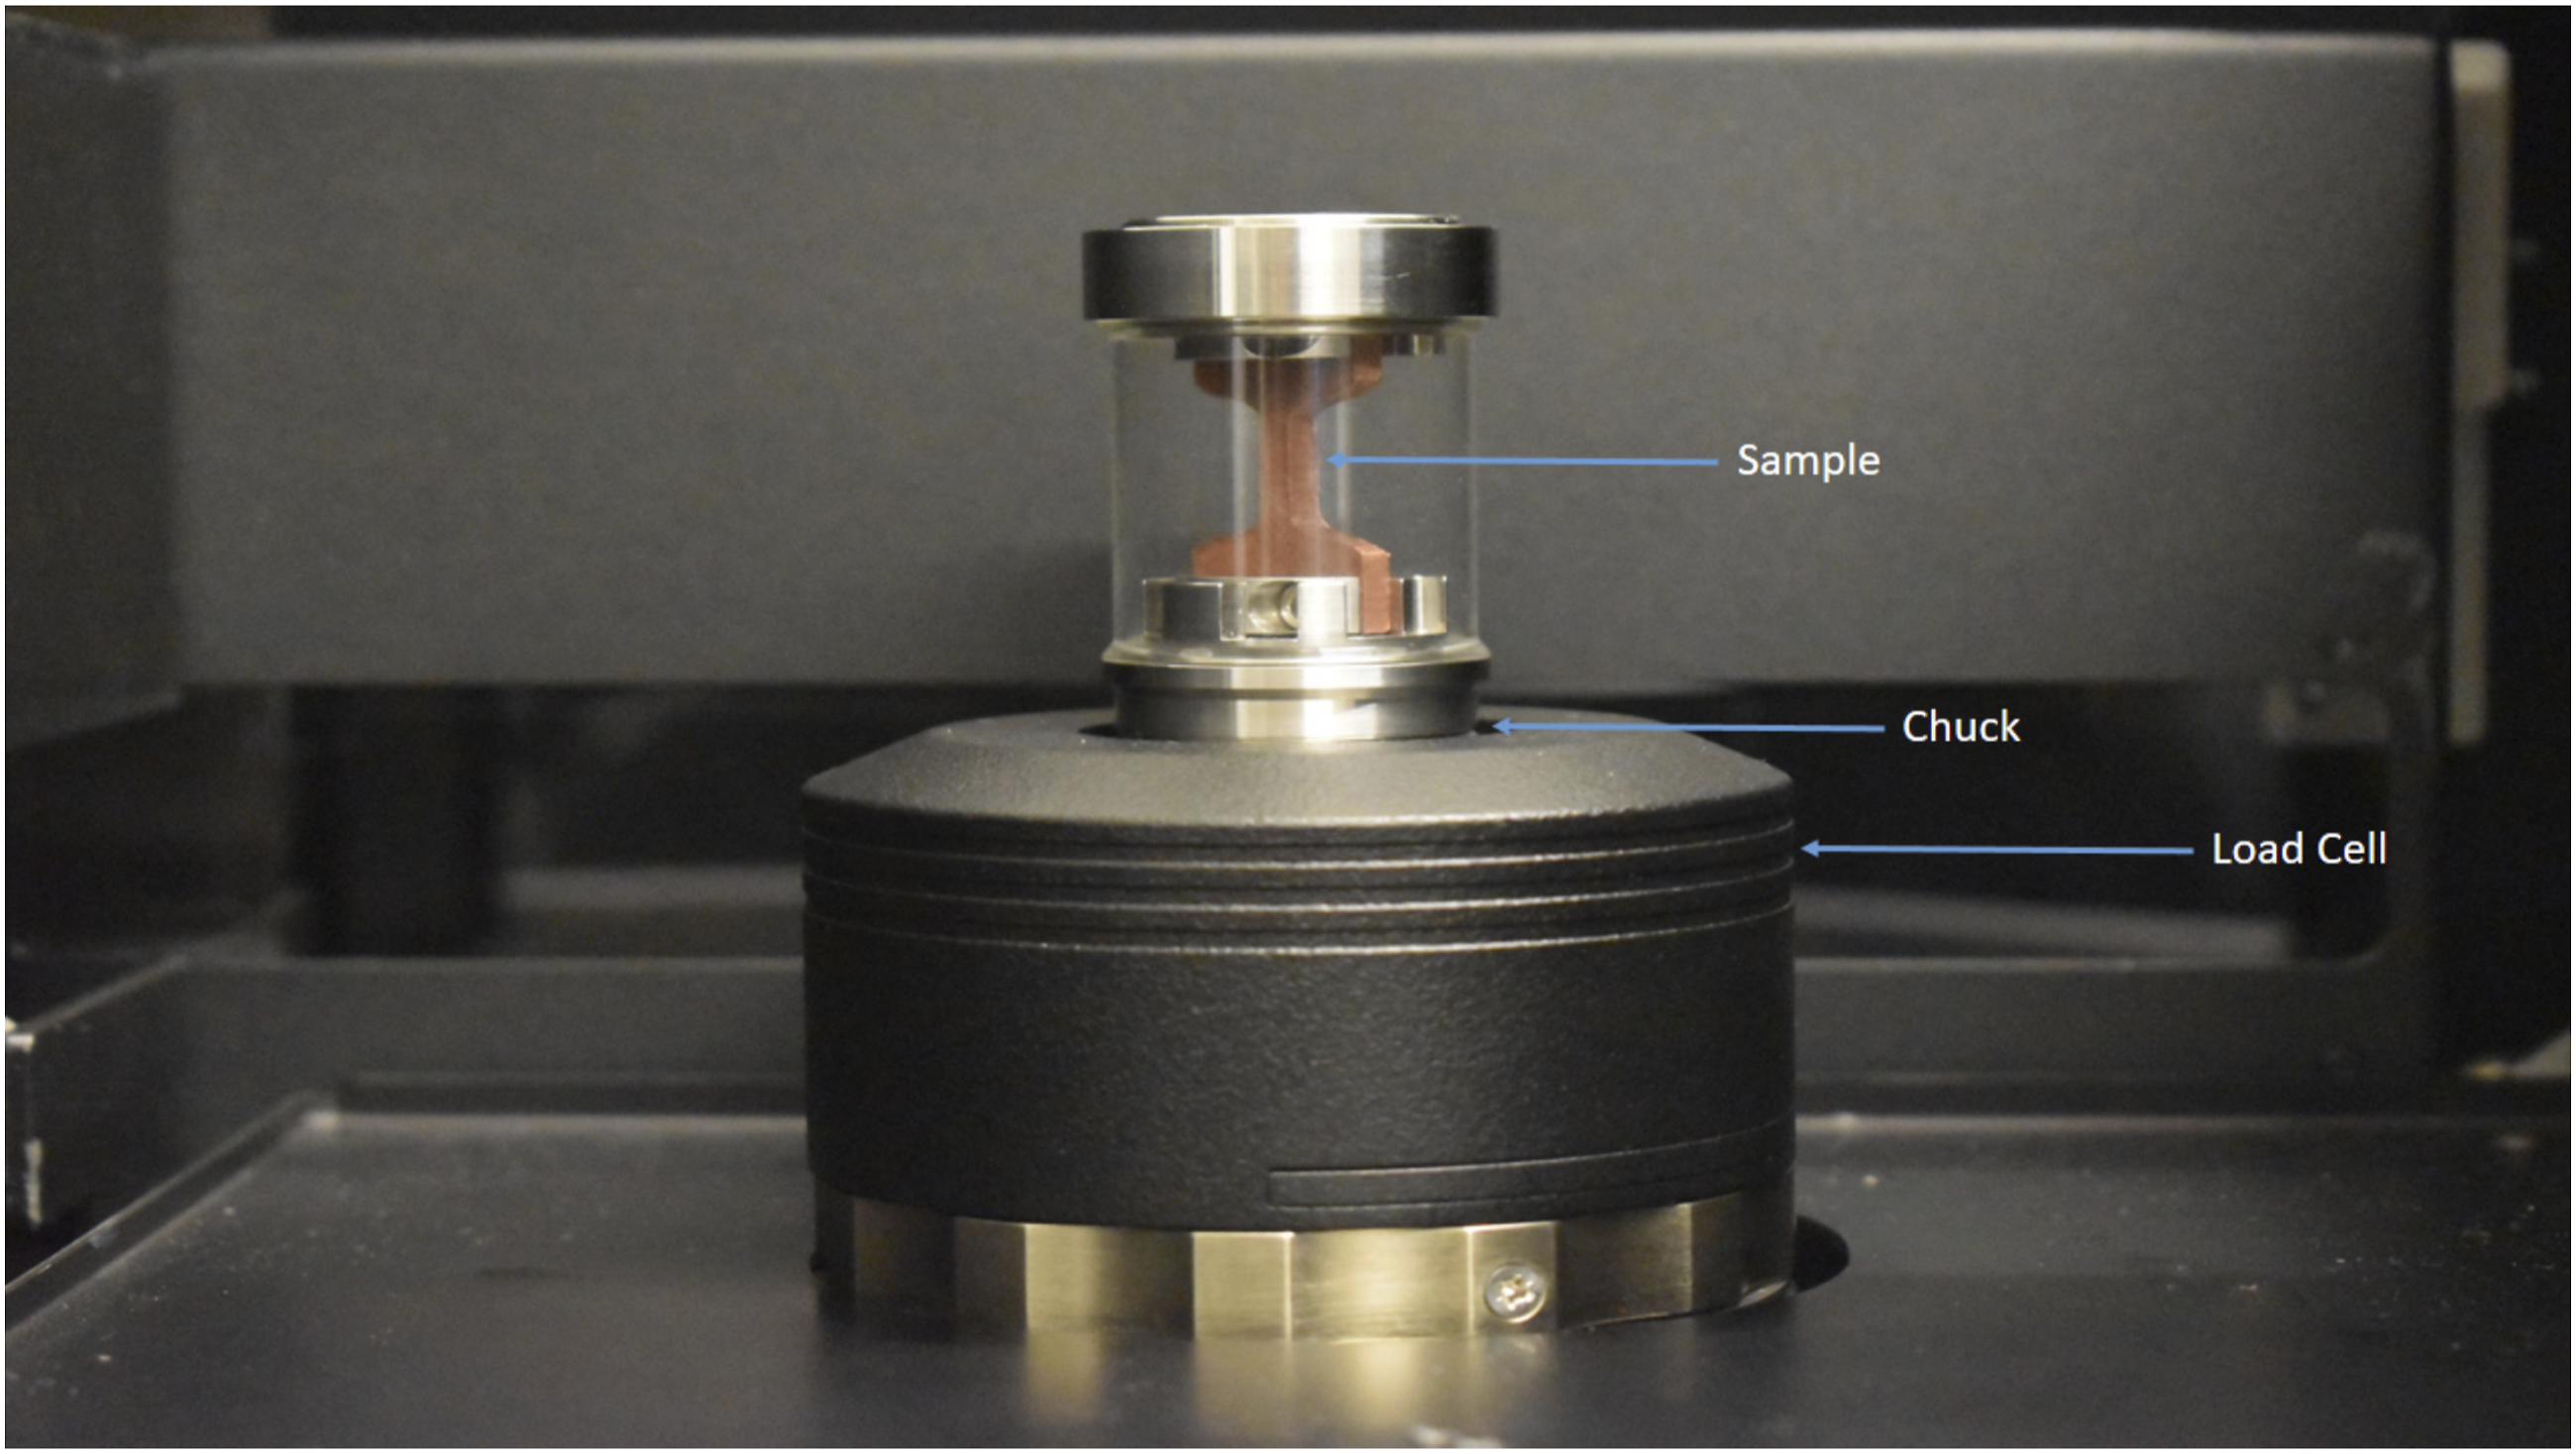
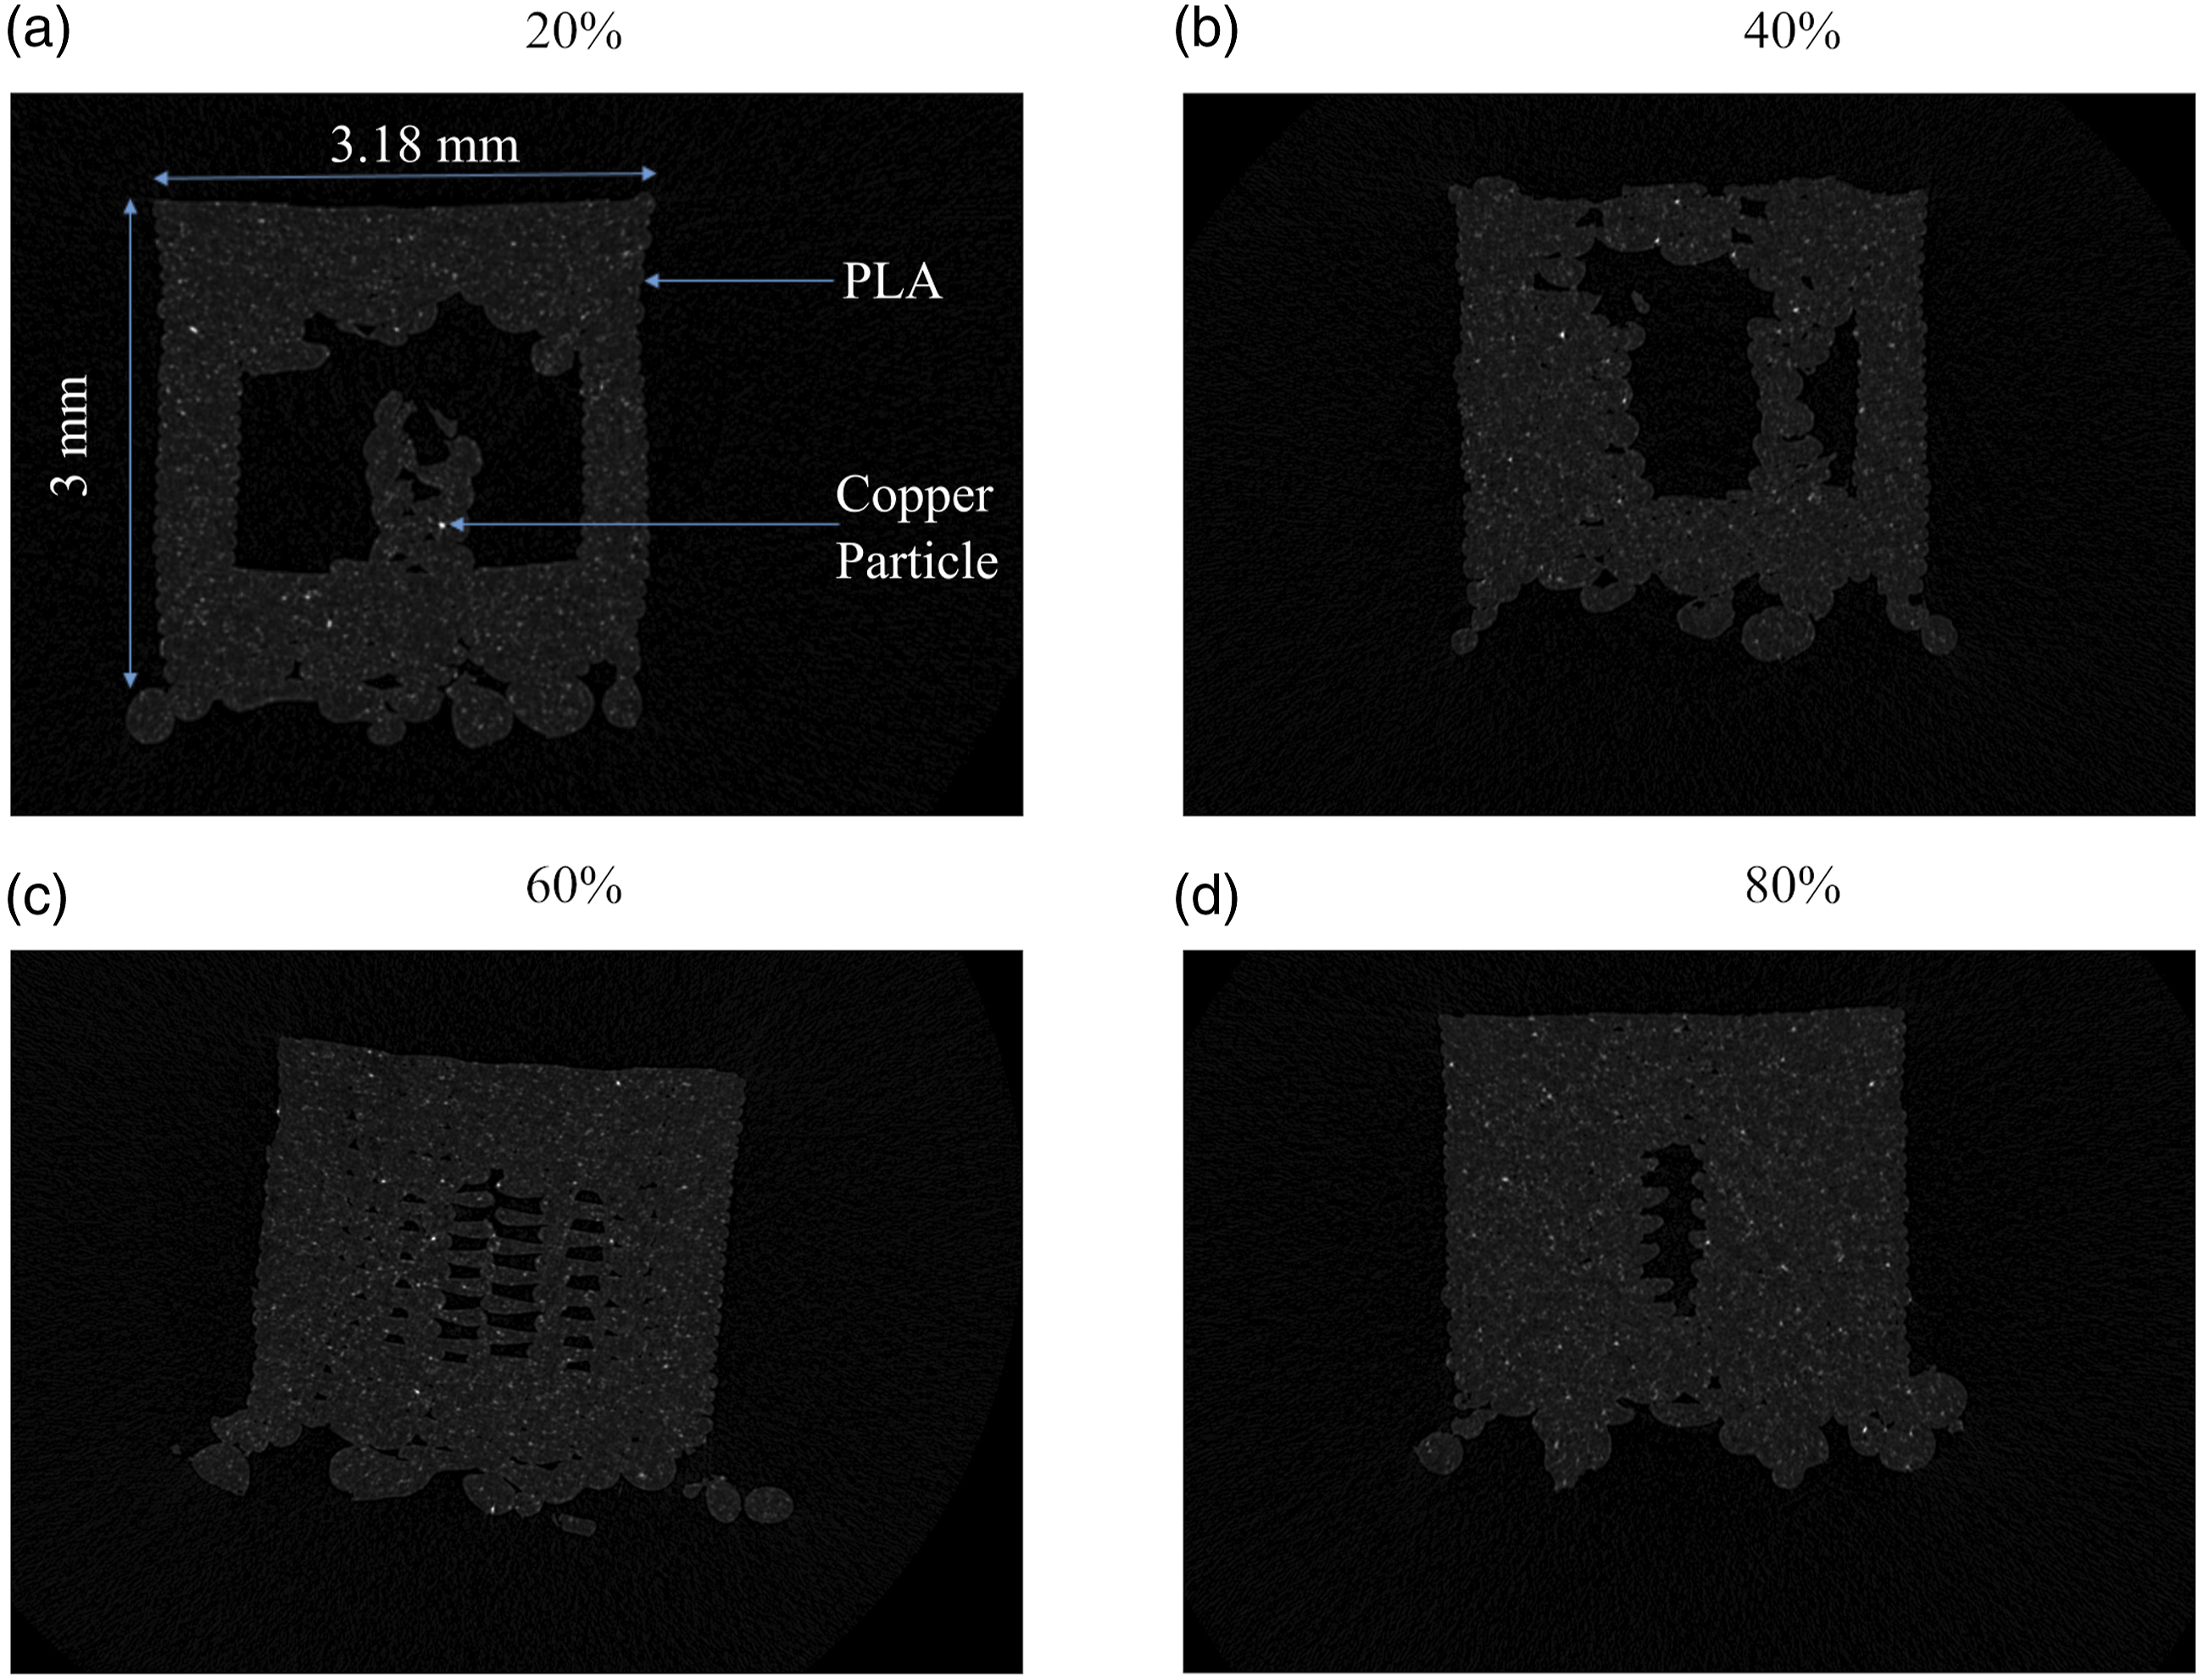
After the scans, the reconstruction of Micro-CT data begins. Reconstruction software (Nrecon version 1.7.1.0, Bruker, Belgium) processes and reconstructs the acquired images. Various filters can be applied based on the artifacts to remove them. Ring artifact correction of 4 and beam hardening correction of 50% was used. Figure 4 shows the reconstruction of Micro-CT data from the specimen. The small volume of interest (VOI) region is captured and reconstructed to get the top view slices of VOI. It shows how the slice plane is generated from the specimen, which would help to understand Figure 5. Figure 5 shows a cross-sectional view of specimens of 20, 40, 60 and 80 infill percentages. This allows for investigating specimen characteristics such as air gap, material distribution, and particle distribution. This figure also shows the different raster formations in different infill percentages. Image registration software (DataViewer, Bruker, Belgium) was used to reorient the image boundary line with the axis. The software takes the cross-sectional image stack as input and provides three views of the sample, i.e., Coronal, Sagittal and Transverse plane. It allows reorienting of the image in one plane and automatically reorients in another plane. Schematic of Image reconstruction from Micro-CT. Cross-sectional images using micro-CT of 3D printed dog bone structure with (a) 20%, (b) 40%, (c) 60%, and (d) 80% infill.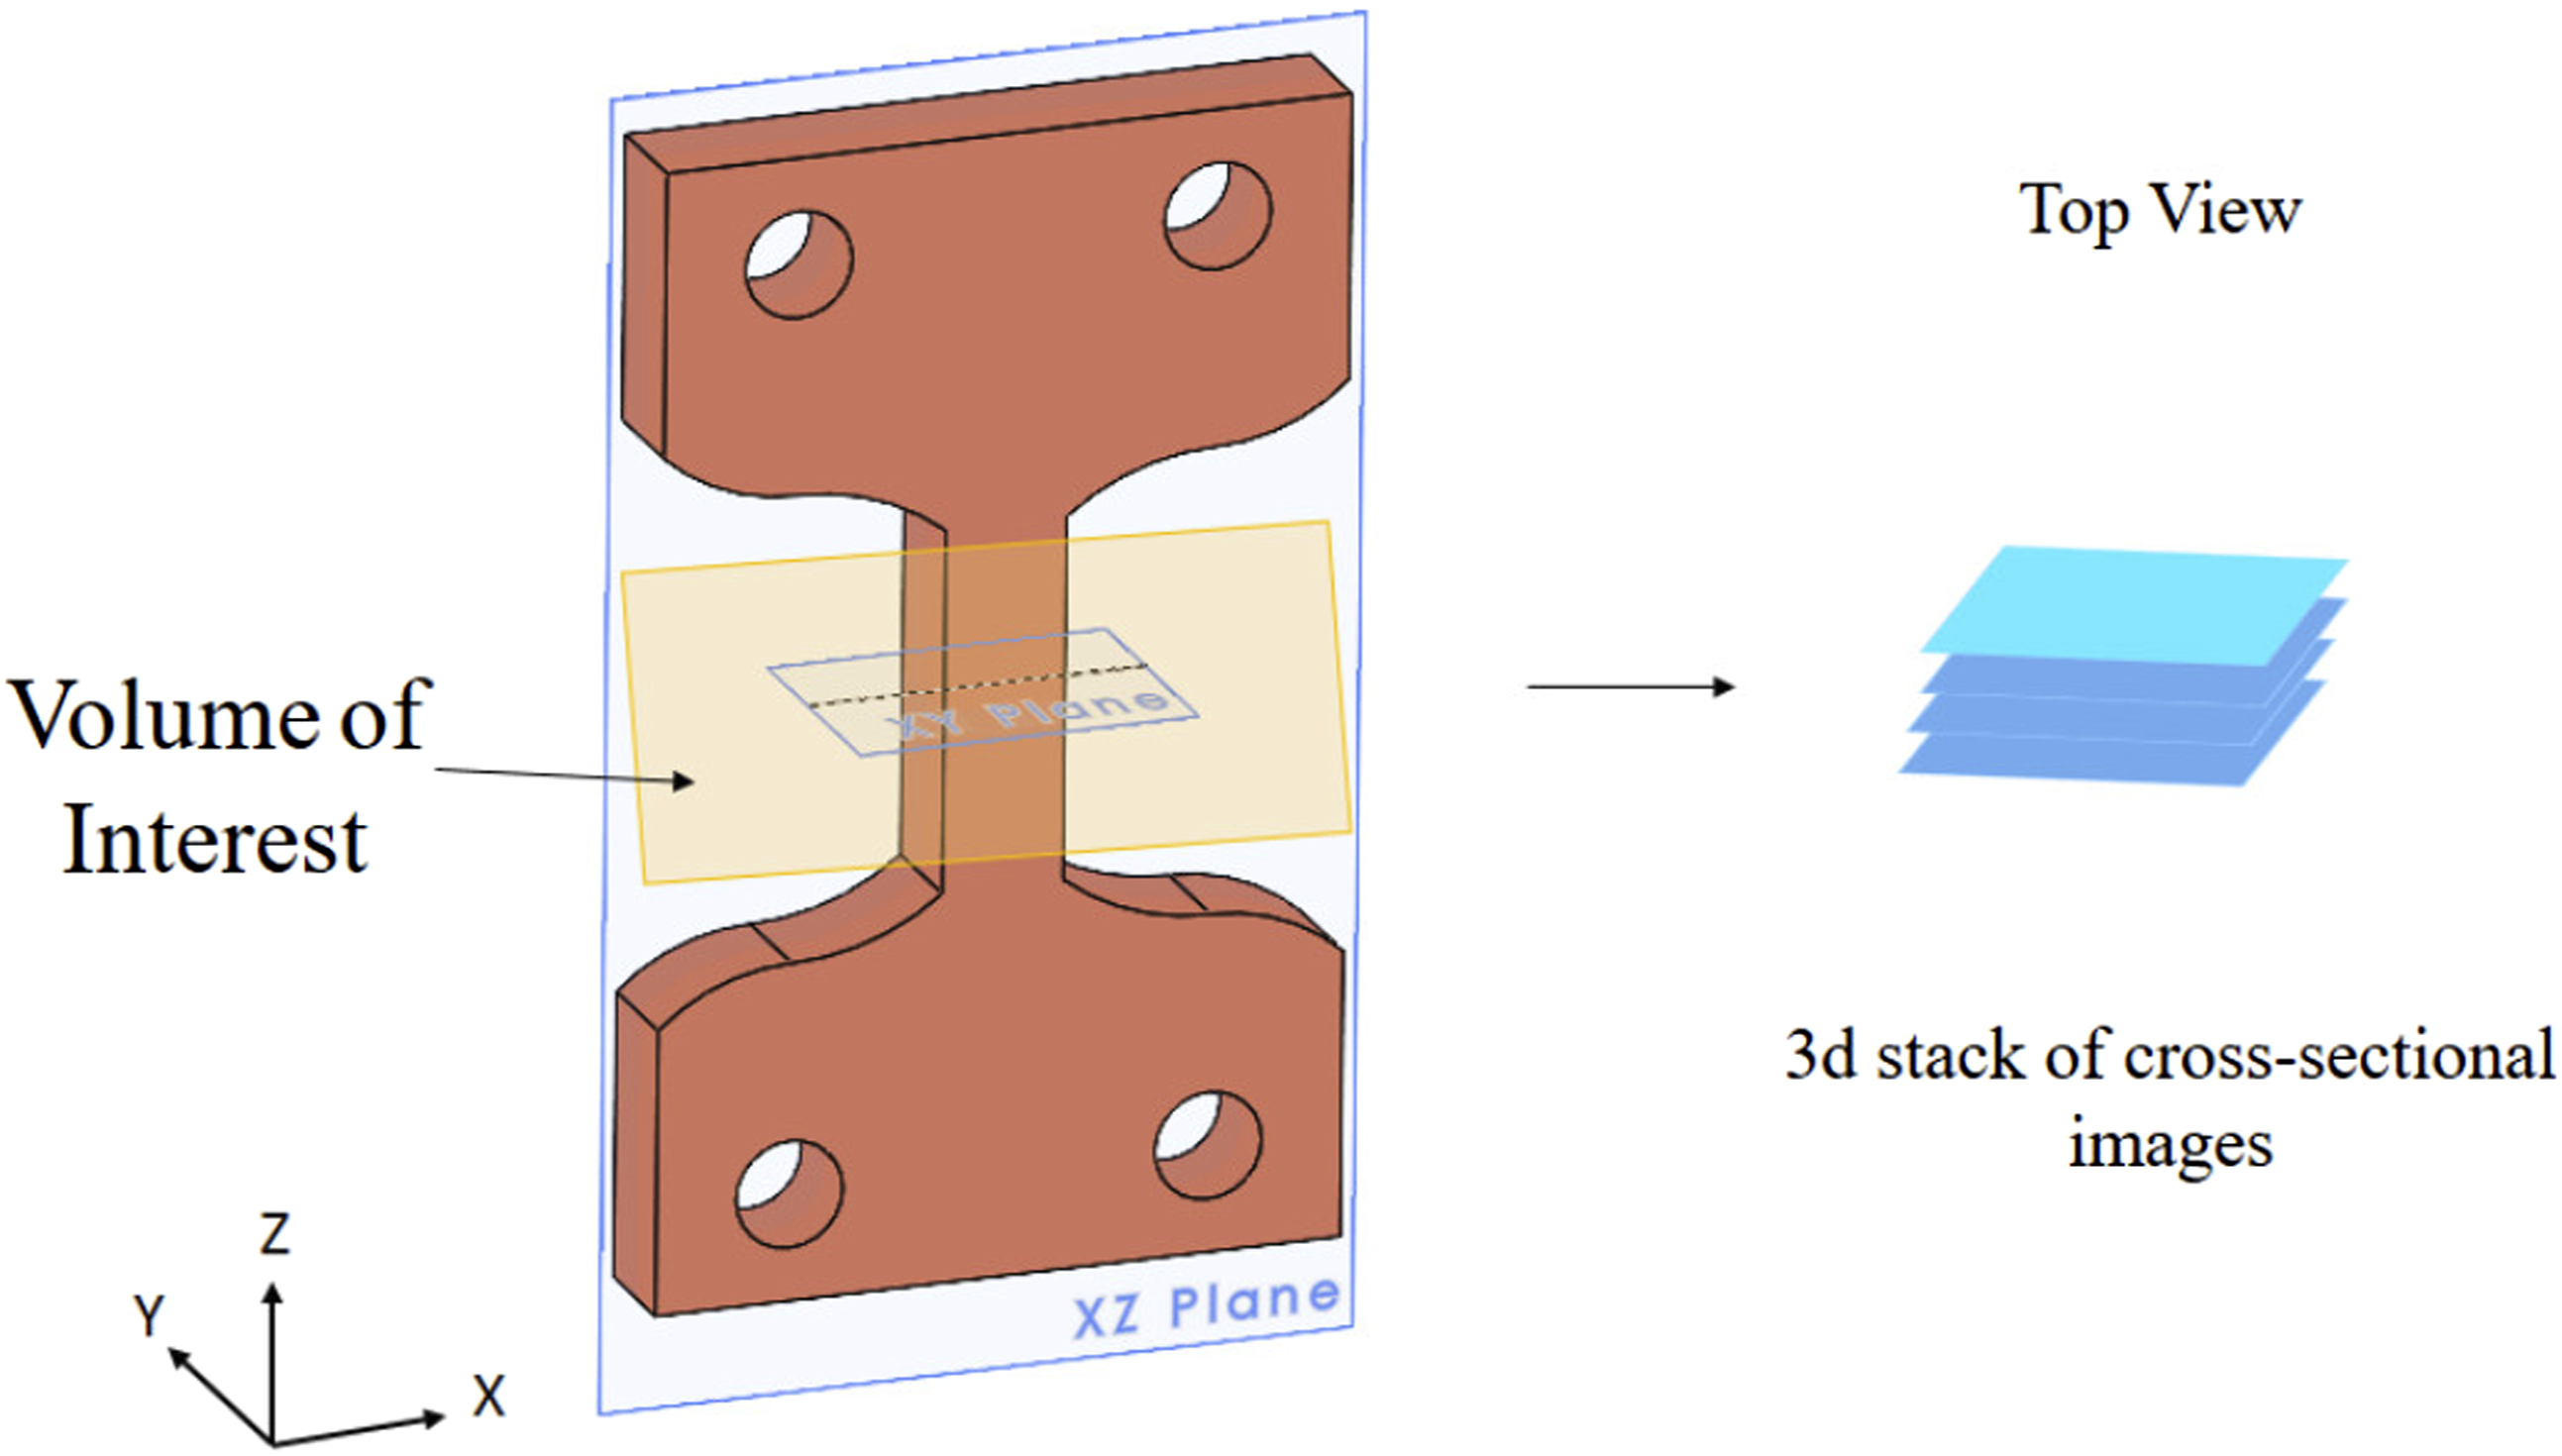
Porosity and particle distribution analysis
The acquired images were pre-processed to understand the samples' particle size distribution and porosity. The above results will help in the analysis of the specimen. CTAn (Bruker, Belgium) software was used for all the image pre-processing. For the porosity analysis, the images are reconstructed to obtain the Front View using Dataviewer software, as seen in Figure 6. The front view allows the sample porosity to be investigated in a similar orientation to how the sample was manufactured. The front view makes it easier to process images and further distinguish between the shell and infill region. This shows the process of image reconstruction for further pre-processing analysis. The images are further sliced to get the front view and examine the only raster part for the analysis using software (Dataviewer, Bruker, Belgium), as seen in Figures 6 and 7(a). The image contains both the infill and shell region. The infill portion of the images was examined to obtain the porosity measurement. So, the region of interest is defined manually (denoted in red) to get the infill region, as shown in Figure 7(b). Then a median filter of radius 3 is applied to the region of interest to filter out noise, as seen in Figure 7(c), and then a threshold of 6 is used to obtain the final image, as shown in Figure 7(d). White is the region of material, and black is the porous area. A built-in “3D analysis module” in CTAn was used to find the porosity of the sample. Schematic of a 3D stack of resliced Images. This figure shows the volume of interest of the sample and the resulting image stack of the volume of interest. The dataset was then resliced to provide images in the front plane of the specimen. Processing steps for calculating porosity using Micro-CT images (a) Reconstruct the images for top view (b) ROI for infill region whose porosity calculation needs to be done (c) Median filter of three to clear out noise (d) Threshold of six to get the final image with porous region denoted by black.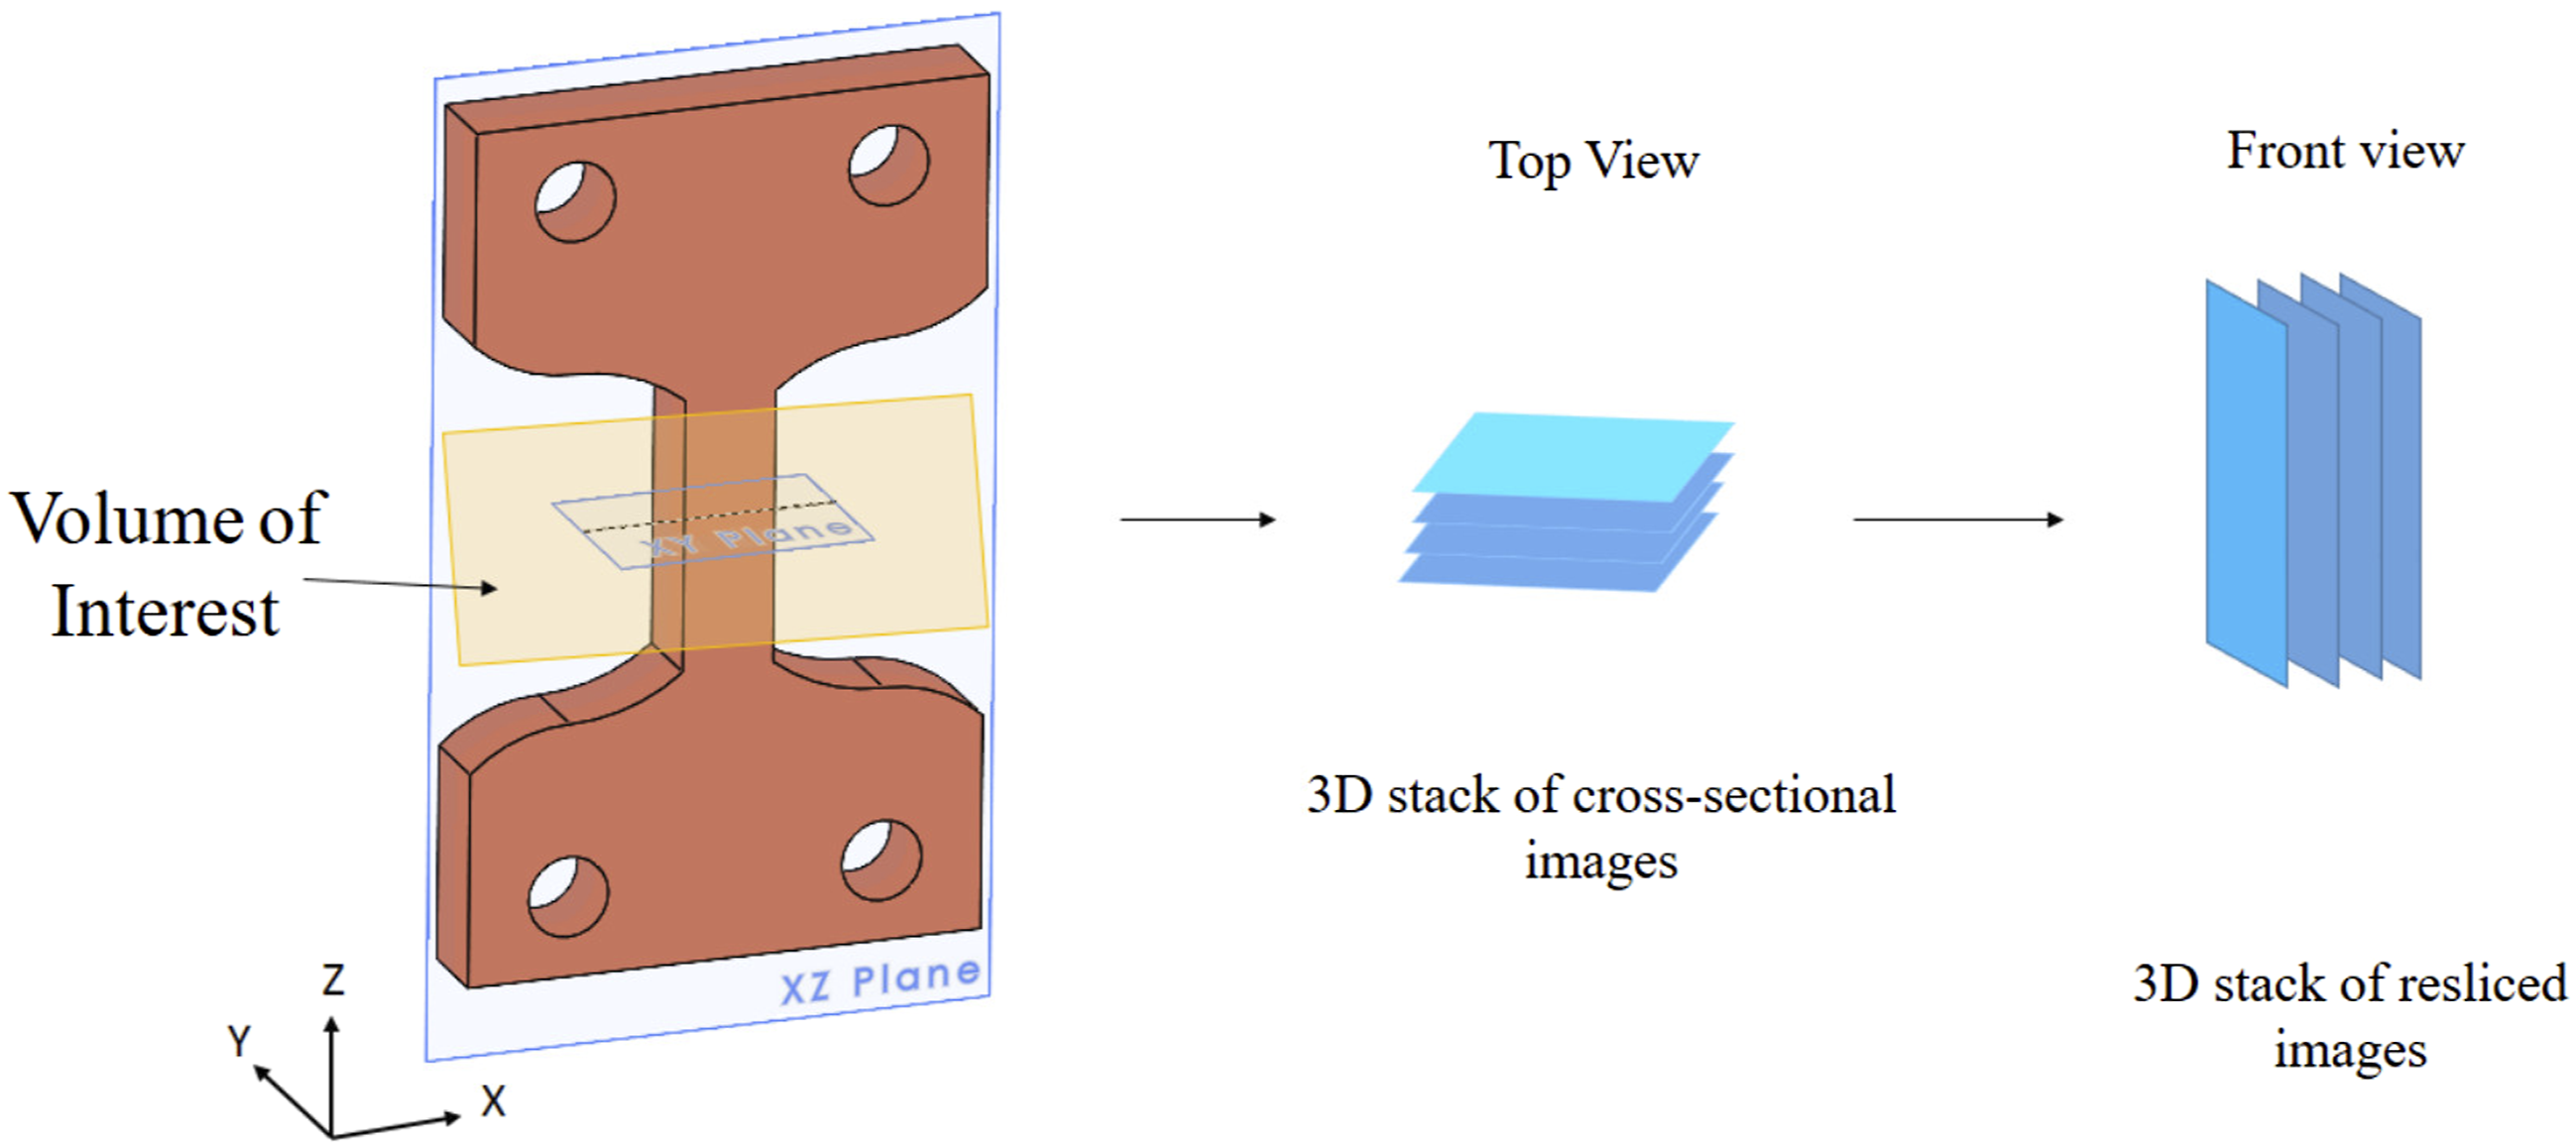
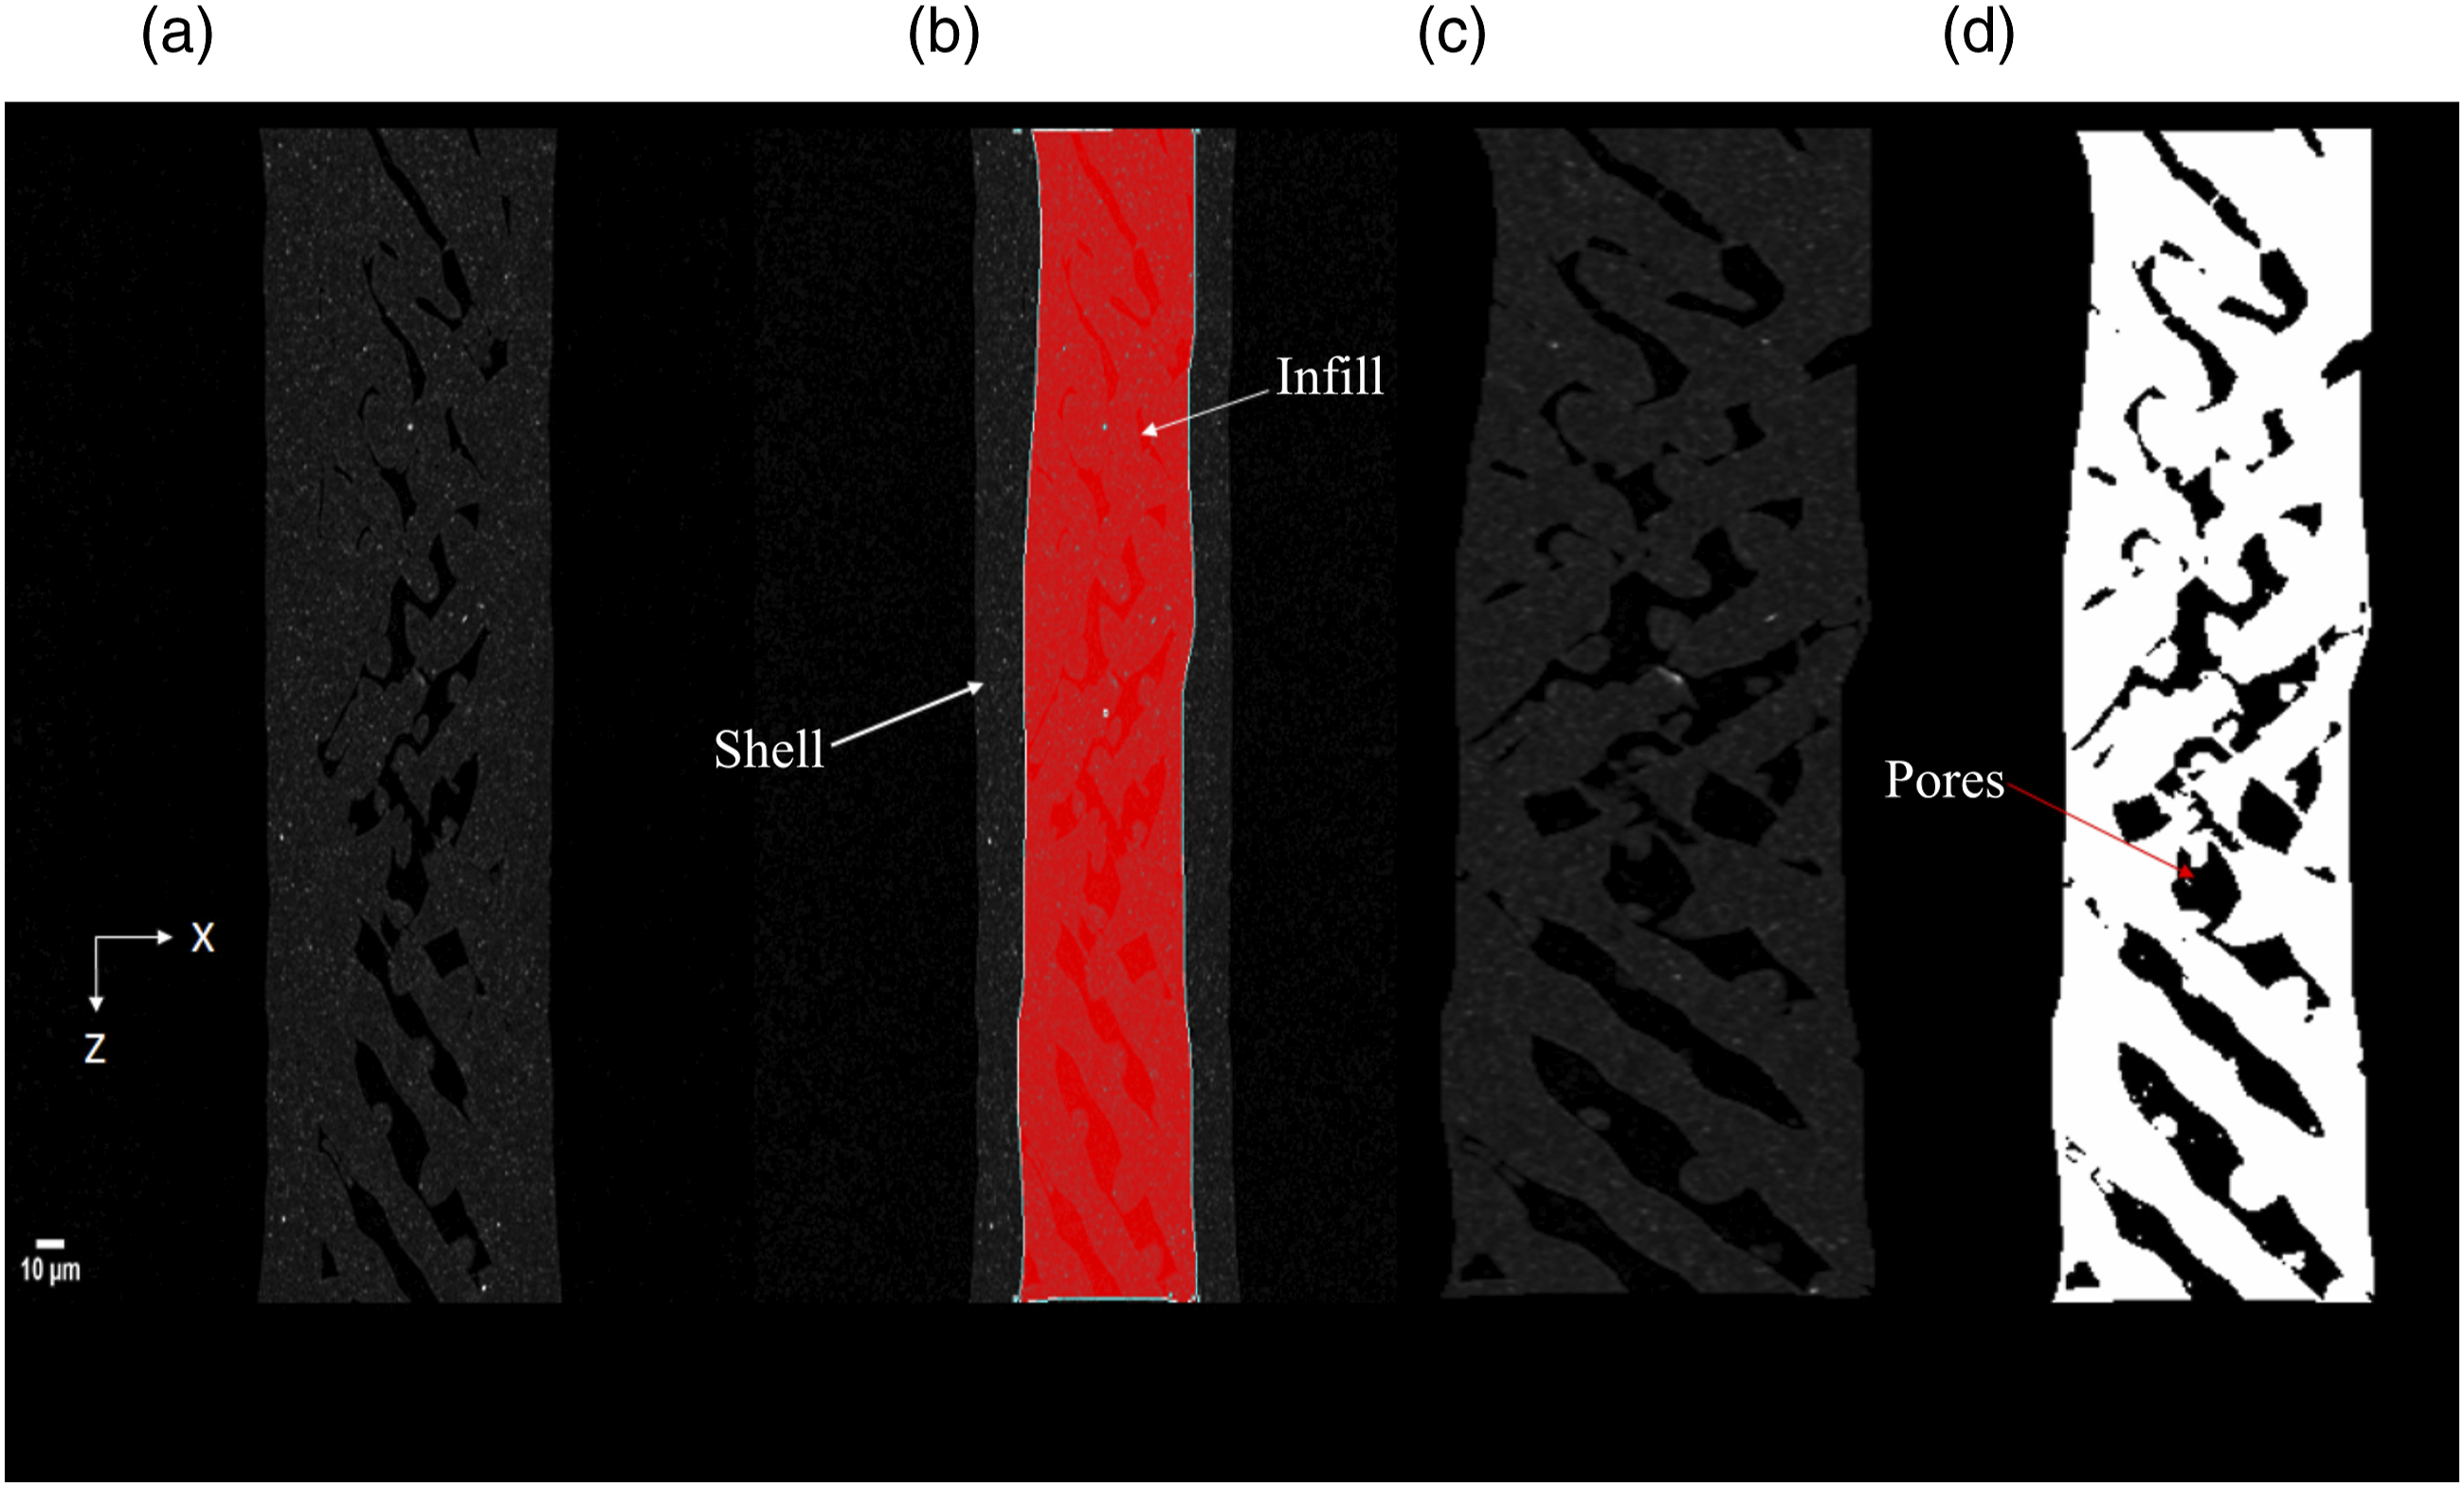
Figure 8 demonstrates the image processing steps for the FFF sample. Figure 8(a) shows the original image of the sample, Figure 8(b) shows the identified copper particles, and Figures 3–8(c) shows the PLA matrix material. A histogram was generated for the particle distribution, as shown in Figure 8(d). In general, 0 indicates porous spaces where X-rays did not hit the specimen, and 255 means 100% X-ray beams were either absorbed or deflected. The denser the material is, it is tended more toward 255 since absorption will be greater. The objective is to segment both PLA and copper material to find the sample’s porosity, particle size and count. Since copper has a higher density than PLA material, a threshold of 42 was applied. Therefore, the copper particles are represented as white, as shown in Figure 8(b). Different threshold range helps to provide a distribution of materials within the sample cross-sections. For example, a threshold range of 14 to 42 gave the PLA materials in white, as shown in Figures 3–8(c). The copper particle distribution was found using a built-in 3D particle analyzer. (a)Cross-sectional image 60% infill (b) Copper material distribution using a threshold of 42 (c) Threshold image showing PLA material in white colour (d)Histogram of the cross-sectional image.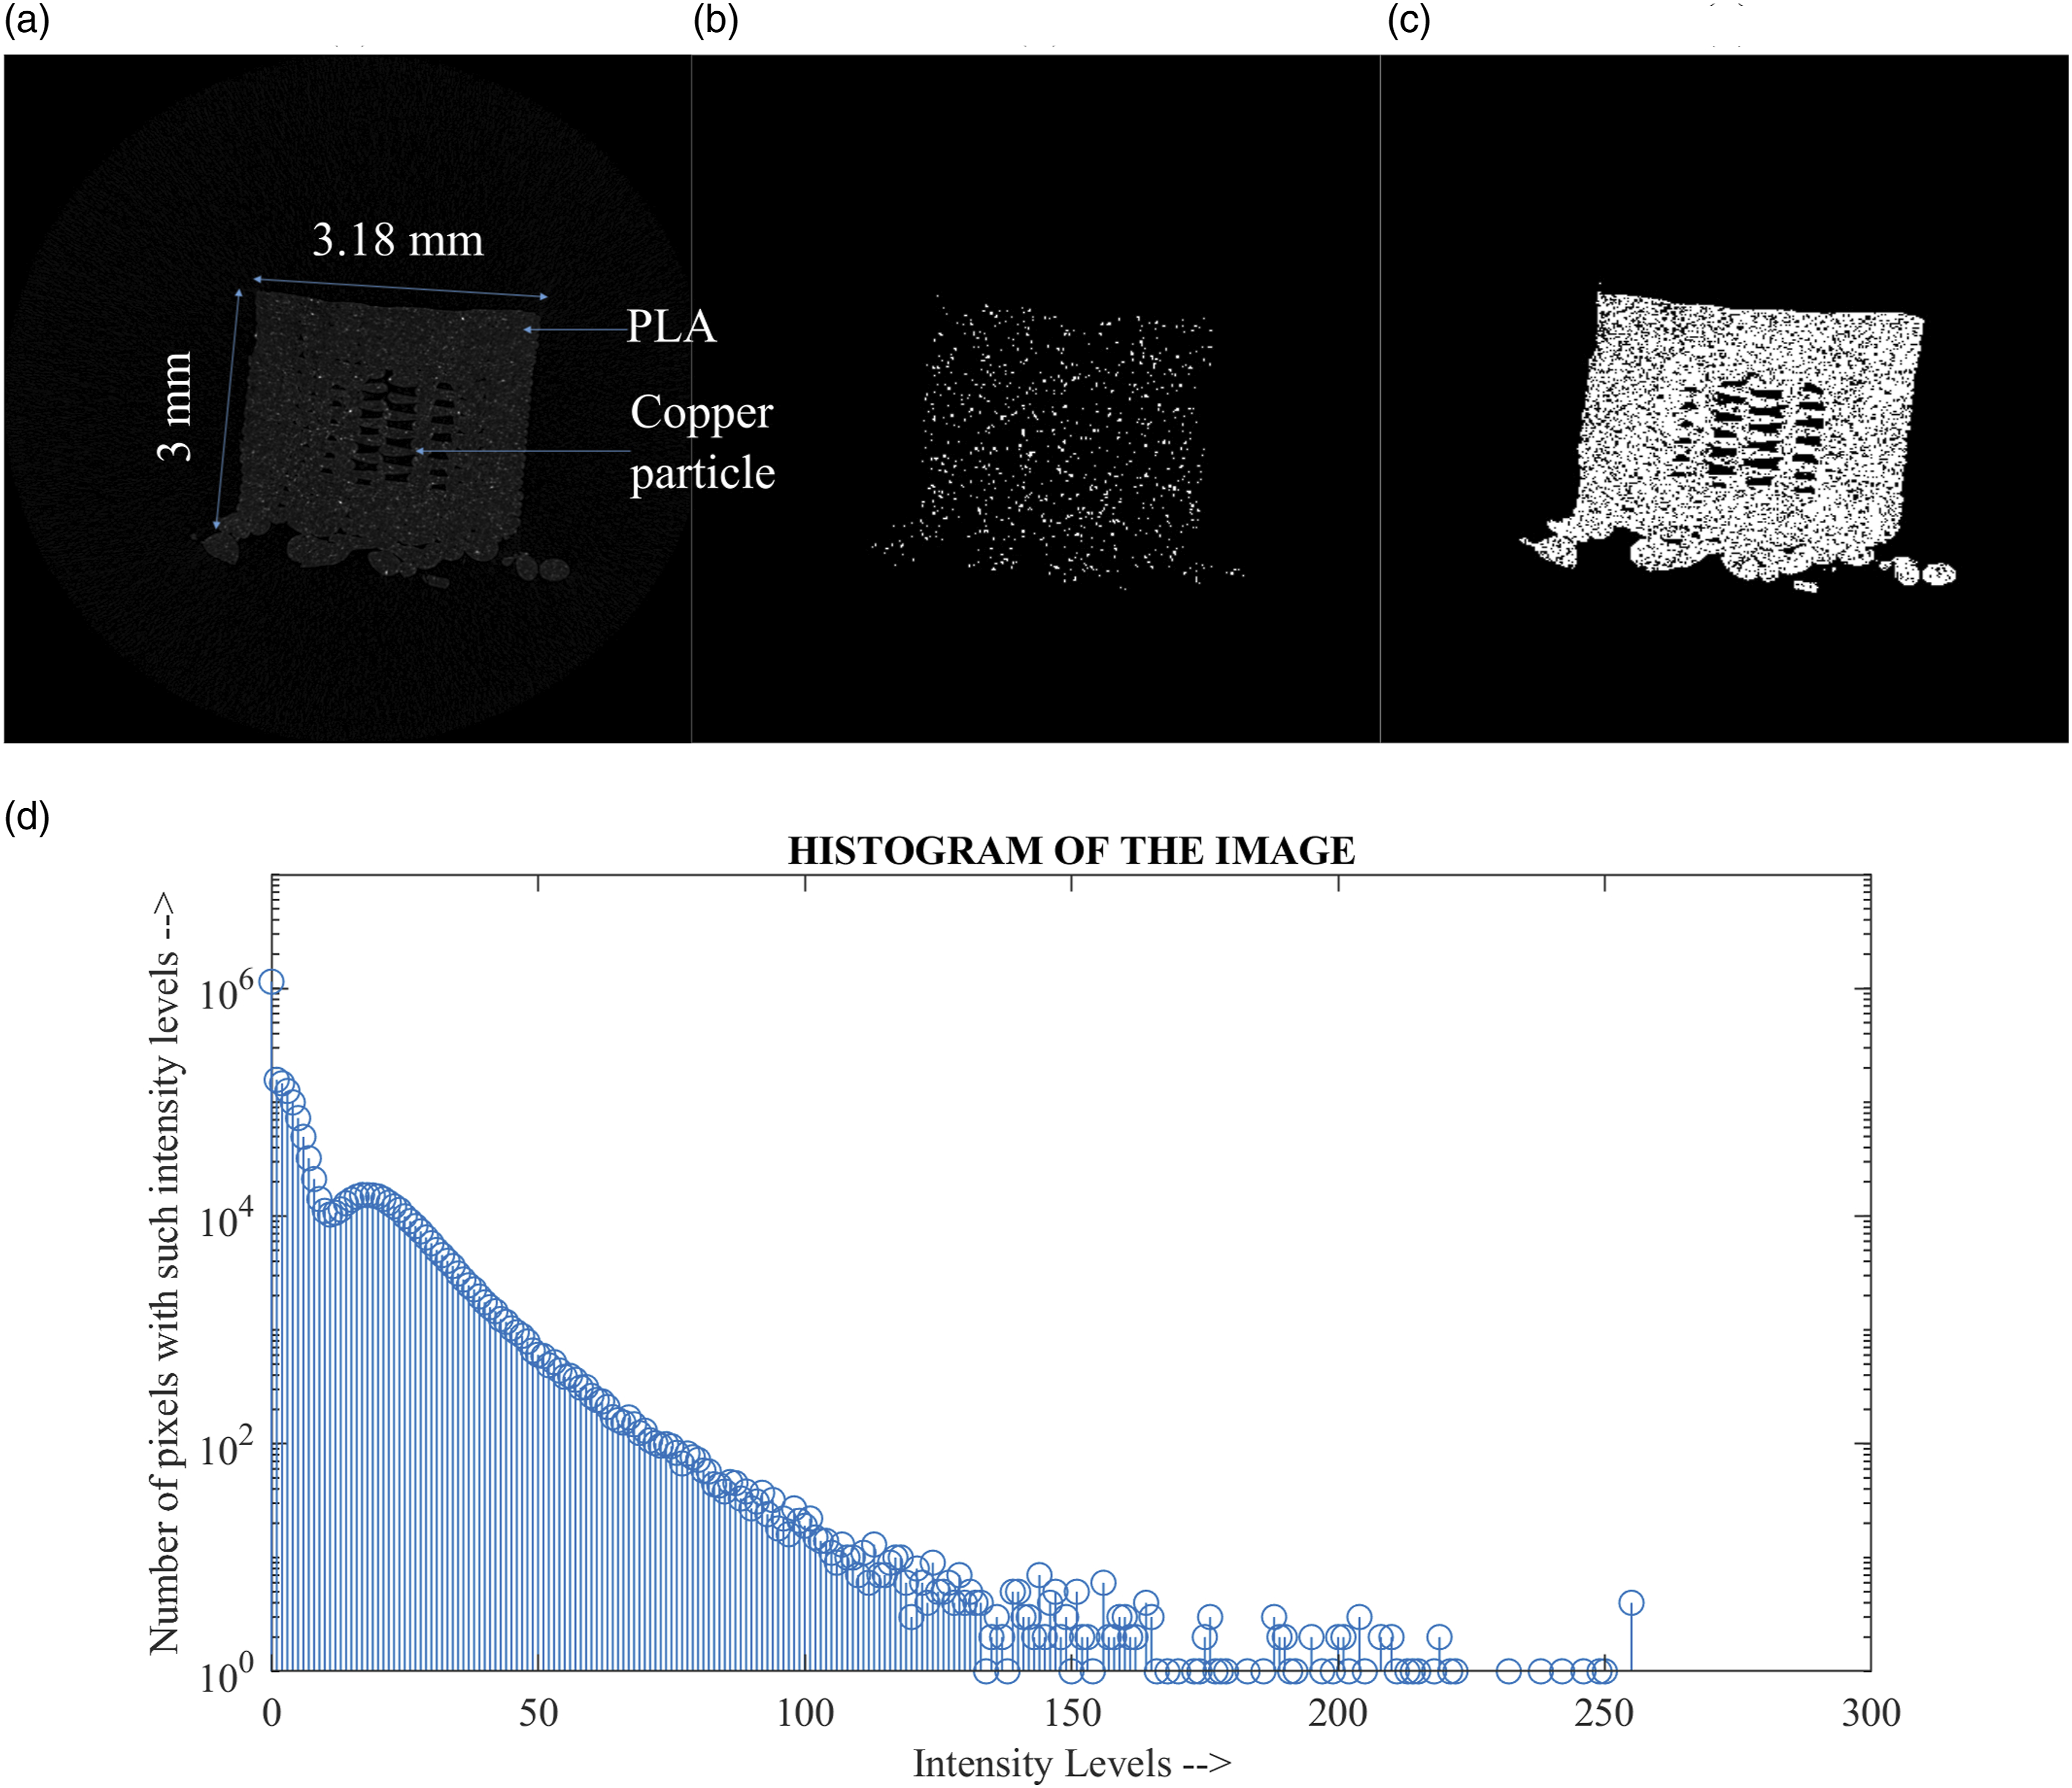
DVC analysis of FFF samples
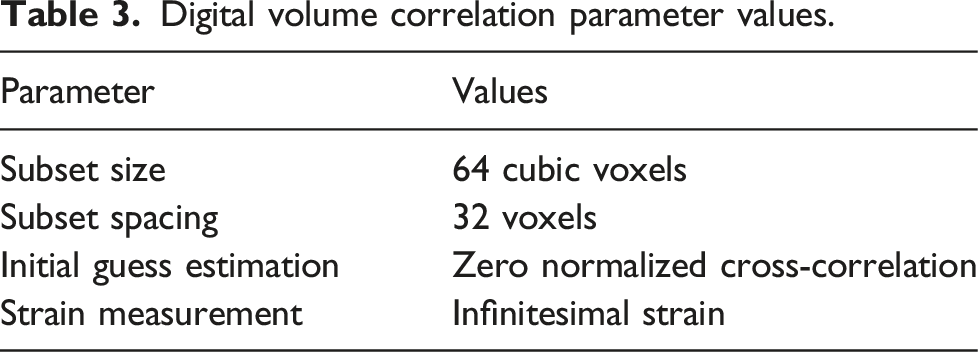
For DVC, a MATLAB-based program (ALDVC 1.0) was used. 24 The program compares the original and deformed images to find the 3D deformation and strain values of the specimen. A server computer (precision T5600, Dell, Round Rock, Texas) with a RAM of 112 GB and two Intel Xeon CPU E5-2680 2701 Mhz 8-core processors were used for DVC analysis.
Digital volume correlation parameter values.
Results and discussion
Porosity and particle distribution
From the pre-processing of the CT images, as shown in Figure 9(a) of 60% infill 3D printed part, it was found that the porosity is 33.97%, less than the expected porosity of 40%. This might be due to various reasons. The tolerance for the Prusa i3 mk2 printer is insufficient for printing the narrow section of the dogbone, which is just 2.38 mm in width. Also, it might be because of printing parameters like the printing speed or the printer’s nozzle size.25,26 The current study does not focus on the printing parameters and their optimization. Sofiane et al. worked with 100% infill 3D printed Nylon and found significant porosity variation across the samples using Micro-CT data analysis.
27
(a) Pore distribution on a resliced plane (b) Pore distribution of microscopic image.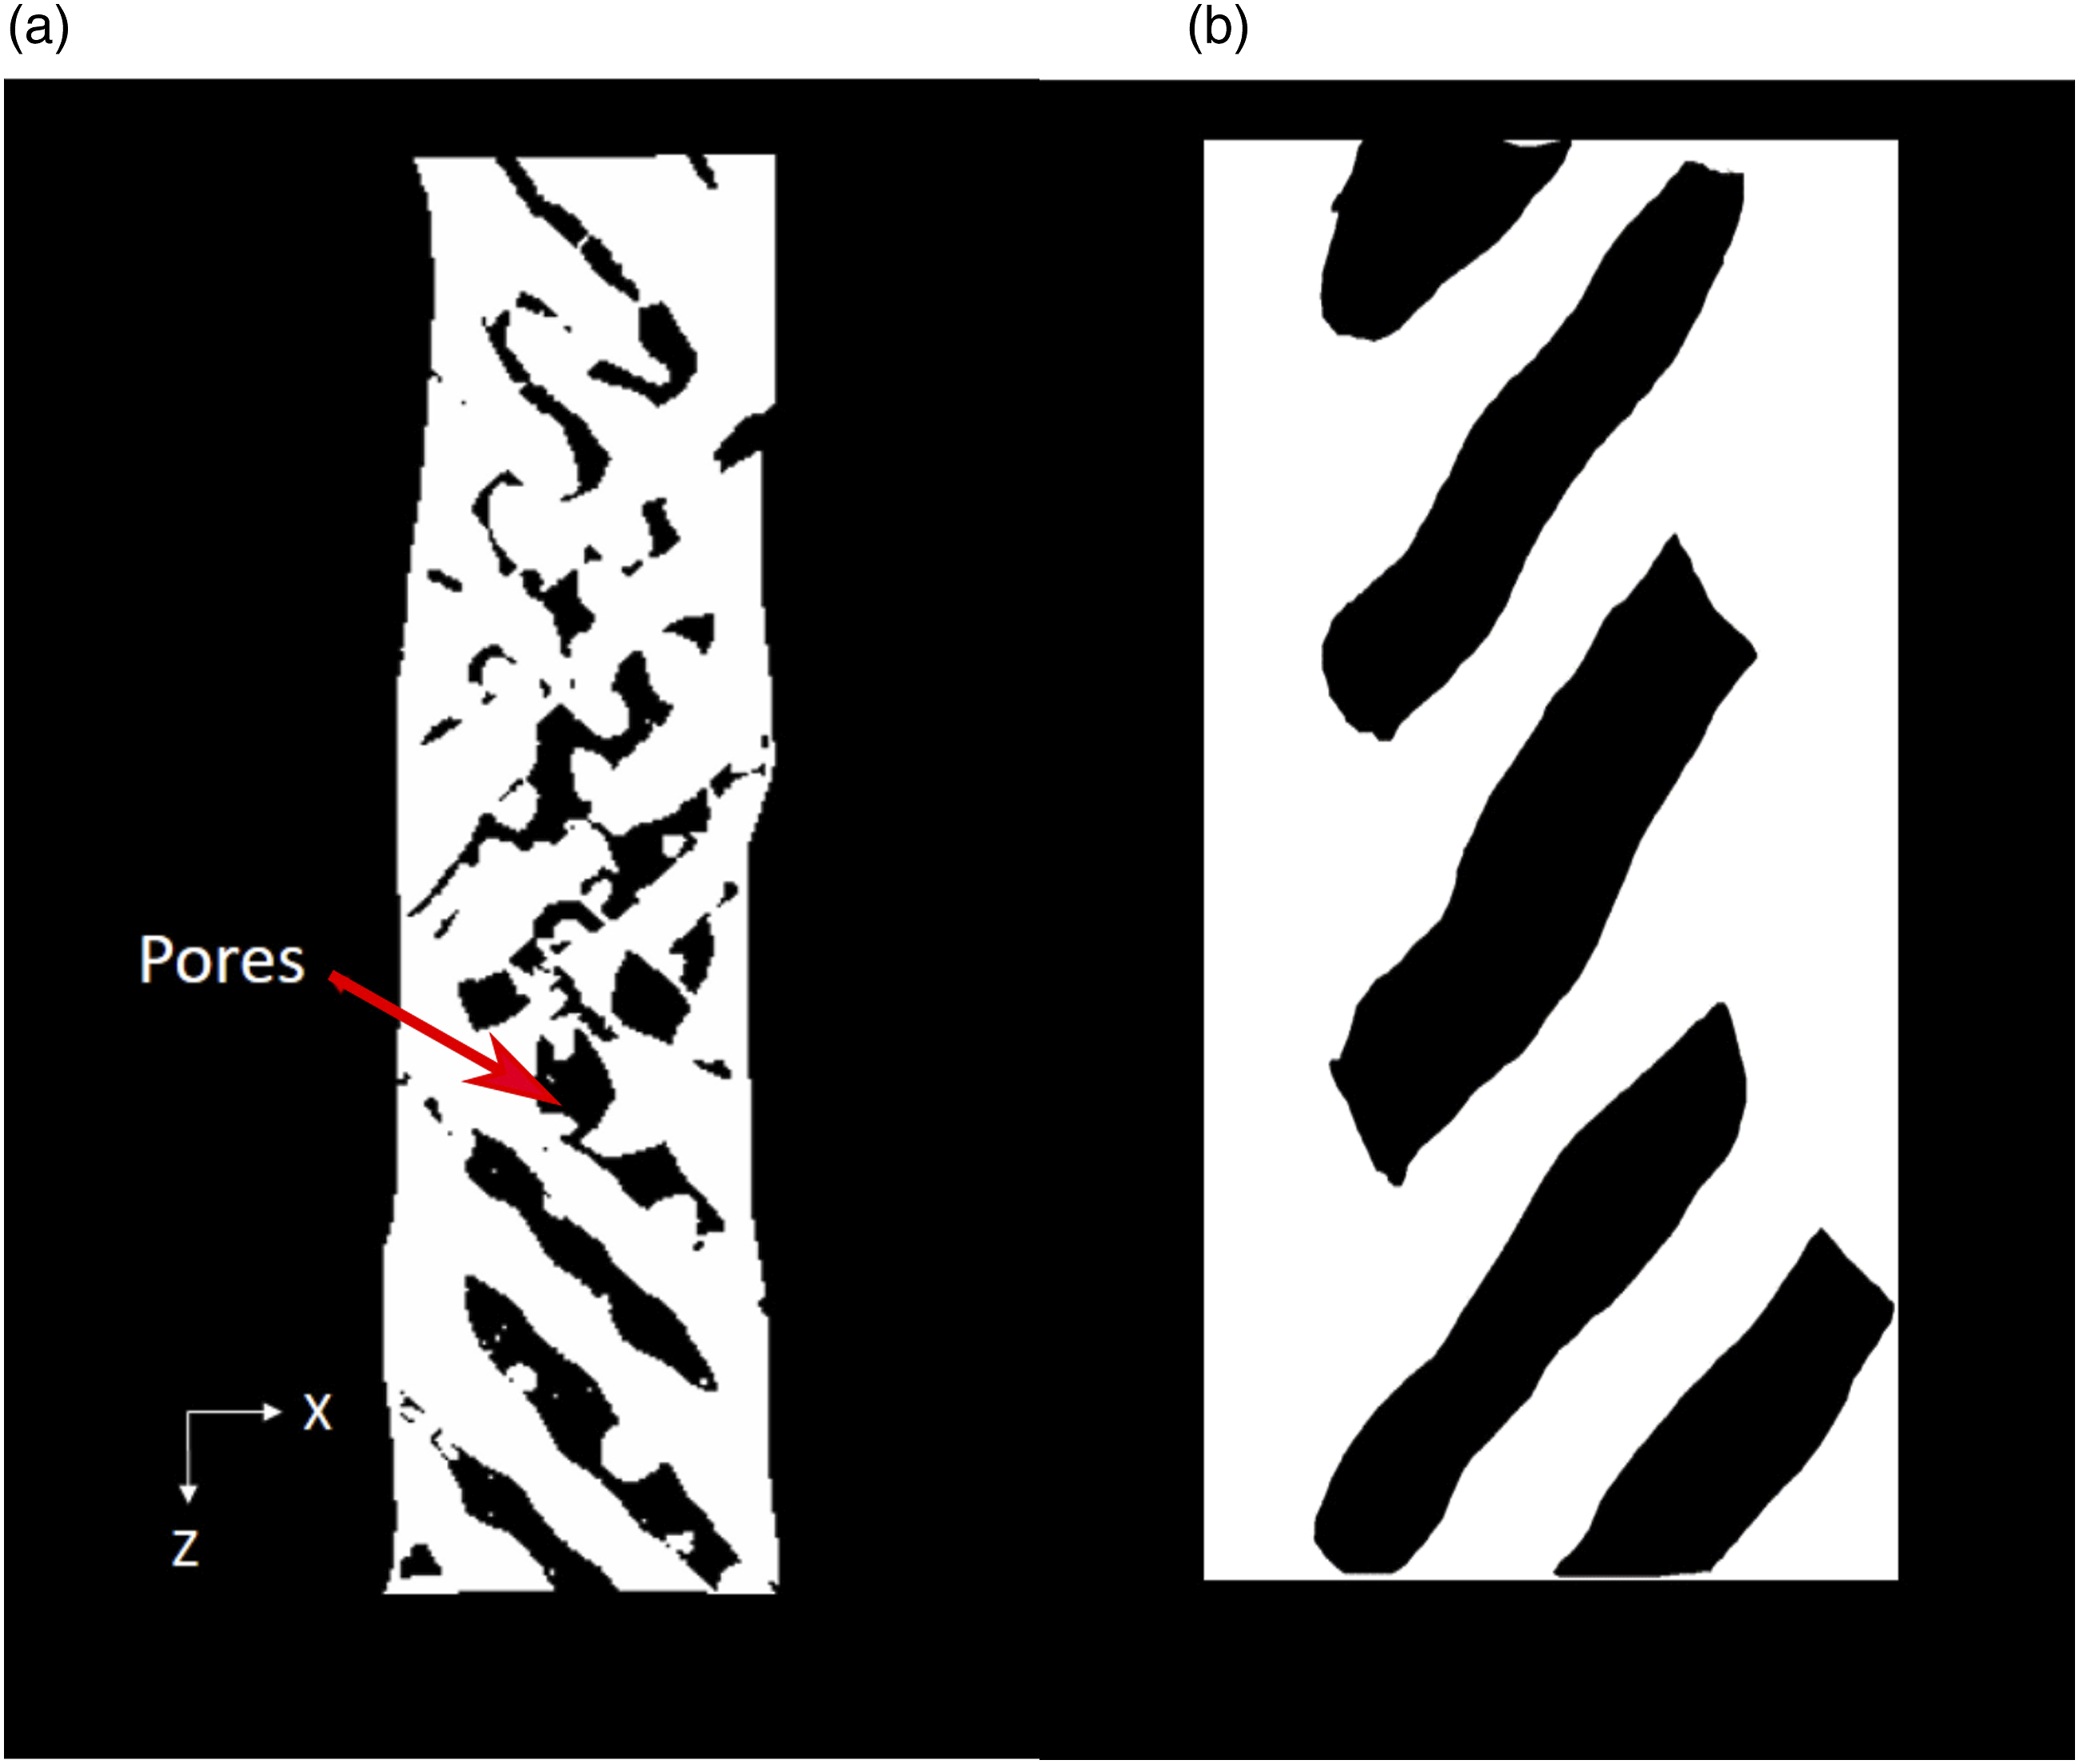
To further verify the porosity results, a microscopic image, Figure 9(b), of the 60% infill pattern was captured and processed to calculate porosity. The porosity was found to be 31.69% which is in the range of Micro-CT image results. The main difference is that microscopic images only capture a single layer of 3D printed parts for processing, which might not hold for the whole stack of layers; that is why Micro-CT scanned images are advantageous for internal feature measurements.
As seen in Figure 10, a histogram of particle distribution is generated. The figure depicts the frequency of the particle size range. It is visible that copper particle diameter between the range of 10–20 μm has the highest frequency and after that high percentage of copper particle diameter in the range of 20–30 μm. Copper particle size distribution is significant because this particle acts as a correlation marker for the DVC process, which helps detect tiny movements in the loaded parts. The features should be small enough to capture small movements under loading conditions. For the resolution of 5.4 μm, the particles in the 10–30 μm range will be sufficient for markers to detect movements.
28
Above 100 μm diameter particles are less than 2% of total particles and are believed to be present because of coagulation of small particles after nozzle heating which cannot be resolved using the above image processing techniques and is out of scope for the current research. Copper particle distribution for 60% infill specimen.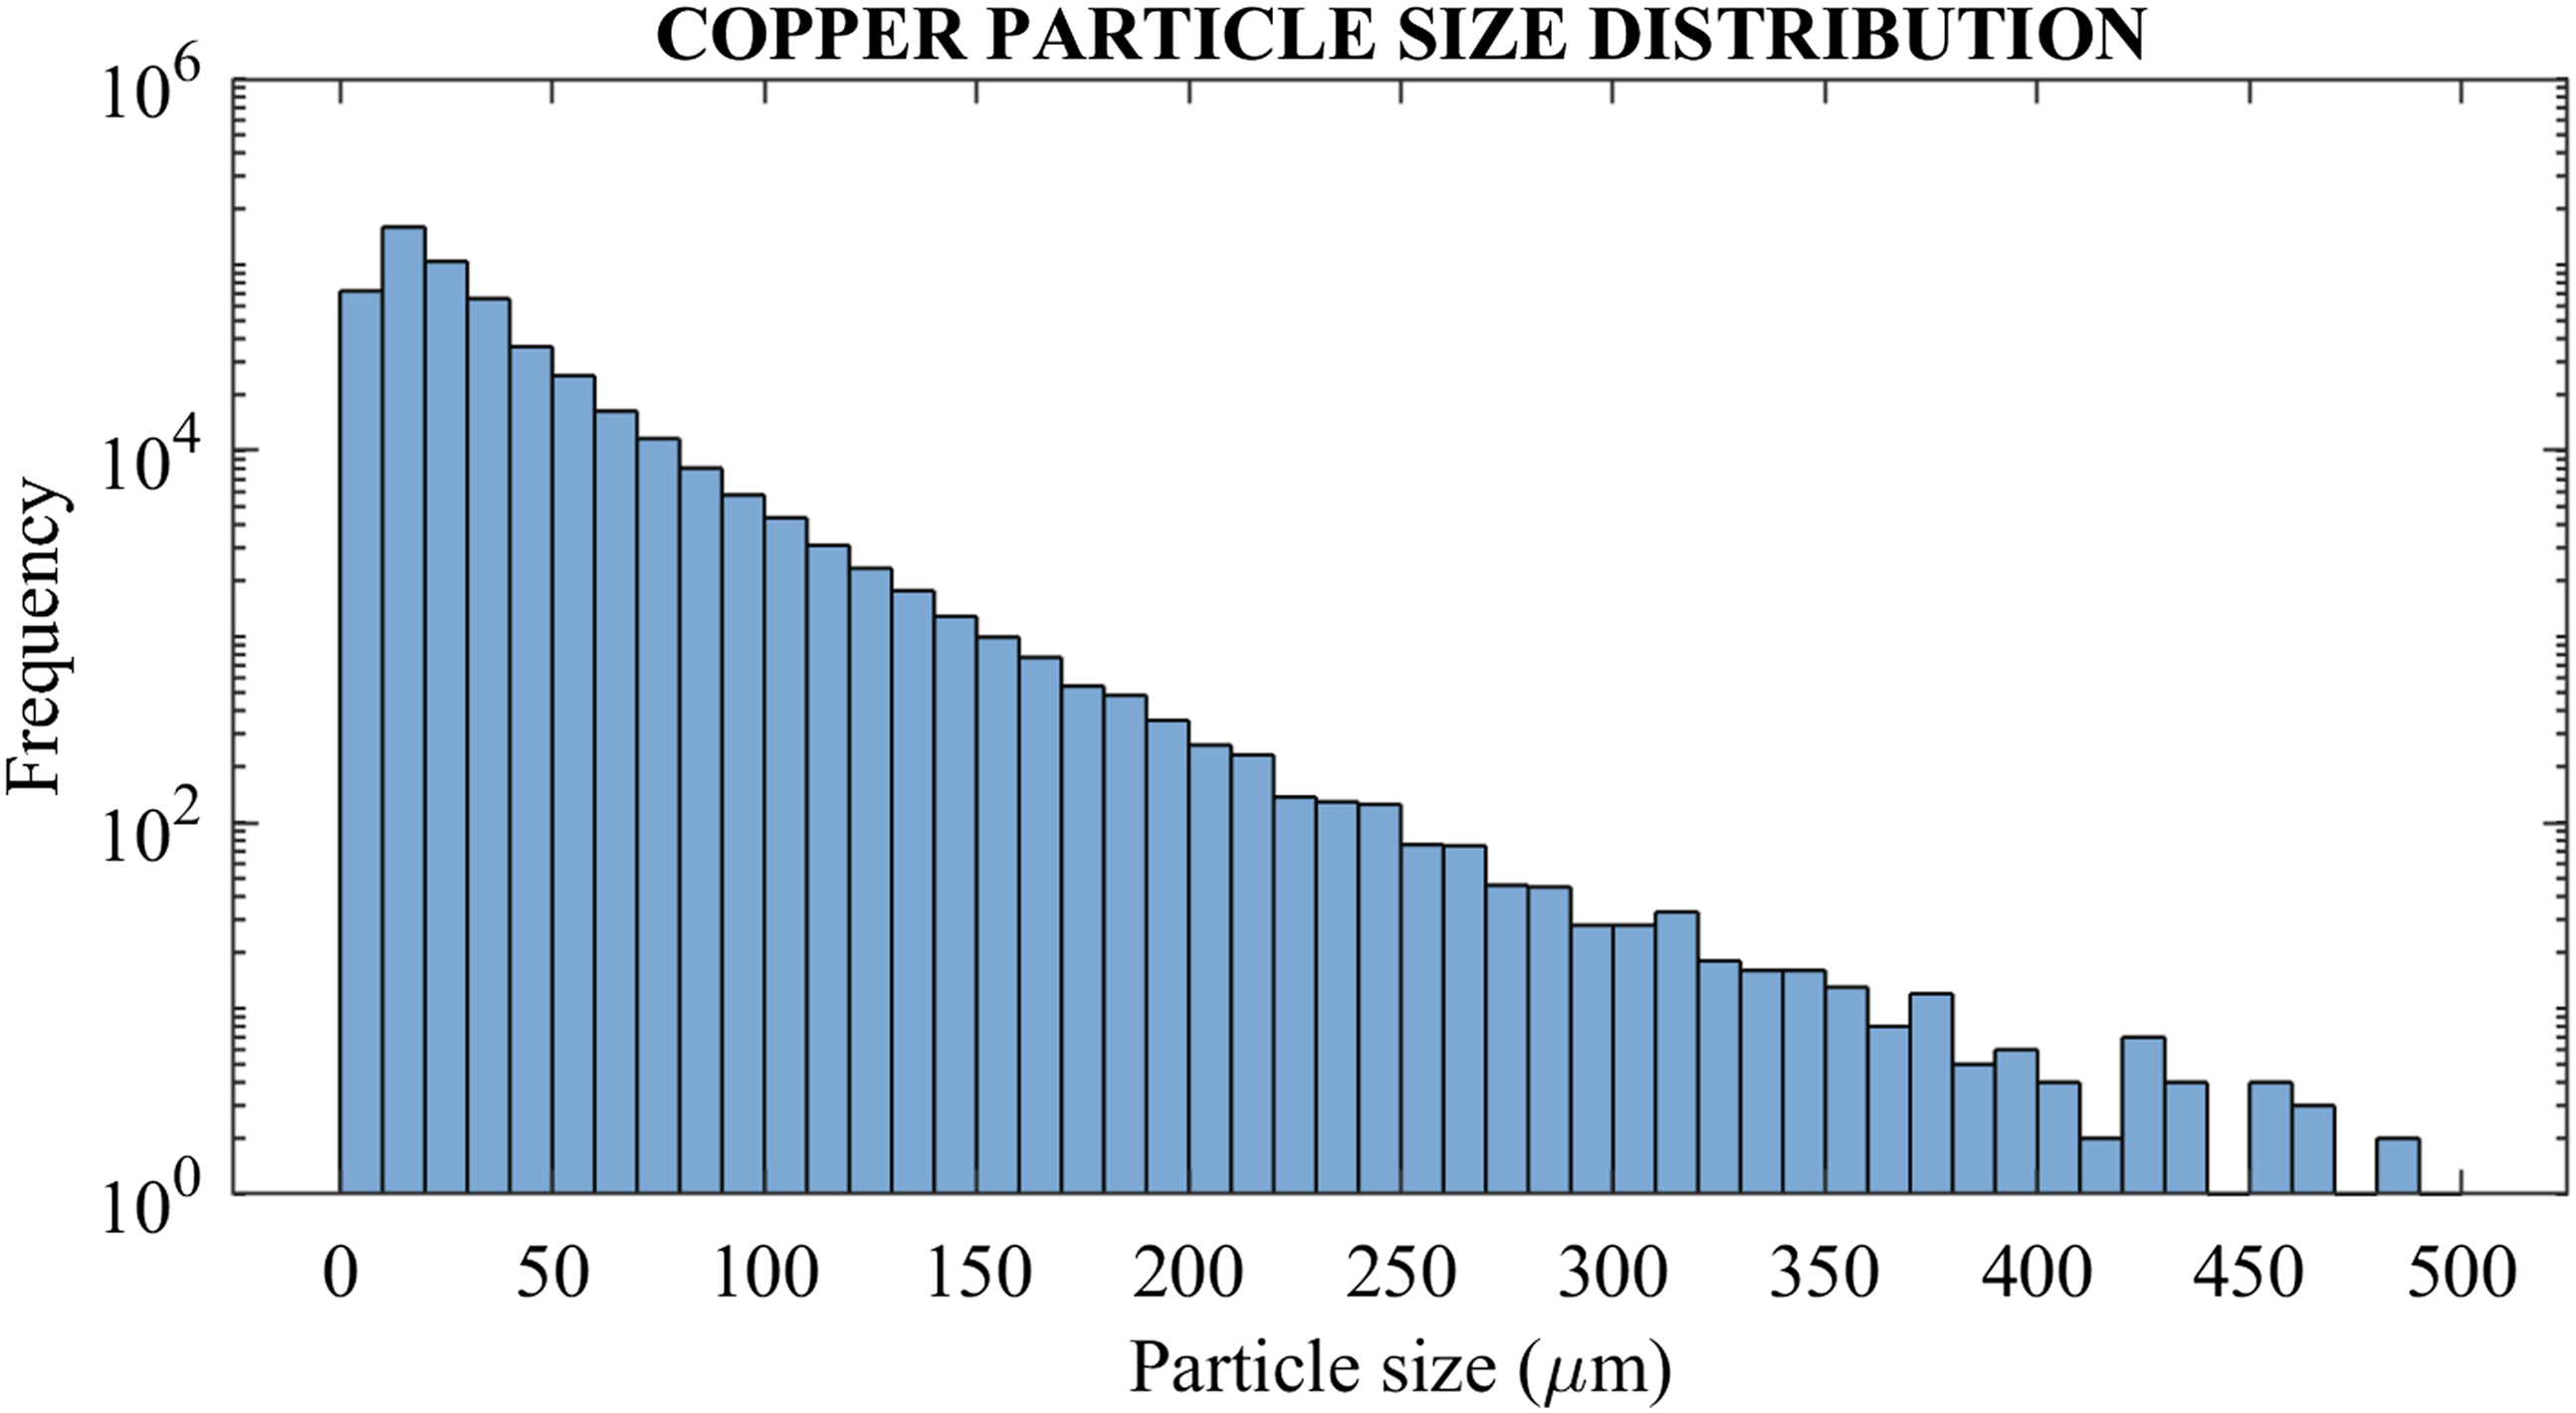
Deformation and strain fields
The DVC results provide extensive information on the behaviour using the displacement and strain maps. Figure 11 shows the displacement along the axis of the applied force from 50 N to 150 N for each infill percentage specimen. As the infill percentage increases from 20 to 80 percent, the magnitude of displacement decreases. This can be explained by the fact that the infill percentage increases the stiffness. Hence as stiffness increases, displacement decreases. The displacement from the load cell side decreases towards the other side of the specimen. As can be seen from the images, the left side of the specimen has more displacement compared to the right side, which might be because of a small sample misalignment in the testing stage. Z-Displacement field across X-Z plane for (a) 20%, (b) 40%, (c) 60%, and (d) 80% infill specimen for 150 N of applied force.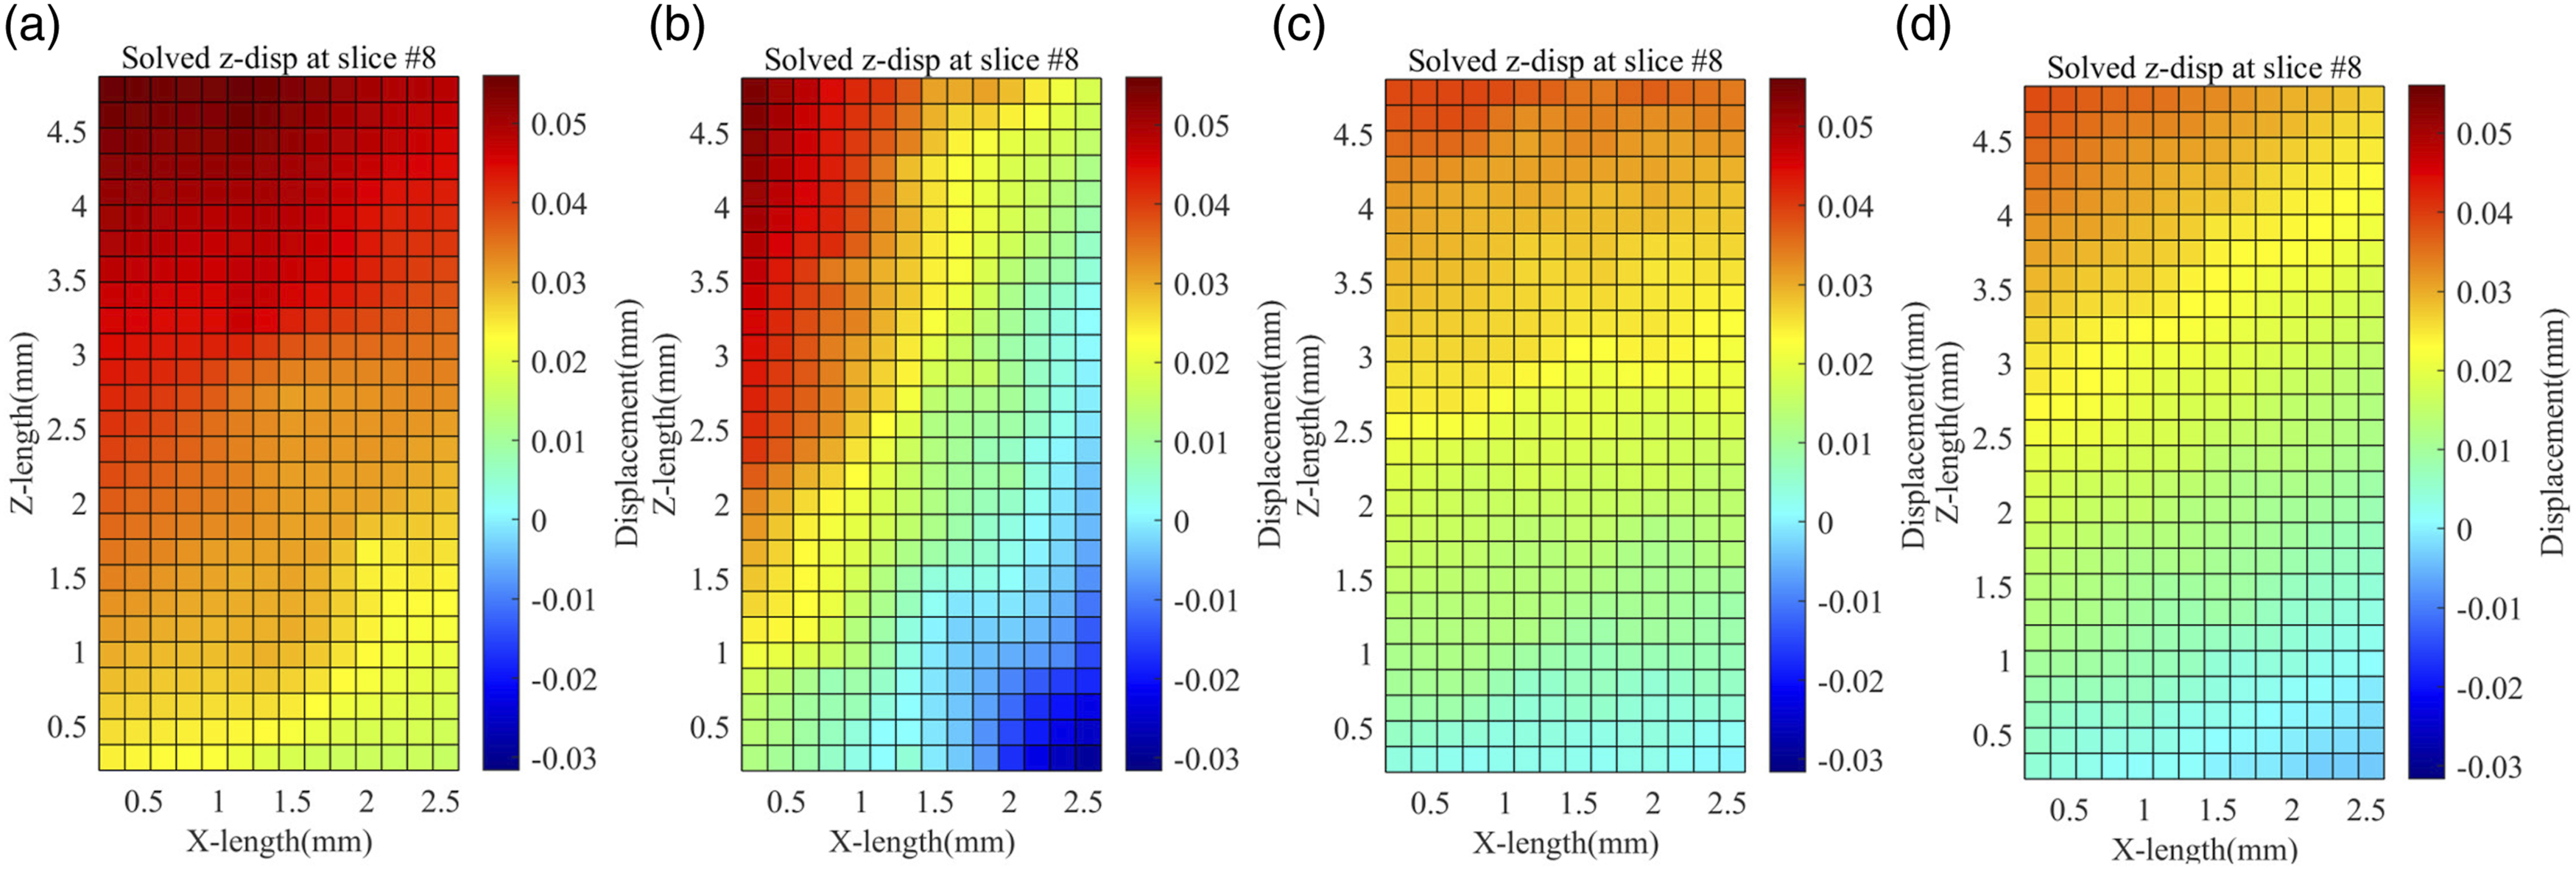
Similar to displacement, Figure 12 shows the longitudinal strain ( Volumetric Strain 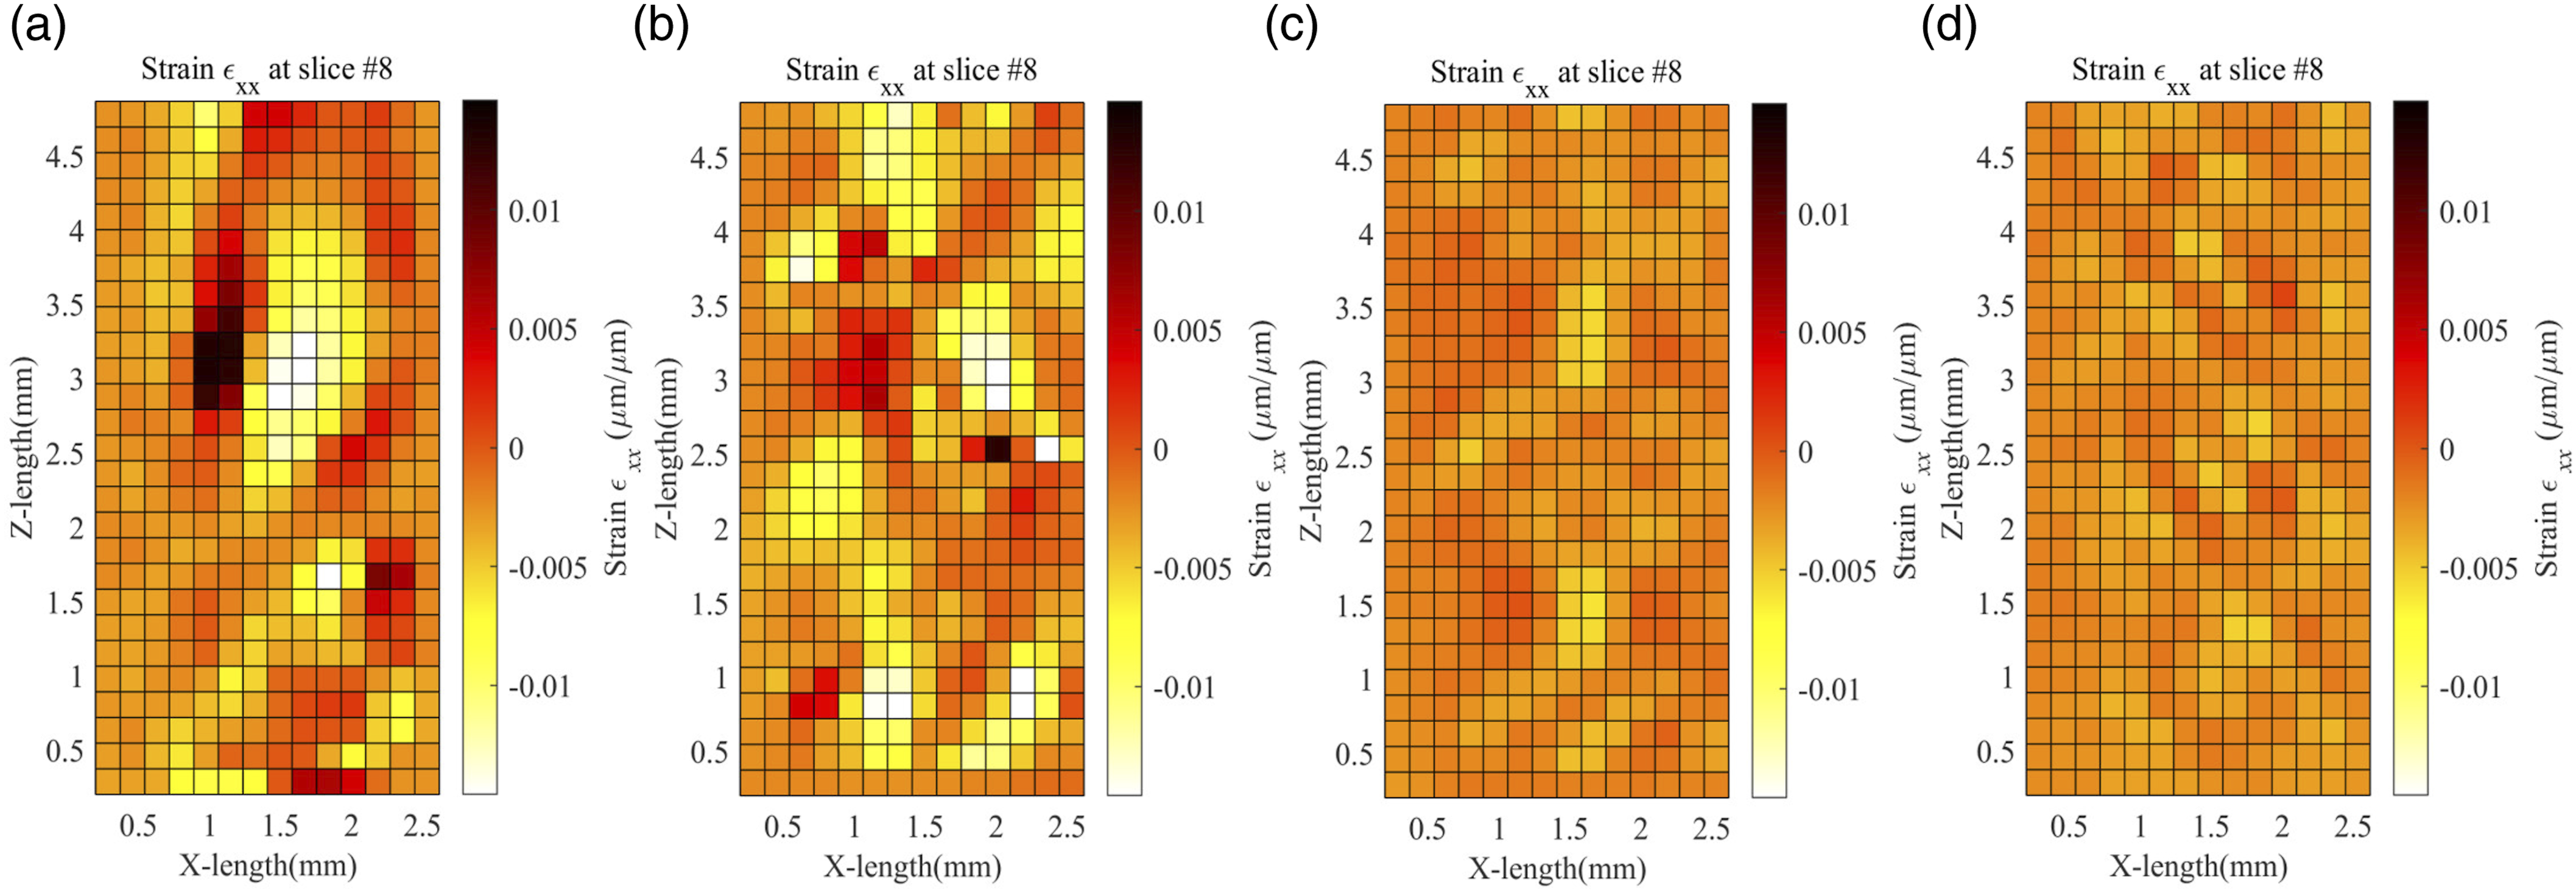
Figure 13 below shows the volumetric strain Volumetric Strain 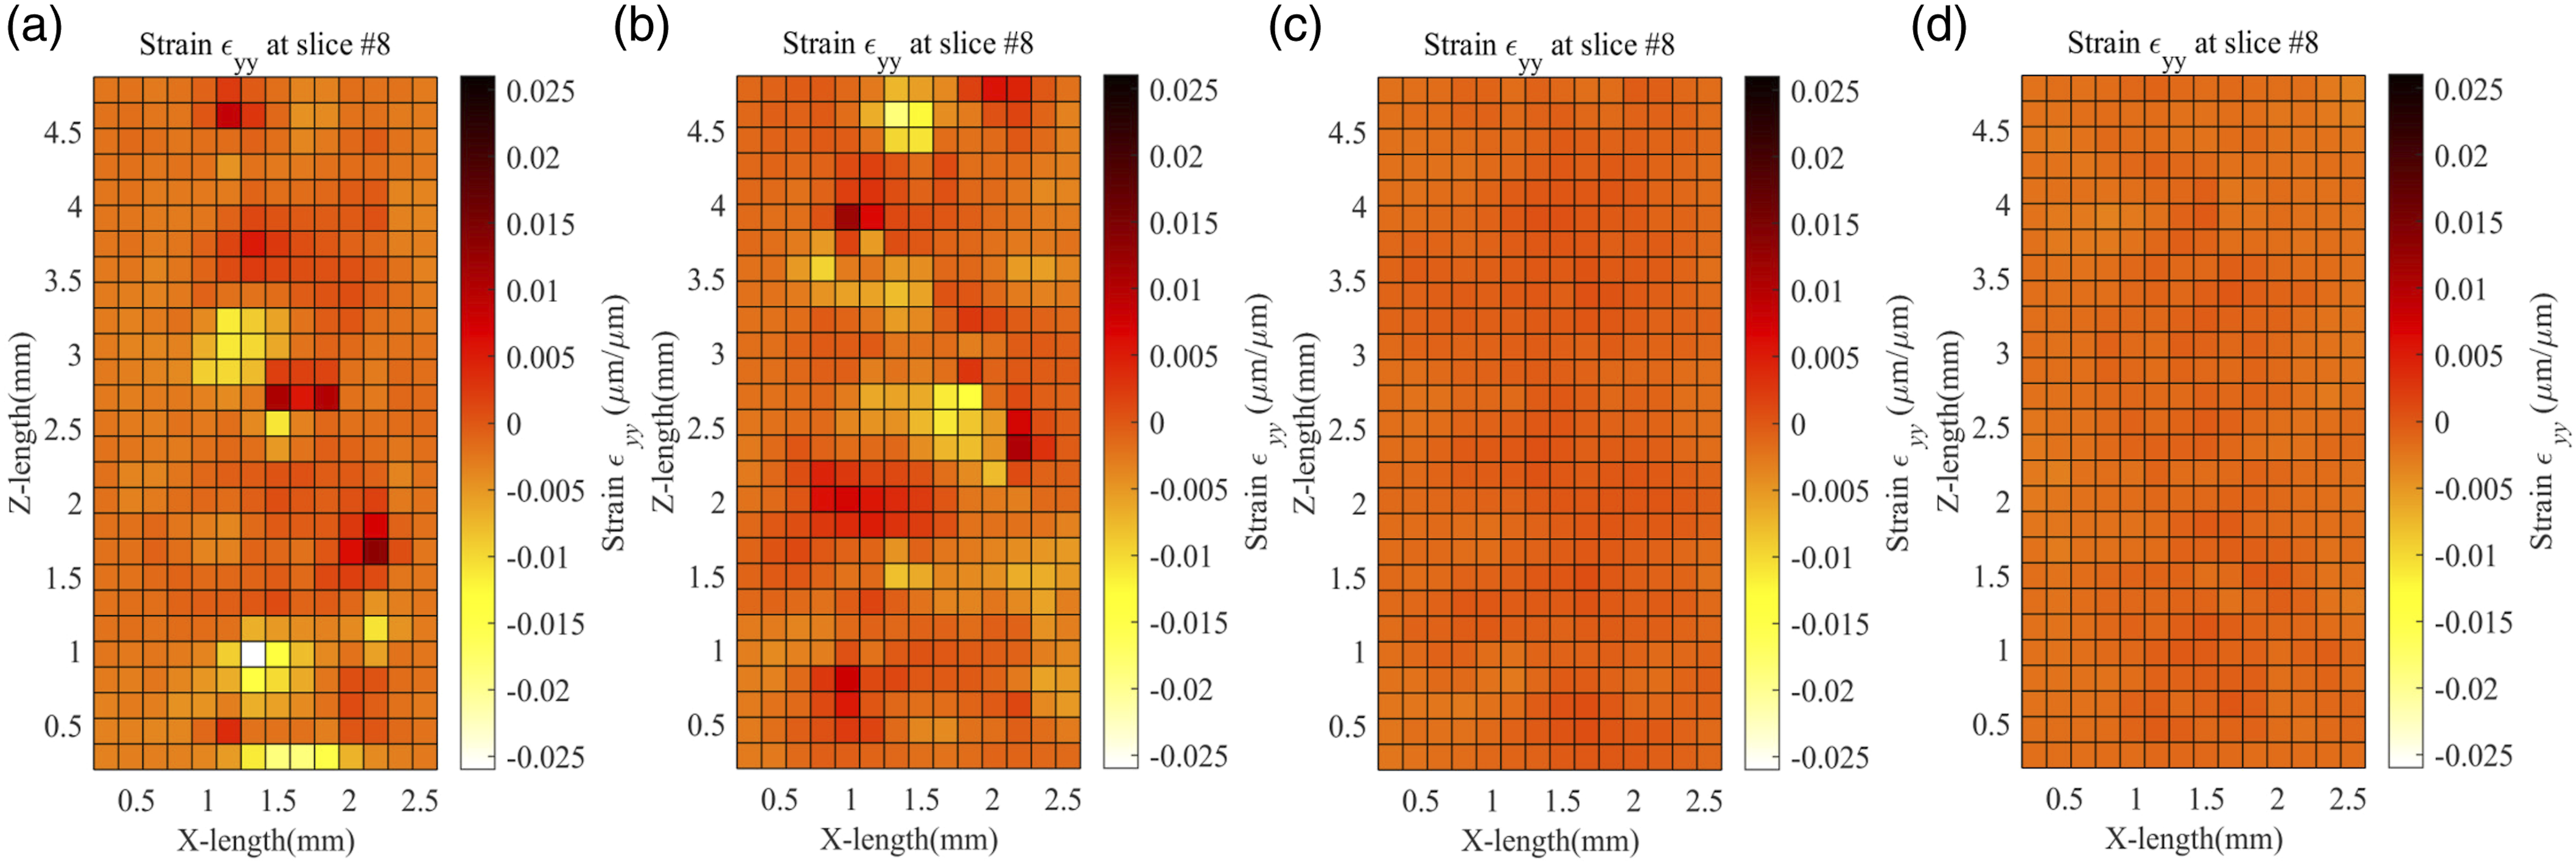
Figure 14 compares the Micro-CT image with the strain map and explains how infill distribution affects the resulting strain. Figure 14(i) shows the Micro-CT images obtained for the 20, 40, 60, and 80 infill samples. Figure 14(ii) shows the (i) X-Z plane view of reconstructed 150 N MicroCT data (ii) Volumetric Strain 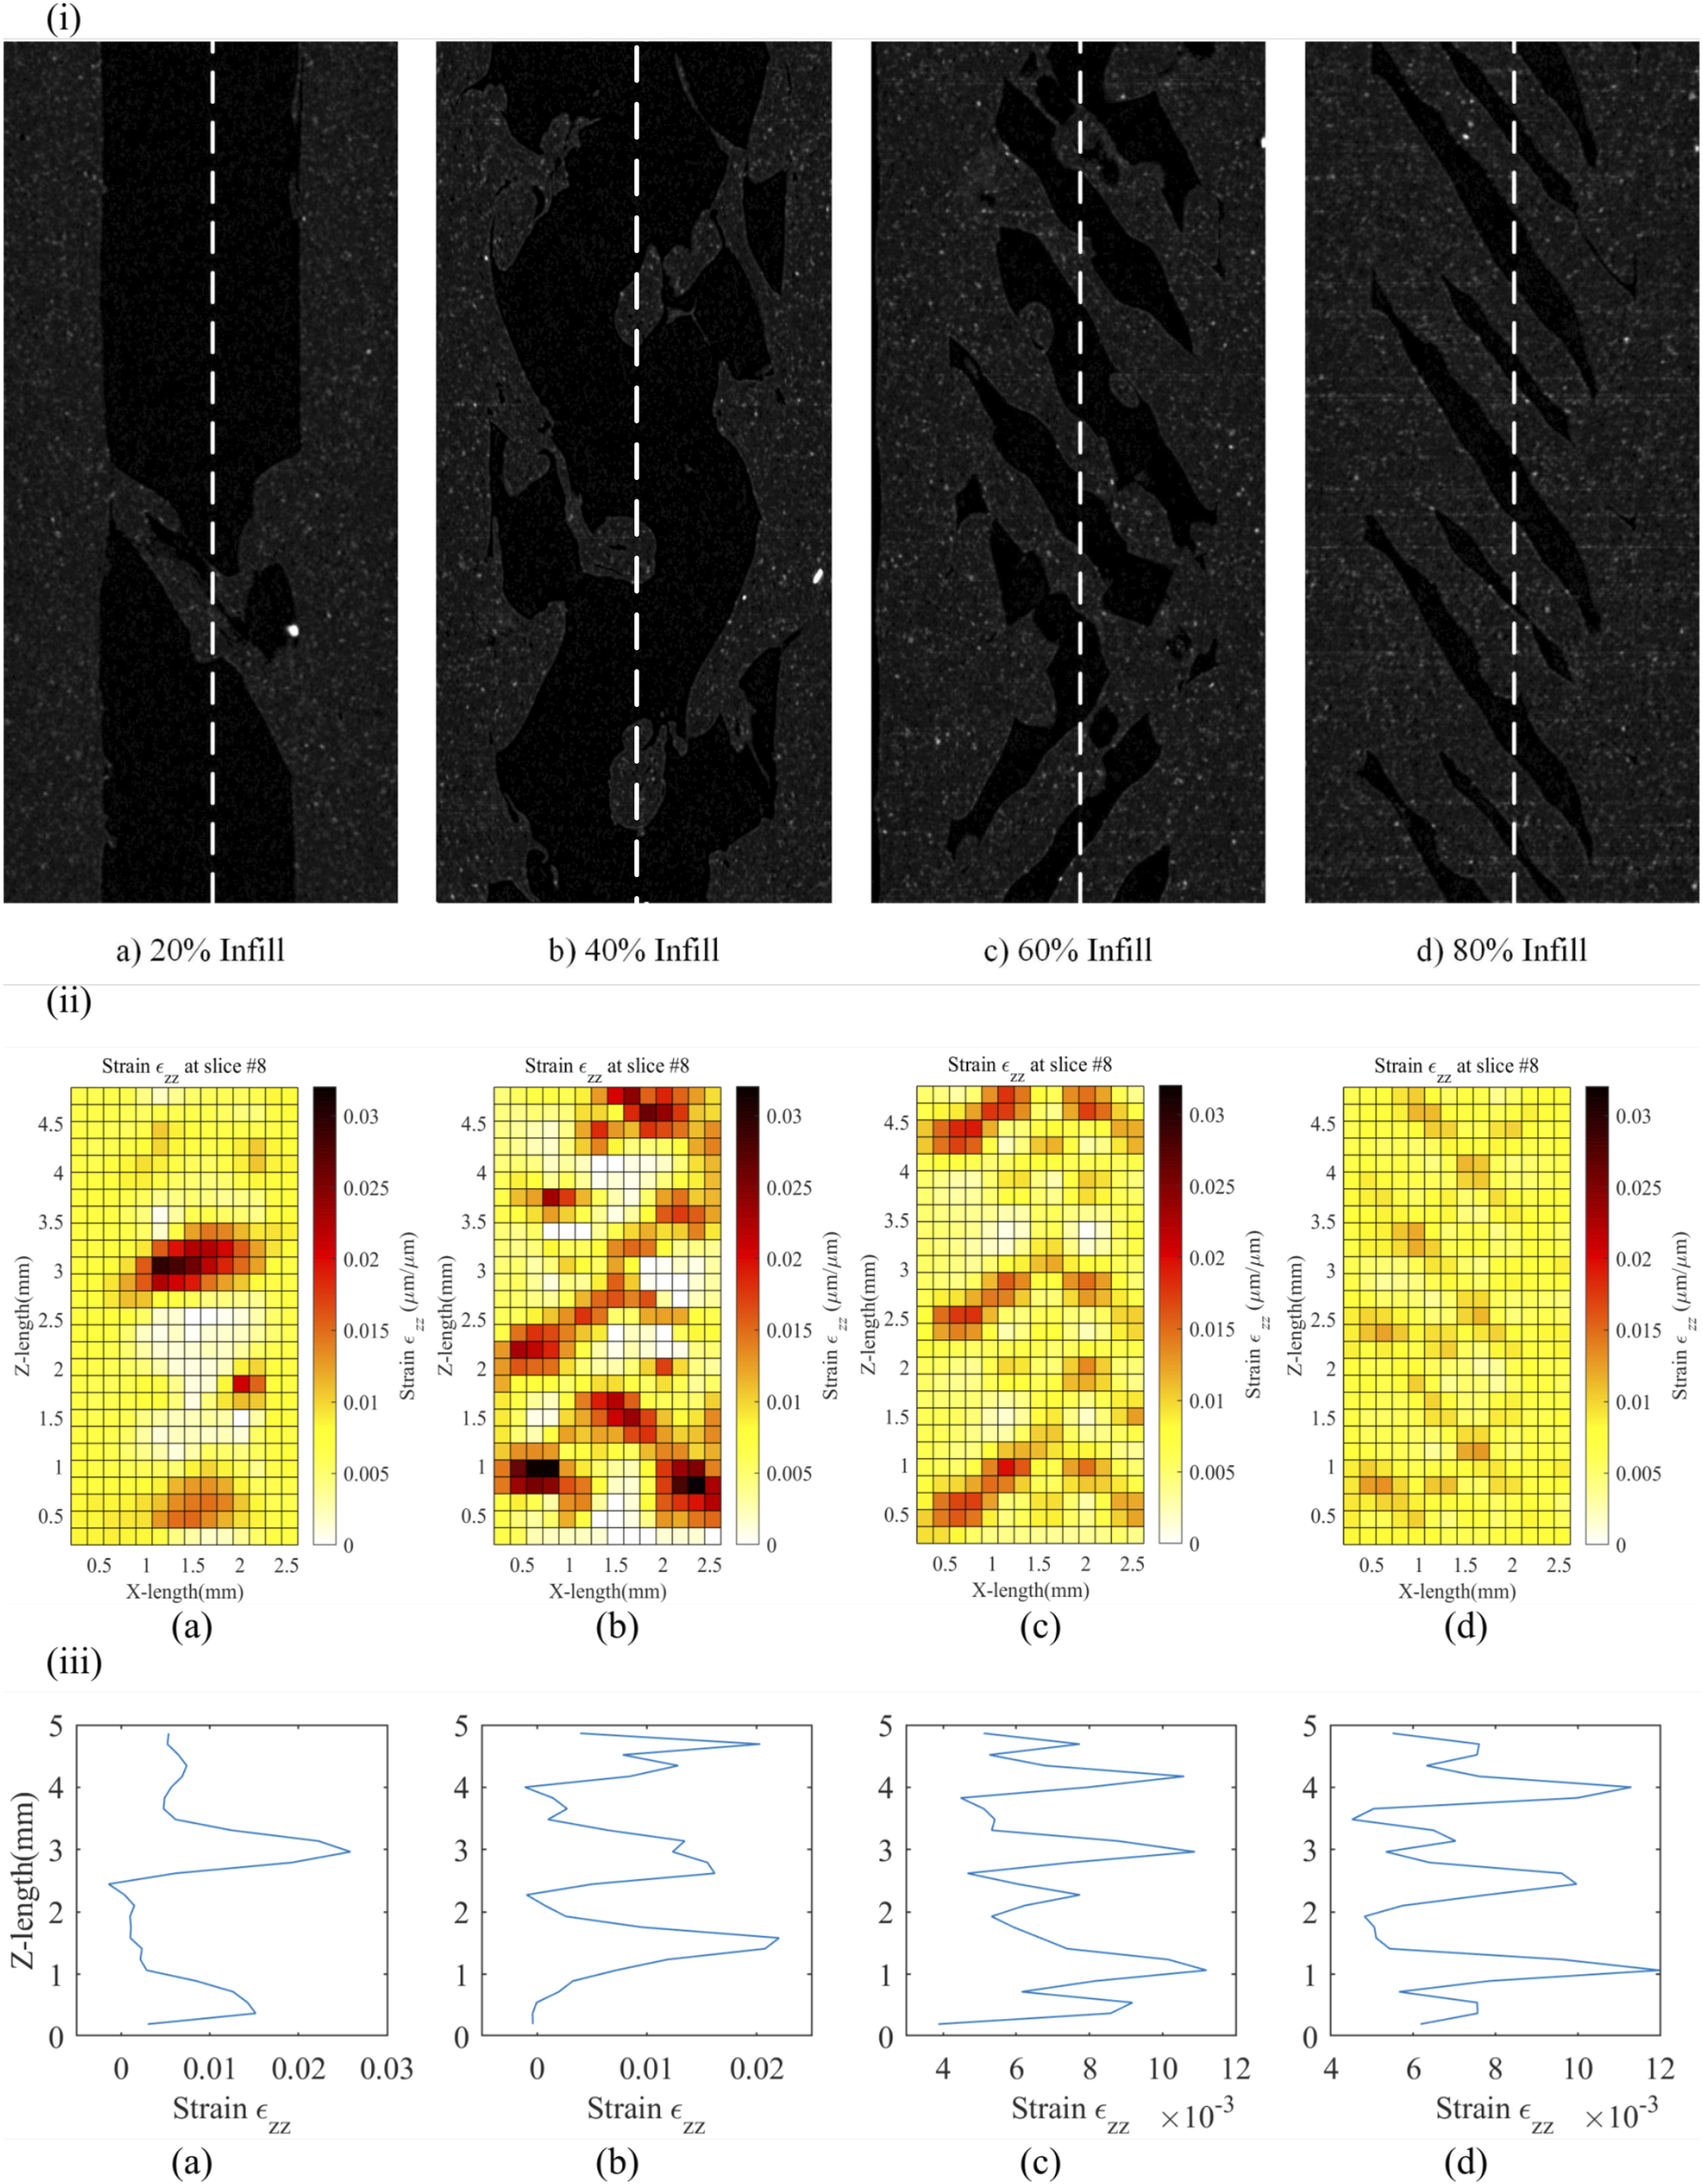
Average strain value across the VOI region.
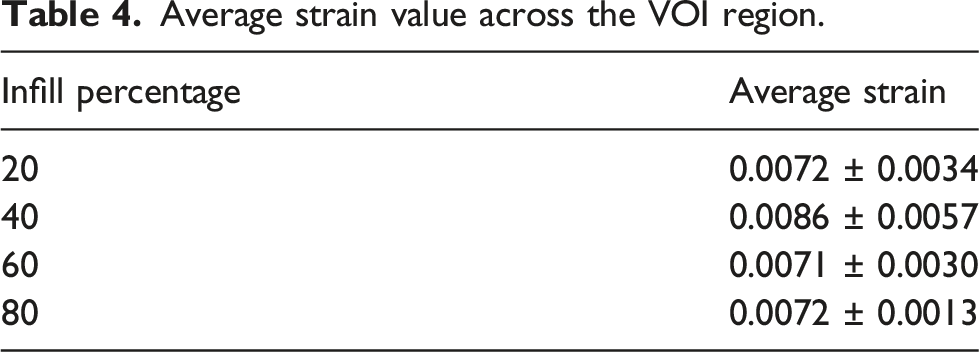
The above results are only based on different infill percentages, which can also be used to understand how much infill percentage would be efficient for the loading condition and cost savings. Also, the results can be used to understand the effect of different print parameters volumetrically, like the effect of layer thickness, shell thickness, and temperature. This would also help in understanding the internal behaviour of complex 3D printed structures, which is impossible with the DIC measurement technique.
Gonabadi et al. studied the effect of process parameters like infill pattern and infill density for the PLA samples using DIC. 18 The results showed full-field surface strain fields; however, meaningful data could not be extracted from the strain maps. The strain distribution showed some strain localizations, which are not correlated to the micromechanical properties of each process parameter. Similarly, Saleh et al. used DIC in the study for the mechanical characterization of 3D printed rigid and flexible continuous wire polymer composites. 29 A full-field internal strain field would have given a more comprehensive analysis of the sample characteristics than a full-field surface strain. Also, the Micro-CT model of the sample could be used to find the volume fraction of the constituents with better accuracy as compared to optical microscopy.
Conclusions
Tensile tests were conducted on 20, 40, 60 and 80 infill percentage FFF copper-filled PLA specimens while the samples were positioned within a Micro-CT scanner. The specimen was manufactured according to the modified ASTM D638-14 type V. The specimen was scanned in Micro-CT under a preload of 50 N and step load of 150 N. The data was further processed and analysed to find porosity and copper particle distribution in the sample. The ALDVC software performed DVC analysis on 20, 40, 60, and 80 infill percentage samples to measure the internal displacement and strain fields. This work established that displacement increases as the infill percentage decreases due to less material within the sample cross-section. For the volumetric strain
Footnotes
Declaration of conflicting interests
The author(s) declared no potential conflicts of interest with respect to the research, authorship, and/or publication of this article.
Funding
The author(s) disclosed receipt of the following financial support for the research, authorship, and/or publication of this article: This work was supported by the Natural Science and Engineering Research Council (NSERC) Canada (RGPIN- 2018-05899).