
Abstract
This study analyses the influence of the random filament arrangement in fibre bundles on the resin flow behaviour. Transverse steady-state resin flow that occurs behind a liquid resin flow front was simulated numerically through statistically equivalent micro-structures at high-fibre volume fractions, Vf > 0.6, as observed in fibre bundles. The need of applying a minimum gap distance between neighbouring filaments was overcome by automated local mesh refinement. The derived permeability values showed significant scatter. Convergence of these values was determined at a ratio of flow length to filament radius greater than 20 for all three analysed fibre volume fractions. Mean permeabilities were between 6 and 10 times lower than those predicted for a hexagonal fibre array. A statistical model is proposed, which is able to predict the scatter of observed permeabilities based on simple micro-structural descriptors.
Introduction
Textile reinforcements utilised in the manufacture of composite components are usually made from filaments that are bundled into yarns and then processed into fabrics for easier handling. This design leads to dual-scale porosity with gaps formed in between and within fibre bundles. During a liquid composite moulding process, both types of pores need to be saturated with resin to enable load transfer between the solidified matrix and fibres in the finished component.
The permeability of a reinforcement textile describes its effect on resin flow during composite processing. Geometrical variabilities in fibre preforms can lead to significant scatter in local permeability values,1,2 which can make the outcome of resin injections hard to predict. In addition, the random filament arrangement at the micro-scale leads to local variations in fluid velocity within fibre bundles. This can lead to gas inclusion at the flow front in the case of impregnating flow and may impede void transport within saturated fibre bundles, e.g. bleeding of resin at the end of an resin infusion process will not decrease the void content. 3 These voids will compromise load transfer between neighbouring filaments and may have an adverse effect on the fatigue life. 4 The detection of these micro-scale defects is difficult as the resolution of non-destructive evaluation techniques at the component scale is generally too low. 5 To avoid invasive procedures, it is desired to predict the micro-scale flow properties computationally.
The liquid infusion processes are driven by a number of factors at the flow front. The applied fluid pressure will dominate the liquid flow into the reinforcement, whereas capillary forces may have a strong drag or promotive effect acting on the velocity of penetrating flow.6,7 However, the majority of fluid transport in the reinforcements, e.g. flow behind the flow front, is pressure driven only. Several models for this steady state flow at the filament scale have been proposed in the literature. Usually, the filaments are assumed to be perfectly aligned. This assumption allows flow simulations to be simplified to two-dimensional problems, but ignores any undulation and misalignment of the filaments present in the fibre bundle. 8 The most basic modelling approaches assume the filament arrangement within a fibre bundle to be periodic, e.g. with hexagonal or square packing, which reduces the computational effort.9–11 These models fail, however, to predict the influence of local geometric variability on resin flow in yarns. Therefore, several studies proposed models for randomisation of filament arrays.
Initial attempts achieved randomisation by disturbing periodic arrangements, e.g. removing fibres randomly and disturbing fibre centre positions within their respective finite cells. 12 This created variability in predicted permeability values, but failed to represent real fibre arrangements. Using different mathematical algorithms to generate more realistic random filament arrays, it was demonstrated that the permeability of a model domain is dominated by a few main flow channels formed in between filaments. Chen and Papathanasiou 13 and Matsumura and Jackson 14 related the resulting permeability of a random arrangement to the average gap formed between the closest filaments and Yazdchi et al. 15 to that between the second closest filaments. Alternatively, it was suggested that the permeability can be described by fibre clustering, 16 which effectively also implies formation of flow channels. Such descriptions of the permeability are beneficial as they allow the permeability variations in larger domains (e.g. use of Voronoi cells tessellation of large fibre arrays Yazdchi and Luding 17 ) or at multiple length scales 18 to be estimated without the need of computational fluid dynamic simulations (CFDs) simulations. However, even though these descriptions improve the analytical permeability predictions, they still fail to explain the very large spread of permeability values found in practise. Attempts have been made to include void formation mechanism during impregnating flow7,19 or drag forces to describe movement of filaments during saturated flow.20,21 The latter suggests that the permeability can change significantly if the fibre arrangement moves. Experimental evidence for movement of individual filaments in liquid composite moulding processes at low fluid velocities and the required drag force was not provided. These transient simulations are very computational expensive and difficult to run on a larger scale.7,19
Due to the purely computational considerations in generating the models in most studies, these filament arrays are not necessarily representative of the micro-structure of a real fibre bundle. In addition, these studies enforce a minimum distance between filaments, which does not occur in practice and will affect the predicted permeability. In this study, statistically equivalent representative volume elements (RVEs) were generated based on experimental characterisation of the filament arrangement in low-crimp carbon fibre–reinforced plastic samples. 22 On these models, the fluid transport was simulated numerically, and the influence of the random filament arrangement on the domain permeability was analysed. Using these data, a multiple linear regression (MLR) model has been developed to predict the permeability variations in entire fibre bundles rather than using constant values 23 or assuming distributions of regular arrangements as function of locally varying fibre volume fractions, Vf . 24
Numerical model set-up
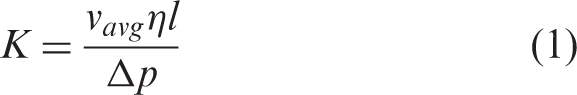
The flow simulations in this work are governed by the Navier–Stokes equations, describing conservation of fluid mass and momentum. These equations are solved on specified model geometries using the commercial software Ansys Fluent® for steady state laminar flow implying a low Reynolds number. It is assumed that the fluid is incompressible and exhibits Newtonian behaviour. The fluid viscosity, η, was selected to represent a low-viscosity epoxy resin (η = 0.1 Pa·s). Transverse flow with respect to infinitely long parallel filaments in varying arrangements is assumed. Reduction of the flow domain to two dimensions is therefore possible. Permeability values were derived from the imposed pressure gradient, Δp, and the calculated average (weighted by the respective cell dimensions) outflow velocity, vavg, over the flow length, l, according to
Statistically equivalent model domain generation
Statistically equivalent micro-structures were reconstructed as discussed in an earlier study, which allows generation of any Vf.
22
In this approach, a predefined two-dimensional domain is populated with filament cross-sections, represented by circles of given diameter. The distributions of distances and angles at which the nth nearest neighbours of a filament are located (Figure 1) and the distributions of fibre diameter utilised for the model generation were determined experimentally from composite specimens at three global fibre volume fractions, Distance, dn, and orientation, αn, of a filament relative to its nth nearest neighbour in a cross section of a carbon fibre bundle. The gap, wg, formed between these two filaments is indicated. The global coordinate system, x–y, is selected to be parallel to the image boundary.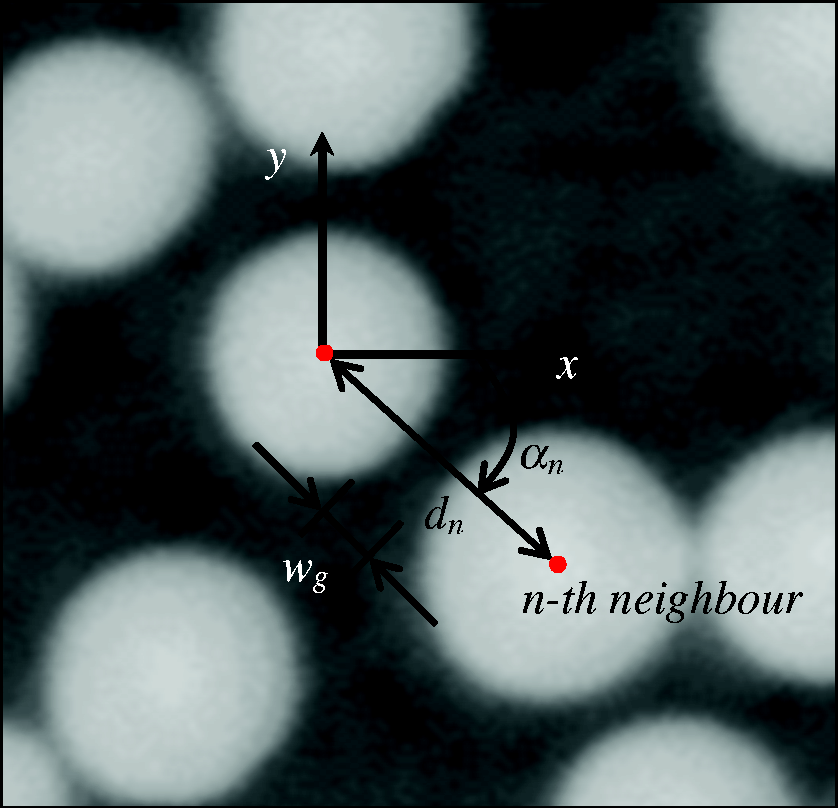
To ensure a complete population of the model domain with filaments, the fibre placement area was initially selected to be approximately three fibre diameters larger than the target model size. After completion of the filament placement procedure, all fibres outside the area of interest are removed, and only filaments that are at least partially located within the target area remain. Geometrical symmetry at the boundaries 25 is not enforced to avoid an additional constraint on the filament arrangement. This will result in non-symmetric flow patterns at the model boundaries, which are thought to be more realistic than enforcing a symmetric flow profile.
The reconstructed structures exhibit the same statistical distributions of filament spacing and orientation as observed in the original micro-structure (Figure 2(a) and (b)), but are are not intended to reproduce the exact filament arrangement as measured. Regular filament configurations such as square or hexagonal can be present within yarn cross-sections locally, but it is evident that these periodic arrangements do not reflect the entire micro-structure. The filament density within the micro-structure varies locally. Effects such as local filament clustering (indicated by lines in Figure 2) can be present.
(a) Reconstructed filament micro-structure. Typical fibre arrangements are marked in the images. (b) Micrograph of a unidirectional carbon fibre bundle cross section showing a random arrangement of filaments. Typical fibre arrangements are marked in the images. (a) Reconstructed filament micro-structure. (b) Micrograph of a unidirectional carbon fibre bundle cross section showing a random arrangement of filaments. Typical fibre arrangements are marked in the images.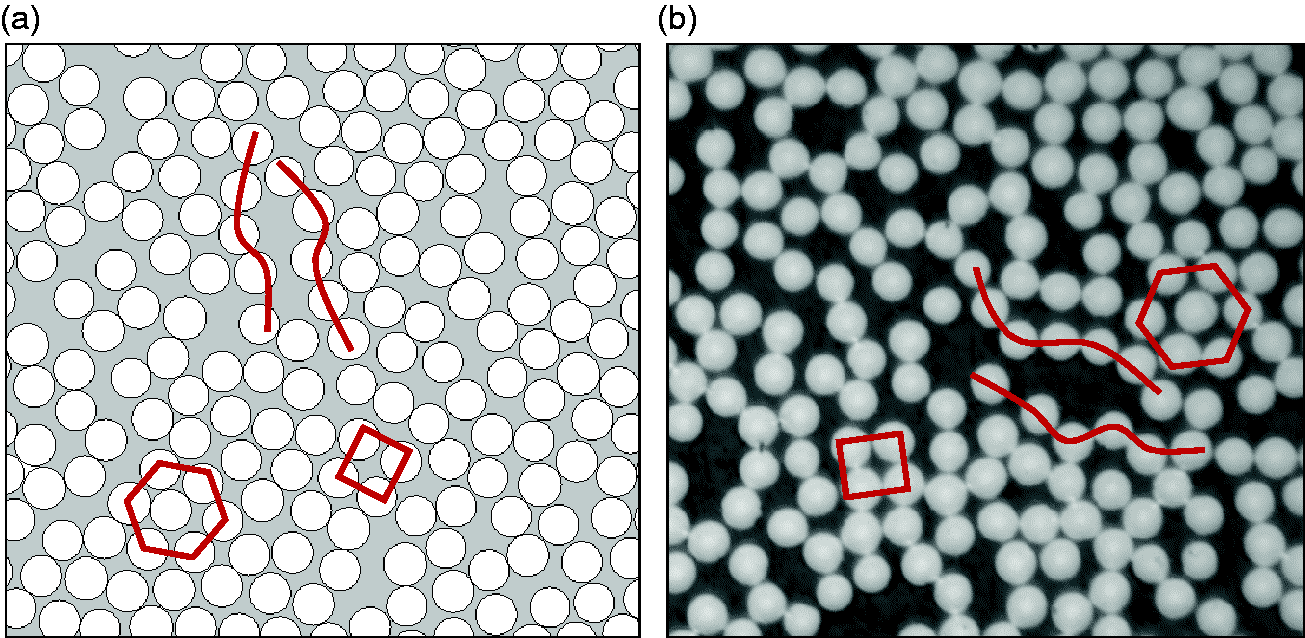
Boundary conditions
The model boundaries parallel to the applied pressure gradient were assumed to behave as impermeable frictionless walls that do not allow flux across these edges (Figure 3). In reality, flow in this direction may also be present, which cancels out on average. Effectively, it is assumed that the average flow is in the direction of the applied pressure gradient. All filament boundaries within the flow domain were treated as impermeable no-slip walls. The influence of different types of model domain boundary conditions, BC, on the numerically determined permeability (equation (1)) was analysed based on CFD of hexagonal filament arrangements discretised with the optimum parameters determined during the mesh sensitivity study employing local mesh refinement (Mesh sensitivity and model validation section). Periodic geometries were chosen as these are extensively studied and the results can be easily compared to previous studies.
9
The results are thought to be valid for larger domains as well. Periodic BCs, assuming an infinite repetition of the flow domain where the pressure is not necessarily uniform on the boundary, were compared to pressure inlet and outlet BC, which are characterised by a uniform pressure distribution on the boundary. It was found that the choice of pressure inlet and outlet BC gives similar results as applied periodicity at identical Vf. The non-symmetric geometry of the model domains at the boundaries prevents the use of periodic BC and therefore pressure gradients were applied in this work.
Applied boundary conditions for the analysis of steady-state flow through a random filament network in a model domain with side length, l, and width, w.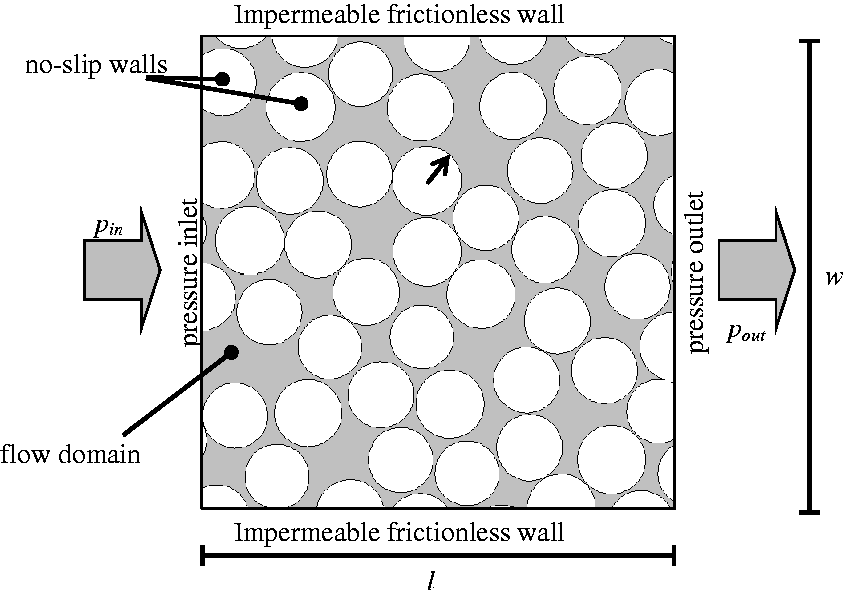
Model domain discretisation
For numerical solution of fluid transport through the generated random filament arrangements, the model domain is discretised into cells that correspond to finite volumes. For description of the flow domain, it is not necessary to discretise the impermeable cross-sections of the filaments (Figure 3). In order to achieve a sufficiently fine discretisation of small gaps between two filaments and limiting the total number of cells, local mesh refinement is employed due to the difference in scale between domain and minimum gap size. To limit the computational cost, a minimum gap distance, dmin, of about 5% of the average filament diameter is often enforced. It was shown, however, that varying values of dmin can significantly influence the filament arrangements and hence, the flow patterns through a random filament array. 13 While it was suggested that a small dmin does not have a significant influence on the overall flow behaviour13,15 employing dmin does not allow complete local blockage to be modelled, e.g. ensures a minimum gap between filaments, and will therefore affect the permeability results. In addition, it is not possible to create high Vf when using dmin, which usually limits the maximum Vf used in CFD simulations to about 0.6.13–15 As the influence of an individual gap cannot be known before a simulation is completed, all gaps will need to be discretised with a fine enough mesh to ensure that the flow behaviour can be captured correctly. This may create more elements than required.
The mesh generator mesh2d
26
in Matlab® is employed in this work. This code generates an unstructured locally refined triangular mesh based on a Delaunay algorithm and iterative smoothing operations. It is assumed that all geometrical features can be expressed as piecewise linear curves. A method of local mesh refinement was implemented as user specified function. This is achieved by applying a specified cell size in selected areas between two filaments (Figure 4(a)), which ensures a minimum number of cells at the smallest gap distance between two filaments. This predefined cell size h0 (Mesh sensitivity and model validation section) specifies the characteristic edge length of the triangular mesh.
(a) Area subjected to the user defined mesh refinement between two filaments (rectangle with solid lines). (b) Local mesh refinement as function of the distance between the filament boundaries. Three zones using different element sizes hi are shown and the transition areas indicated by a solid line.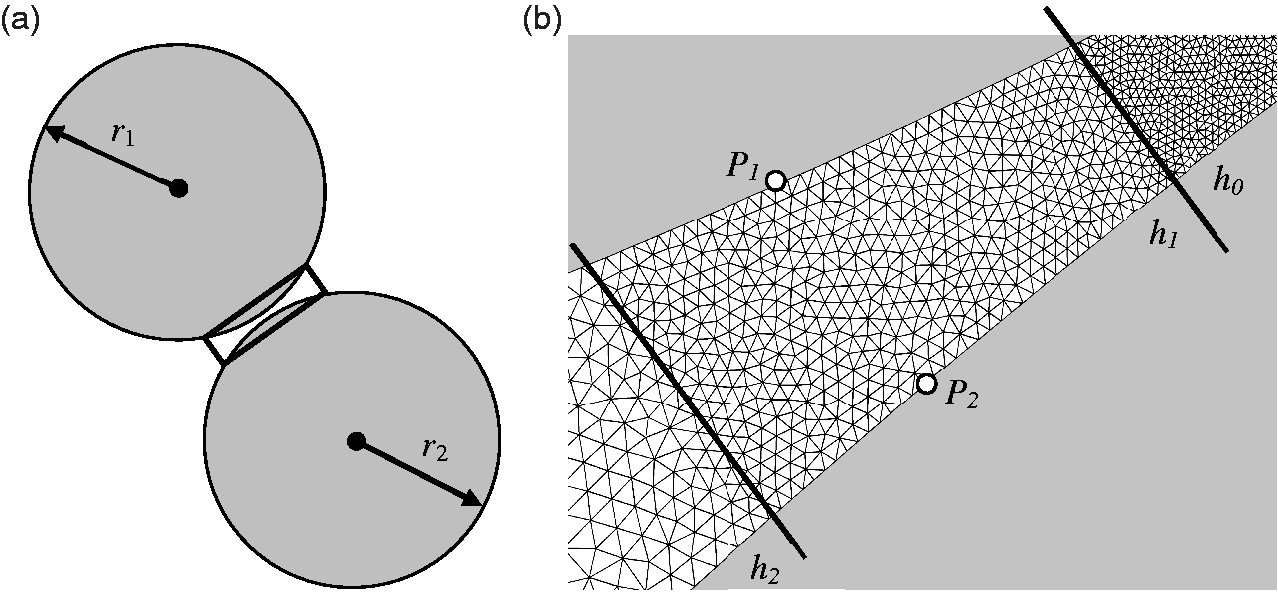
The curved filament boundaries imply a gradual change in gap width. For a given distance between two points, P1 and P2, on opposite filament boundaries, the minimum necessary cell size is determined, which ensures discretisation of the gap with a minimum number of cells (Figure 4(b)). In order to limit the total number of cells, the specified cell size in the area subjected to mesh refinement is then adjusted if the minimum required cell size, hi, is twice as large as the previously applied minimum cell size. The minimum cell size is limited by the computational accuracy only and was in the order of 10−12 unit length. Hence, any gap between filaments which would allow a single flow molecule to pass through (atomic diameters ∼10−10 m) can be discretised efficiently and specifying a minimum gap between filaments is no longer required. The described method has been implemented in a Matlab® program for the entirely automatic generation and discretisation of random filament arrangements.
Mesh sensitivity and model validation
For accurate simulation of fluid flow, the domain discretisation needs to be fine enough to reproduce the expected parabolic velocity profiles in small inter-filament channels.
27
In addition, the section length of the assumed piecewise linear curvature of the filament boundaries, defined by Δθ, needs to be sufficiently fine to not affect the fluid flow. To estimate the necessary resolution of the mesh, flow through hexagonal filament arrangements (Figure 5) at different Vf (varying gap width, wg) was simulated. A number of different mesh densities and angular resolutions was assigned in the smallest gaps between two filaments, e.g. in the smallest distance between two filament boundaries. It should be noted that the selected angular resolution defines the minimum degree of discretisation of a filament boundary and consequently the cell size around filaments only. In the case of a smaller selected cell size in small gaps, the filament boundary divisions will be finer in these areas.
Unit cell of hexagonal filament arrangement. The cell dimensions as function of the gap width, wg, are shown.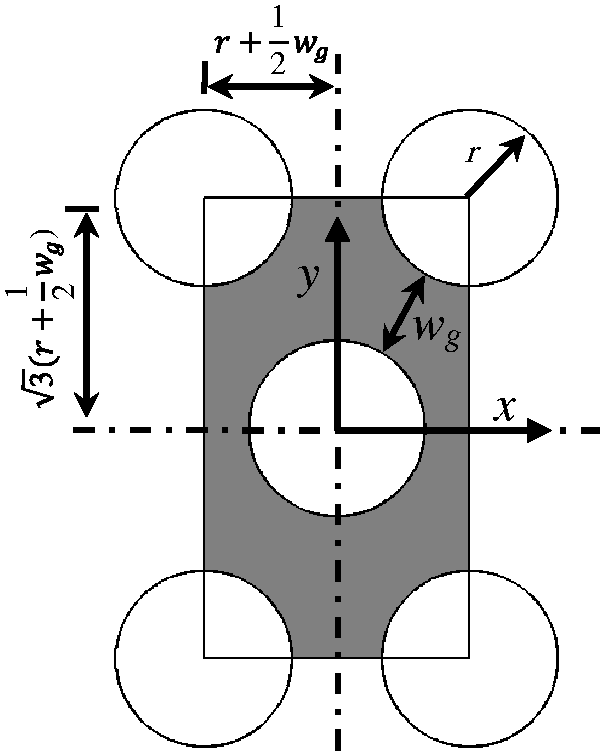
Evaluating the resulting convergence of permeability values made it feasible to determine the optimum mesh resolution as a function of minimum cell size and angular resolution. A satisfactory trade-off between the total number of cells in the model and convergence for all Vf studied was achieved with Δθ = 0.72°. This results in 500 nodes per filament boundary, which is significantly larger than used in previous studies.
13
By keeping this angular resolution constant, the minimum required cell size in small gaps between filaments can be determined, e.g. the total number of elements is a function of the discretisation in the smallest gap. A solution was considered convergent (red labelled data points in Figure 6), when it came to within ±1% of the limit value (indicated by arrows) of the permeability as a function of the total number of cells. The resulting permeability values are presented as percentage difference compared to the predictions by Gebart’s model
9
for transverse flow through a hexagonal filament arrangement at the same Vf. For these models, the number of elements in the smallest gap between two filaments have been counted and this information was then used to determine the minimum number of required elements in small gaps to discretise a flow model sufficiently.
Mesh convergence calculations for steady-state flow through hexagonal unit cells with a constant angular resolution, Δθ, of the filaments at varying fibre volume fraction, Vf. The resulting permeability values are expressed as the percentage difference to the predictions by Gebart’s model.
9
The data points represent varying user defined volume size within the smallest gaps between filaments. The points marked in red are considered to be within ±1% of the limit value.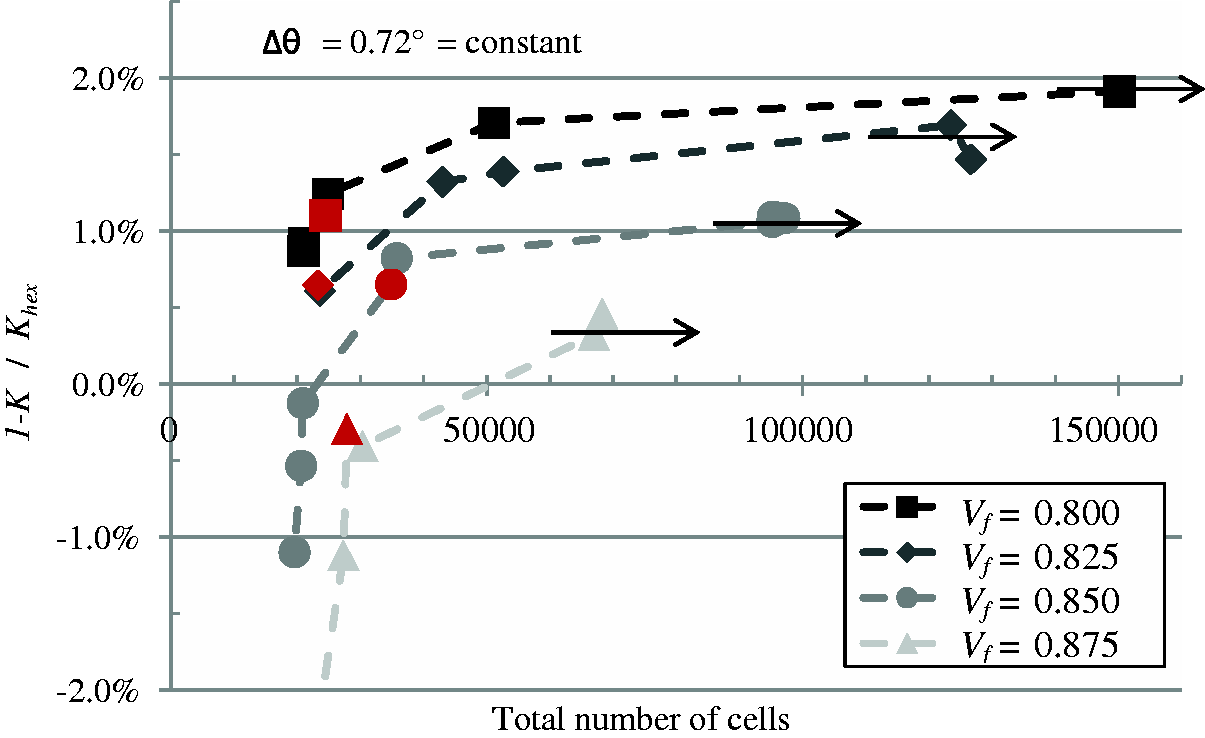
The local cell size h0 as a function of wg indicates that approximately 15 rows of cells are required across the gap width to obtain convergent solutions according to the selected criterion (Figure 7). This is significantly more than determined by Yazdchi et al.
15
who employed 10 rows of cells for the discretisation of small gaps in RVEs. A difference of permeability values of up to 5% for flow through hexagonal unit cells was estimated based on simulations using the optimum discretisation determined in this work compared to models using the discretisation recommended in the literature. This better result is likely based on a better description of the shape of the flow profile and a more precise estimate of the effects of the boundary layers. These differences in permeability are small but are likely to accumulate in larger models containing multiple filaments. The specified relationship of the cell size as a function of the gap width between filaments was implemented in the automated mesh refinement approach described in Model domain discretisation section.
Maximum size of triangular finite volumes, in terms of characteristic edge length, h0, for which convergence of the numerical solution for flux through an ideal hexagonal filament arrangement can be obtained, as a function of the inter-filament gap width, wg; data can be approximated by a linear trend line.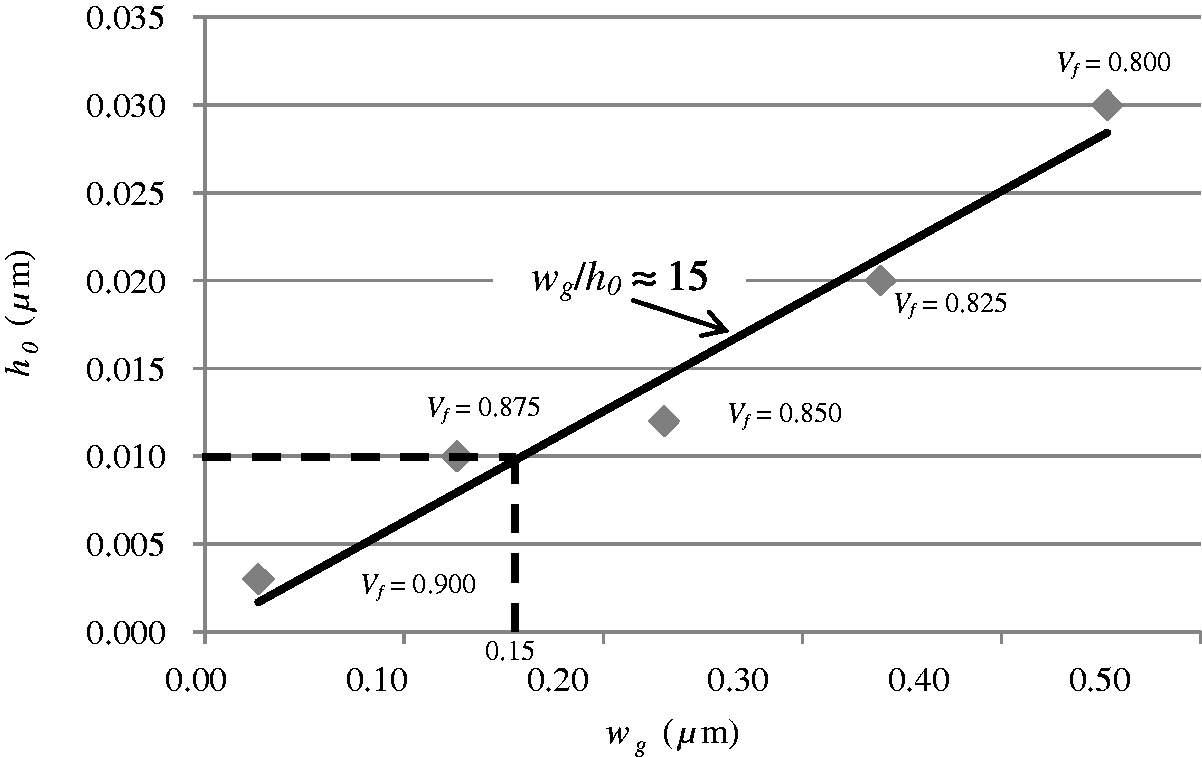
Flow through randomised filament arrangements
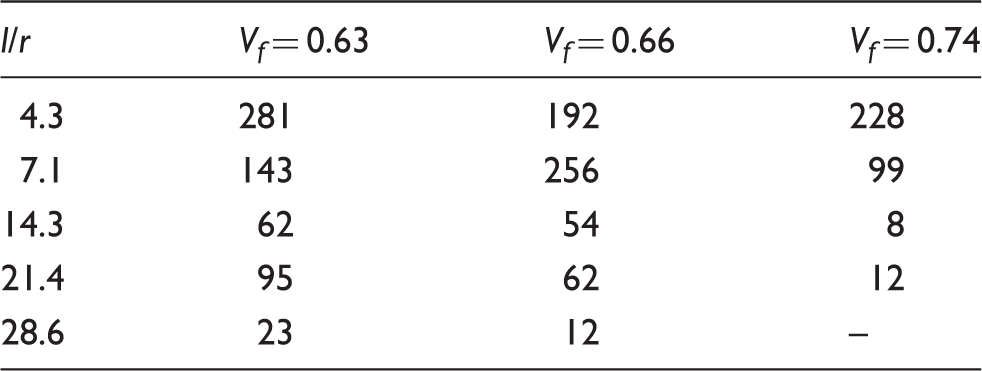
Number of simulations for three intra bundle Vf at different model sizes given as ratio of model side length, l, to average filament radius, r.
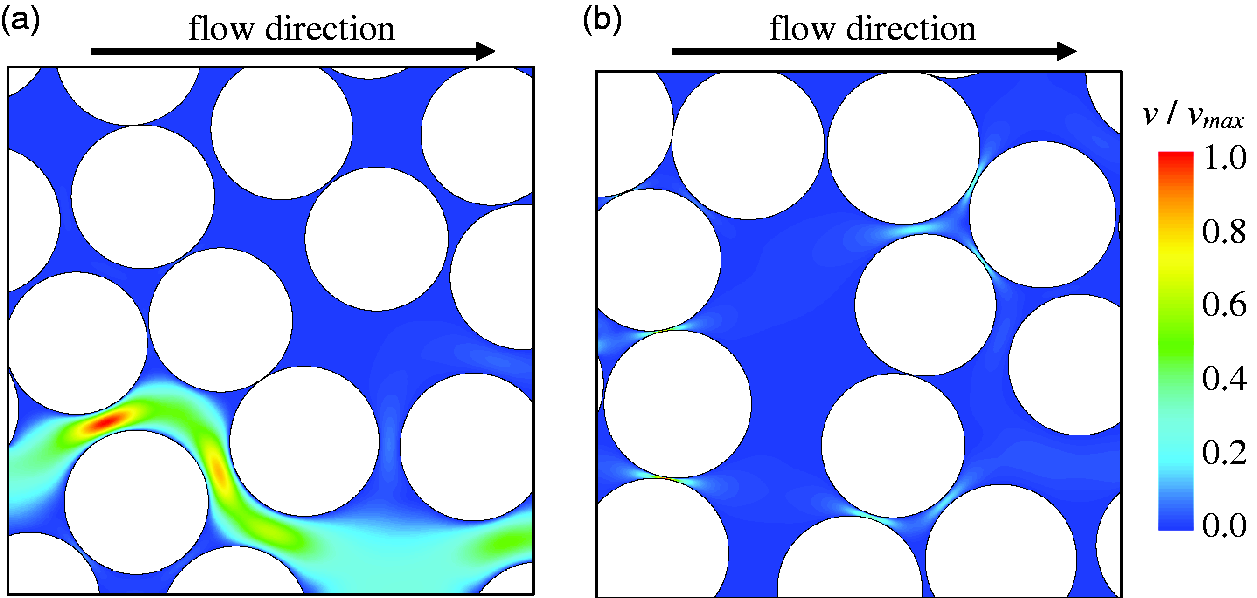
For transverse flow through random filament arrays, predicted permeability values varied significantly at identical Vf (Figure 8). From maps of the resulting flow velocities, it was observed that channels with increased fluid velocity may form locally (Figure 9(a)), which dominate the permeability of the model. This agrees with observations made in the literature.13–15 The possible blockage of such a channel explains the significant differences in transverse permeability values found at identical Vf (Figure 9(b)).
Normalised permeability results from 211 CFD simulations and the derived multiple linear regression model (MLR), compared with predictions of a hexagonal array
9
and the the predictions proposed by Chen and Papathanasiou
13
and Yazdchi et al.
15
for random arrangements. The dashed lines represent the exponential trend of the simulated and predicted permeability values, K. The fibre volume fractions are rounded to full percentages and the predictions are offset from the CFD simulations for clarity. Maps of velocity distributions for transverse flow through random filament arrangements at Vf = 0.64. (a) Flow channel present over which the majority of fluid is transported; K/r2 = 2.49 × 10⁻³. (b) Transverse flow is blocked by a fibre cluster; K/r2 = 1.56 × 10⁻⁵.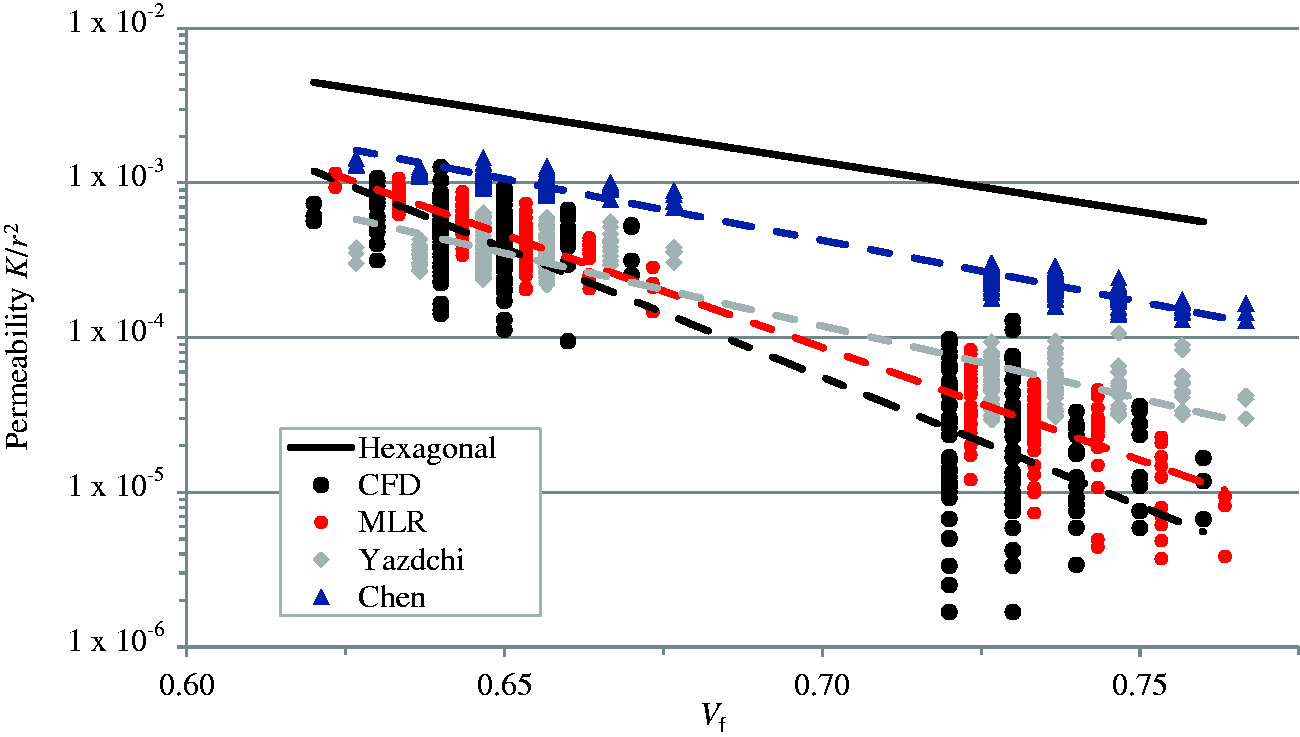
The simulated permeability values, normalised by the permeability of an ideal hexagonal filament arrangement at the same fibre volume fraction, Khex, were found to be log-normally distributed. The differences in transverse permeability for Vf = 0.63 and Vf = 0.66 are smaller than suggested by Gebart’s analytical model for a hexagonal arrangement,
9
which explains the relative position of the lines in Figure 10. The standard deviation of ln(K/Khex) decreases with increasing model size, i.e. ratio of model edge length, l, and average filament radius, r. Since, with increasing model size, the flux through an increasing number of local inter-filament flow channels is averaged, the scatter in permeability is reduced.
Mean and standard deviation of log-normally distributed permeability values from CFD simulations on random filament arrangements, normalised by Gebart’s analytical prediction for an hexagonal filament arrangement
9
as function of the ratio of model side length, l to average filament radius, r. For improved visualisation, the permeability values at Vf = 0.66 and Vf = 0.74 are shifted horizontally by ±0.2 from the values of Vf = 0.63.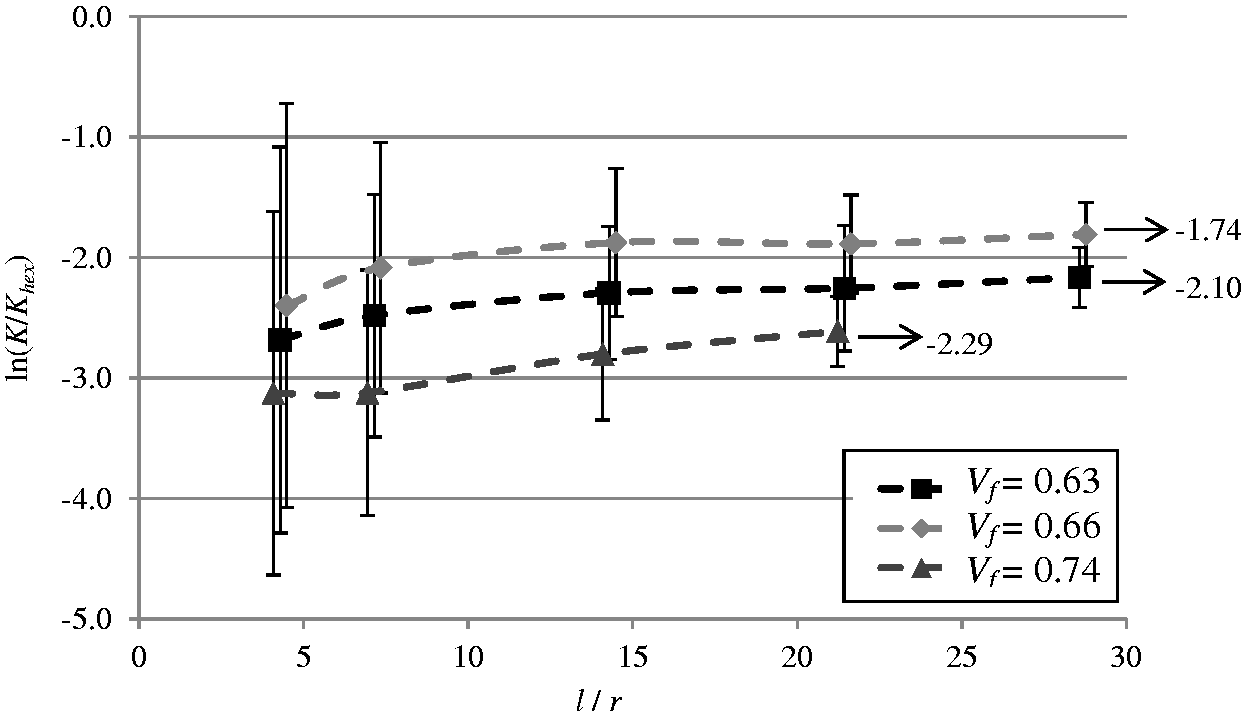
Numerous domain sizes are suggested in the literature depending on the material used and the property analysed. 28 However, as the representative model domain was shown to depend on the used micro-structural descriptor, 29 it is necessary to determine the model size convergence in this work by CFD simulations rather than using another computationally inexpensive model size predictor.
For a converged solution of steady state flow transverse to the filament axis, Yazdchi et al. 15 stated a l/r ratio of 80. In this work, the mean of ln(K/Khex) was found to converge to values of approximately −1.7 to −2.3, depending on Vf (Figure 10), for ratios l/r greater than approximately 20, which is similar to the value reported by Chen and Papathanasiou (l/r ≈ 23). 13 Models with an l/r ratio above this critical value for which convergence is achieved can be considered statistically equivalent to a complete fibre bundle. This implies that they can be expected to exhibit the same average permeability as the entire fibre bundle. The required computational effort can be reduced by limiting the model domain size to this critical ratio.
The reduction of the filament mobility, e.g. the reduction in physical space a filament can potentially occupy, with increasing Vf leads to a decreased scatter in absolute permeability values at a given model size (Figure 8). Compared to analytical model predictions for a periodic hexagonal filament arrangement, 9 the predicted average permeability values of the random arrangements are 6–10 times lower. As also observed in previous studies, these results show that local permeabilities cannot be estimated based on Vf only, and actual filament arrangements need to be considered.
Influence of the filament micro-structure
The dependence of the permeability on the overall Vf of a micro-structure is not unique due to the random arrangement of the filaments (Figure 9). Changes in the micro-structure due to different levels of compaction of the fibre bundles (varying Vf) are reflected in a reduction of the mean distance of a filament to its nth nearest neighbour at increased Vf. The differences in micro-structural descriptors for different model domains can therefore be correlated to the resulting permeability, and an analytical relation can be derived. This may enable to predict the permeability of a micro-structure without the need of additional numerical models.
Correlations between permeability and micro-structural descriptors
As the gaps between neighbouring filaments determine the local fluid transport, 9 their influence on the permeability is analysed. It should be noted that, since the filament radii are not identical for all filaments, the gaps between any pairs of filaments are not necessarily identical, even if the distance between filament centres in the pairs is identical. To allow comparison between different micro-structures, all distances are normalised by the average fibre radius of the individual model domain.
The relation between the estimated permeability and the average gap width between filaments,
The average and scatter of wg(
n
) between closest filaments (n = 1) are small. The fluid transport through these gaps is small and hence, these closest gaps do not show a strong correlation with the resulting permeability as indicated by the almost vertical regression line in Figure 11. The fluid will therefore more probably flow through a gap between a filament and a more distant neighbour. This corresponds to the observed flow channels dominating the permeability (Figure 9) which are not formed between the closest neighbours. The linear correlation coefficients, rs, (figure 12) between the second and third (n = 2,3) closest Correlation between permeability, K, normalised by the squared average filament radius, r2, and the average gap width, 
Maps of flow velocity (Figure 9) suggest that the orientation of gaps between filaments with respect to the main flow direction may influence the permeability of the micro-structure. Therefore, the circular mean,
Statistical model
Gebart
9
derived a simple analytical power law relationship of the transverse permeability to the Vf of a periodic arrangement based on the Navier–Stokes equation. The constant C is a shape parameter determined from the arrangement and Vf(
max
) is the maximum achievable Vf for the selected periodic arrangement, e.g. C ≈ 0.0578 and Vf(
max
) ≈ 0.91 for a hexagonal arrangement.
A number of models were derived to incorporate the randomness in random fibre arrays in a similar form as proposed by Gebart (equation (2)). Chen and Papathanasiou
13
derived an equation to scale the hexagonal permeability derived by Gebart with the ratio of the average gap formed between the closest neighbour, wg(1), in the random array to the smallest gap formed for filaments in a hexagonal array, wg(
hex
). The parameters α ≈ 1.51 β ≈ −1.93 were derived by fitting the power law to their CFD results.
Arguing that the contribution of flow between a filament and its closest neighbour will be small, Yazdchi et al.
15
proposed a relationship of K to the second nearest neighbour, wg(2), instead.

They fitted a similar geometrical constant, C ≈ 0.2, as Gebart to relate to the geometrical arrangement. Their exponential function is then scaled by another exponential function with parameters g0 ≈ 0.5 and m ≈ 3 derived by fitting their data to their CFD results.
A similar approach for the average gaps formed was attempted by Matsumura and Jackson.
14
Instead of scaling their function of average gap width by a second function, they modified the exponent directly.

Curve fitting this equation to their numerically derived K values, they proposed C = 0.3354 and v = 0.5426 for a good fit to the permeability of a random arrangement.
However, none of these functions describes the values of K obtained in this work well (Figure 8). This may be related to the different method of generating the micro-structures, which does not rely on a minimum gap width between adjacent filaments, and therefore results in a more non-uniform flow field than in other studies.
13
Additionally, all of the above models fit their data to the mean K; however, it was found that the K is log-normally distributed. A simple fit to the Gaussian mean is therefore not appropriate. The minimum Vf in this work is also higher than the maximum used in other studies to allow analysis of the flow in real fibre bundles.
22
This may suggest that the models above may not be applicable for flow present in real fibre bundles used in composite manufacturing. More importantly, it was demonstrated that it is not possible to find a single descriptor explaining the scatter in permeability (Correlations between permeability and micro-structural descriptors section). Therefore, more than one parameter is used here. It is possible to fit statistical models based on correlated data to a defined response variable.
32
One of these models is the MLR, which fits linear equations to observed data.

In this case, the observation, y (the permeability K in this work), is related to the sum of several predictor variables, xi, weighted by constant coefficients, βi, and a constant offset, β0.
The input data for these models needs to be normally distributed, and therefore it is necessary to analyse the logarithmic values, ln(K), of the log-normally distributed permeability (Flow through randomised filament arrangements section) as the dependent variable. The units of the variables and coefficients are ignored in this type of MLR models which are explanatory only.
Vf is strongly negatively correlated with the permeability and is therefore used for generation of an MLR model in this work. In addition, 
It should be stressed that the absolute values of βi do not reflect any physical property and are simply weighting factors for the selected input parameters. The average angles of a filament to its nth nearest neighbour do not correlate strongly with the permeability (Figure 12) and are therefore not employed in this model.
Correlation coefficients, rs, of different micro-structural descriptors with permeability, ln(K). As descriptors the fibre volume fraction, Vf, and for the first three nearest neighbours (n = 1,2,3), the mean and standard deviation, σ, of gaps, wg(
n
), and angles, αn, between filaments and the kurtosis, k0, of the angle distributions are shown.
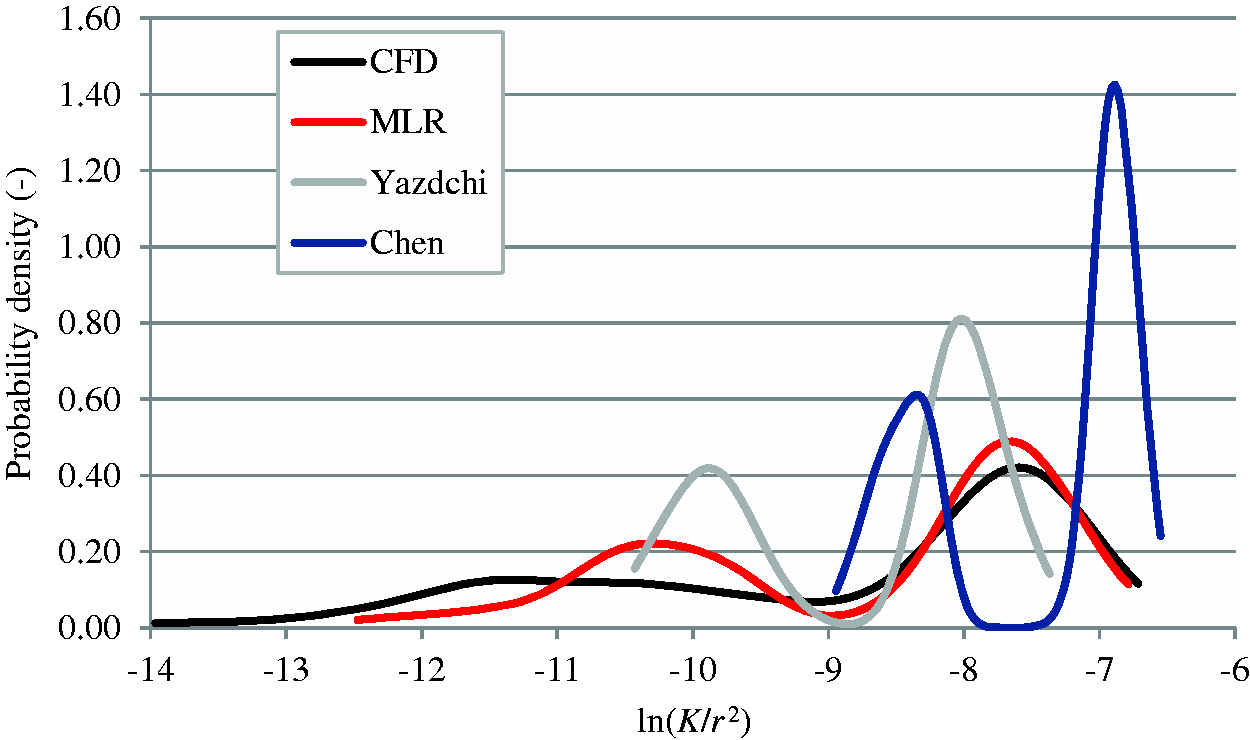
The derived equation predicts the observed spread of permeability values more accurately than the other models based on a single geometrical descriptor (Figure 8) which is reflected in similarity of K values to those derived from CFD. The probability density curve (Figure 13) for the MLR data fits the CFD simulations better than the probability density for published models.13–15 In addition, the probability density of the MLR model is wider than that of the other models. This indicates that a larger spread of K values can be estimated if more than one geometrical parameter is used. The analytical model in this work (equation (7)) shows a similar trend as predicted based on experimentally determined distributions of regular filament arrangements.
24
As the MLR model is derived to be predictive only for the analysed Vf range, it does not default to the hexagonal arrangement when the corresponding input values are used. This shortcoming may be overcome when using a different statistical modelling approach, e.g. non-linear regression. The achieved accuracy of predictions is, however, higher than that based on existing models in the Vf range of interest.
Smoothed probability density estimates of the normalised permeability values, ln(K/r2), derived from CFD simulations, compared to analytically predicted values for the same fibre arrays using the derived multiple linear regression model, MLR, and the predictions of Chen and Papathanasiou
13
and Yazdchie et al.
15
Concluding remarks
Since experimental determination of the permeability at the micro-scale is difficult, numerical simulations are employed to describe flow at this scale. Automatic generation and discretisation of flow domains on statistically equivalent micro-structures were implemented in a Matlab® program. This discretisation process allowed omitting the assumption of a minimum distance between filaments, which would imply an unintended constraint on the analysed micro-structures. To obtain the desired accuracy of the solution, it was concluded that a minimum of 15 rows of cells in small gaps were required. Convergence of the derived average transverse permeability values was found at a ratio of flow length to filament radius greater than 20 for all analysed fibre volume fractions. The convergence of the permeability with increasing model size was related to the probability of formation and local blockage of main flow channels. It was not found feasible to relate the scatter in permeability to a single micro-structural descriptor. Using five correlated descriptors, fibre volume fraction, average gap width and corresponding standard deviation to the second and third nearest neighbour, it was possible to generate an MLR model to predict the permeability. The requirement for five input parameters may sound excessive; however, when determining statistical descriptors in random filament arrays, it is almost no extra effort to derive more than one of these. The proposed statistical model predicts the permeability significantly better than models proposed in the literature. Differences in permeability predictions are probably related to the influence of local filament arrangements, which are not taken into account when using average values. The scatter of permeability values can, however, be reproduced with this computationally inexpensive method. Exploring more sophisticated statistical models, e.g. non-linear regression, may result in even better predictions of permeability in the future.
Footnotes
Declaration of Conflicting Interests
The author(s) declared no potential conflicts of interest with respect to the research, authorship, and/or publication of this article.
Funding
The author(s) disclosed receipt of the following financial support for the research, authorship, and/or publication of this article: This work was supported by the Engineering and Physical Sciences Research Council [grant number: EP/IO33513/1], through the EPSRC Centre for Innovative Manufacturing in Composites (CIMComp) and by an EPSRC Doctoral Prize award hosted by the University of Nottingham. We are grateful for access to the University of Nottingham High Performance Computing Facility.