
Abstract
Background:
The 2007 to 2009 U.S. economic recession was associated with widespread job loss, housing instability, and rising mental health challenges. While previous studies have linked economic downturns to psychological distress, limited research has examined how health insurance status modifies this relationship during and after a recession.
Aims:
This study investigated changes in psychological distress (PD) among U.S. adults before, during, and after the 2007 to 2009 recession and examined whether insurance status mediated the relationship between economic hardship and PD.
Methods:
Using Behavioral Risk Factor Surveillance System (BRFSS) data from 2007, 2009, 2012, and 2013, the study applied an integrative data analysis (IDA) framework to construct composite demographic profiles and approximate longitudinal trends. Structural equation modeling (SEM), including exploratory and confirmatory factor analysis, panel modeling, and mediation analysis, was used to examine PD trends and the influence of insurance coverage and income.
Results:
Exploratory and confirmatory factor analyses confirmed a two-factor structure of PD: depression and anxiety symptoms. From 2007 to 2009, PD remained stable, but levels improved between 2009 and 2012. Higher uninsured rates significantly increased PD, with a 1% increase in the uninsured population resulting in a 17.4% rise in PD. Mediation analysis showed that limited access to mental health treatment partially explained the relationship between being uninsured and increased distress.
Conclusion:
Health insurance status plays a critical role in moderating psychological distress during economic downturns. Expanding insurance coverage and integrating mental health services into economic recovery efforts may mitigate long-term mental health consequences of financial crises.
Keywords
Introduction
The economic downturn that began in mid-2007 triggered a recession in the United States, lasting through mid-2009. This period was marked by a steep decline in stock values, widespread foreclosures, and rising unemployment rates (U.S. Bureau of Labor Statistics, 2016). Between December 1, 2007, and June 1, 2009, the unemployment rate increased from 5% to 9.5%, a jump unprecedented in recent history (U.S. Bureau of Labor Statistics, 2016). The financial strain, coupled with the housing crisis, heightened the risk of mental health challenges such as long-term depression (McInerney et al., 2013; Riumallo-Herl et al., 2014), anxiety, and stress, as well as increased suicide mortality rates (Barr, 2012; McLaughlin et al., 2012). Additionally, the recession contributed to reduced health care utilization (Mortensen & Chen, 2013; Travers et al., 2017) and barriers to mental illness treatment (Rowen et al., 2013, Walker et al., 2015; van Beljouw et al., 2010).
The combination of soaring unemployment and the collapse of the housing market during the 2007 to 2009 recession contributed to a rise in mental health issues among U.S. adults. Research has explored the relationship between mental distress and economic downturns (Alley et al., 2011; Lasser et al., 2000; Le Cook et al., 2014; McLaughlin et al., 2012; Pollack et al., 2011). However, to our knowledge, there has been little investigation into how insurance status influences psychological stress during a recession. While past studies have examined links between clinical mental illness and economic hardship (Lasser et al., 2000; Miles et al., 2003; Sanchez-Villegas et al., 2008), the interplay of insurance coverage and psychological distress during the 2007 to 2009 economic crisis remains largely unexplored. Understanding these connections may offer valuable insights into how economic hardship shapes mental health and how insurance status modifies psychological distress within the general population.
This study examines how psychological distress changes among adults during periods of high economic stress (recession) compared to periods of low economic stress (non-recession). Additionally, it explores whether insurance status mediates this relationship by affecting access to mental health services. The study utilizes a multiyear dataset from the Behavioral Risk Factor Surveillance System (BRFSS), a self-reported survey that collects behavioral risk data from more than 400,000 adults annually at the state and local levels. The analysis focuses on the Kessler-6 survey questions from the Mental Health and Stigma Module as key data elements. BRFSS has been widely used in public health decision-making and health promotion efforts, and multiple studies have validated its reliability and methodological rigor (Adams et al., 2015; Burger & Reither, 2014; Dwyer-Lindgren et al., 2013; Elliott & West, 2015). Regarding mental health assessments, research by Andersen et al. (2003) and Kapp et al. (2009) found moderate to excellent reliability across measures of quality of life and mental distress.
To address the challenge of analyzing cross-sectional data across multiple years, this study employs an integrative data analysis (IDA) framework, which pools datasets by creating composite observations based on demographic characteristics. This innovative approach approximates longitudinal trends, enabling a robust examination of psychological distress over time. Combined with structural equation modeling (SEM), IDA facilitates the integration of diverse datasets to uncover population-level patterns (Curran & Hussong, 2009). This methodological approach builds on prior research by offering a novel way to examine mental health trends across economic cycles.
Unique Contributions of This Study:
Utilization of nationwide, multistate datasets spanning multiple years.
Examination of psychological distress trends throughout economic downturns.
Application of an integrative data framework to model population-level trends using multiple years of cross-sectional data.
Expansion of existing literature by further validating the Kessler-6 scale as a measure of psychological distress.
Methods
Data source
Data were drawn from the BRFSS, a nationwide survey collecting self-reported health data. The BRFSS dataset consists of responses from a nationally representative sample of non-institutionalized U.S. adults and has been widely used in epidemiological studies examining health behaviors and risk factors. The Mental Health and Stigma module, available in 2007, 2009, 2012, and 2013, provided information on psychological distress (Kessler-6 scale).
Study design
A cross-sectional study design was used with an IDA (Integrative Data Analysis) framework to pool datasets from different years. Matching demographic variables – sex, race, age, income, and education – enabled comparisons across time. This design allows for a broad understanding of trends over time, though it is important to acknowledge that causality cannot be directly inferred.
Measures
Psychological Distress (PD) is a broad term that describes psychological comfort. PD was measured using the Kessler-6 (K6) scale (Kessler et al., 2003), which evaluates symptoms of anxiety and depression. Higher scores indicate greater psychological distress. Based on Kessler et al. (2003) and Prochaska et al. (2012) individuals can be classified into one of the three categories: low to no psychological distress (total score <11), moderate psychological distress (11⩽ total score <19), or serious psychological distress (total score ⩾19). Since Kessler et al. (2003) has shown that serious PD is strongly associated with serious mental health, the three categories and cutoff points were used in the present study.
Health insurance status
Presence or absence of health insurance. The variable was examined as a potential buffer against financial strain’s impact on mental health.
Covariates
Age, sex, race, income, education. These factors were controlled for in the analysis to account for demographic influences on mental health and health behaviors.
Unit of analysis
The unit of analysis is the composite observation created from the BRFSS survey respondents to reflect different combinations of age-sex-race-income-education strata, each stratum representing one observation that is longitudinally observed for group level changes. Each composite observation is unique and is comprised of the following variables: sex, race, age, income level, and education level. For example, one composite variable is: female, white, 18 to 24 years of age, income 0 to 15k, did not graduate high school; another is male, black, 30 to 44 years of age, income of 15 to 25k that graduated high school. The total number of unique computed observations is 2 (gender) × 2 (race) × 4 (age) × 3 (income levels) × 4 (education levels) = 192. These composite observations are computed for each year of study and used in the analysis. Creating composite population level observations were based on the paired samples design by common factor at the record level (demographics and socioeconomic characteristics); more specifically, matched samples, where individuals are matched on personal characteristics (in this case five characteristics; Stuart, 2010).
Statistical analysis
This study utilized Structural Equation Modeling (SEM) to analyze relationships among psychological distress and insurance status, as well as to explore trends over time. SEM was selected due to its ability to incorporate latent (unobserved) variables and simultaneously analyze multiple dependent variables. The statistical methodology consisted of Exploratory Factor Analysis (EFA), Confirmatory Factor Analysis (CFA), and mediation analysis. Latent Growth Modeling (LGM) was initially considered but replaced with a linear panel model due to negative variance issues, as described below.
EFA was conducted to identify underlying factors within the K6 psychological distress survey, while CFA was used to confirm these factor structures. To ensure measurement equivalence across time, confirmatory factor analysis models were tested for configural, metric, and scalar invariance. These steps verified that the construct of psychological distress was consistently measured across years, confirming that observed differences over time reflected true changes rather than variations in survey interpretation. The model fit was assessed using standard criteria, including comparative fit index (CFI), root mean square error of approximation (RMSEA), and standardized root mean square residual (SRMR). Adjustments were made based on modification indices to improve model fit where necessary. Factor scores were computed to provide numerical estimates of participants’ standing on latent psychological distress factors.
To assess the trends of psychological distress before, during, and after the 2007 recession, a linear panel model (with MLM (robust maximum likelihood estimation) estimator with robust standard errors and a Satorra-Bentler scaled statistic technique (Satorra & Bentler, 2010) was used to model the data). We used MLM instead of traditional LGM (latent growth modeling) because LGM yielded a negative variance for the slope, suggesting that LGM might not be appropriate for the data. Panel models measure changes that occur between two or more points in time, and it provides paths between the latent variables (Hannan & Young, 2018). The paths between the variables represent stability over time. Compared to LGM, panel models measure relationships between two successive time points (i.e. relationship between PD07 to PD09 and the relationship between PD09 to PD12, where LGM measures overall change of constructs over time as a growth/model).
To address the challenge of merging cross-sectional datasets from different years, composite observations were created based on demographic categories, including sex, race, age, income, and education level. Instead of an individual-to-individual merge, this method grouped participants with similar demographic backgrounds and calculated average responses within each group. This approach approximated an ‘average’ individual within each category across time points, allowing for an estimation of psychological distress trends in the absence of a longitudinal dataset. Sensitivity analyses confirmed that the composite observations maintained a tight distribution around the mean, supporting the validity of this method.
Mediation analysis was conducted to examine the role of health insurance in the relationship between mental health care utilization and psychological distress. Health insurance was hypothesized to act as a mediator, mitigating the effects of limited health care access on distress. Direct, indirect, and total effects were calculated to quantify this mediation effect.
Path diagrams were used to visually represent relationships among variables, with latent constructs depicted as circles and observed variables as rectangles. Different types of arrows indicated causal and associative relationships, aiding in the interpretation of model outcomes. This comprehensive analytical approach allowed for a nuanced understanding of how economic hardship and health insurance status influenced psychological distress over time.
Results
A preliminary analysis was performed on the 2013 K6 survey questionnaire to find the factor structure underlying the dataset. Exploratory Factor Analysis (EFA) was used to find the number of factors in the survey, and Confirmatory Factor Analysis (CFA) was performed to confirm the number of factors found in EFA. Latent Growth Modeling (LGM) was initially considered but replaced with a linear panel model due to negative variance issues, as described below.
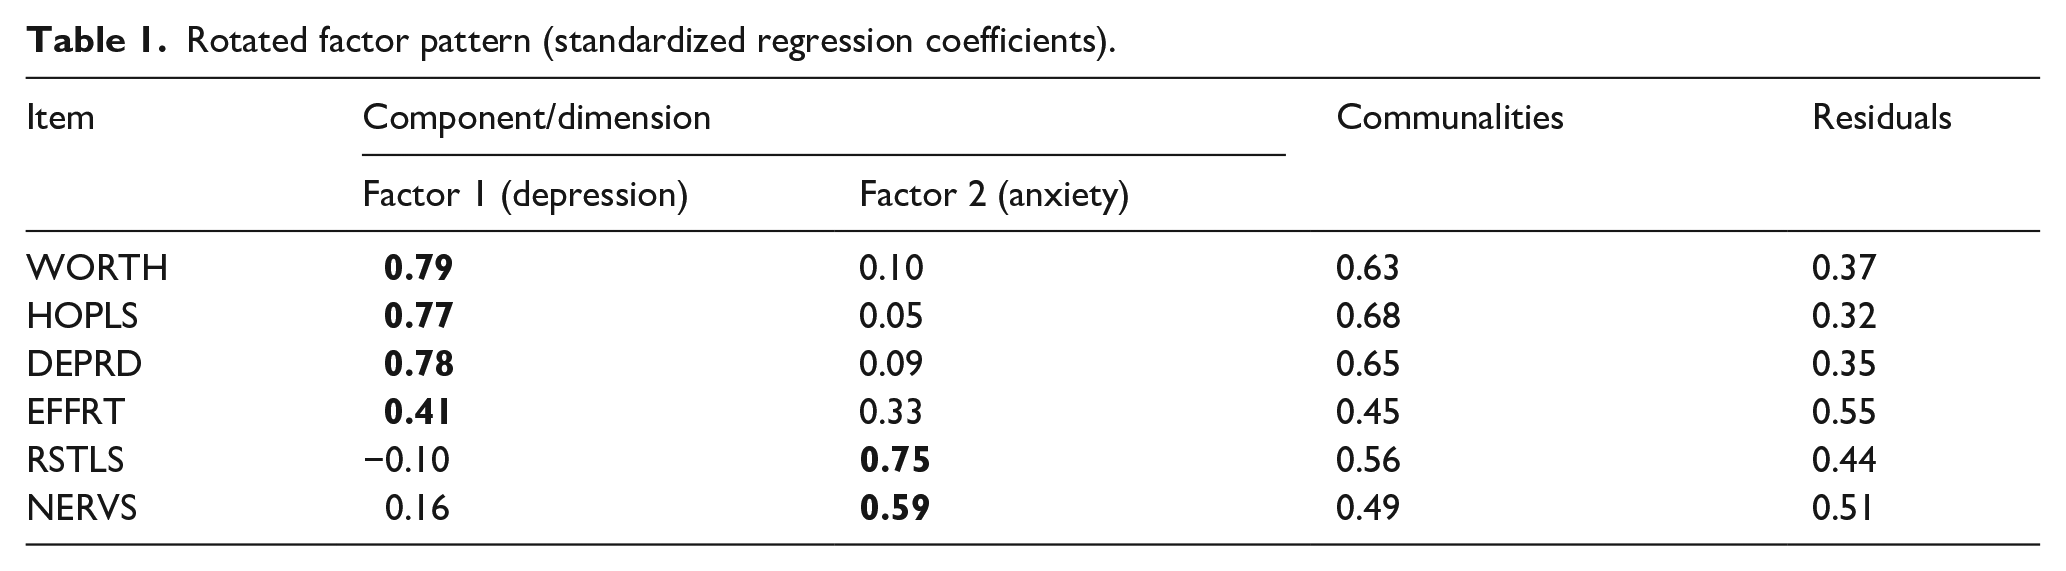
Each step in EFA was followed as recommended by previous analysis done by multiple researchers (Costello & Osborne, 2005; Williams et al., 2010; Yong & Pearce, 2013). Through EFA, it was found that the K6 has two a factor structure consisting of Depression symptoms (worth, hopls, deprd, and effrt) and Anxiety symptoms (restls and nervs). Our two-factor solution also confirms the findings by Ko and Harrington (2015; Table 1).
Rotated factor pattern (standardized regression coefficients).
CFA was used to confirm the two-factor structure found in the EFA analysis. The 2012 survey data was for the CFA analysis since we had multiple years for the K6 survey. CFA confirmed the two-factor structure found in the EFA: depression symptoms (worth, hopls, deprd, and effrt) and anxiety symptoms (nervs, restls), as presented in Figure 1. All the factor loadings were standardized and statistically significant (p < .0001), with loadings of 0.4 or greater considered acceptable and loadings of 0.7 or greater considered excellent (Comrey & Lee, 1992), as indicated in bold. The residual matrix showed really low residuals confirming the model has a good model fit.
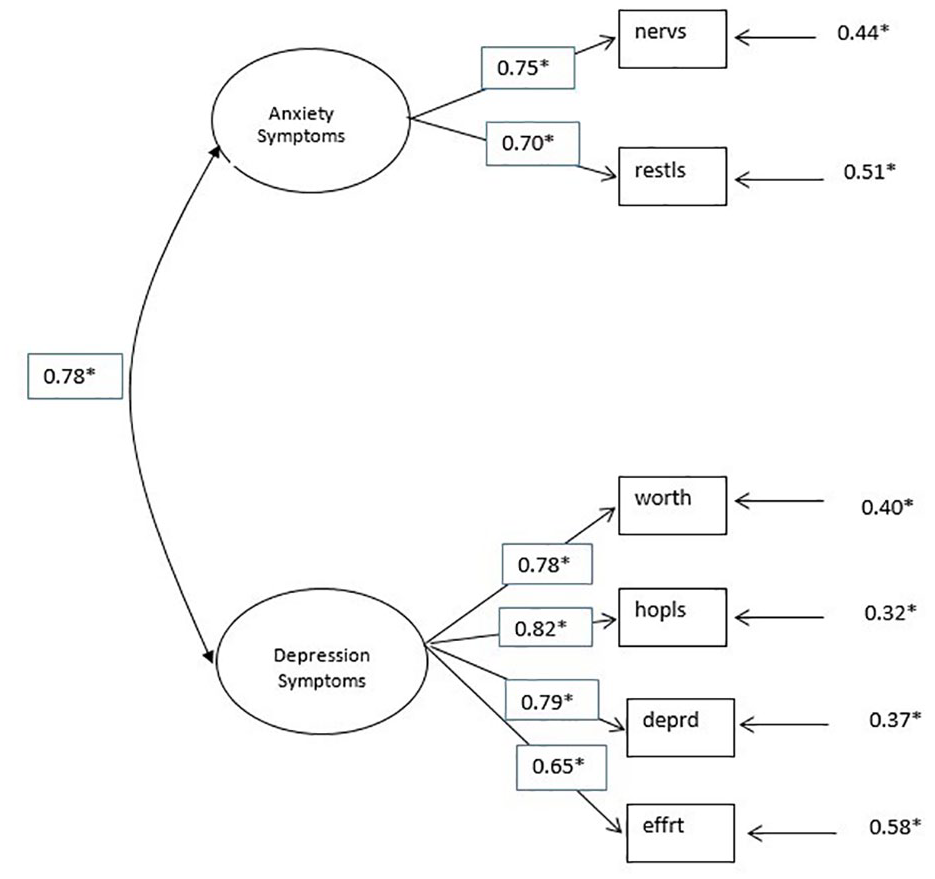
Confirmatory factor analysis on 2012 survey data.
Exploratory factor analysis revealed two distinct factors: depression and anxiety symptoms. Depression includes four items (worth, hopls, deprd, and effrt), while anxiety includes two (nervs and restls). Item loadings were strong, particularly for depression. Confirmatory factor analysis indicated a good model fit despite a significant chi-square (due to large sample size, N = 63,838). Other fit indices (RMSEA, NNFI, CFI, SRMR, and GFI) were within acceptable to very good ranges. These findings support the two-factor structure of the survey and align with prior work by Ko and Harrington (2015).
Having validated the two-factor structure of the K6 scale, the analysis next addresses the challenge of merging cross-sectional datasets across years. By creating composite observations based on demographic groups, the study approximates longitudinal trends to examine changes in psychological distress over time.
Once the two-factor structure of the survey was confirmed, merging the datasets was one of the most important next steps in this analysis. Since the datasets were not longitudinal an individual-to-individual merge was not possible. As a result, composite observations were used to mimic the individual-to-individual merge. The matchup was created by grouping individuals based on the same demographic background. For example, the first group included all the white male individuals that are between age 18 to 29 years, with low income ($0–$25k) and did not graduate High School. The response for the ‘group’ was calculated averaging the individual responses within each group. The assumption made was that even though each dataset does not follow the responses for the same individual over time by using these composite observations we created an approximation of an average individual for each category. For each variable used an average score based on individuals’ responses was created and these scores or composite responses were used in the analysis. Sensitivity analysis was performed and found that each composite observation had a tight distribution around the mean supporting the use of the K6 for an ‘average’ individual of a given type.
A longitudinal measurement equivalent was performed to determine whether the survey items assess the same question meanings across time (Horn & McArdle, 1992). Two step analysis was performed: (1) examine the distribution of the data via skewness and kurtosis. Kline (2011) recommended a value of 3.0 and above for ‘severe’ skewness and values above 10.0 suggesting a problem with kurtosis. Looking at the results of our data no severe skewness or serious problem with kurtosis was found with one exception for worth09, where “09” represents the year (2009) when the survey was given (skewness value of 3.48 and kurtosis value of 21.63). (2) specify the model, estimate parameters and impose equality constraints across time periods. The following models were run: configural invariance model (no constraints or baseline model), metric invariance or equal loadings invariance model, scalar invariance or equal loadings and intercepts model, and means model or equal loadings, intercepts, and means model (Cheung & Rensvold, 2002; Little, 1988). The results of the three models are listed in Table 2 below.
Measurement invariance.
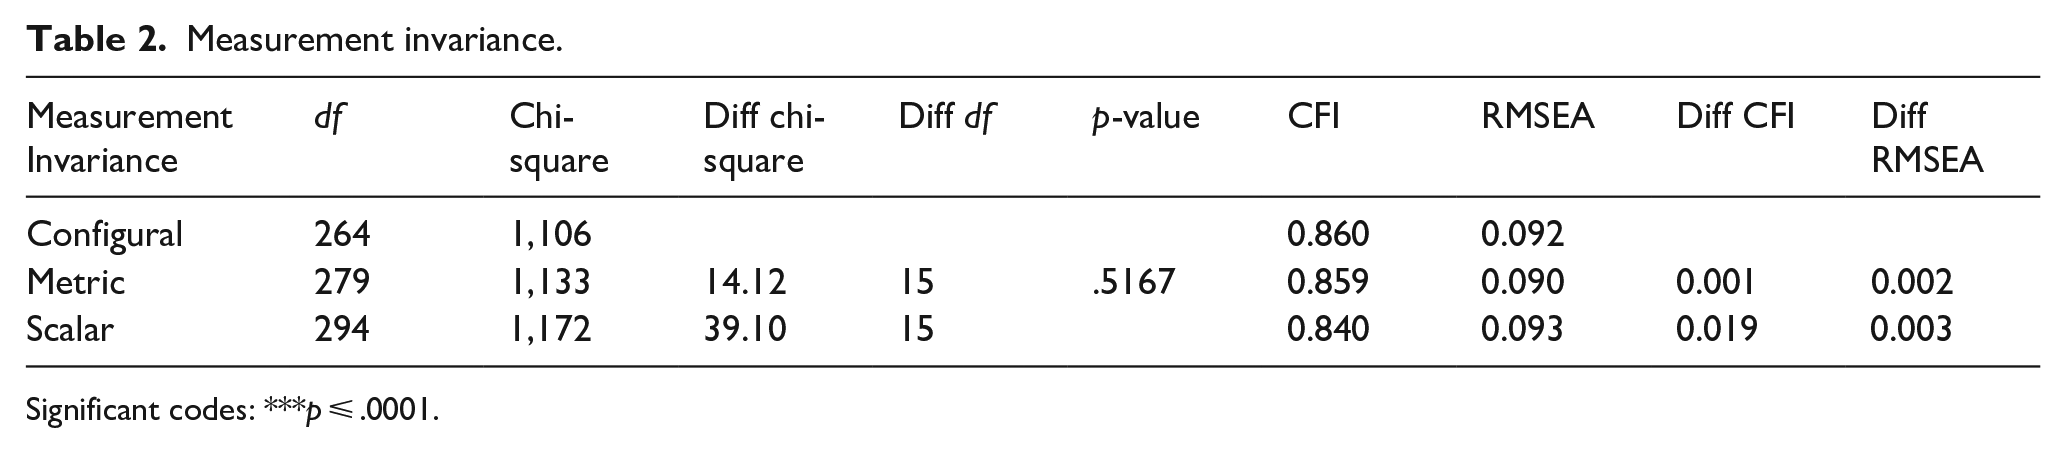
Significant codes: ***p ⩽ .0001.
Based on these results we can conclude there is no difference between males and females regarding the measure of the K6 survey for all the years. These results allowed the analysis to move forward, as invariance was confirmed. Thus, the data was considered as a longitudinal representation of mental health perspectives in the population.
Once the longitudinal equivalency was confirmed, a model assessing the PD trends was built. How did PD change over time before, during, and after the 2007 recession? For this question the robust maximum likelihood estimation was used (MLM) with robust standard errors and a Satorra-Bentler scaled statistic (Satorra, & Bentler, 2010). Using the robust estimation method to assess the fit of the model yielded a SatorraBentler scaled Chi-square value of 247.134, with 133 degrees of freedom, and p < .001.
The fit indices for the model are good with: CFI = 0.924, TLI = 0.912, RMSEA = 0.067 (95% CI RMSEA [0.059, 0.075], SRMR = 0.059. These values indicate a good fit between the model and the observed data.
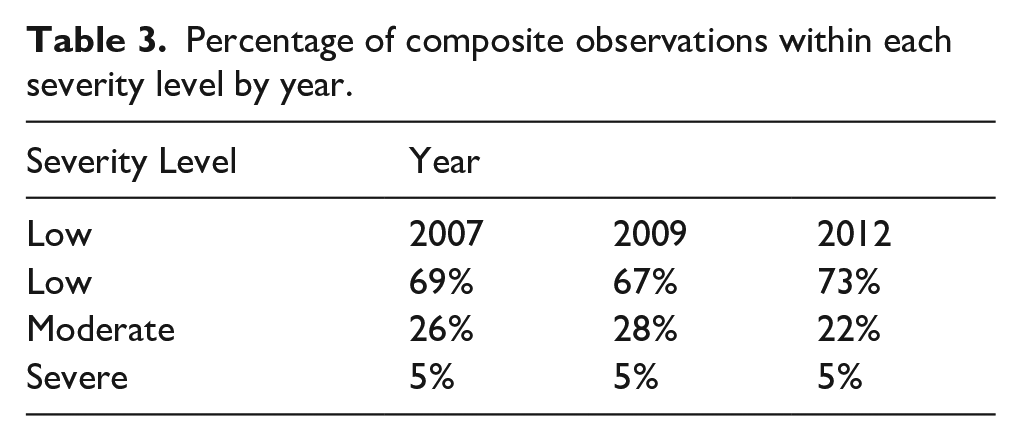
As shown in Figure 2, the path model’s coefficients of stability showed that the level of PD between 2007 and 2009 stayed the same and the level of PD between 2009 and 2012 has changed, but it does not show the direction or magnitude of the change. As a result, sum scores by PD severity level were created for each year in order to see where the change in PD might have happened. Table 3 shows the change in percentage of the average observation by severity level by year, showing the percentage of the population with low PD decreased, and moderate PD increased from 2007 to 2009 by two percentage points, a result that was expected.
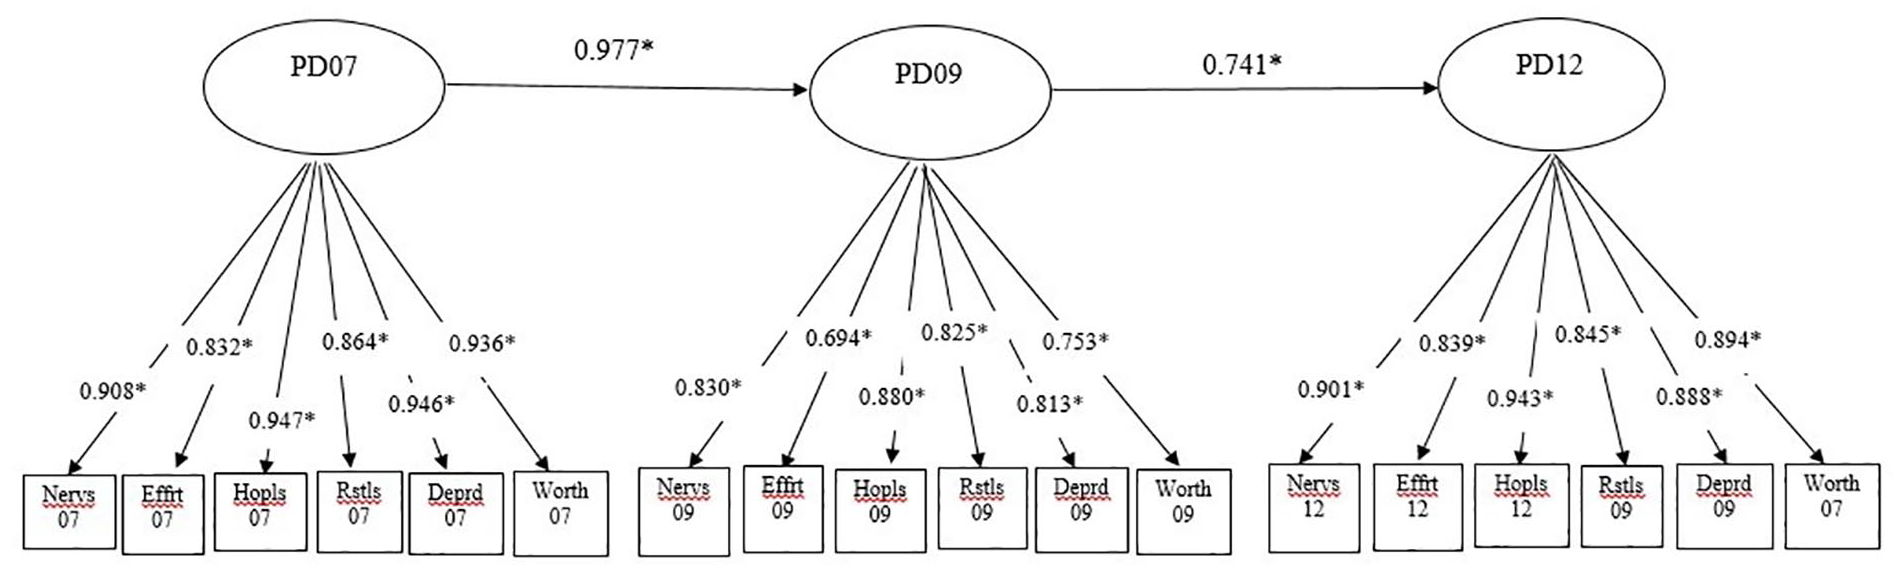
Panel model, no covariates.
Percentage of composite observations within each severity level by year.
In the last step of the analysis, we examined the PD trend by adding income and health insurance status as covariates. We wanted to assess the impact of income and/or level of uninsured on PD over the three time periods. Health insurance is represented as the percentage of uninsured and is continuous, and income is categorical (0–25k, 35–50k, and 50+).
Multiple models were run: (1) effect of income on the stability of PD07, (2) the effect of the percentage of uninsured on PD, (3) the effect of both covariates on PD. For the first two models we have found that income significantly affects PD07, with a one-unit increase (e.g. low to middle or middle to high income) reducing PD07 by 3.7% and the percentage of uninsured significantly increases psychological distress (PD), with a 1% increase in uninsured raising PD07 by 21%.
The final model looked at the effect of both variables: income and uninsured on the stability of PD. As shown in Figure 3, income is statistically significant and has a negative effect on PD07 by 2.3%. Uninsured is statistically significant and has a positive effect on PD07 of 14.8%. The level of uninsured has a much larger impact on psychological distress as compared to income. Research found that the recession causes lower per capital income with individuals moving from private insurance to public insurance (Herring & Trish, 2015; Holohan & McMorrow, 2013). The mean income did not change over time as previous research suggested. Adding the two covariates in the model did not have a significant impact on the coefficients of stability and did not change the relationships among PD07 over time.
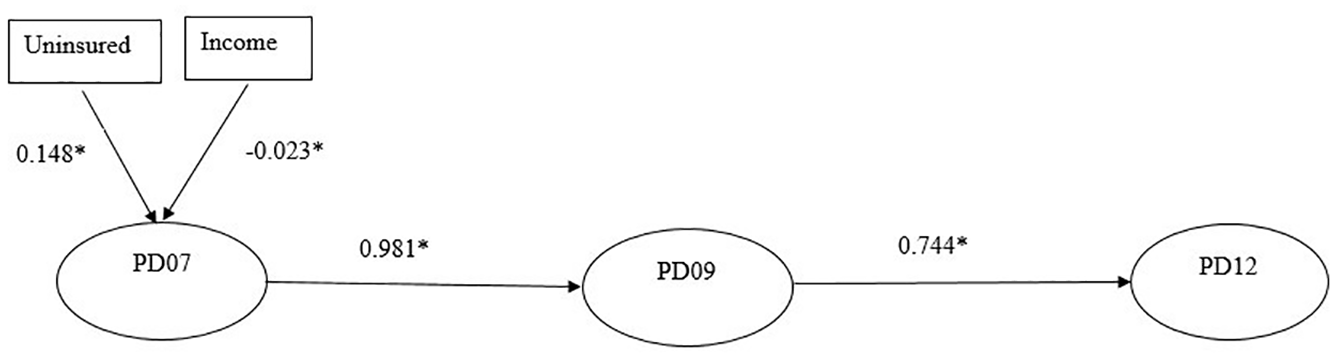
Panel model, income and uninsured as covariates.
Adding the two covariates in the model did not have a significant impact on the coefficients of stability and did not change the relationships among PD07 over time.
As an alternative model, we assumed that the presence or absence of health insurance is associated with mental healthcare utilization which in turn, impacts the level of psychological distress. The model results are shown in Figure 4 below.
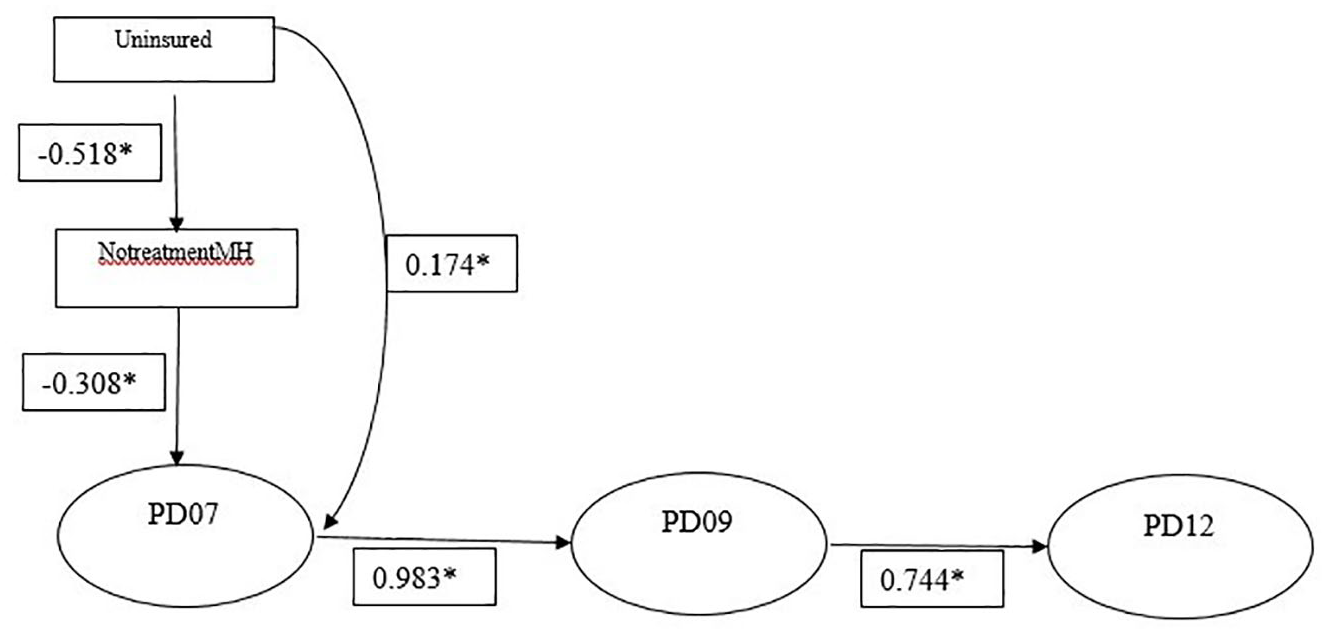
Mediation panel model.
Results indicate that a 1% increase in the uninsured population leads to a statistically significant 17.4% rise in PD. The indirect effect, mediated by lack of mental health treatment, contributes 16.0%, making the total effect of being uninsured on PD 33.3%. The introduction of the covariates does not change the direction of the relationship of PD over time compared with the panel model with no covariates.
Overall, the findings highlight how fluctuations in uninsured rates and access to mental health treatment influence psychological distress over time.
Discussion
The research highlights the significant role of health insurance in reducing psychological distress (PD), particularly during economic downturns. Expanding mental health coverage and access to care could serve as a crucial protective measure. The study found that while the relationship between PD07 and PD09 remained stable, the relationship between PD09 and PD12 changed, likely due to shifts in PD severity levels – an increase in low PD and a decrease in moderate PD. This unexpected stability from 2007 to 2009, despite the recession’s peak, may reflect the short 30-day reference period of the K6 scale, which may not fully capture cumulative economic stressors. Additionally, unmeasured factors such as social support, community resilience, or early recession coping mechanisms could have mitigated distress during this period, warranting further exploration in future studies. Income had a minimal effect on PD across time, whereas being uninsured had a consistently strong impact.
Higher uninsurance rates significantly increased PD. This finding suggests that those without access to healthcare experience greater distress, possibly due to lack of mental health services and financial insecurity. Income had a small but non-significant effect on PD trends. While financial insecurity is a known stressor, other unmeasured variables such as social support, resilience, and employment conditions may play a mediating role.
Alternative models revealed that the recession had no significant effect on PD levels from 2007 to 2009 but did influence PD from 2009 to 2012. This unexpected finding may be attributed to the recession’s mid-2007 to mid-2009 timeframe, the short-term nature of the K6 questionnaire, or broader economic and personal factors. The expected decline in PD from 2009 to 2012 aligns with economic recovery and decreasing unemployment.
The study confirmed that higher income levels were associated with lower PD, while higher uninsured rates increased PD, aligning with existing literature. However, income had little impact on PD stability over time, likely due to the short 30-day reference period in the survey. The uninsured rate had a stronger effect during the recession but a lesser impact post-recession. Despite prior research showing declining incomes during economic downturns, the study did not observe major income shifts, possibly due to the dataset’s categorical income classification.
The mediation analysis demonstrated that the uninsured rate significantly impacted PD, with a total effect of over 17% per 1% increase in the uninsured population. However, introducing mental health treatment as a mediator had minimal influence on PD levels. The mediation model altered the relationship between PD across years, with decreased stability coefficients from PD07 to PD09 (0.983–0.610) and from PD09 to PD12 (0.744–0.389), likely due to a lower uninsured rate and increased mental health treatment. These findings reinforce the importance of healthcare access in mitigating psychological distress, particularly in vulnerable populations.
Study limitations
Despite its strengths, this study has several limitations. The cross-sectional nature of the BRFSS data prevents causal inference. Additionally, reliance on self-reported measures introduces potential recall bias. Furthermore, while demographic variables were controlled for, other unmeasured factors such as social support and pre-existing mental health conditions may influence the observed relationships.
Future research should adopt longitudinal designs to better understand the dynamic interplay between economic stressors, health behaviors, and mental health outcomes. Additionally, qualitative studies could provide deeper insights into individual coping strategies and barriers to mental healthcare access.
Impact and policy implications
A central goal of this research was to highlight the significance of psychological distress as a crucial yet often overlooked component of mental health. The findings emphasize the need for policymakers, employers, and insurance companies to consider PD in mental health policies. Insurance status was found to have a significant impact on PD, suggesting that expanding coverage and integrating mental health services into standard healthcare policies could reduce the burden of psychological distress.
The results also indicate that while PD did not change significantly from 2007 to 2009, this does not imply that the recession had no effect. The economic downturn began in mid-2007 and lasted until mid-2009, meaning that the available survey data might not have fully captured its impact. A significant increase in PD between 2009 and 2012 suggests that the long-term effects of the recession contributed to worsening mental health outcomes over time.
Additionally, this study introduces a novel methodology for linking cross-sectional datasets to approximate a longitudinal framework. This approach provides a new avenue for future research that may have been previously constrained by the lack of true longitudinal data. By enabling the examination of mental health trends over time, this methodology could support further studies aimed at understanding how economic and social factors shape psychological distress and related health outcomes.