
Abstract
The minimum zone fitting and error evaluation for the arc-modified convex contour of a bearing roller have important applications for consistency detection and quantificational research of the elastohydrodynamic lubrication of a bearing roller. Based on the definition of the shape error and the geometric characteristics of the arc corrected roller convexity line of the bearing, a new fitting and error evaluation method for the total convexity contour of a bearing roller is presented. First, the reference cutoff points of the arc segment and straight line are determined based on the curvature difference of each measurement point. Then, the measuring points on both sides of the two reference cutoff points are selected as auxiliary cutoff points for arc fitting. The fitting error is obtained based on the minimum area method. Finally, a series of tangent equations are obtained based on the tangent principle between a line and two arcs, and the straightness error is determined by calculating the distances between the measuring points and the tangents. The example results show that an arc-modified convex contour can be fitted, and its global error can be evaluated effectively and precisely using the presented method. This study also provides a new idea for the minimum zone fitting of multi-segment curves along a plane.
Keywords
Introduction
A rolling bearing is a basic part used in the mechanical industry, which is widely applied in all types of mechanical equipment. 1 A cylindrical (tapered) roller is an important part of a rolling bearing. 2 To ensure a good performance of the bearing in engineering projects, the generatrix of the bearing roller is usually designed into a convex shape. 3 The usual modified generatrix of a bearing roller includes a full arc type, arc correction type and logarithmic curve type. Among these, an arc modified convex roller can make contact along the entire roller length without an edge effect.4,5 Thus, when the stability of bearing operation is taken as the design criterion, the arc-modified convex structure is widely used in roller crown designs. 6
The current superfinishing process can achieve a highly efficient and precise modification for the roller crown, and although many enterprises can produce better convex curved rollers, the consistency of the crown is not very high. 7 The results indicate that a significantly different contact stress and elastohydrodynamic lubrication film can be produced owing to a minor profile error of the convexity line of a modified roller (convexity size error, convexity centre offset error and convexity shape error),8,9 which affects the performance of the bearing.10,11
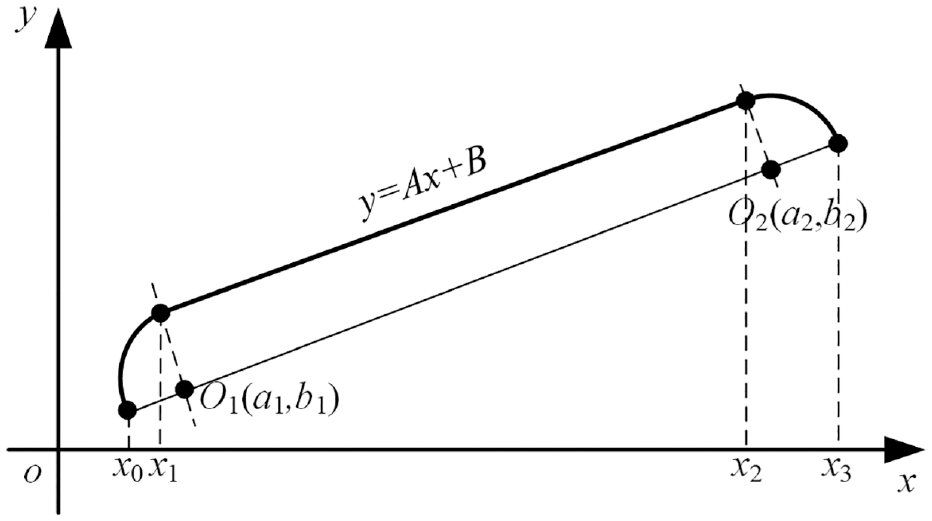
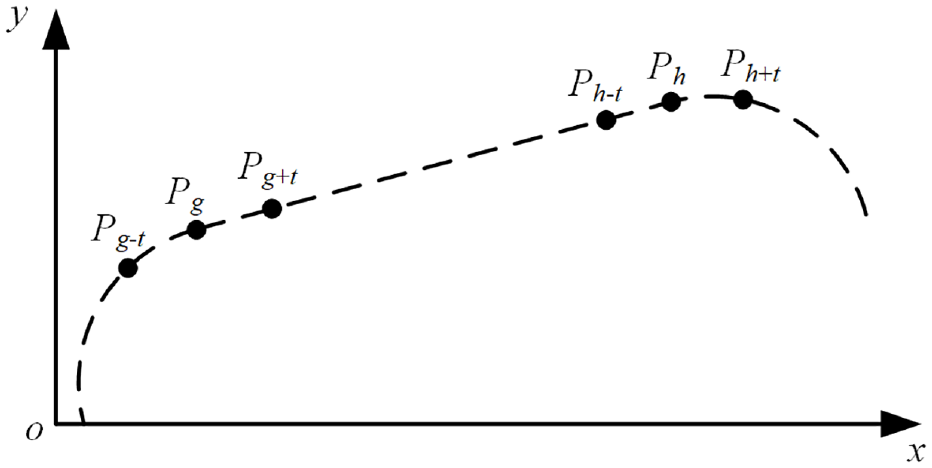
The convexity curve is composed of a middle straight line and two arcs (Figure 1). The fitting method and error evaluation method for an arc and straight line can be found in various studies,12,13 and many successful fitting methods have been developed.14–16 However, there have only been a few reports on the overall minimum zone fitting method of multi-segment curves in a plane. Benko 17 and Karniel 18 studied the constraints of various curves and surfaces used in reverse engineering projects, and provided a two-dimensional curve characteristic expression and a curve constraint expression; however, the global constraint fitting problem of a two-dimensional curve has not been solved.19,20 Therefore, a study on the algorithm of the overall minimum region fitting and an error evaluation for the crown curve of an arc-modified bearing roller is of significant value for a quantitative study of the convexity profile, the formation mechanism of roller crown superfinishing, and the effective fitting of the plane cross-section data applied in reverse engineering projects.
Arc-modified type convex curve.
The convexity curve of an arc-modified bearing roller is composed of a middle straight line and two arcs, and has obvious geometric characteristics. If a single quadratic function is used to fit a convex curve, it becomes difficult to obtain a precise fitting and good overall effect. To overcome this problem, in this study, a method for piecewise fitting and multi-value optimisation is adopted to realise the curing fitting for the crown curve of a bearing roller. The proposed method overcomes the limitations of existing methods that can only fit a single class of curves, providing a new method to fit a multi-segment curve on a plane. In addition, the proposed method introduces the minimum zone method into the fitting and error evaluation of the multi-segment curve, ensuring that the obtained reference curve better reflects the curve represented by the measurement points and providing more accurate guidance for the correction of the roller machining process.
Overview and scope
Convexity curve equation of arc-modified roller
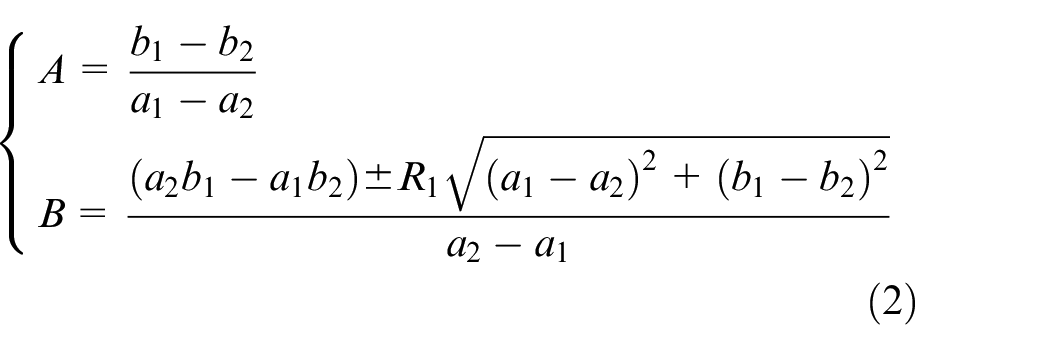
As shown in Figure 1, the curve of an arc-modified roller refers to a case in which a straight generatrix of the bearing roller is modified into a convex curve, the middle of which is an approximately straight line, and the two ends are indented toward the entity contraction with a variable curvature. For an ideal curve type, the middle straight line is tangential to the two curves at either end. Without a loss of generality, the modified generatrix of a cylindrical (conical) roller can be described through equation (1) (note that in a design,
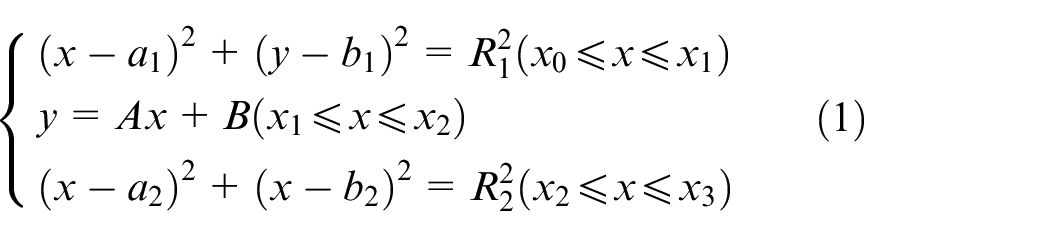
where
Definition and assumption of profile error of arc-modified roller
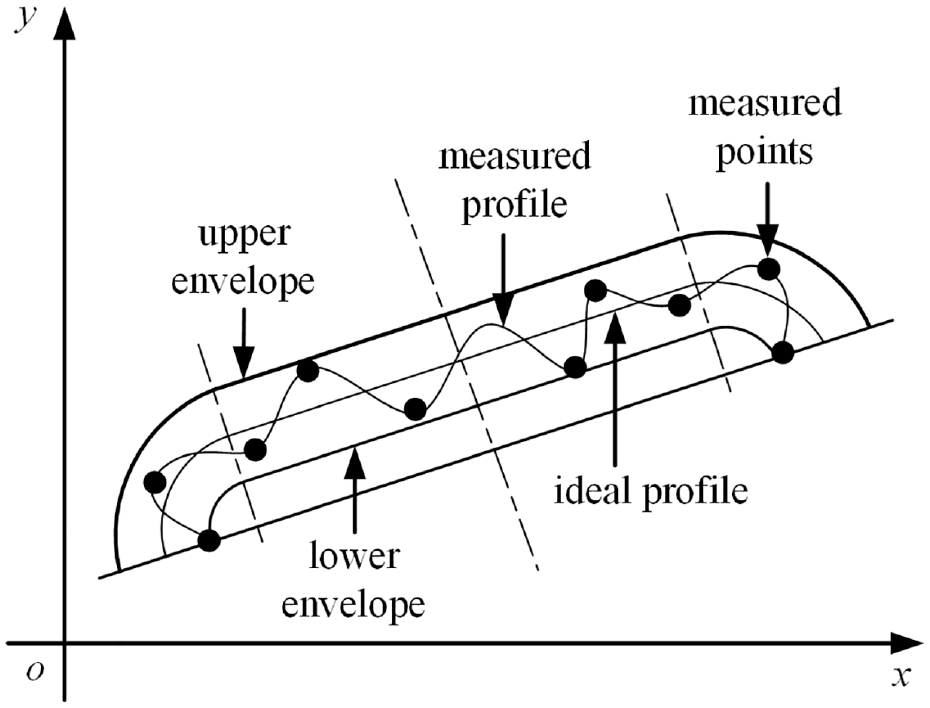
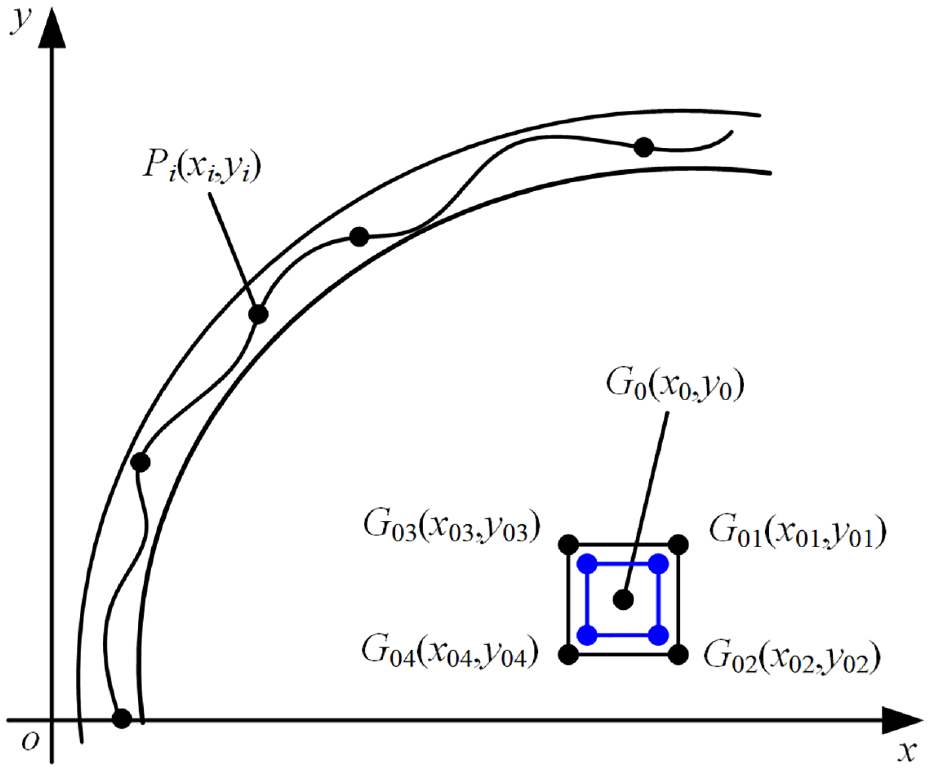
As shown in Figure 2, a series of measured points are distributed on both sides of the ideal profile. According to the definitions of profile error in ISO, the profile error of the arc-modified roller can be defined as the area between two envelope lines that can contain the actual measured profile. In this study, in order to facilitate the rapid and accurate evaluation of the profile error of the arc-modified roller, first, it is assumed that the number of measurement points is limited but sufficient to describe the profile of the arc-modified roller. Second, it is assumed that the measurement points and reliable. In other words, all measurement points are obtained through error separation techniques (the error separation techniques are not the focus of this study), and there is no random error. Therefore, these measurement points can be used to describe the reality of a roller profile.
Profile error of arc-modified roller.
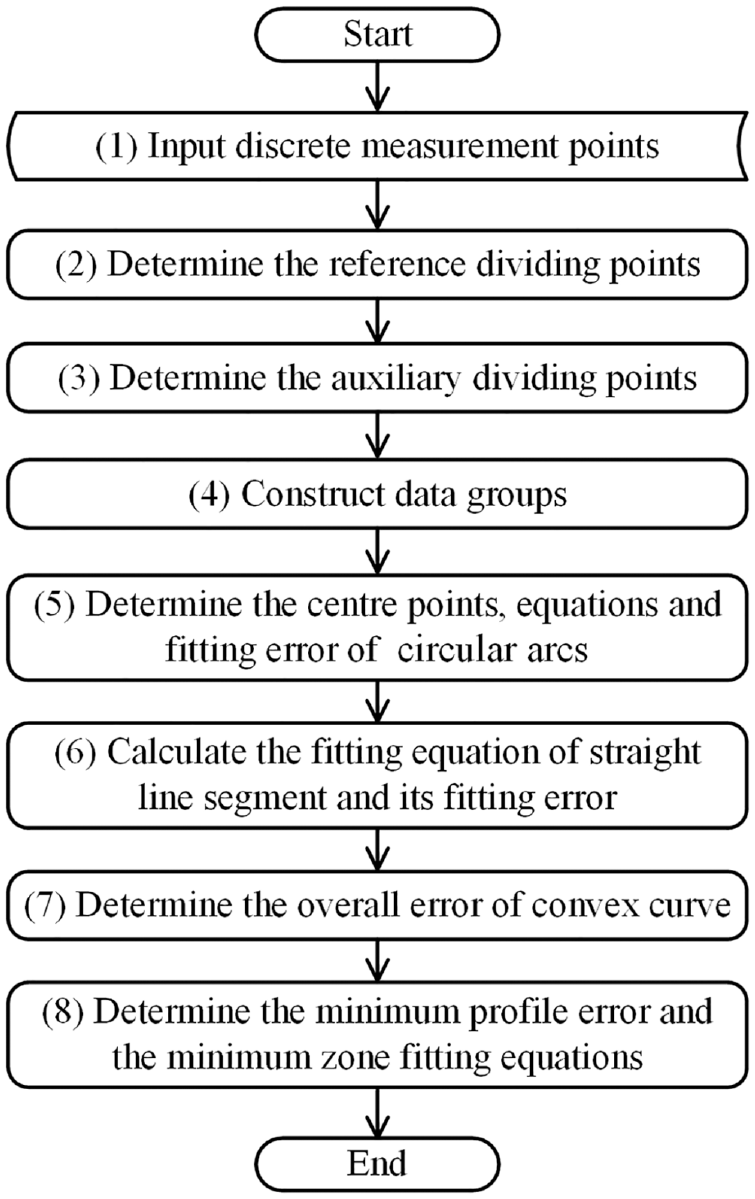
The flow of the proposed profile error evaluation method
Figure 3 shows the overview of the proposed method in this study. First, input the measuring points (Step (1)) and according to these points determine the reference dividing points (two points) between the arcs and the straight line (Step (2)). Next, select a certain number of measuring points on both sides of each reference dividing point to form the corresponding auxiliary dividing point group (Step (3)). The actual dividing points of arcs and straight line are included in the range of the point groups. Then, for each arc segment, gradually combine other measuring points of the arc with the corresponding auxiliary dividing points to form a series of data groups (Step (4)). For each data group, the arc centre and equation that realise the arc have the minimum profile error can be calculated by the proposed minimum zone fitting algorithm in this study (Step (5)). And based on the obtained arcs, the fitting equation and fitting error of straight line segment are calculated (Step (6)). By comparing the fitting errors between the arcs and straight line, the overall error of convex curve is determined (Step (7)). Finally, compared with all the overall errors, the minimum value is the minimum profile error of the convex curve, and the corresponding arc and line equations are the minimum zone fitting equations of the convex curve (Step (8)).
Overall of the profile error evaluation method.
Minimum zone fitting and error evaluation for arc-modified roller
Determine the reference dividing points
Assume that the measured points are expressed by
A convexity curve is composed of a middle straight line and two arcs. When measuring a crown curve, only a series of measuring point coordinates can be obtained; however, the position of the dividing point between the straight line and the arcs at both ends cannot be obtained. It can be determined from geometric knowledge that although the measuring points are not on the ideal crown curve, the curvature of the measuring points on the straight-line segment, and the curvature of the measuring points on the circular segment, are still significantly different. Therefore, the curvature difference of each measuring point can be used to determine the reference cutoff point between the straight-line segment and the circular segment.
The curvature
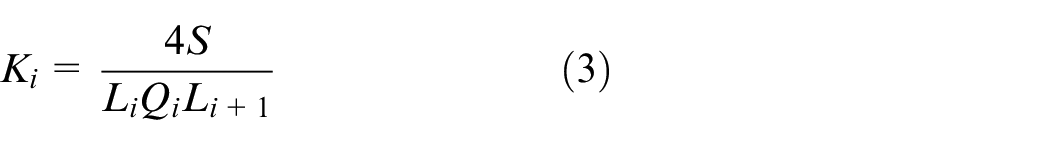
where
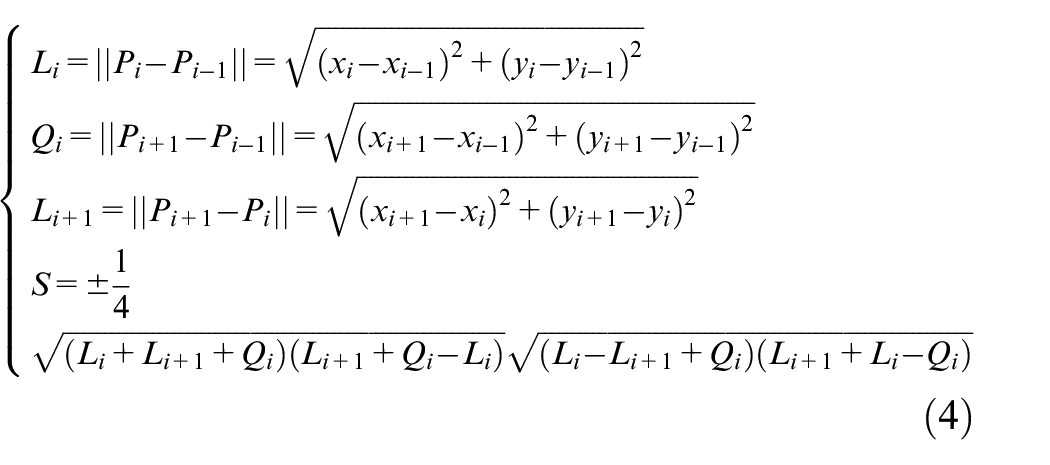
where
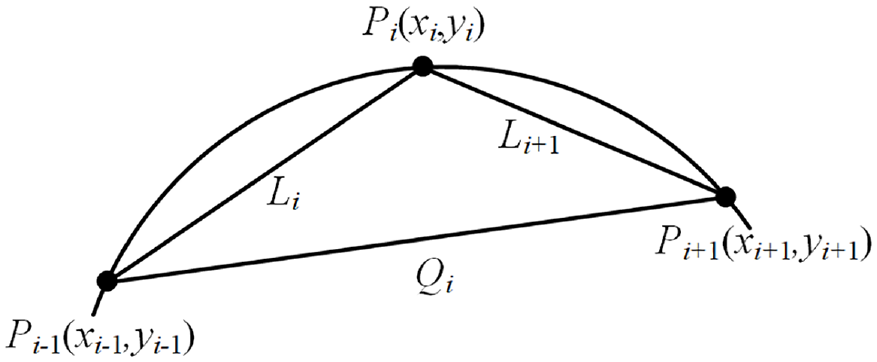
Calculation of the curvature of the measured points.
The curvature difference

Because the dividing point between a straight-line segment and arc segment is the point where the curvature is discontinuous, we can take the measuring point corresponding to the maximum curvature difference
Dividing point and auxiliary dividing points.
Determine the auxiliary dividing points
As shown in Figure 5, taking
Minimum zone fitting for circular arcs
As shown in Figure 5, based on the established process of the auxiliary dividing points, it can be seen that the measuring points
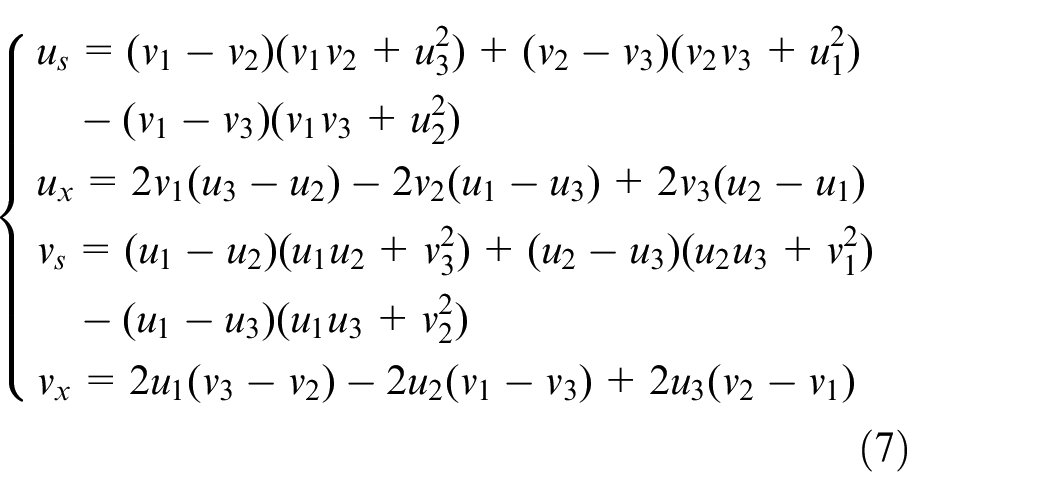
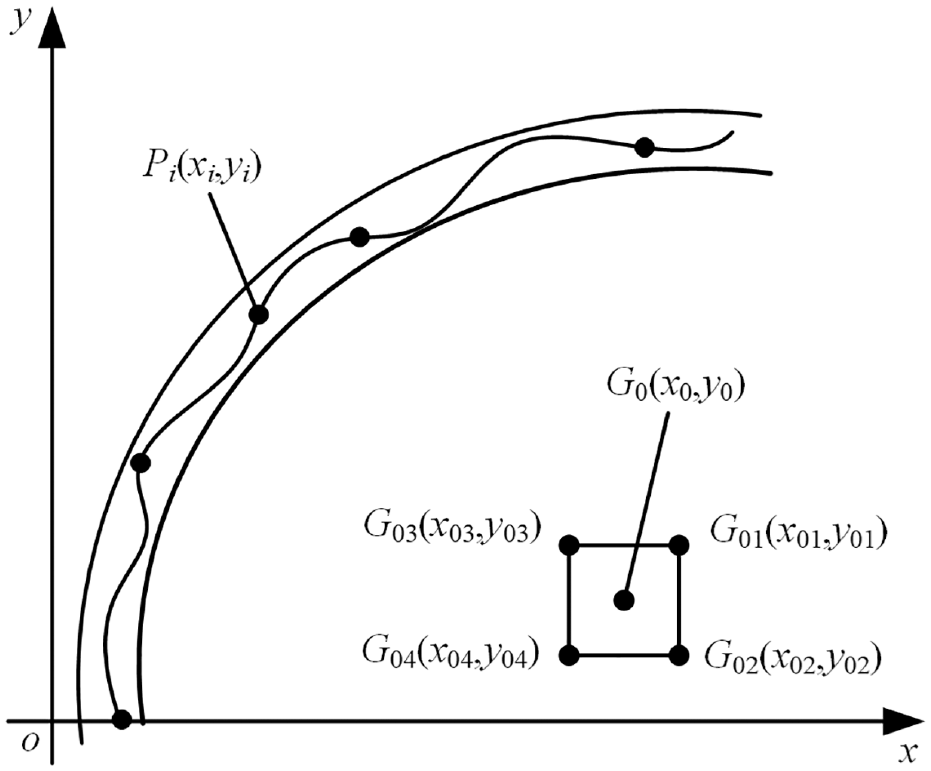
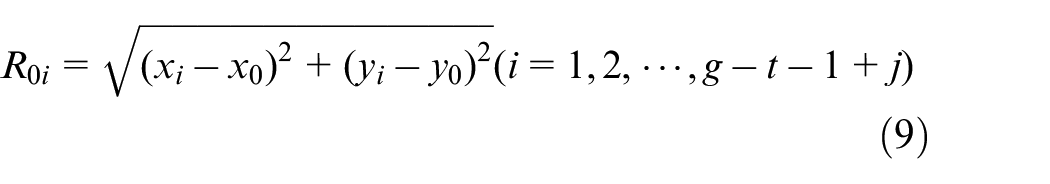
Determining the reference centre of the left circular arc
From the measured points
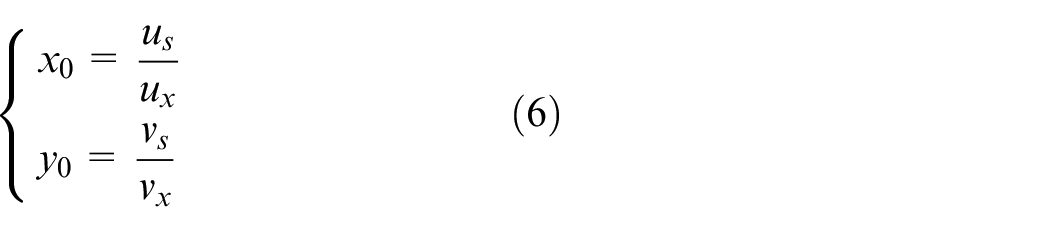
where
Construct auxiliary centres of the left circular arc
As shown in Figure 6, using the centre point
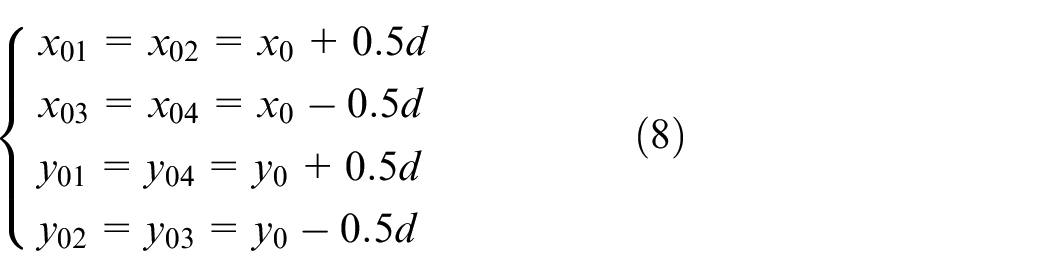
Establishment of auxiliary centres.
Minimum zone fitting of the left arc
Supposing the dividing points

As shown in Section ‘Construct auxiliary centres of the left circular arc’, four auxiliary centres
For the left circular arc, there are
Step 1: Calculate the extreme radial difference
When
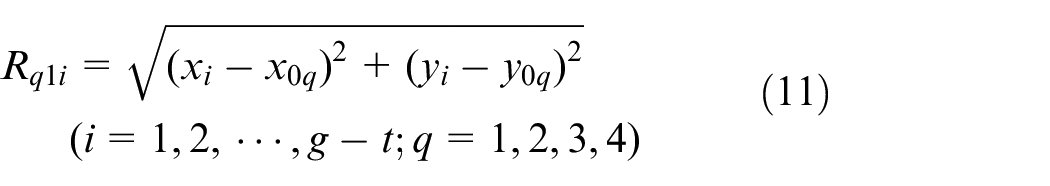
For each auxiliary centre and the measured points


Step 2: Optimisation fitting
Comparing

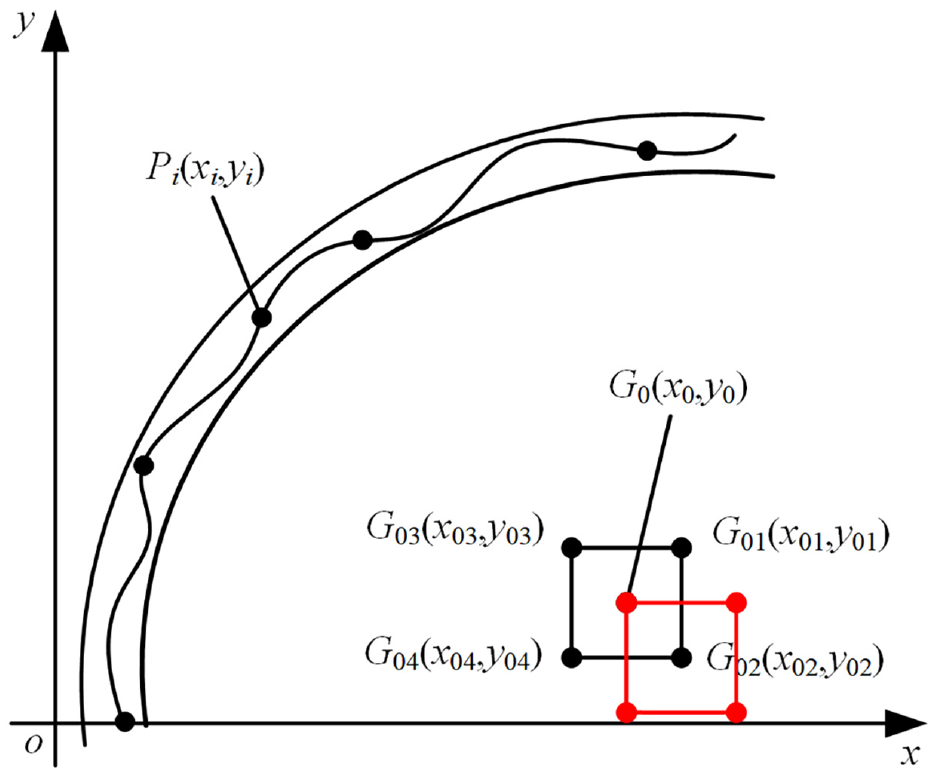
Reference centre change.
Auxiliary point reconstruction.
Step 3: Fitting equation of left circular arc and its fitting error
According to steps 1 and 2, the minimum zone fitting errors
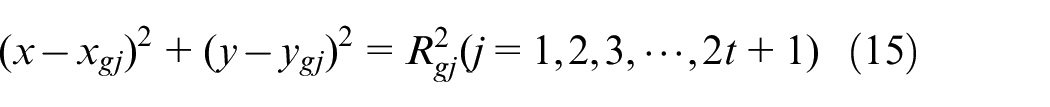
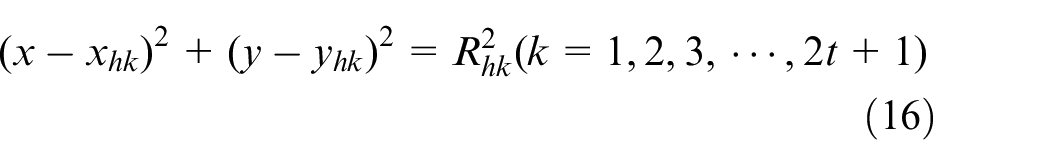
Fitting equation of right circular arc and its fitting error
From the measured points
Fitting of straight-line segment and its fitting error
Assuming that the general equation of a straight-line segment of the crown curve is expressed as
Each of the fitted left circular arcs and each of the fitted right circular arcs are combined sequentially, and the
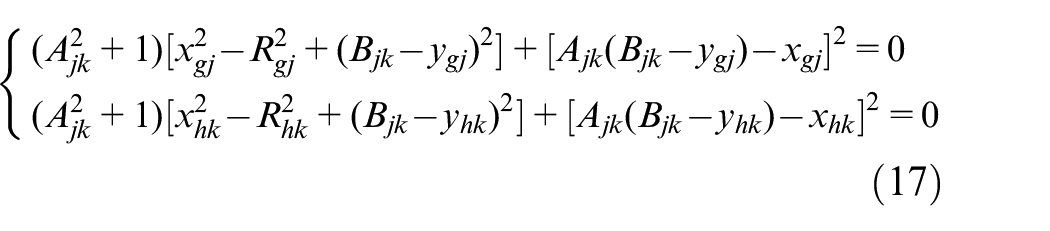
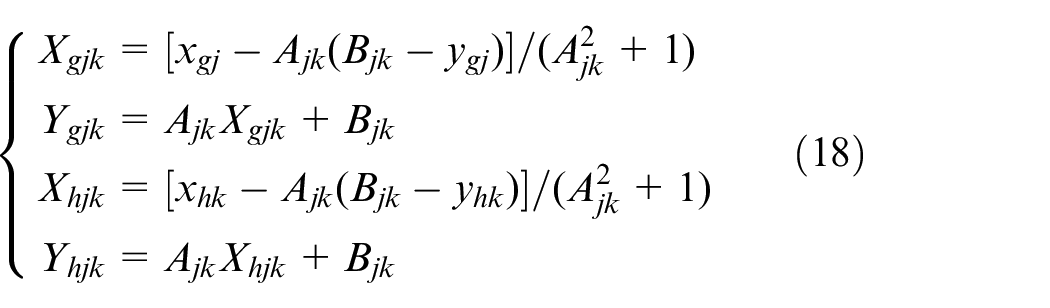
For the type of combination between one of the left circular arcs and one of the right circular arcs, there are four common tangents and four pairs of tangent points. According to the actual known curve, the y-coordinate of the tangent point is greater than the y-coordinate of the centre of the circular arcs, that is, the tangent points corresponding to
The straightness error of the common tangent line can be calculated by equation (19).
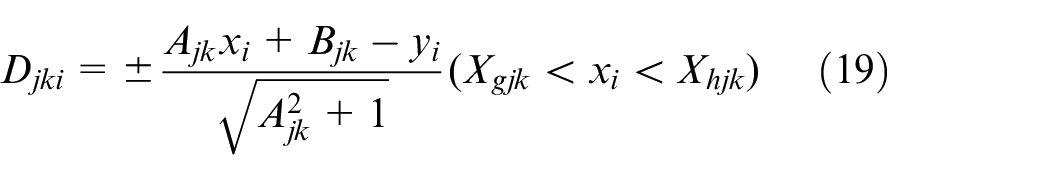
where
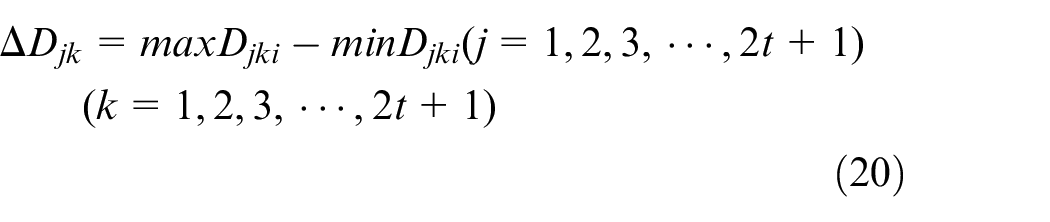
According to the definition of a straightness error, the straightness error of the common tangent is shown by equation (20).
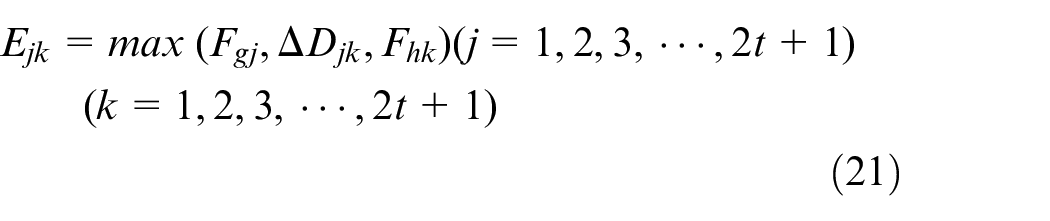
Overall error of the convex curve
It can be seen from the above fitting process of the left and right arcs and the common tangent that, for the measured data of the convexity profile, the
According to the definition of a curve contour error, it can be determined that this maximum fitting error is the contour error of the entire convexity curve. Because the
Among the

Recording the values of
Example certification
Data construction
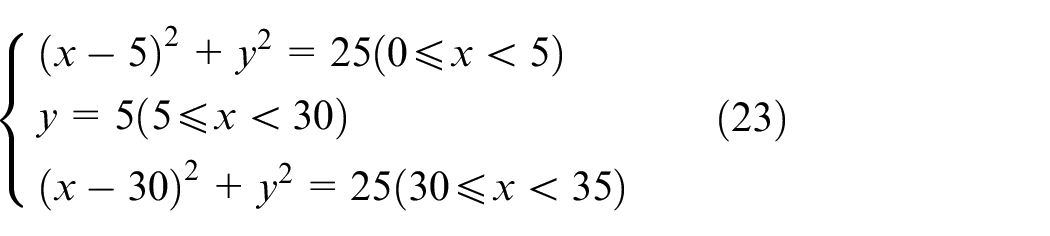
It is assumed that the standard equation of the convexity curve is equation (23). Taking 44 points on the curve and recording the points as
Simulation data (mm).
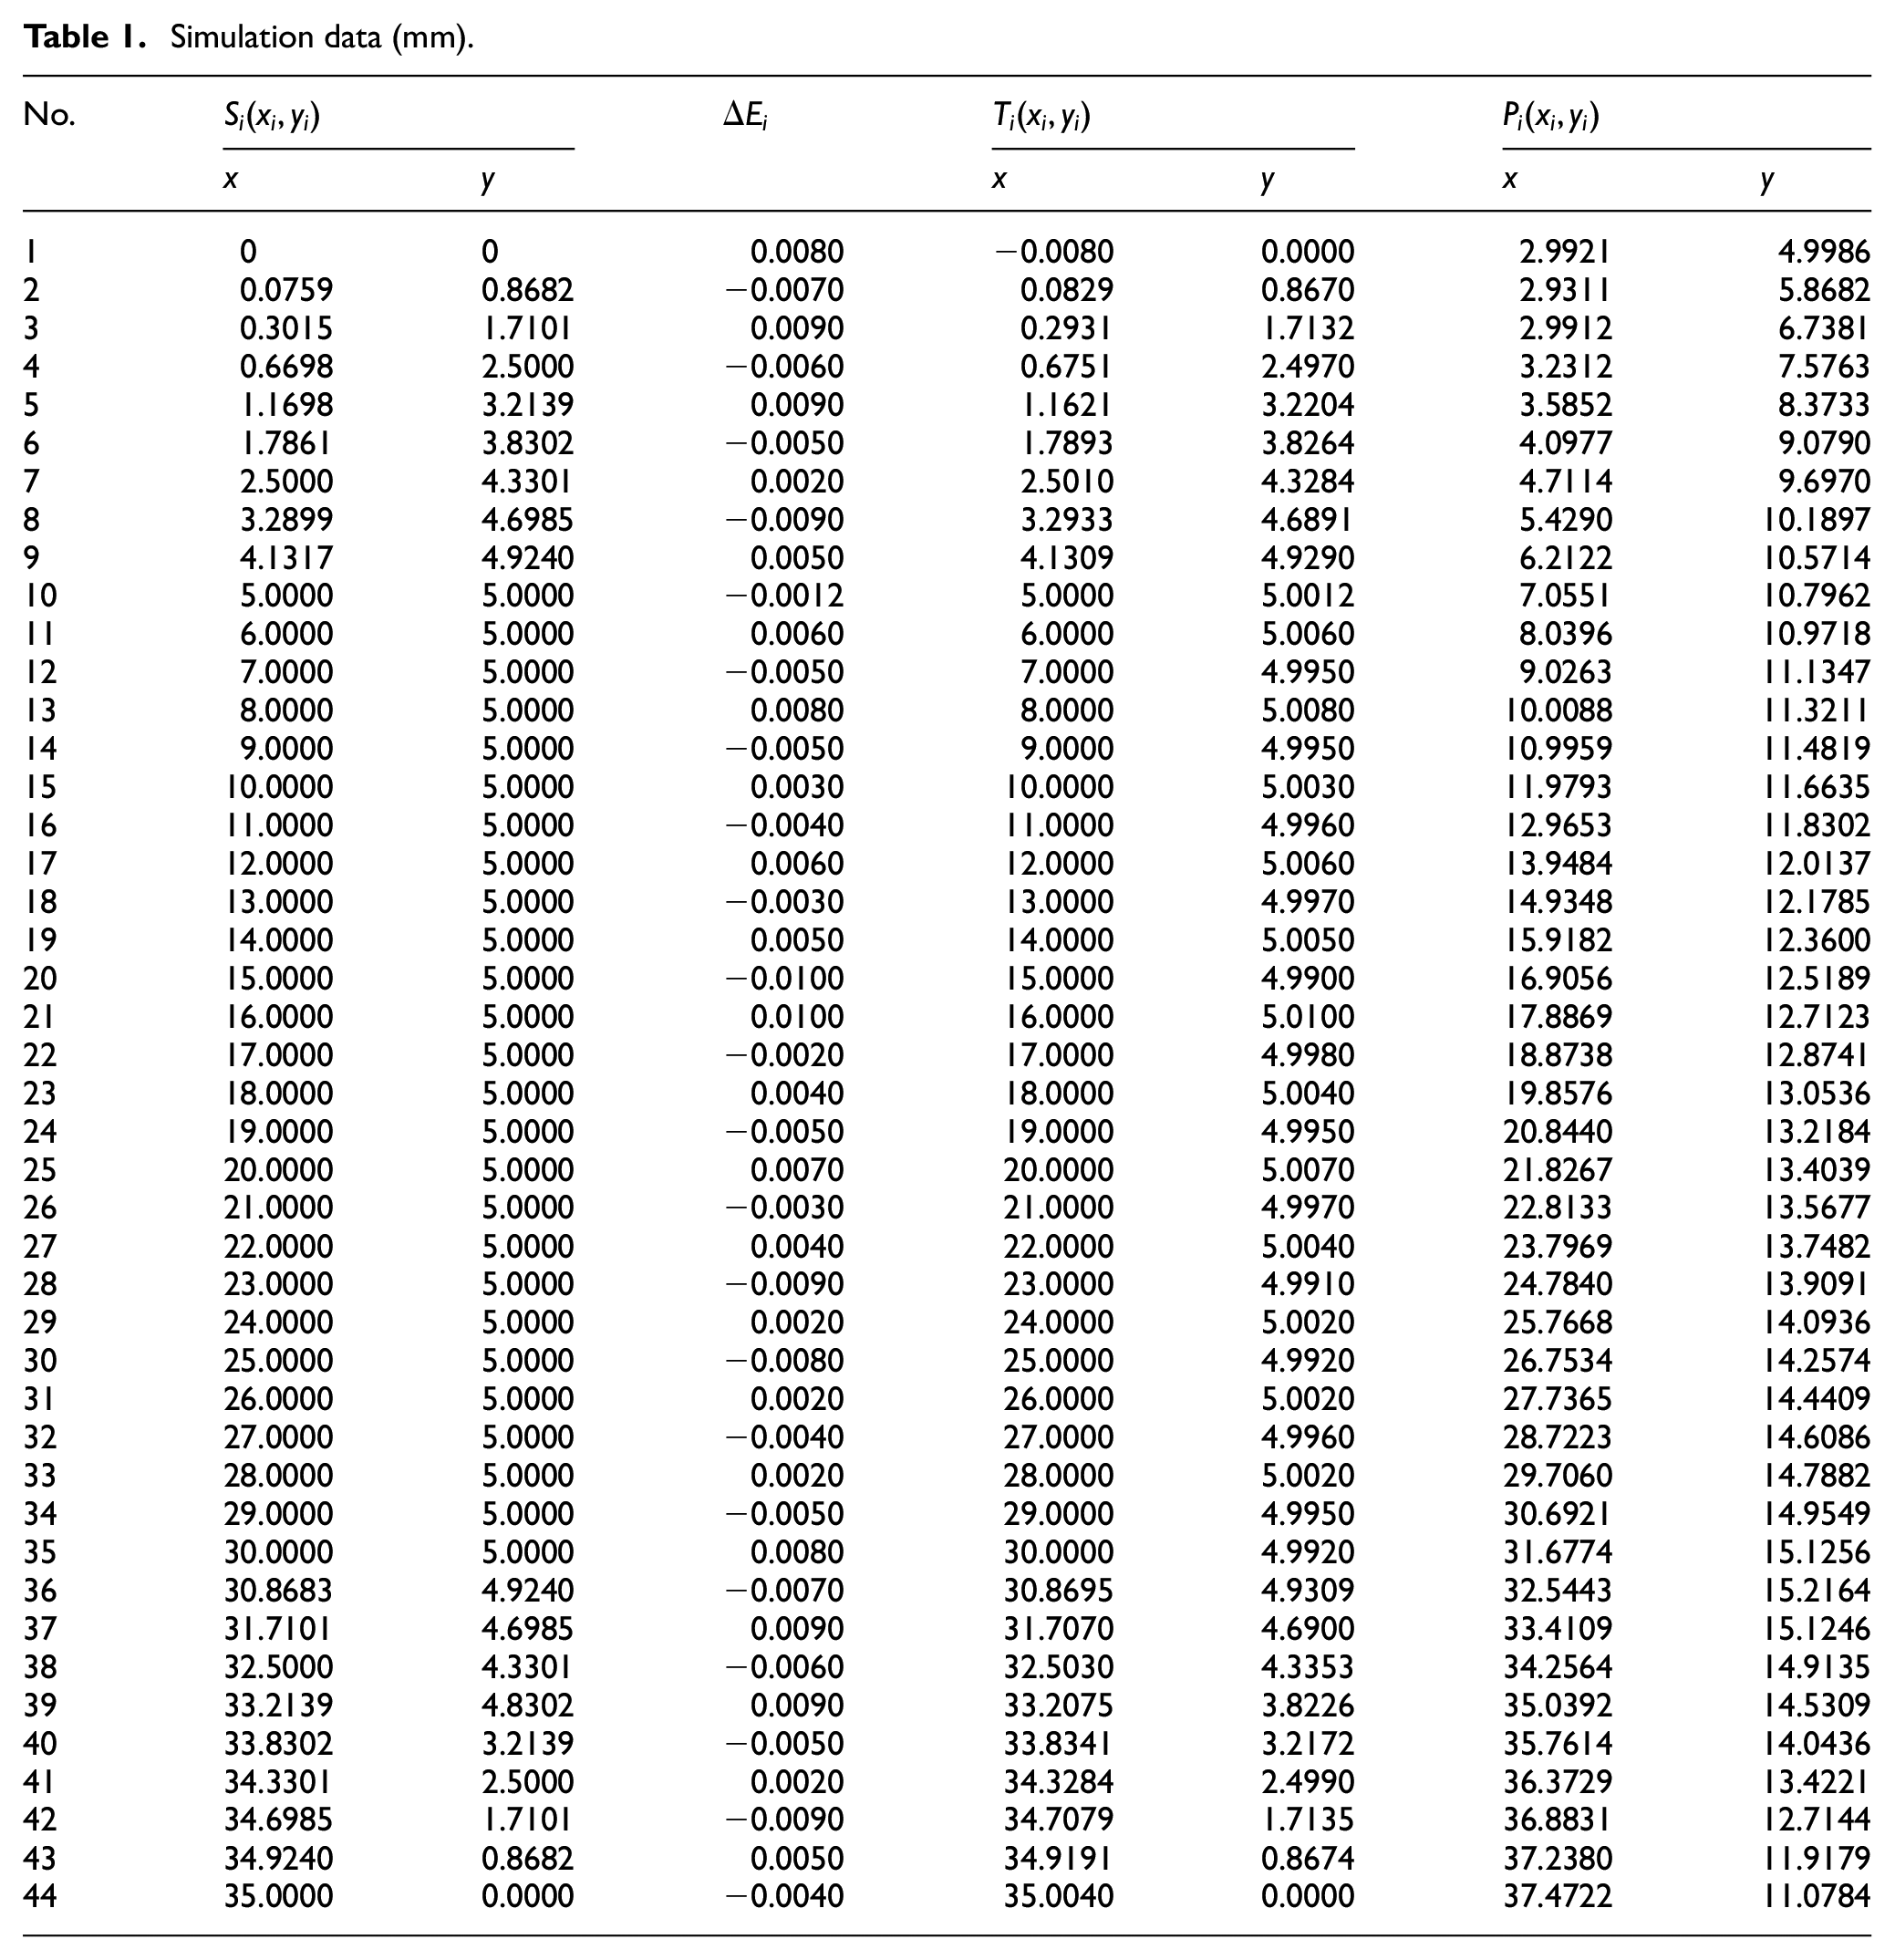
From the established process of the simulation data, it can be seen that the simulated measured data represent the transformed convexity curve. Here, the radius of the circular arc at both ends is 5 mm, and the centre of the circular arc at both ends is
Determine the dividing points
The curvature and curvature difference of the simulated data points can be obtained using equations (3) and (5). As shown in Figure 9, the minimum and maximum values of the curvature difference are
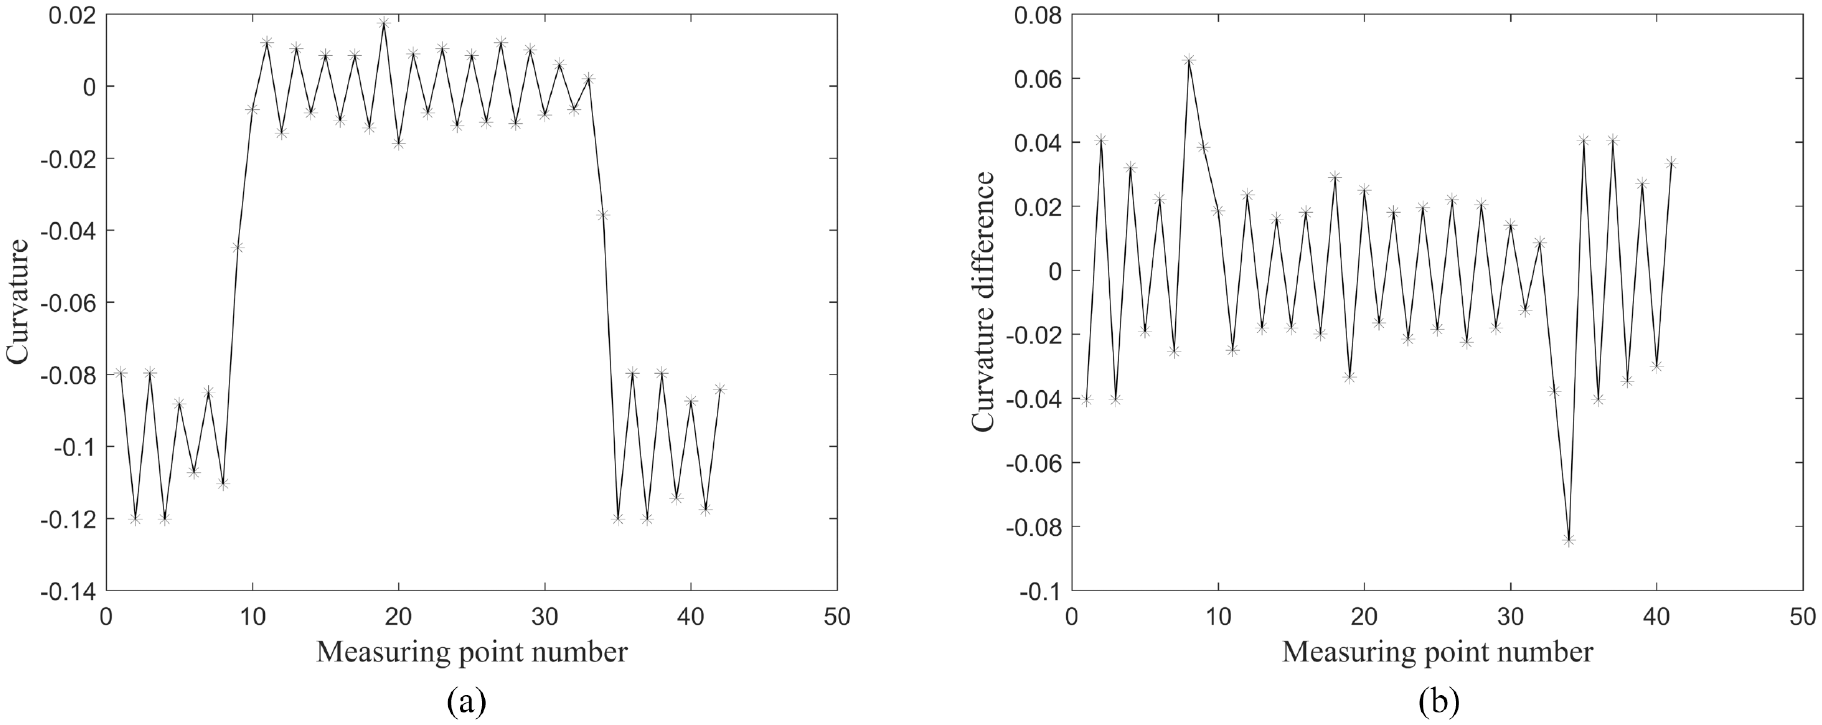
Curvature and curvature difference of data points.
Fitting the circular arcs
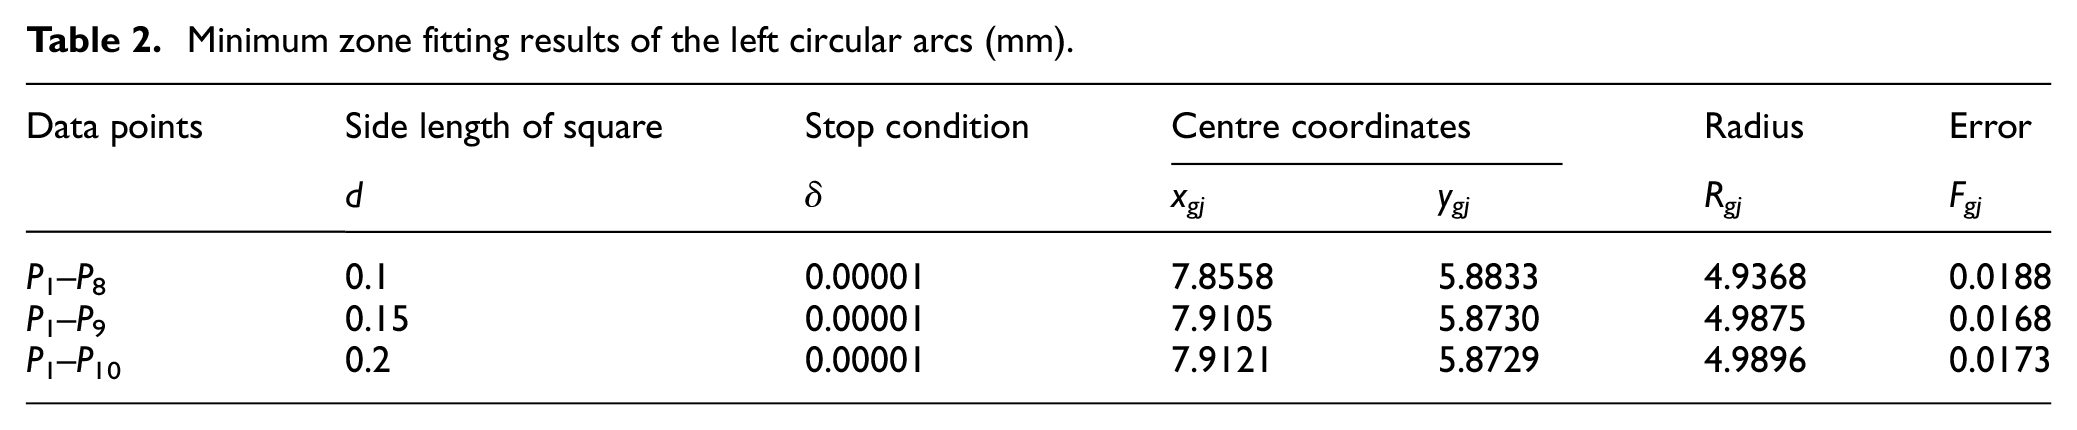
Selecting the measured points
To prove the universality of the value of side length
Minimum zone fitting results of the left circular arcs (mm).
Minimum zone fitting results of right circular arcs (mm).
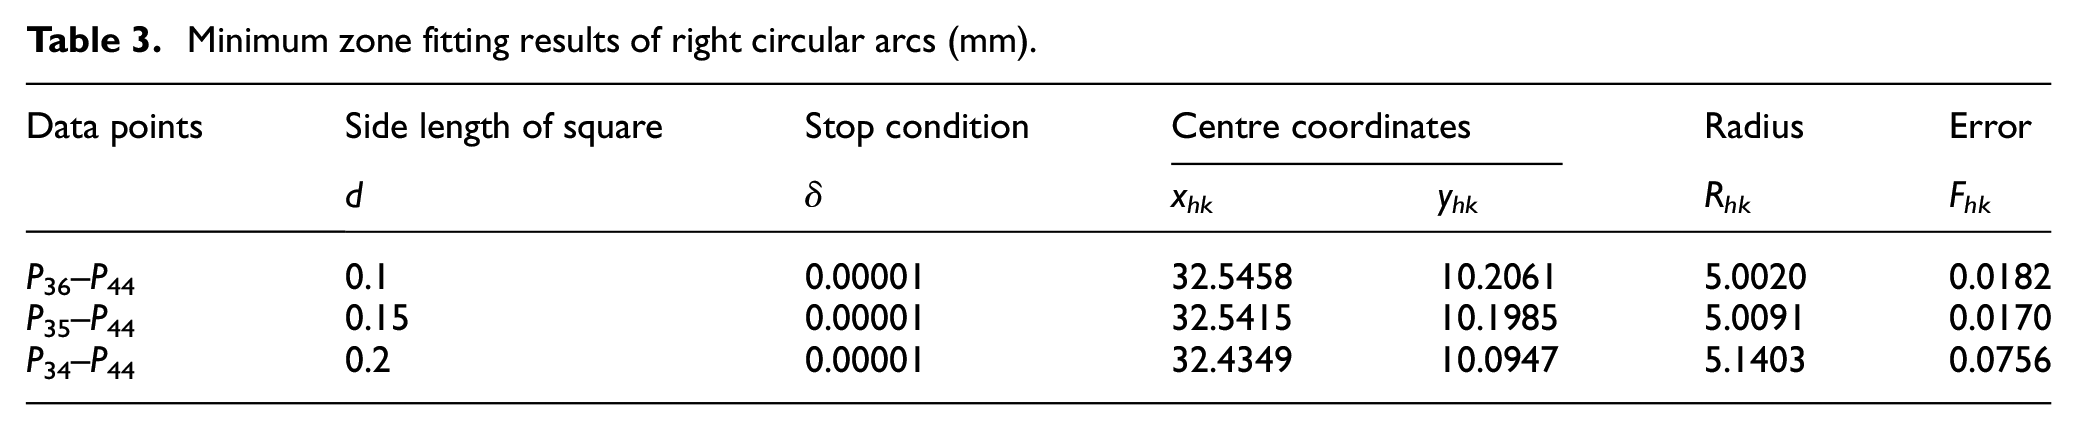
As shown in Tables 2 and 3, although the search area has different side lengths, but is under the same search termination conditions, the fitted results are basically consistent with the set of circular arc parameters, which shows that the proposed method for arc fitting is correct and effective. In the third row of Table 3, the fitting error is far greater than the set value, indicating that point
Common tangent parameters and errors
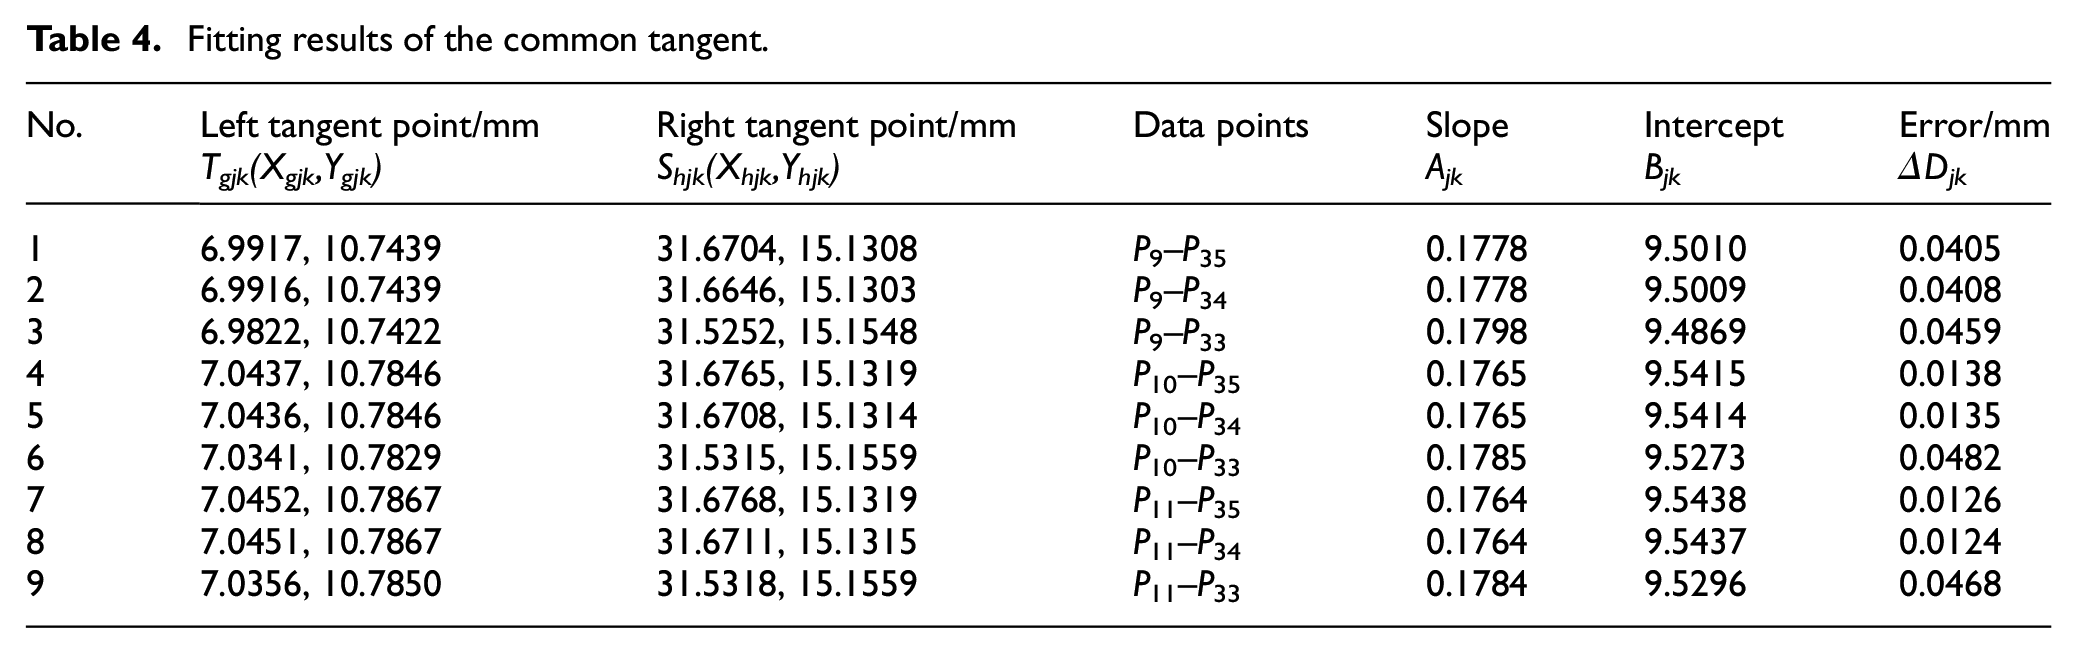
Using the parameter of the circular arcs in Tables 2 and 3 as well as the method described in Section ‘Fitting of straight-line segment and its fitting error’, the nine common tangent lines and their errors can be obtained, the results of which are listed in Table 4.
Fitting results of the common tangent.
Overall results of convex curve
For the convenience of analysis and comparison, all fitting results are listed in Table 5.
Fitting results of convex curve (mm).
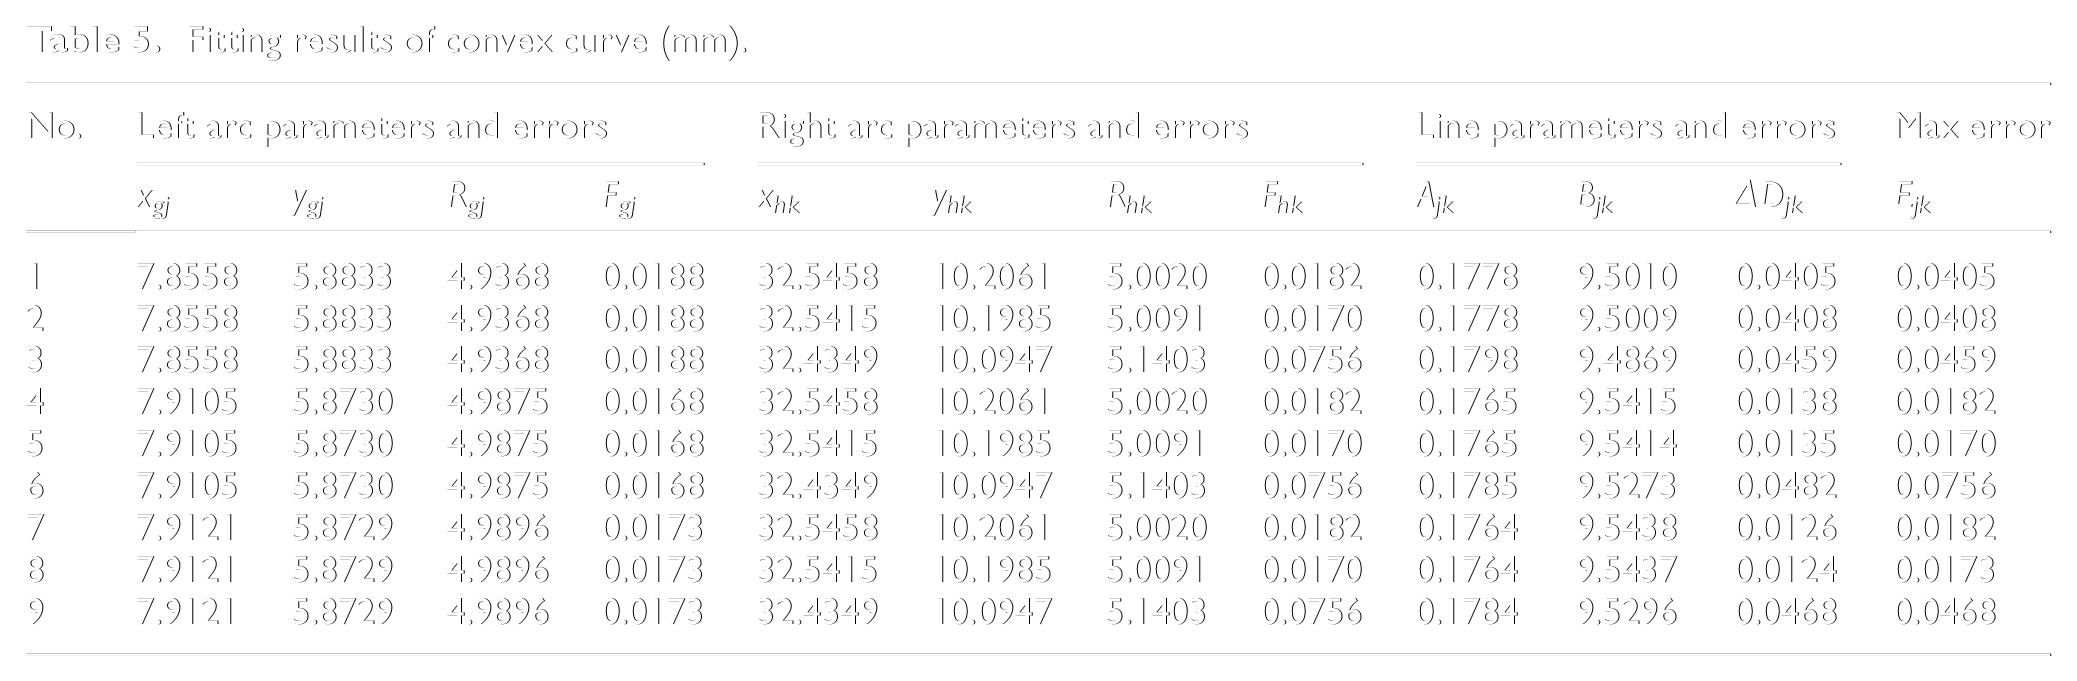
As can be seen from Table 5, the overall error of the fifth convexity curve is the smallest. At the same time, the corresponding minimum zone curve equation can be obtained. To demonstrate the accuracy and effectiveness of the proposed method, the data processing results obtained based on the proposed method are compared with the preset used in this study and the results obtained using the traditional least square method, 22 as shown in Table 6.
Comparison of data processing results.
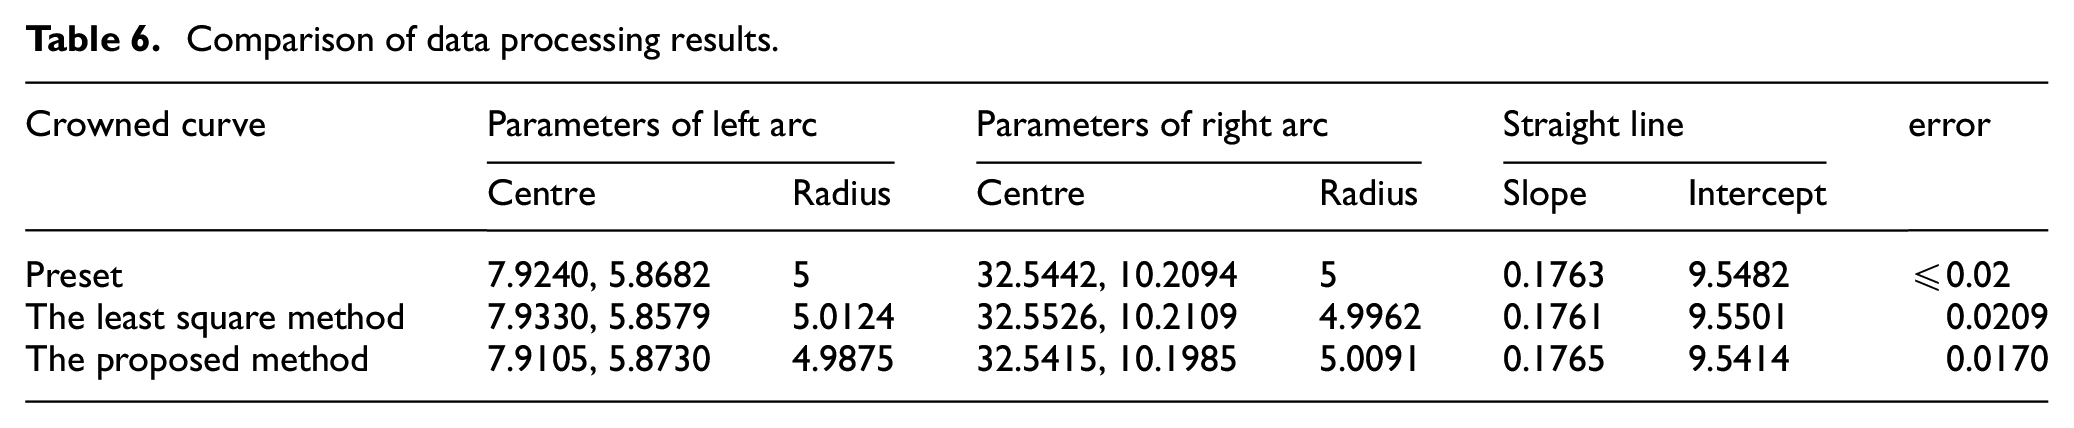
It can be seen from Table 6 that the parameters and errors of the convexity curve obtained through the proposed method are consistent with the parameters and errors of the predetermined convexity curve, which verifies the effectiveness of the method proposed herein. Moreover, compared with the convexity curve obtained by the least square method (with a contour error of 0.0209), the convexity curve obtained by the proposed method (with a contour error of 0.0170) has a smaller contour error, proving that the convexity curve obtained by the proposed method better reflects the curve represented by the measurement points.
Conclusion
In this paper, a method for the overall minimum zone fitting and error evaluation of the convex contour of an arc-corrected bearing roller was presented. The proposed method has the following advantages. First, the proposed method overcomes the limitations of existing methods that can only fit a single class of curves, providing a new method to fit a multi-segment curve on a plane. It uses data segmentation and the curvature analysis of the discrete points to obtain the demarcation points between the straight lines and circular arcs. And on this basis, the multi-segment curve fitting on the plane is realised by piecewise curve fitting and global optimisation technique based on the tangent constraints. Second, the minimum zone fitting method is introduced into the curve fitting and error evaluation of the multi-segment curve. Compared with the traditional least squares method, when all measurement points are reliable, the proposed method can fit the contour curve of measuring points with less error and higher accuracy. However, in practice, there may be random errors in the measurement points, which can have an impact on profile fitting and error evaluation. We hope to conduct research in this area in the future.
Footnotes
Declaration of conflicting interests
The author(s) declared no potential conflicts of interest with respect to the research, authorship, and/or publication of this article.
Funding
The author(s) disclosed receipt of the following financial support for the research, authorship, and/or publication of this article: This work was supported by National Natural Science Foundation of China (No. 5222780130), Key Scientific Research Project of Colleges and Universities in Henan Province (No. 23A580002), Henan Postdoctoral Science Foundation (HN2022167) and Open Foud of State Key Laboratory of Tribology in Advanced Equipment (No. SKLTKF20A03).
Data availability statement
Data sharing not applicable to this article as no datasets were generated or analyzed during the current study.