
Abstract
Electromyography (EMG) signal classification is vital to diagnose musculoskeletal abnormalities and control devices by motion intention detection. Machine learning assists both areas by classifying conditions or motion intentions. This paper proposes a novel window length insensitive EMG classification method utilizing the Entropy feature. The main goal of this study is to show that entropy can be used as the only feature for fast real-time classification of EMG signals of hand gestures. The main goal of this study is to show that entropy can be used as the only feature for fast real-time classification of EMG signals of hand gestures. Additionally, the entropy feature can classify feature vectors of different sliding window lengths without including them in the training data. Many kinds of entropy feature succeeded in electroencephalography (EEG) and electrocardiography (ECG) classification research. However, to the best of our knowledge, the Entropy Feature proposed by Shannon stays untested for EMG classification to this day. All the machine learning models are tested on datasets NinaPro DB5 and the newly collected SingleMyo. As an initial analysis to test the entropy feature, classic Machine Learning (ML) models are trained on the NinaPro DB5 dataset. This stage showed that except for the K Nearest Neighbor (kNN) with high inference time, Support Vector Machines (SVM) gave the best validation accuracy. Later, SVM models trained with feature vectors created by 1 s (200 samples) sliding windows are tested on feature vectors created by 250 ms (50 samples) to 1500 ms (300 samples) sliding windows. This experiment resulted in slight accuracy differences through changing window length, indicating that the Entropy feature is insensitive to this parameter. Lastly, Locally Parsed Histogram (LPH), typical in standard entropy functions, makes learning hard for ML methods. Globally Parsed Histogram (GPH) was proposed, and classification accuracy increased from 60.35% to 89.06% while window length insensitivity is preserved. This study shows that Shannon’s entropy is a compelling feature with low window length sensitivity for EMG hand gesture classification. The effect of the GPH approach against an easy-to-make mistake LPH is shown. A real-time classification algorithm for the entropy features is tested on the newly created SingleMyo dataset.
Introduction
EMG is a measurement of electric potentials on muscles created by activation signals. The brain generates these activation signals when there is an intention of muscle contraction. 1 It is primarily a method of medicine where a specialist observes EMG signals after giving an electric stimulation to the patient’s muscle and tries to diagnose neuromuscular disorders. 2 On the other hand, naturally occurring EMG (without stimulating the muscles) contains the intention of contraction for that muscle. 3 This information is crucial for applications such as exoskeletons, rehabilitation robots, prosthetics, orthotics, and any other Human Machine Interface (HMI) that can be operated by moving. 4 However, EMG has a very low voltage and low signal-to-noise ratio (0–10 mV). 5 Many things, from equipment to the user’s body and other factors like friction, are sources of high noise for EMG. Moreover, EMG changes from person to person and sometimes for the same person. Lobov et al. 6 said body fat ratio and experience with muscle-related activities are the major sources of difference. EMG signals show high spatiotemporal variability within the same class. 7 Fatigue and conditions like heart stroke have significant effects on EMG signals. Because of these reasons, ML algorithms have been tried on EMG signals to interpret the meaning of any given record. Another alternative method is to design controllers.8,9 However for both condition diagnosis10,11 and motion intention detection12–16 it is shown that ML methods result in effective models that overcome the difficulties of EMG.
In the most general term, ML is a complex mapping of any given input to any desired output, while iterative methods optimize the mapping parameters. In its base, the difference between ML algorithms is mappings and optimization methods. These methods optimize their mapping parameters around patterns of a given dataset to output correct values when an input is received. In EMG training, ML models on recorded data anomalies and motion intentions can be separated from healthy or non-active signals. This way, patterns a human eye cannot find are found and used for classification or regression. To the best of our knowledge, Bekey et al. 1 is the oldest source trying to separate EMG signals with pattern recognition methods indicating that it has more than 40 years of history. This area of research continues, and today, many researchers continuously improve EMG ML applications by approaching different problems and methods. Some of the publications that are the output of such efforts are given here. In Oskoei and Hu, 17 SVM performs exceptionally for classifying EMG upper limb motions compared with discriminant analysis and multilayer perceptron. McIntosh et al. 3 combined EMG and pressure data from the wrist for classifying the finger, wrist, and forearm movements covering 96% of the motion range. They showed that a smartwatch-like device could estimate these motions. Hu et al. 18 is proposed a hybrid Convolutional Neural Network (CNN) – Recurrent Neural Network (RNN) architecture resulting increase in classification accuracies of five benchmark datasets from 0.2% to 9.2%. In Simão et al., 19 Feed Forward Neural Network (FFNN), RNN, Long Short-Time Memory (LSTM), and Gated Recurrent Unit (GRU) are compared for the online classification of hand gestures. Prediction speeds given in windows per second were 90.82% 82k, 91.59% 62k, 90.82% 244k, and 92.07% 265k, respectively. Too et al. 20 developed a feature selection optimization algorithm that made a 90% reduction and achieved high classification accuracies. Olsson et al. 21 classified a high number of movements by defining them as combinations of fundamental ones, each recognized by a binary CNN in a multi-label classification. Zhang et al. 22 tested Particle Swarm Optimization (PSO) and Sequential Forward Selection (SFS) methods for the feature selection on the EMG SVM classifier. According to Wang et al. 23 modeled EMG signal assuming additive noise, the Root Difference of Squares (RDS) represents EMG best and has a Gaussian Distribution. In Cai et al., 24 an SVM model drove a self-rehabilitation robot by applying mirror therapy by recognizing gestures of the healthy arm. Lobov et al. 6 investigated latent factors behind EMG’s variation from person to person. They found that body fat ratio and muscle coordination experience greatly affect the EMG application’s success. Samadani 7 investigated the performance of RNN, particularly LSTM and GRU methods, on EMG. This study shows that bidirectional LSTM layers with attention mechanism and the stepwise learning rate is the best among the tested combinations. Bu et al. 13 tested Time Delayed Feature (TDF) against Time-domain Features (TF) for continuous estimation of upper limb angles using the Random Forest (RF) algorithm. Tinoco et al. 16 controlled a simple remote device with a 52 km distance through the internet using EMG as a proof of concept of an Internet of Things (IoT) application. Also, this paper presents EMG as an HMI that anyone with minimal education can use. Farago et al. 10 applied SVM, RF, and Linear Discriminant Analysis (LDA) to distinguish patients with musculoskeletal injuries from healthy people. In the end, LDA with majority voting resulted in an 82.1% validation accuracy. General Regression Neural Networks (GRNN) 25 applied Principal Component Analysis (PCA) over four features and created models that can obtain a 95.1% recognition rate within an average of 0.19 s. Doheny et al. 14 compared wearable devices with laboratory equipment for fatigue state, 10% and 80% Maximum Voluntary Contraction (MVC). They found that spectral and nonlinear features may show the difference between different EMG recording devices. Fang et al. 4 investigated sensor fusion for EMG, kinetic and kinematic data sensors. They say combining EMG with these sensors increases recognition and results better. Rahman et al. 26 made 2 hours long EMG readings on their participants’ biceps brachii muscles to recognize fatigue in drivers. Barona-Lopez et al. 27 worked on a statistical indicator for optimized EMG feature set selection. In this context sum of RES (sum of separation and compactness index) and the sum of fuzzy entropies are investigated individually and together. MokhlesabadifarahaniVinit and Gunjan 28 developed fuzzy networks to classify EMG patterns to distinguish neuro-muscular and skeletomuscular disorders and injuries. Hajian et al. 12 tested CNN with feature level fusion on elbow force estimation with EMG signals and achieved a mean square error of 1.6±3.69% (mean ±SD). They say this method is better than classic ML models, CNN, with input level fusion in time and frequency domains. Wang et al. 15 used wavelet packet threshold denoising on EMG data from four muscles and LSTM networks to classify fatigue in lower limbs. They say that wavelet packet denoising works better on EMG than hard or soft threshold functions, and the resultant model can be used to monitor muscle fatigue. Torres-Castillo et al. 11 discriminated neuropathy and myopathy from healthy EMG data using Hilbert-Huang Transform to extract time-frequency features. Models with ensemble empirical mode decomposition and kNN method.
The previous study 29 found that different features are effective in different applications, and introducing new features to EMG ML literature can potentially increase success in any such application. Entropy has shown success in EEG and ECG classification.30–33 However, to our knowledge, entropy is a feature unused in EMG research. Here it is tested for the classification of EMG signals of hand gestures. Entropy is first proposed by Clausius 34 to describe heat transfer in thermodynamics. It has also been referred to as a measurement of uncertainty, unordered, and chaos. Later Shannon used entropy in information theory 35 as a direct indicator of the amount of information contained within a dataset. For EMG signals which are time series, entropy is again the amount of information within a given window. First, it is used for a set of classic ML methods, and kNN showed 100% validation accuracy despite having five-fold cross-validation indicating overfitting. Also, while kNN gives a highly accurate classification, it compares new feature vectors with all others. Except for small datasets, this behavior results in slow inference making it unsuitable for online classification. Thus, SVM, the second-highest validation accuracy method, is selected for the rest of the experiments.
SVM is a machine learning method that calculates a hyperplane dividing two classes from each other. In the process, the algorithm selects a certain number of feature vectors from both classes closest to the other. The hyperplane is calculated with an equal distance from these feature vectors called support vectors. 36 It is known to have high inference speed and is effective with smaller datasets. 24
The tests showed two aspects of entropy. At first, due to unbalanced entropy outputs, feature space became complex, and while some ML methods could use it, many failed. Later it is discovered that in the standard calculation of entropy, there is an easy mistake causing these results. LPH is the cause, a simple solution of GPH is proposed, and its effects are shown. Also, further analysis with SVM showed that entropy has an ability. The models trained with entropy features can classify feature vectors generated using window lengths different from those used for training. This ability means that models with the Entropy feature can classify with a window length insensitive manner without specified training. As a result of changing LPH with GPH, SVM models trained alone with 1 s (200 samples) long window length entropy features gave 89.06% validation accuracy.
Additionally, when the same models are used to classify features, vectors generated with window lengths down to 650 ms (130 samples) prediction accuracies were above 80%. In the testing with classic ML methods and analyzing entropy NinaPro DB5 dataset taken from Pizzolato et al 37 of NinaPro Project 38 collected with two MYOTM Armbands 39 and a Cyberglove2TM 40 is utilized. After that, a real-time simulation of the newly collected SingleMyo dataset is used. In sections of “Methods” and “Experiments” datasets and real-time classification are presented. In both datasets, the case of fatigue is prevented by making participants rest between recordings; thus, the effects of fatigue are not investigated here. Also, EMG does not change with joint angles except electrode distance with muscle activity. 41 This change is negligible when the electrodes are at the unchanging forearm and can be omitted. Here, it is preferred to classify hand and wrist motions through an armband placed on the forearm close to the elbow.
Contributions to the work can be listed as follows:
•The entropy feature is tested for classifying hand gestures from EMG signals, and its ability of window length insensitivity is discovered.
•A problem with the entropy feature and possibly other histogram-based features is discovered. While LPH is an easily solvable mistake, it can incorrectly increase variation and make the feature space clusters of classes inseparable.
•A novel real-time classification algorithm based on the entropy feature is tested on the newly created dataset.
The rest of the paper is organized as follows: The following “Methods” Section presents data collection methods, datasets, and methods used in the study. After that, experiments and results are given in the “Experiments” Section. Next, the Comparison of “Results” Section contains the results of similar works. Finally, the study is summarised in the “Conclusion” Section with comments on the results.
Methods
Datasets
Data collection devices
MYOTM Armband
MYOTM Armband is an end-user-targeted wireless EMG sensor array created by Thalmic Labs. It has eight dry electrodes arranged as an armband that does not need shaving or applying a gel. Additionally, the armband has a 3D Inertial Measurement Unit (IMU) sensor. The armband has an embedded preprocessing unit, battery, and wireless transmission circuit. Sampling frequencies are 200 Hz for EMG sensors and 50 Hz for 3D IMU sensors. 37
Cyberglove2
Cyberglove2 from CyberGlove Systems is a glove with 23 strain gauges placed at various locations to measure 23 angles of the hand. The sampling frequency is 90 Hz for all 23 sensors. 40
NinaPro DB5 dataset
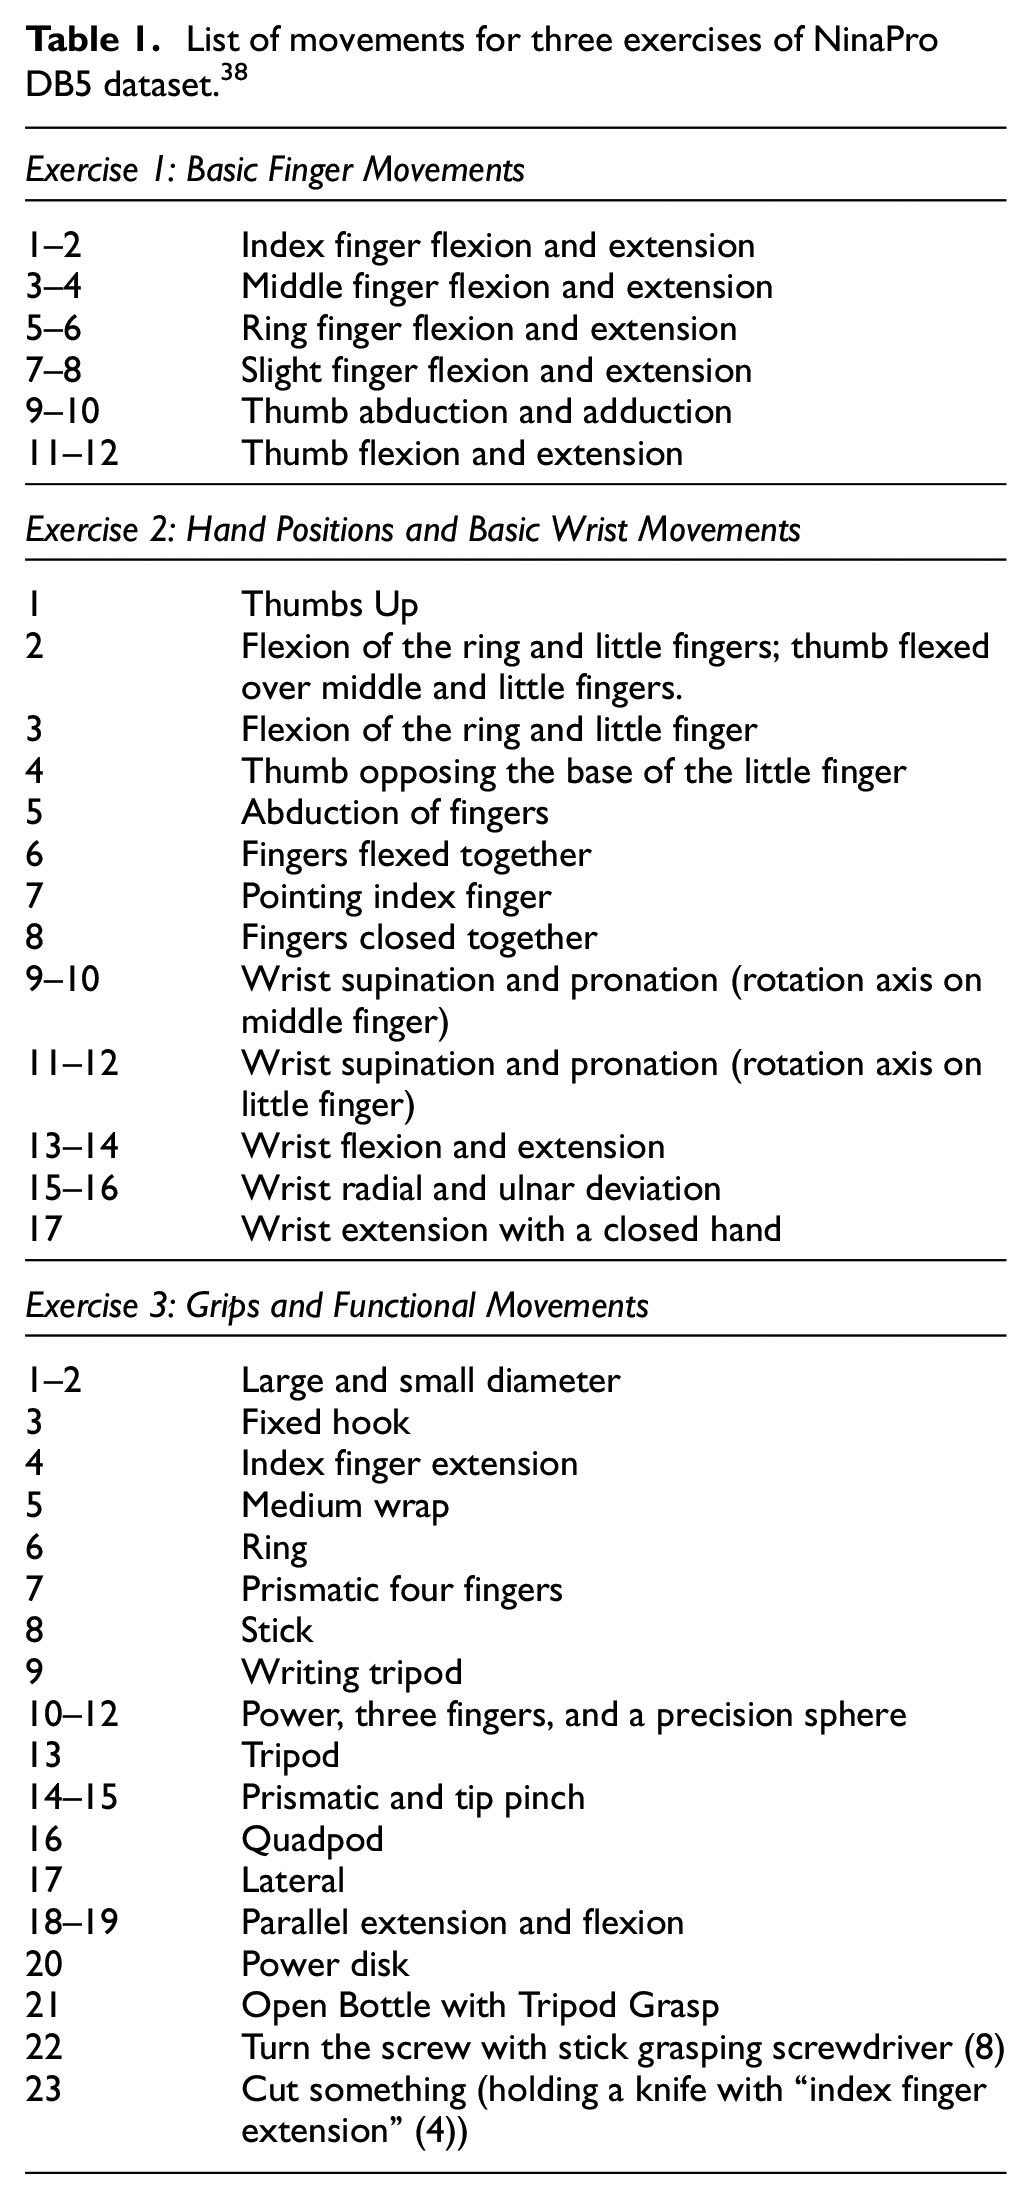
NinaPro is an EMG dataset project to foster artificial intelligence research on robotic and prosthetic hands. 42 Various data collection systems are utilized within its 10 datasets with different participants, including patients with related conditions. Here the Data Base five (DB5) from the NinaPro project is used to evaluate the entropy feature. In DB5, EMG signals are collected by two MYOTM Armbands placed on the forearm, while a CyberGlove2TM is used to track hand motions 37 simultaneously. In the recording of NinaPro DB5, participants repeated 52 gestures (divided into exercises, as shown in Figure 1 listed in Table 1 displayed on a laptop screen.
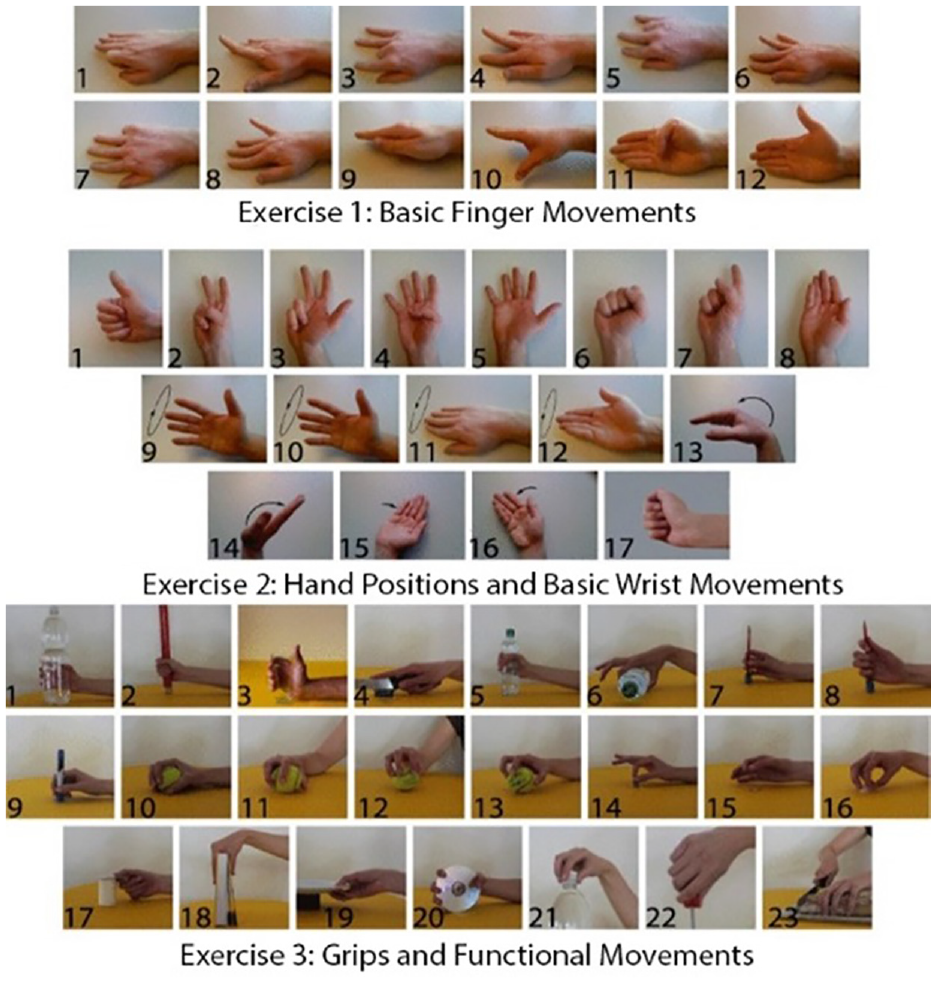
Images of movements in the three exercises. 38
List of movements for three exercises of NinaPro DB5 dataset. 38
DB5 contained data from 16 EMG sensors, 23 strain gauges, 3-direction data from the 3D IMU sensor, and two labeling systems synched with EMG data. While the first one (stimulus) is the gestures shown on the screen, The gesture performed by the user “re-stimulus” is given as the second label system, where the difference can be observed in Figure 2. In this study, features are created from the 16-channel EMG data, and re-stimulus labels of exercise 1 are used as target classes. During experiments, no preprocessing is applied to the readings of the MYOTM Armband.
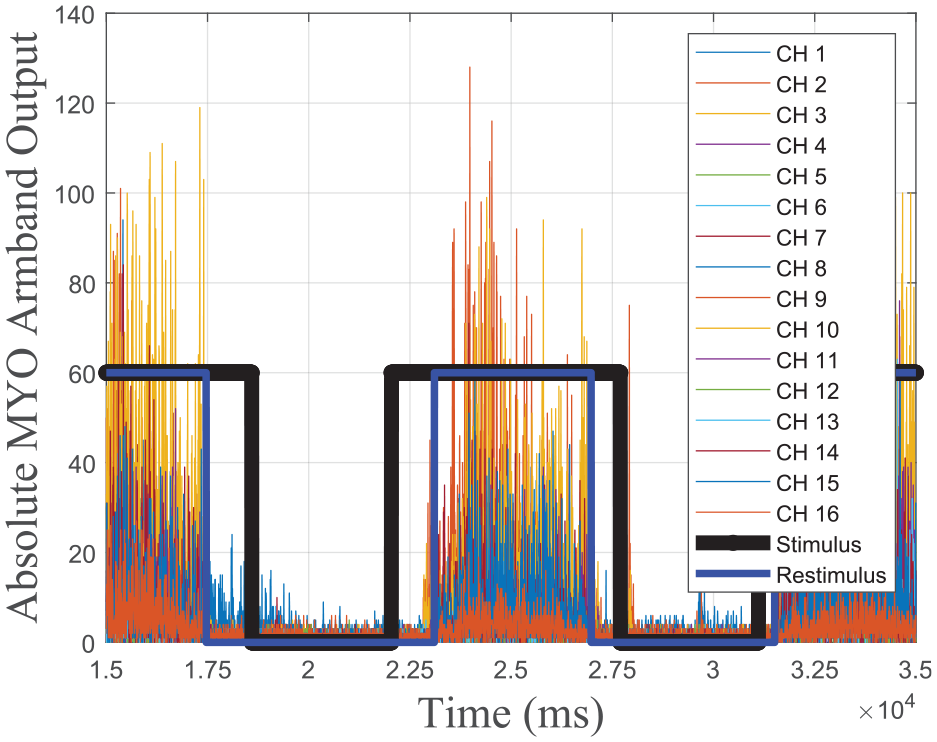
Stimulus and re-stimulus have been shown in two instances of motion.
SingleMYO dataset
Participants and collection process
SingleMYO Dataset is created for this study to have a dataset from the available equipment. This way, after developed methods give satisfying results on this dataset, the models can be tested in real-life applications. The data collection process is approved by the Research and Publication Ethics Committee of Cankaya University, written consent is taken from all participants, and conducted according to Helsinki Declaration.
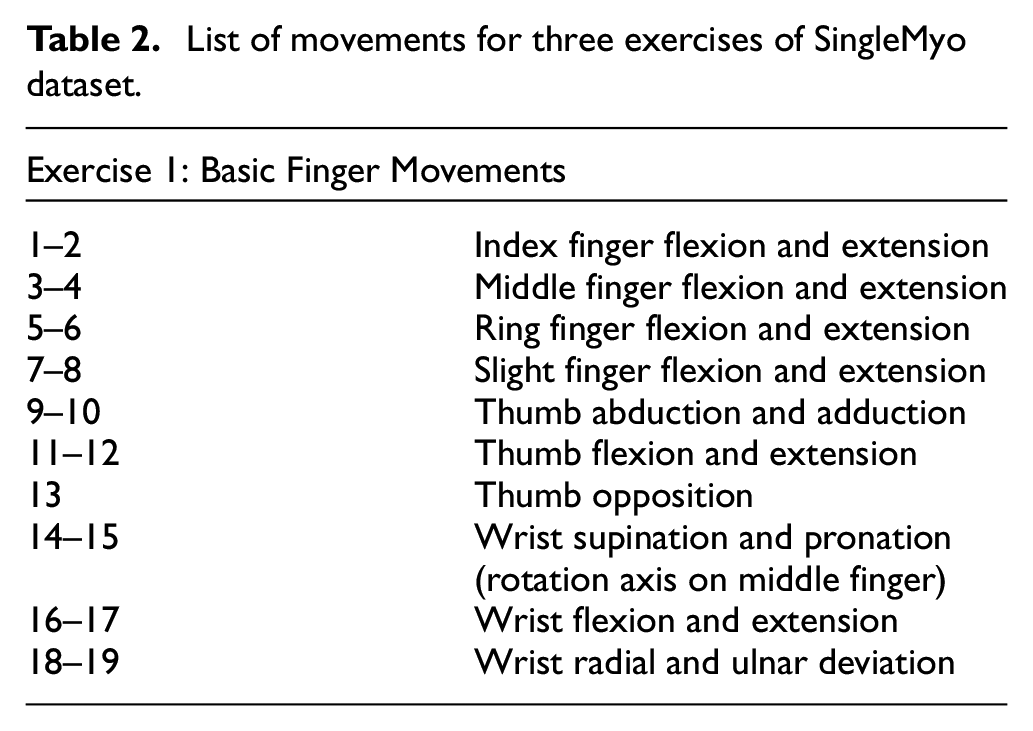
In SingleMYO, EMG signals are collected by an MYOTM Armband placed on the forearm and guiding the participant while collecting data, as shown in Figure 3. Nineteen motions are given in Table 2, and the rest state is recorded. The recorded motions are selected as fundamental motions of the hand and wrist by inspiration from Olsson et al. 21 In data collection, each participant repeated each motion in separate sessions. Motions are repeated six times for 5 s while resting 5 s in between repetitions. Only EMG data from eight sensors and the labels given by the collection process are recorded. In the experiments preprocessing is not applied.
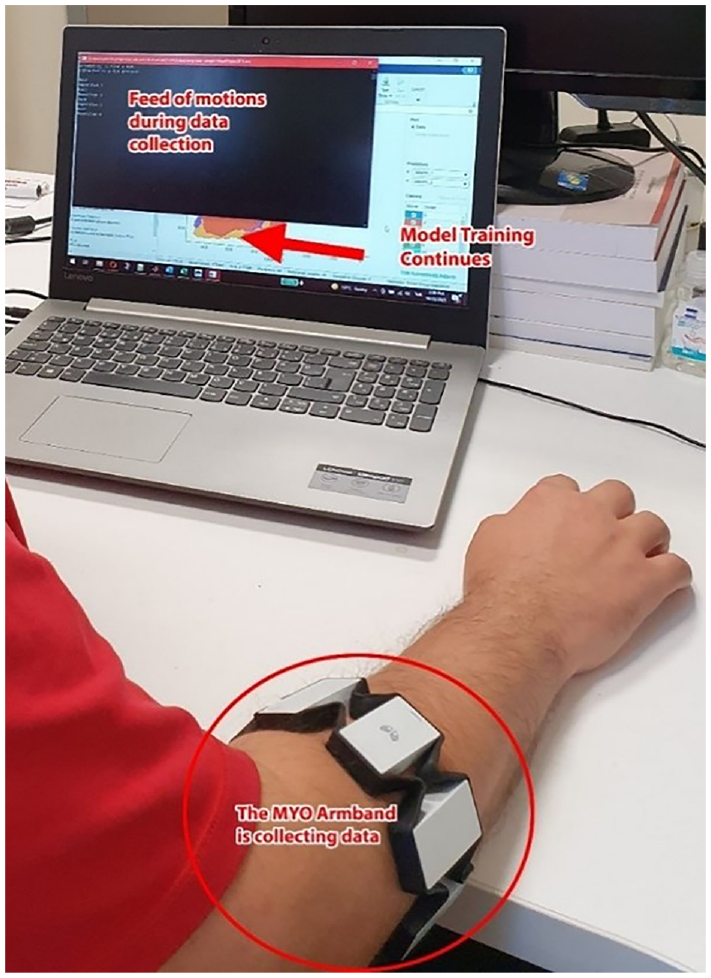
Data collection setup for SingleMyo dataset.
List of movements for three exercises of SingleMyo dataset.
Entropy
Entropy is a calculated property brought into computer science by Shannon 35 through information theory. While it is always related to scatteredness and uncertainty, it is also used to measure the amount of information. After Shannon, different equations are proposed to estimate entropy. Some useful ones are logarithmic energy, approximate, sample, permutation, fuzzy, and spectral entropy.43,44 In this study, entropy is used as given by Shannon since it is the first form in Information Theory.
In Algüner and Ergezer, 29 combinations of a set of nine features are tested for three different EMG classification problems. There it is shown that feature performances vary from application to application. After that, in search for new features, authors found that in studies of EEG and ECG classification, the entropy feature is used with success.30–32 However, despite its success in other fields, the entropy feature is unused for EMG classification to the best of our knowledge.
The entropy feature of any data window is calculated as equation (1). The probability of occurrence
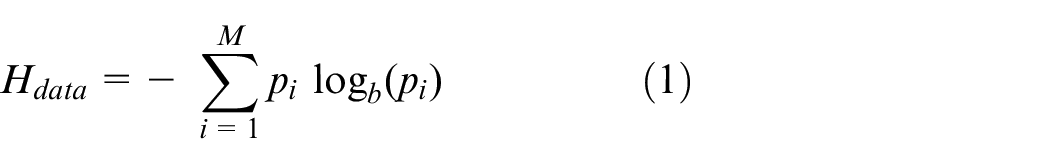

Here
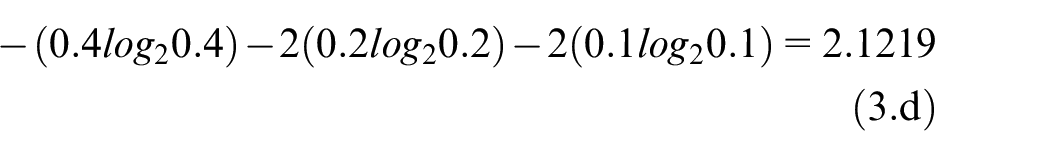
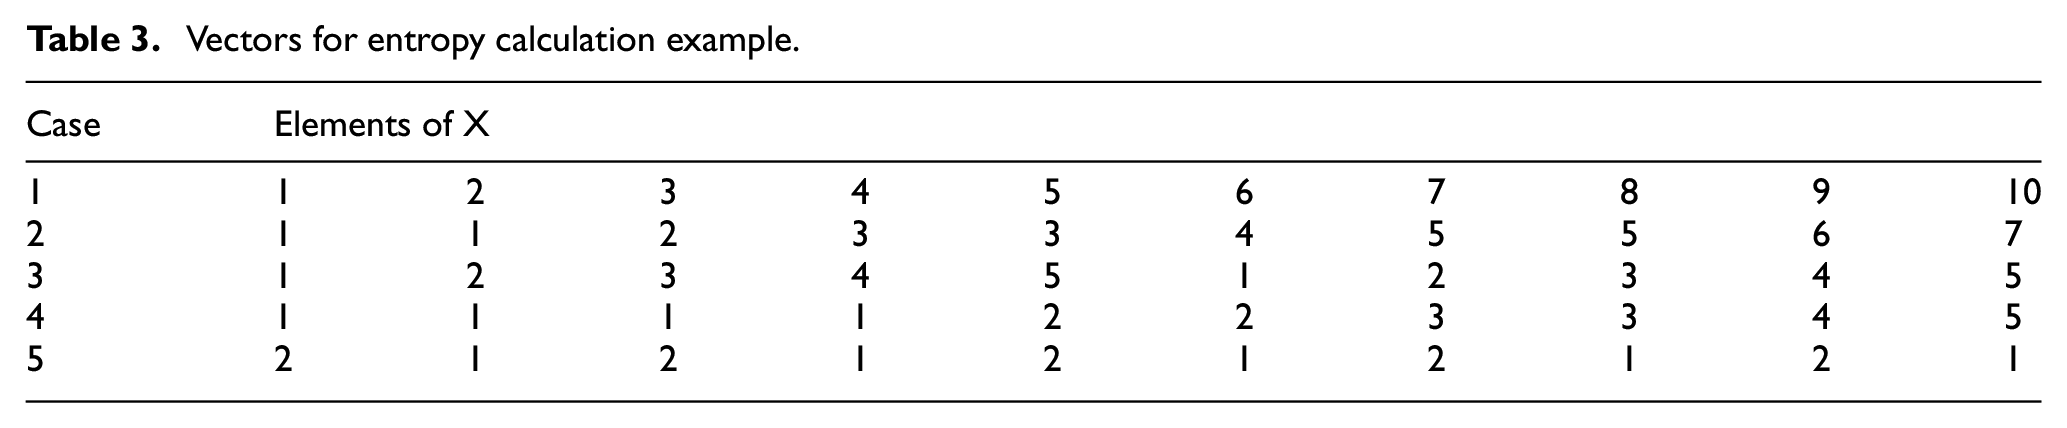
For example, entropy is calculated for five 10-element long


Vectors for entropy calculation example.
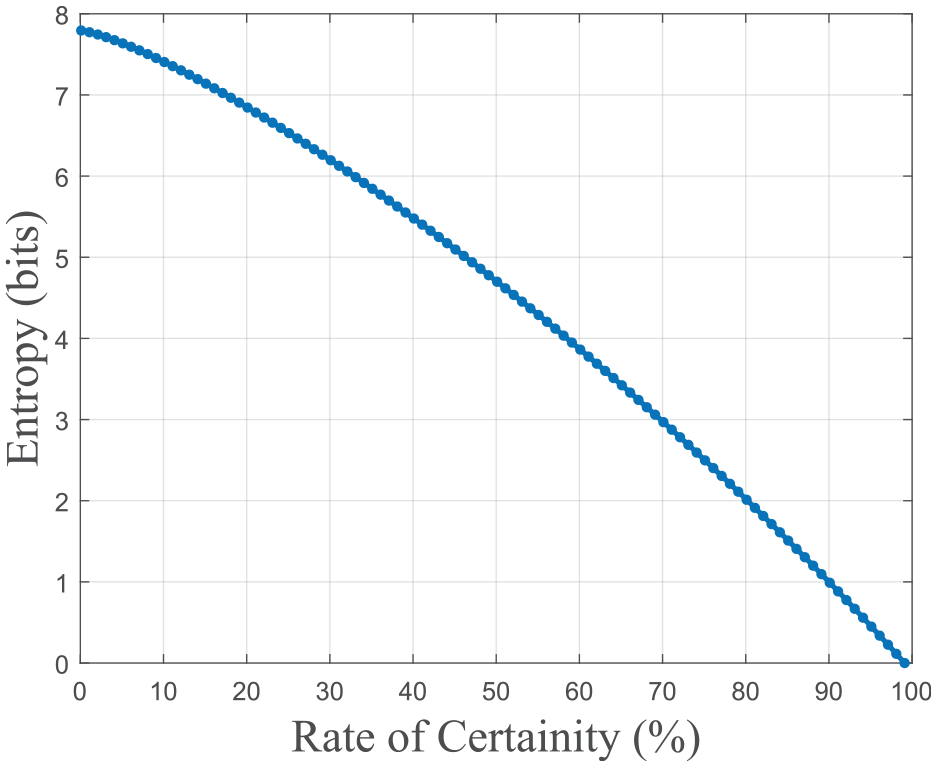
Uncertainty – The entropy graph is drawn by incrementally changing random numbers with known numbers.
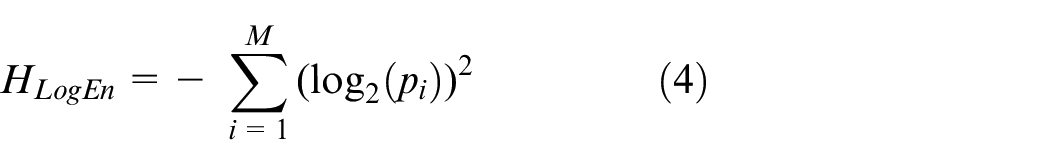
In time many modifications are proposed to change entropy to suit better for specific problems. In the experiments of this study, one of the entropy variants is also used at one point. This variant is known as
In Figure 5, EMG sensor output and entropy values are calculated from the same EMG recordings drawn at the same timeline. It visualizes the correlation between EMG activity and entropy values. EMG has low amplitude in the rest state, and readings change within a small band, resulting in low entropy values. On the other hand, when there is activity in the muscles, the readings spread through a much larger band, resulting in higher entropy values. Different motions result in different combinations of high and low entropy values. This difference allows machine learning algorithms to distinguish one gesture signal from others.
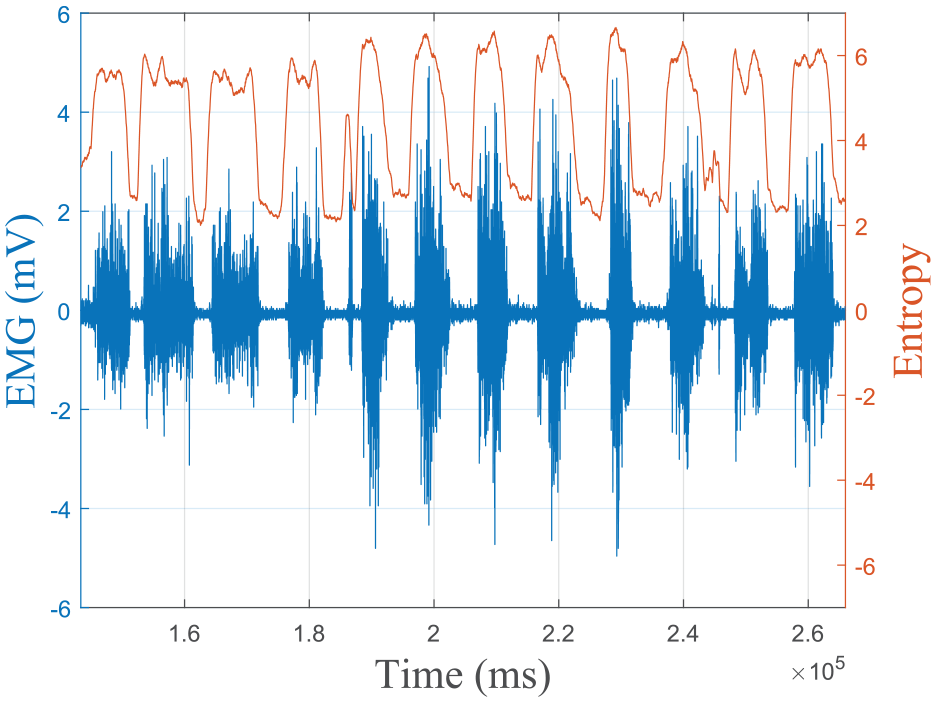
EMG versus time and entropy versus time drawn together for the first sensor of the 10th participant.
SVM for evaluation
To investigate the Entropy feature for EMG classification, a simple but complete classification application is required as a testing ground.
In general, a complete supervised classification application should have the following parts:
• Creating or taking a dataset, selecting features to be used, and dividing the dataset into training and testing.
• Generating feature vectors from raw measurements for training and test parts, then training a model using the features of the training dataset.
• Apply the model to the testing set, then calculate performance parameters by comparing real and predicted labels.
All these parts should be working as well as possible to show only the effects of the experimented part. The dataset NinaPro DB5 and the newly created SingleMyo datasets are used for the data collection. Since the experiments are about the performance of the entropy feature, it alone is selected as the feature set. While generally, training and testing sets are defined as 70%–80% for training and the rest for validation and testing. Here for model training and validation accuracy calculation, feature vectors created with 1 s (200 samples) long window lengths are separations as 80% for training and 20% for validation.
Testing is done on a different experiment where window length sensitivity is measured. For those experiments, feature vectors are created with window length = 50, 60, 70, …, 300 samples long, and the models trained in the previous experiment made predictions.
Here it is important to clarify that the efficiency of the ML method is not the goal; however, a good enough method should be selected for classification. Other vise performance of the model will be affected by components other than the tested part. After tests with classical ML algorithms (given in “Experiments” Section), SVM is selected as it is best after kNN. kNN models are computationally expensive, and they show over-fitting even after cross-validation, thus unsuitable for real-time estimations.
Besides this test, there are three other reasons why SVM is selected. SVM has much fewer parameters than deep learning methods. Its more demanding nature makes it better for smaller datasets. Also, as shown by many studies in literature, it can distinguish EMG signals of different gestures. These properties make SVM an easy-to-use, fast resulting and comparable research method. Additionally, as EMG patterns are highly variant, 6 they require calibration and retraining, making SVM a better fit for a faster-to-train method. Quadratic SVM is selected as a method with better results as it represents a midpoint between first and third-order kernels.
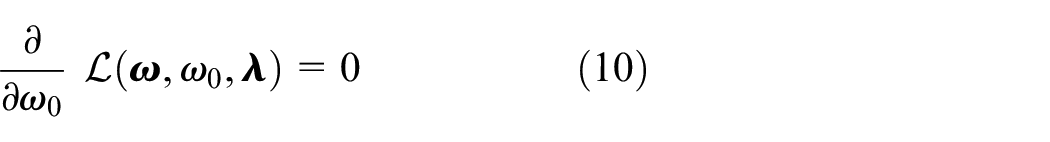
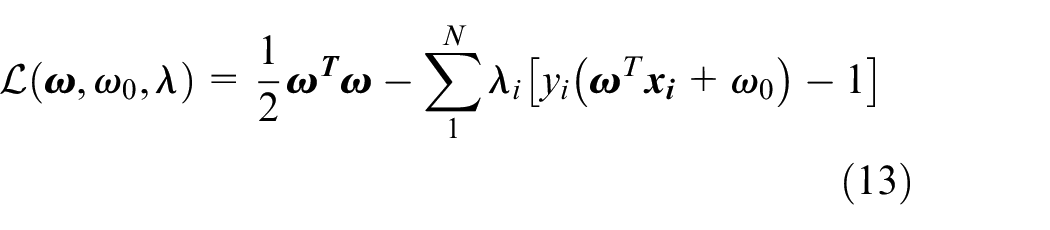
The most basic form of SVM is separating two linearly separable data clusters of two different classes. Let

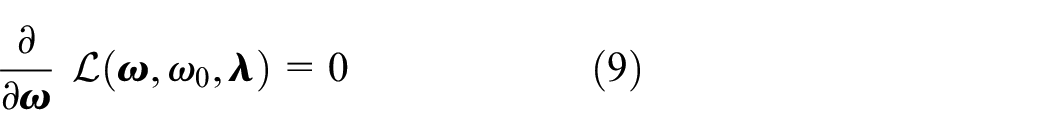
The solution to this problem is not unique, and other methods, such as an Artificial Neural Network (ANN), will output any line that separates sample clusters of two classes. However, an engineering decision on the classification model should also demand the ability to classify the classes’ feature vectors outside the training set. In SVM, these criteria result in a hyperplane, defined as in equation (5), at an equal distance from vectors of the two classes closest to the other class, called support vectors. However, the scaling factor might not be the same for different directions and normalized using the formula in equation (6). After scaling


The resultant direction is


GPH
When entropy is tested with multiple classic ML methods, while some give high results, many give low accuracies. Additionally, the lack of articles using entropy for EMG classification might indicate a problem with the feature.
Initial analysis of the entropy feature showed a wide variety even within EMG signal windows of the same gesture preventing SVM from properly learning. One possibility for this instability was histogram parcels being recalculated for each window, making incorrectly varying probabilities. Calculations of probabilities are shown at “Entropy” Section under the “Methods”; however, in reality, histograms are formed not for all values but for intervals called parcels.
Built-in histogram functions should answer all input vectors, and because of that, they recalculate parcels for each input vector every time. When these vectors are sliding windows of a time series signal, this recreation of parcels can create instability. As the window slides, values within the input vector change, thus the boundaries and parcels. As the parcels change, their probabilities will vary incorrectly, leading to entropy values also varying incorrectly. This variation causes incorrectly high variation of feature values even within classes making the difference between feature vectors of different classes blur. As a result, ML algorithms can’t learn and misclassify feature vectors leading to low classification accuracy.
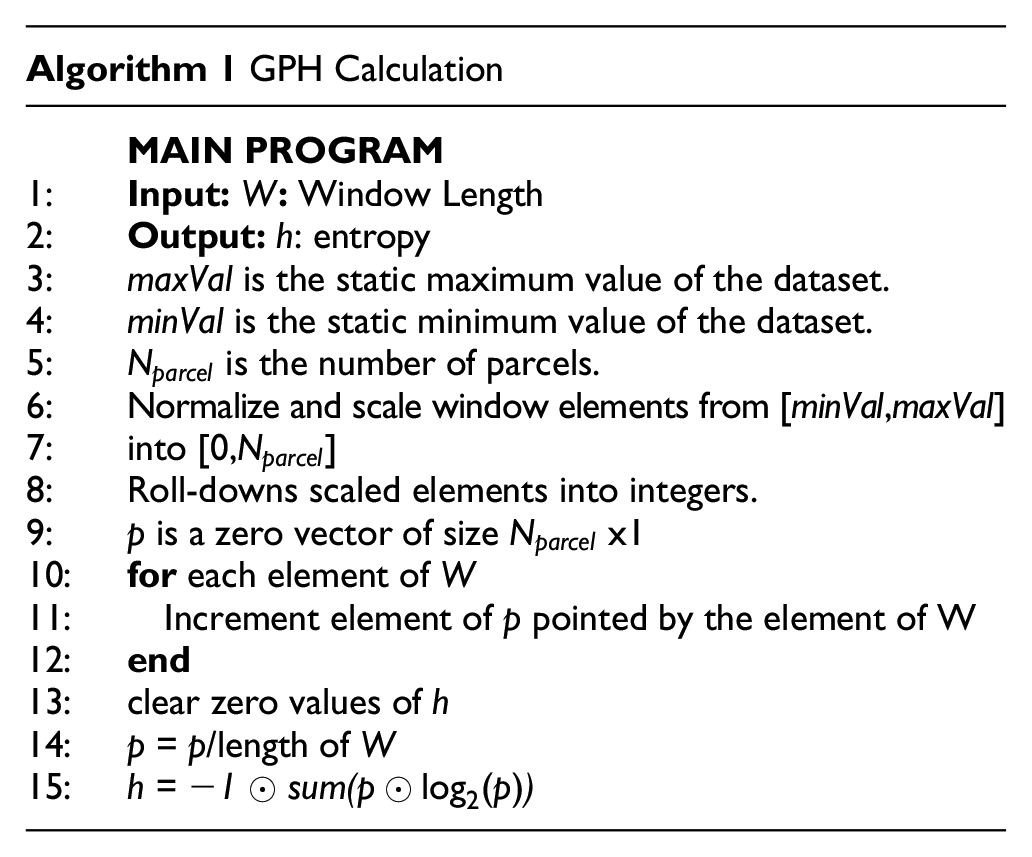
GPH proposes to use static parcels defined outside the entropy calculation for statistical usage of the histogram. Here the parcels are defined as boundaries and resolution of the data collection apparatus. When an SVM is trained and compared with LPH, classification accuracy increases from 60.35% to 89.06%. Since parcels became static, Algorithm 1 was developed using a more algorithmic than conditional base approach. In Algorithm 1, variables scaled into [0
In Aydın and Akın, 46 finite impulse response (FIR) filters are used to extract some information extract sub-bands of EEG signals. It is possible to design FIR filters of EMG signals, but our main motivation is to show entropy feature can be used in real-time gesture classification. Since FIR filters cause some latency and eliminate some components of the EMG signal, the performance of the real-time gesture classifier is reduced. We designed filters during our initial trials, which increases offline gesture classification performance, but the effect is the opposite for real-time applications.
Activation detection for real-time classification
In the entropy analysis, the rest case is excluded to focus on the separation of gestures. Activity detection is developed to separate gestures from the rest class to make these models real-time applicable. In the real-time experiments mentioned in the “Experiments” Section), this criterion is utilized in the overall process and speeds up histogram calculation.
Activation criterion kept as a threshold for low time complexity for a function maps window sections of active and rest groups into linearly separable clusters. A two-step filtering is applied to speed up the process further, as given in Algorithm 2 is used. When such a function is found, a quick calculation can determine the activity state of the window. Active and non-active measurement vectors are separated, and different functions are tested to determine the criterion.
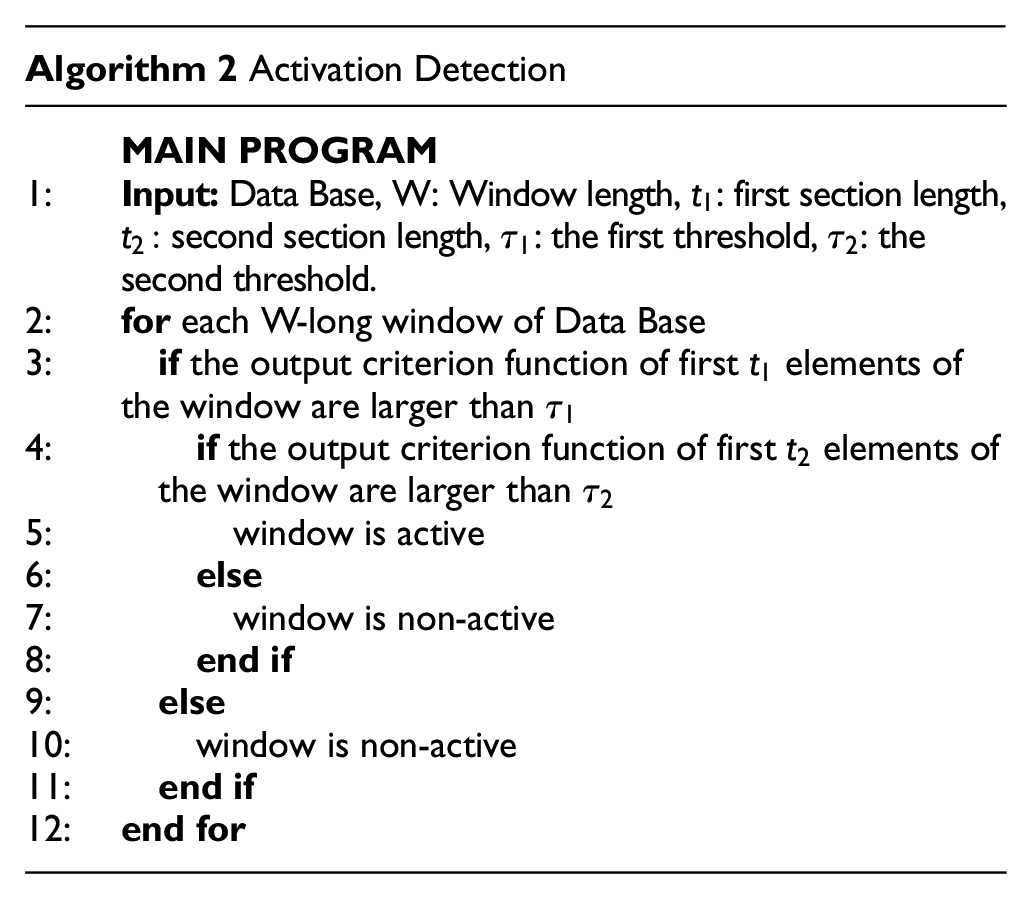
In the algorithm, natural numbers
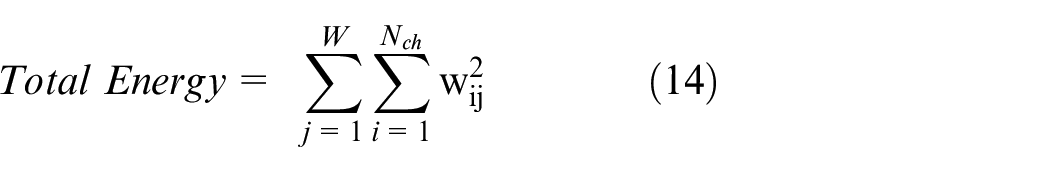
Many functions are tested for Algorithm 2 by comparing distributions of functions of both cases. However, high variance is always causing the mixing of results of both sides, indicating that linear separation is impossible. For example, the total energy is one of the functions tested for activation detection. It is calculated as in equation (14), and the total energy distribution of activity and the rest cases are given in Figure 6.
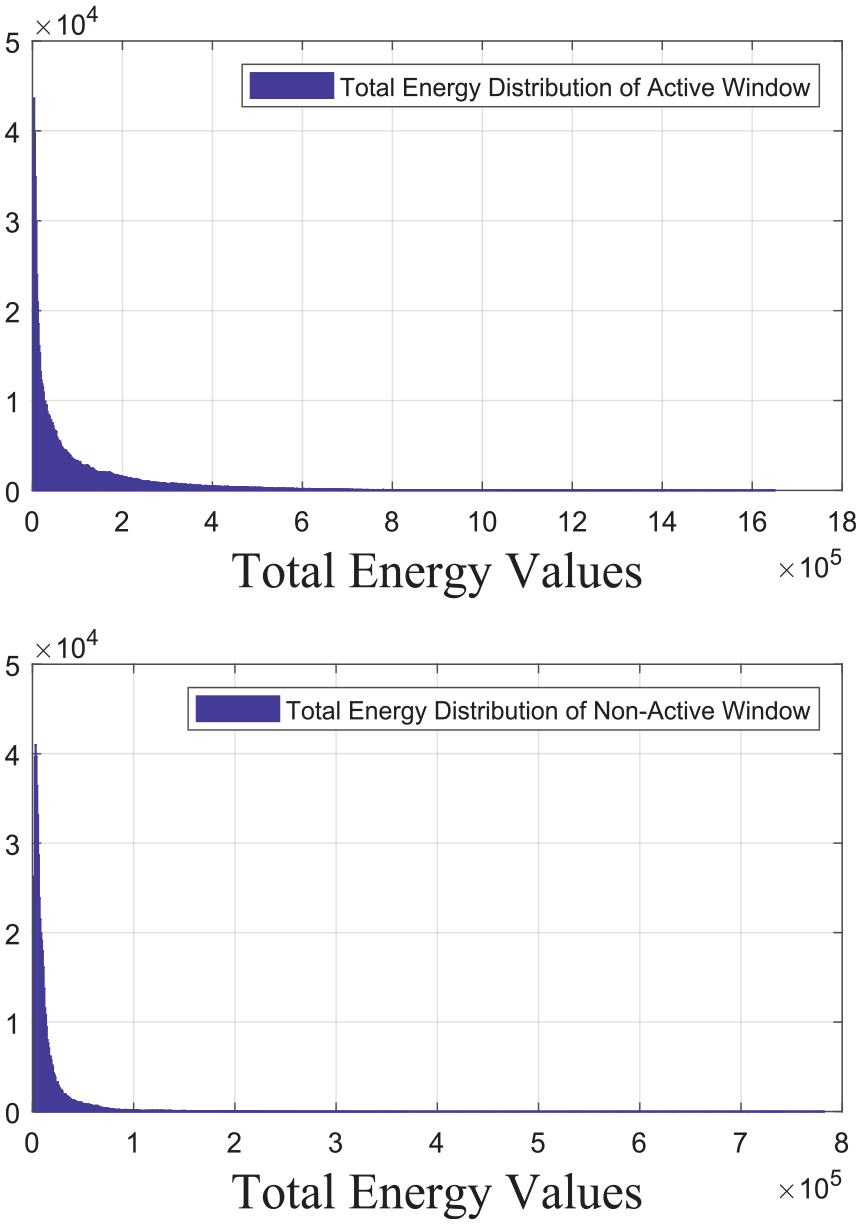
Total energy distributions of active and non-active 250 ms (50 samples) long data windows.
Since linear separation seems impossible, PSO is used to find the best


Experiments
Experiment protocols
This study uses three kinds of experiment protocols to analyze the entropy feature. The first type is the simplest ML application, only with feature calculation and model training. The second type of experiment is testing a model for window length sensitivity. The last type is the “Real-Time Experiments” given in the next part.
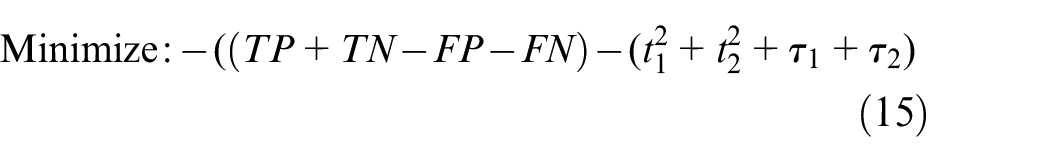
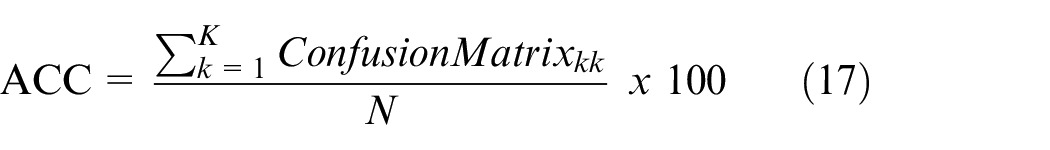
The first type generates features from EMG signals with 1 s (200 samples) long windows. With a given method, the ML model is trained. To measure training an ML model with these feature vectors, calculate the confusion matrix and validation accuracy (
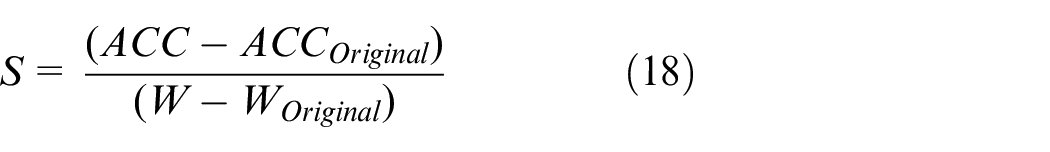
In the second type of experiment, features are generated with a range of window lengths. Then SVM model is used to predict labels of feature vectors for each window length separately. Each window length’s accuracy is calculated as in equation (17). Later window length sensitivity is calculated as in equation (18). Where W is window length, the subscript original indicates
Real-time experiments
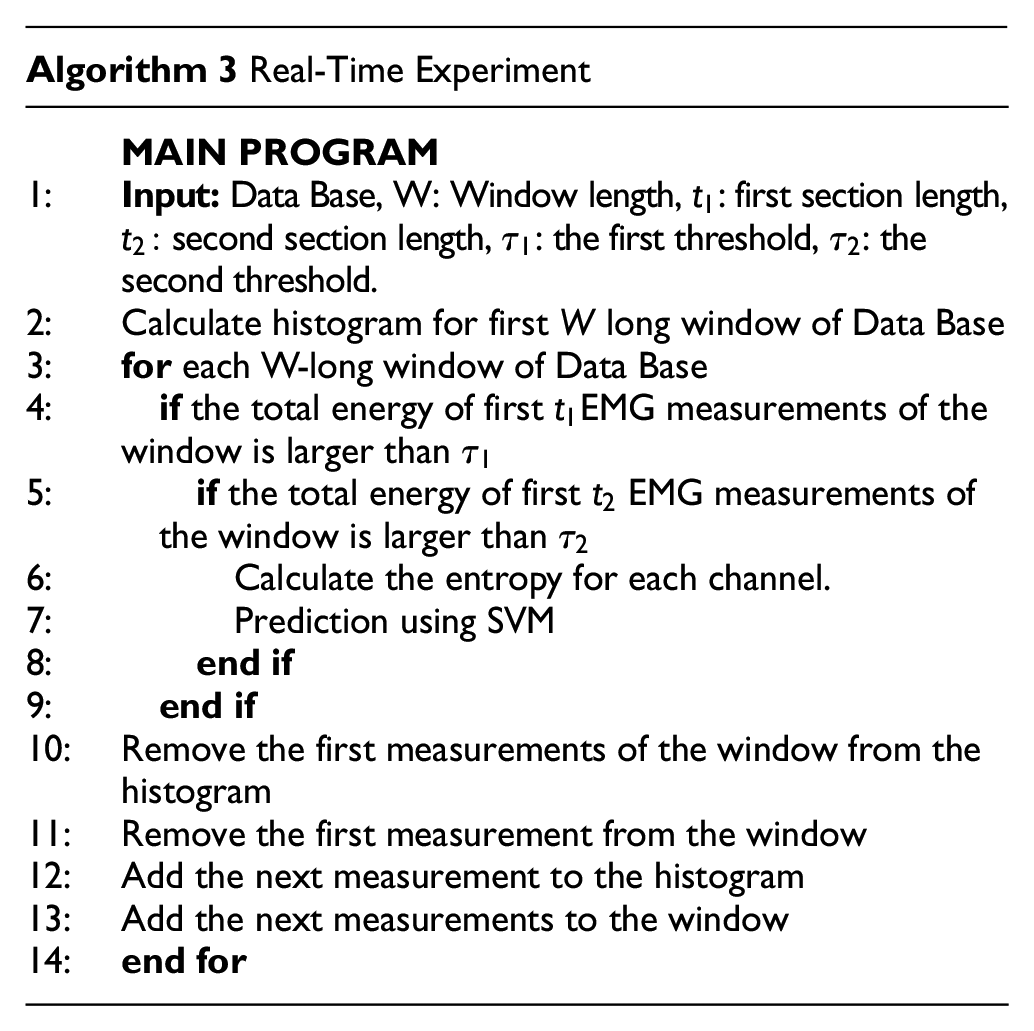
To let SVM focus on the gestures while analyzing the entropy feature with Nina Pro DB 5 rest state is discarded. However, this is not applicable for real-time tests, and Algorithm 3, utilizing the activation detection given under the “Methods” Section is developed. To make it even faster histogram is created only for the first window and then updated at each iteration. This overall process is expressed in Figure 7.
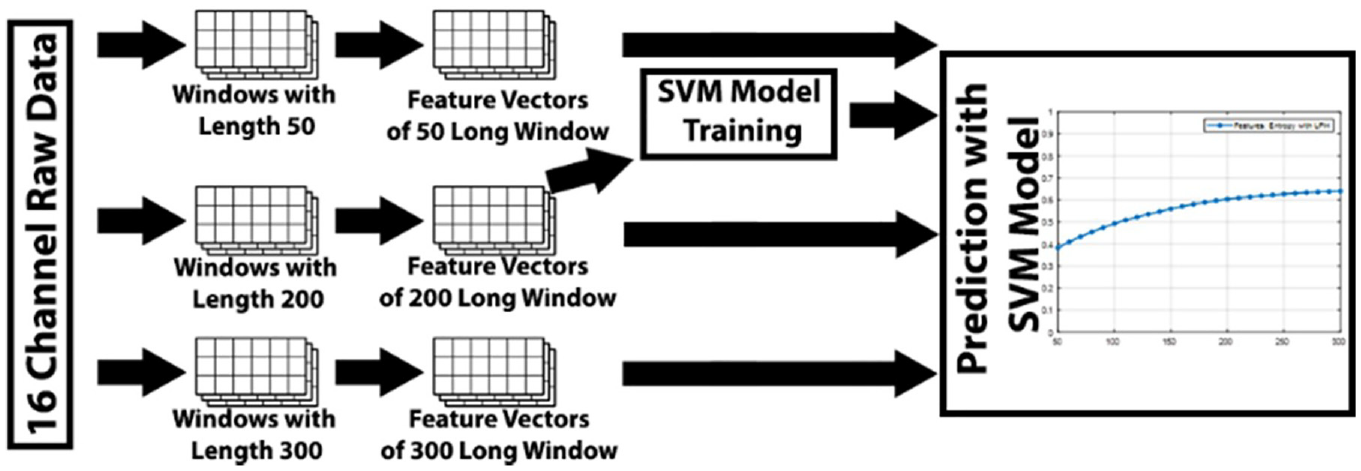
Data flow of model training and testing process.
The system designed for a real-time environment is given in Algorithm 3. In real-time experiments, Data Bases are used as recorded; measurements are fed into the system one by one. For this experiment, time complexity and overall classification accuracies are measured.
Experiment results
Testing classic ML methods on entropy feature
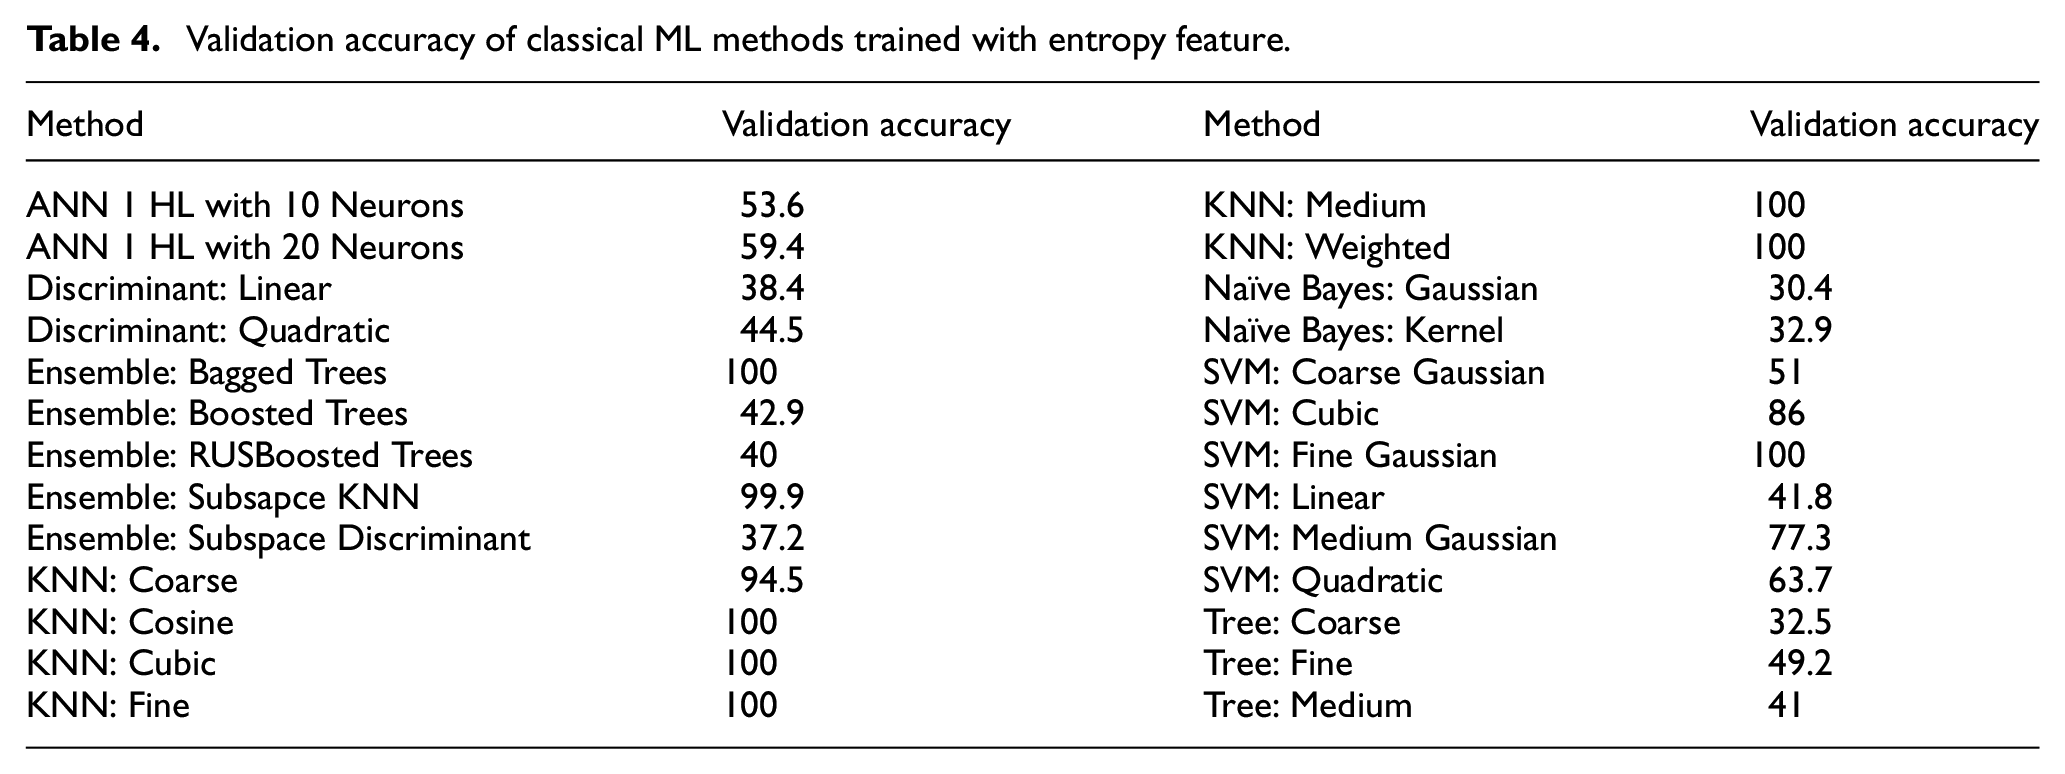
ANN, discriminant analysis, Ensemble, KNN, Naïve Bayes, SVM, and Random Tree (RT) algorithms are used with the entropy feature alone to test the performance of entropy for EMG classification. The models are trained with fivefold cross-validation, and average validation accuracies are given in Table 4. As can be observed in Table 4, kNN and SVM gave the best results. The best method was kNN, but it is known to be slow when predicting feature vectors, and it showed over-fitting despite cross-validation. For these reasons and the ones given in the SVM title of the “Methods” Section, SVM is selected for the rest of the analysis. The SVM models also had quadratic kernels and were trained with a five-fold validation process for one-to-one classification. These SVM classifiers test GPH and real-time classification with entropy features.
Validation accuracy of classical ML methods trained with entropy feature.
Window length sensitivity and GPH compared with LogEn
While SVM showed higher results than most other methods, 60.35% validation accuracy is not enough. While trying to increase accuracy with different modifications second type of experiment is conducted as an indicator to show generalization. At this point, low window length sensitivity is discovered while using a quadratic SVM model trained with feature vectors generated by 1 s (200 samples) long windows.
As shown in Figure 8, accuracy dropped only from 60.35% to 53.53% when window lengths were decreased to 130-time steps. Furthermore, when window lengths are increased even after the original window length, accuracies continue to increase.
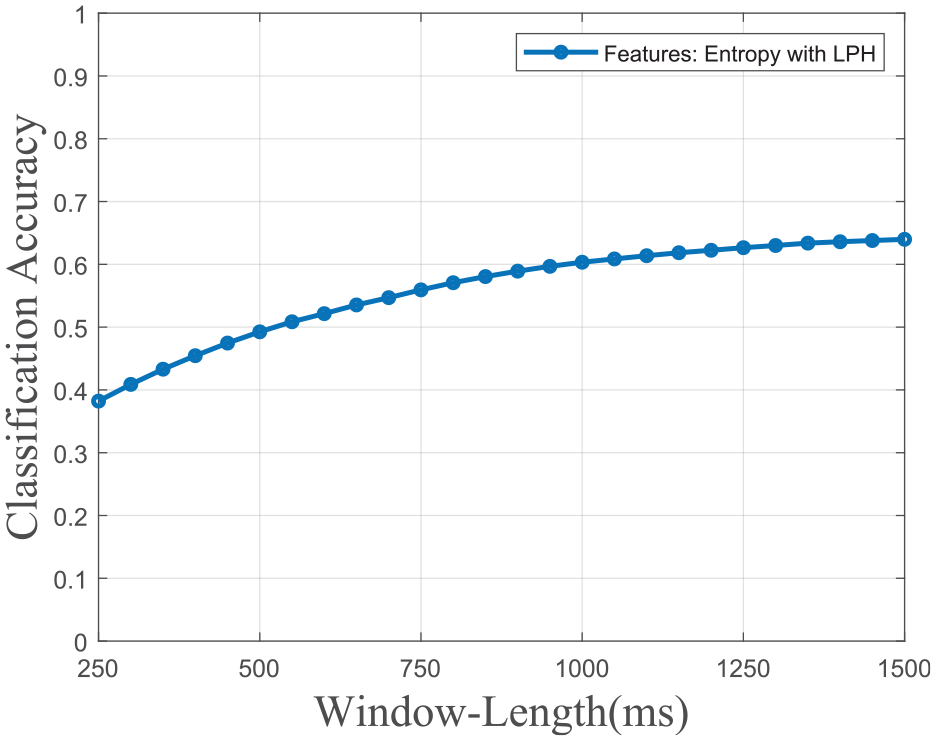
Accuracy vs. window-length graph of entropy feature with LPH.
After that, it is thought that the source of the low accuracies might be the recalculation of histogram boundaries. To investigate that GPH feature extraction is written and tested. In Figures 9 and 10, the results of the LPH and GPH versions of the second experiment are given together. In these figures, the SVM model’s accuracy is significantly increased (from 60.35% to 89.06% for the original window length of 1 s (200 samples)). In contrast, the low window length sensitivity is maintained. These two results may indicate those classification models trained with entropy as the only feature that can be used in cases of varying window lengths.
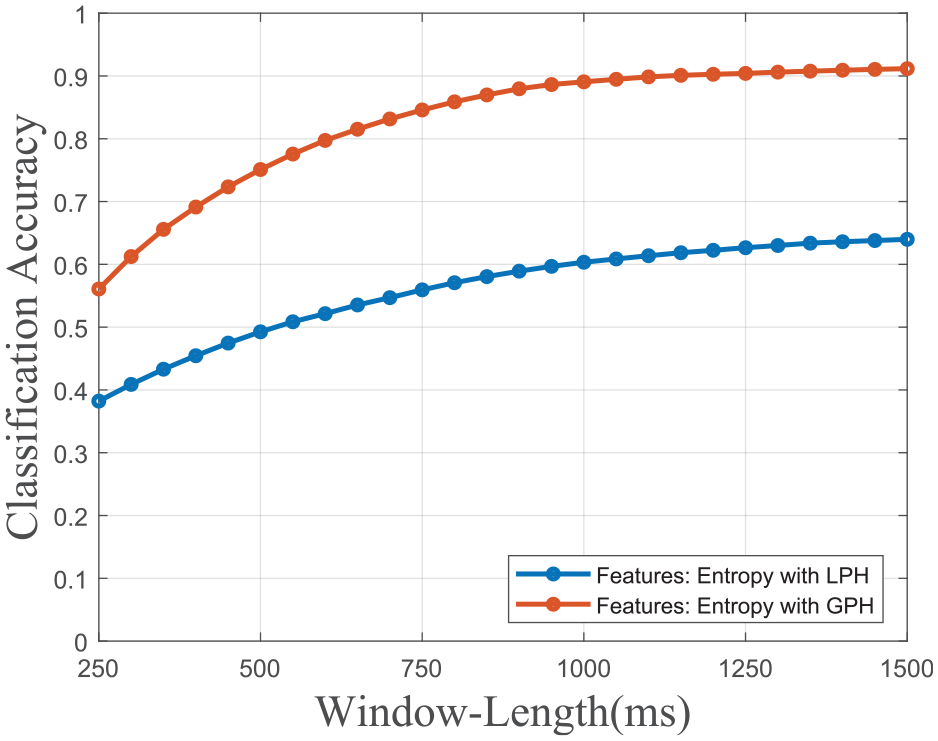
The accuracy versus window length graph of LPH and GPH entropy feature models.
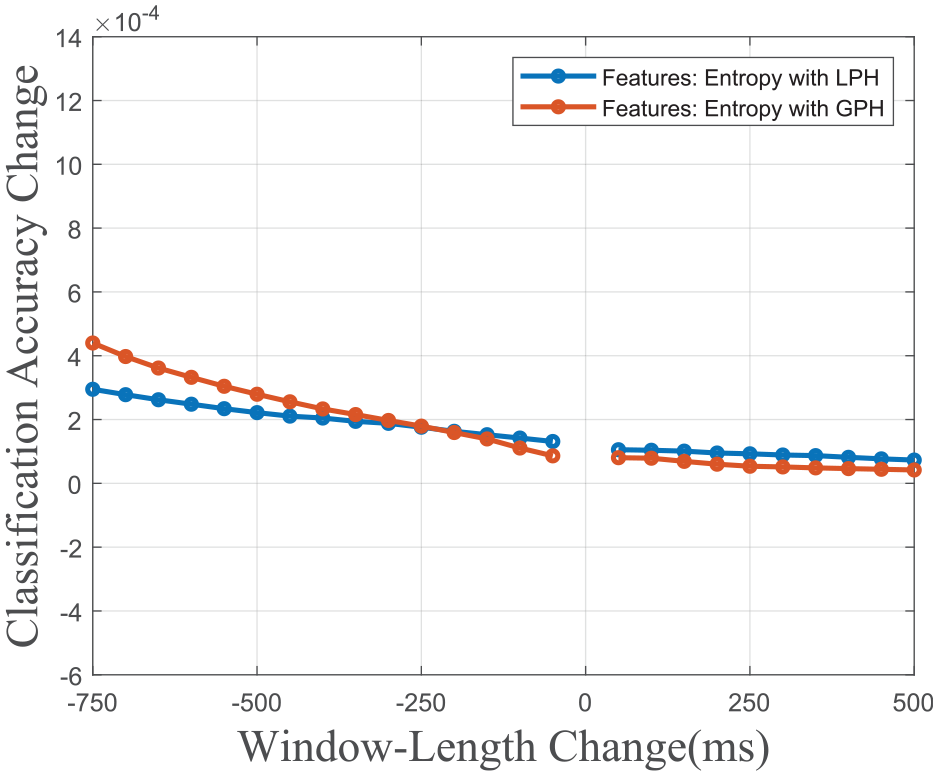
Accuracy change versus window-length change graph of LPH and GPH entropy feature models.
The comparatively same test is done by pairing entropy with LogEn to show the entropy feature’s low window length sensitivity ability. As can be observed in Figures 11 and 12, when LogEn is used, classification accuracy reaches 99.35%. However, as window lengths change, classification accuracy decreases much more than when entropy is used alone.
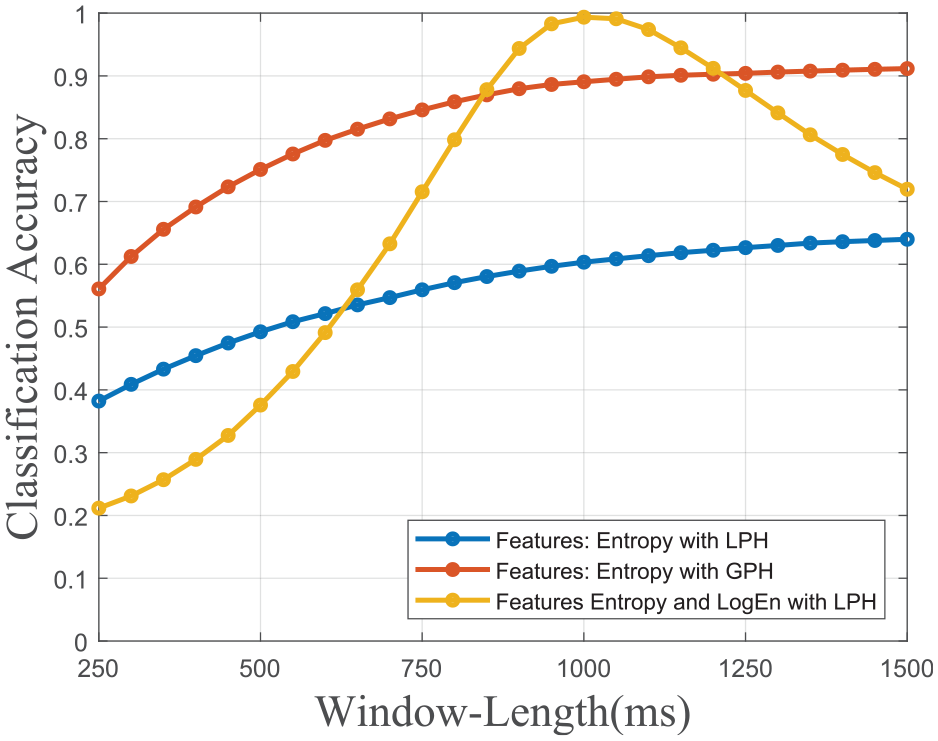
Accuracy versus window-length graph of features LPH entropy, GPH entropy, and LPH entropy and LogEn models.
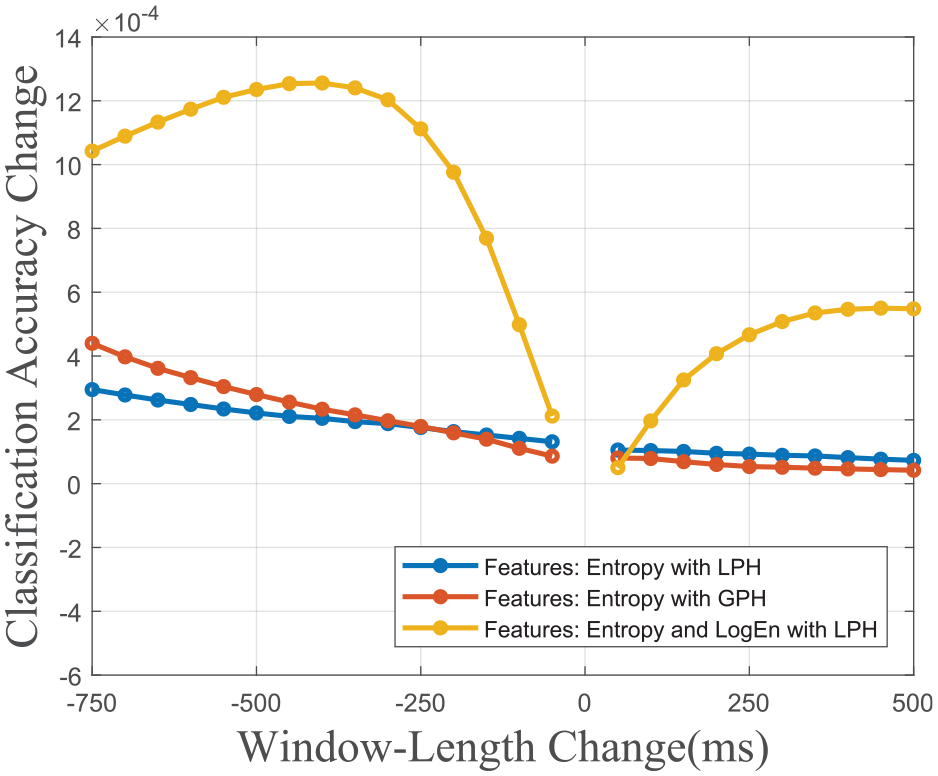
Accuracy change versus window-length change graph of features LPH entropy, GPH entropy, and LPH entropy and LogEn models.
Overall real-time accuracy and time complexity
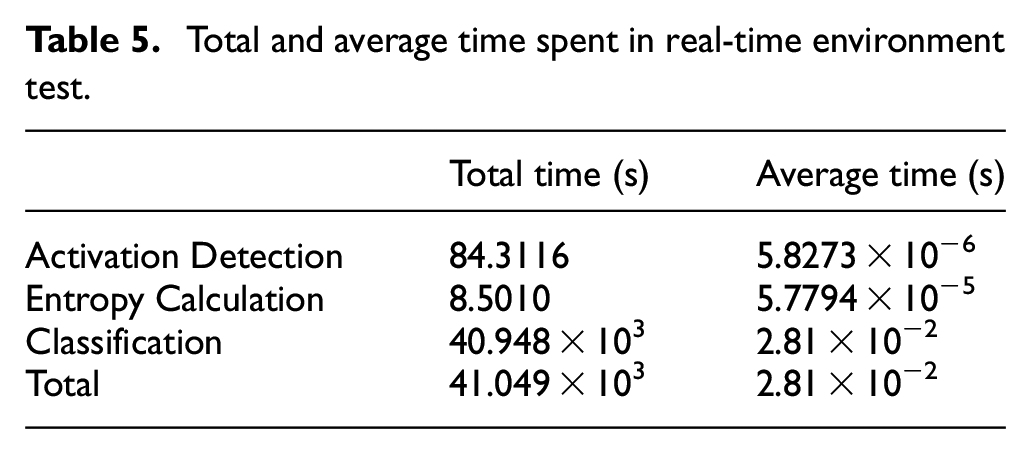
After satisfying results with GPH, this study moved to real-time tests. These experiments are performed consecutively using the real-time environment created using activation detection, GPH, and trained SVM models. At this point, three concerns are most important for the analysis. They are total and average time complexity, activation detection filtering, and overall classification accuracy. The real-time environment is executed for 1 s (200 samples) long windows. The total and average times spent for activation detection, entropy calculation, and classification are given in Table 5. The activation detection correctly distinguished 71.4% of all windows, while the rate of false alarms was 10.32%. With the rate of inputs incorrectly sent to SVM at 19.45%, the overall system with activation detection integrated inside accuracy is 49.02%.
Total and average time spent in real-time environment test.
Comparison of results
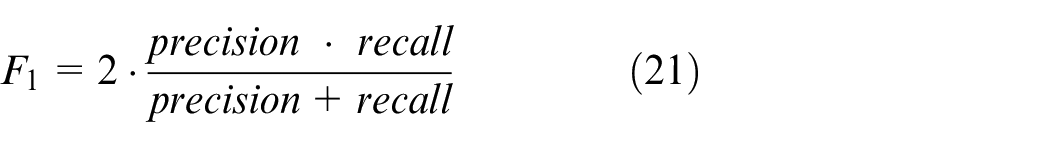
In this study, classification accuracy was the metric for developing methods. However, some studies use precision, recall, and F1 score, and the range of these values calculated for each gesture are 81.27%∼88.29%, 77.08%∼89.36%, 82.94%∼87.73% in the same order by equations (19)∼(21). Here TP, FP, TN, and FN are True Positive, False Positive, True Negative, and False Negative.


Oskoei and Hu 17 optimized SVM for data segmentation, feature set, model selection approach, and post-processing; achieved 94%−99% classification accuracy for six gestures. Cai et al. 24 drive a self-rehabilitation robot with SVM EMG classification of five gestures. Precision, recall, and F1 ranges were 90.5%∼99.1%, 85.8%∼ 99.1%, 88.1%∼99.1% respectively. Zhang et al. 22 used SFS and PSO for feature selection. Over 11 arm gestures, classification accuracy and average prediction times are 98% 430 ms, 98% 230 ms, and 99% 180 ms for models with non-optimized SVM, SFS, and PSO. Qi et al. 25 applied PCA for feature dimension reduction on GRNN, resulting in 95.1% classification accuracy with 0.19 s average prediction time. Too et al. 20 proposed P-Best Guided Binary Particle Swarm Optimization (PBPSO) for feature selection. Precision and F1 of gestures ranges are 45.52%∼97.45% and 41.20%∼95.92%, with a 49.27% average feature reduction rate. Hu et al. 18 proposed a CNN-RNN hybrid architecture and image representation of EMG signals to increase the best results of five benchmarking datasets from 82.8% to 99.7%.
Lastly, two of these studies used NinaPro DB5. In Algüner and Ergezer, 29 18 features are tested on NinaPro DB5. Classification accuracies for finger gestures were 91.6% for all features and 26.4% to 84.9% for two feature combinations. In Simão et al., 19 FFNN, RNN, LSTM, and GRU for online classification of hand gestures and prediction speeds given in windows per second were 90.82% 82k, 91.59% 62k, 90.82% 244k, and 92.07% 265k, respectively. On NinaPro DB5, they received 91.59%, 91.07%, and 90.82% accuracies on the test set with RNN, GRU, and LSTM methods, respectively.
Conclusions
Entropy is a core concept in information theory which is a calculated property that directly indicates the amount of information and complexity. It is also associated with uncertainty and disorder. In the bio-signal-related machine learning literature, including EMG, entropy is frequent; and is used as a feature for EEG and ECG signal classification. However, to the best of our knowledge, the entropy feature is not used to classify EMG signals of gestures before. Here entropy feature is tested for the EMG classification for the first time. First, the previously used entropy feature is tested with many classical ML methods. When entropy and EMG signals are drawn together at the same timeline, a close correlation between EMG activity and entropy amplitude is observed. In later experiments, SVM with a quadratic kernel is used. Even SVM gave the highest validation accuracy after KNN Quadratic SVM’s result was only 60.35%. Its reason was that LPH creates a wide variety, resulting in classifiers being unable to distinguish feature vectors from each other. It is solved by introducing the GPH approach, lifting accuracy to 89.06%. It was also discovered that models trained with entropy features could classify feature vectors extracted with windows with different lengths. For example, models trained with windows of 200 ms classified feature vectors created from 130 long windows with 53.53% and 81.52% accuracy when using LPH and GPH, respectively. A real-time entropy calculation algorithm utilizing the parcels being constant and activation detection is designed. When 1,459,030 EMG measurements were fed into this real-time version, including activation detection and SVM, the average time for one prediction was 28.1 ms and accuracy was 49.02%. Next, this method should be tested with a live classification application and real-life device control. Also, GPH might show improvement in statistical features based on histograms. In the end, this work shows that the entropy feature makes low window length sensitive classifiers when GPH is used. In the future performances of other entropy features, such as sample entropy, approximate entropy is planned to be measured similarly. Measuring the difference between LPH and GPH on the different entropy features is also planned.
Footnotes
Acknowledgements
We would like to thank Efe ÇİFTÇİ and Simge YOZGAT for their support.
Declaration of conflicting interests
The author(s) declared no potential conflicts of interest with respect to the research, authorship, and/or publication of this article.
Funding
The author(s) received no financial support for the research, authorship, and/or publication of this article.