
Abstract
The advanced manufacturing and machining techniques are adopting a population-based metaheuristic algorithm for production, predicting and decision-making. Using the same approach, this paper deals with the application of bees algorithm and differential evolution to forecast the optimal parametric values aiming to obtain maximum material removal rate during electrochemical discharge machining of silicon carbide particle/glass fiber–reinforced polymer matrix composite. The bees algorithm follows swarm-based approach, while differential evolution works on a population-based approach. The experimental design was prepared on the basis of Taguchi’s methodology using an L16 orthogonal array. For the experimental analysis, the main variables in the process, that is, electrolyte concentration (g/L), inter-electrode gap (mm), duty factor and voltage (volts), were selected as main input parameters, and material removal rate (mg/min) was adjudged as output quality characteristic. A comparative investigation reveals that the maximum material removal rate was obtained by the parametric value proposed by differential evolution that follows the bees algorithm and Taguchi’s methodology. Furthermore, the results prove that the differential evolution algorithm has better collective assessment capability with a rapid converging rate.
Keywords
Introduction
The usage of polymer matrix fibrous composites has increased within industrial applications because of their improved mechanical properties. 1 The research scientists community is still working on possibilities of further improvement in the tribological and mechanical behavior of these materials by adopting various coating and reinforcement treatment methods.2,3 The improved mechanical properties of these materials have reduced the machinability because of reinforced abrasive particles. The reinforced abrasive particles like silicon carbide deteriorate the machining behavior by increasing tool wear. Keeping in mind the prime objective of improved machinability, the research community designed a non-conventional machining process named electrochemical discharge machining (ECDM) process. 4 The research scientists community is working, and propose, to extend the optimization methods to quit large area of manufacturing (i.e. forming, Lightweight structure and so on) and material characterization using various novel (i.e. experimental/computation strategy) and optimization techniques.5–7
In recent times, the optimization techniques are gaining serious consideration in most of the engineering fields. The evolutionary algorithms are the dominant domain of metaheuristic optimization algorithms, which are generally adopted for solving those complex problems, which are difficult to solve analytically. Researchers, to obtain optimized parametric values in various machining processes, have used other conventional optimization methods as the response surface methodology (RSM),8–10 grey relational analysis (GRA), 11 artificial neural network (ANN) 12 and Taguchi’s methodology (TM).13,14 Apart from these, the genetic algorithm (GA) 15 and particle swarm optimization16,17 have also achieved a huge reputation for solving complex industrial problems. A newer optimization evolutionary algorithm, that is, bees algorithm (BA), 18 is designed to replicate the scavenging nature of a swarm of honey bees. This algorithm works on nearby search pooled with the global investigative search. During the search procedure, the uniform random search is implemented in both search domains. In a global search, scout bees from different areas detect the target results. In nearby search, supporter bees are employed for spots bees identified as scout bees, generating further encouraging endeavoring observed spots. The BA is usually used in various domains like neural network, 19 job scheduling 20 and timetabling difficulties 21 . Along with the BA, an alternative evolutionary algorithm, that is, differential evolution (DE), has emerged as a novel algorithm based on GA. 22 It is a bionic intelligent algorithm, which works on simulation of natural evolution mechanism. The prime objective is to generate a momentary discrete variance within inhabitants and then arbitrarily reorganize inhabitants evolutionarily. This algorithm has been successfully implemented within various optimization processes like monopoles antenna, 23 image classification 24 and neural networks 25 . Some of the earlier published articles in the domain of optimization have been tabulated in Table 1.
Literature associated with optimization of machining process.
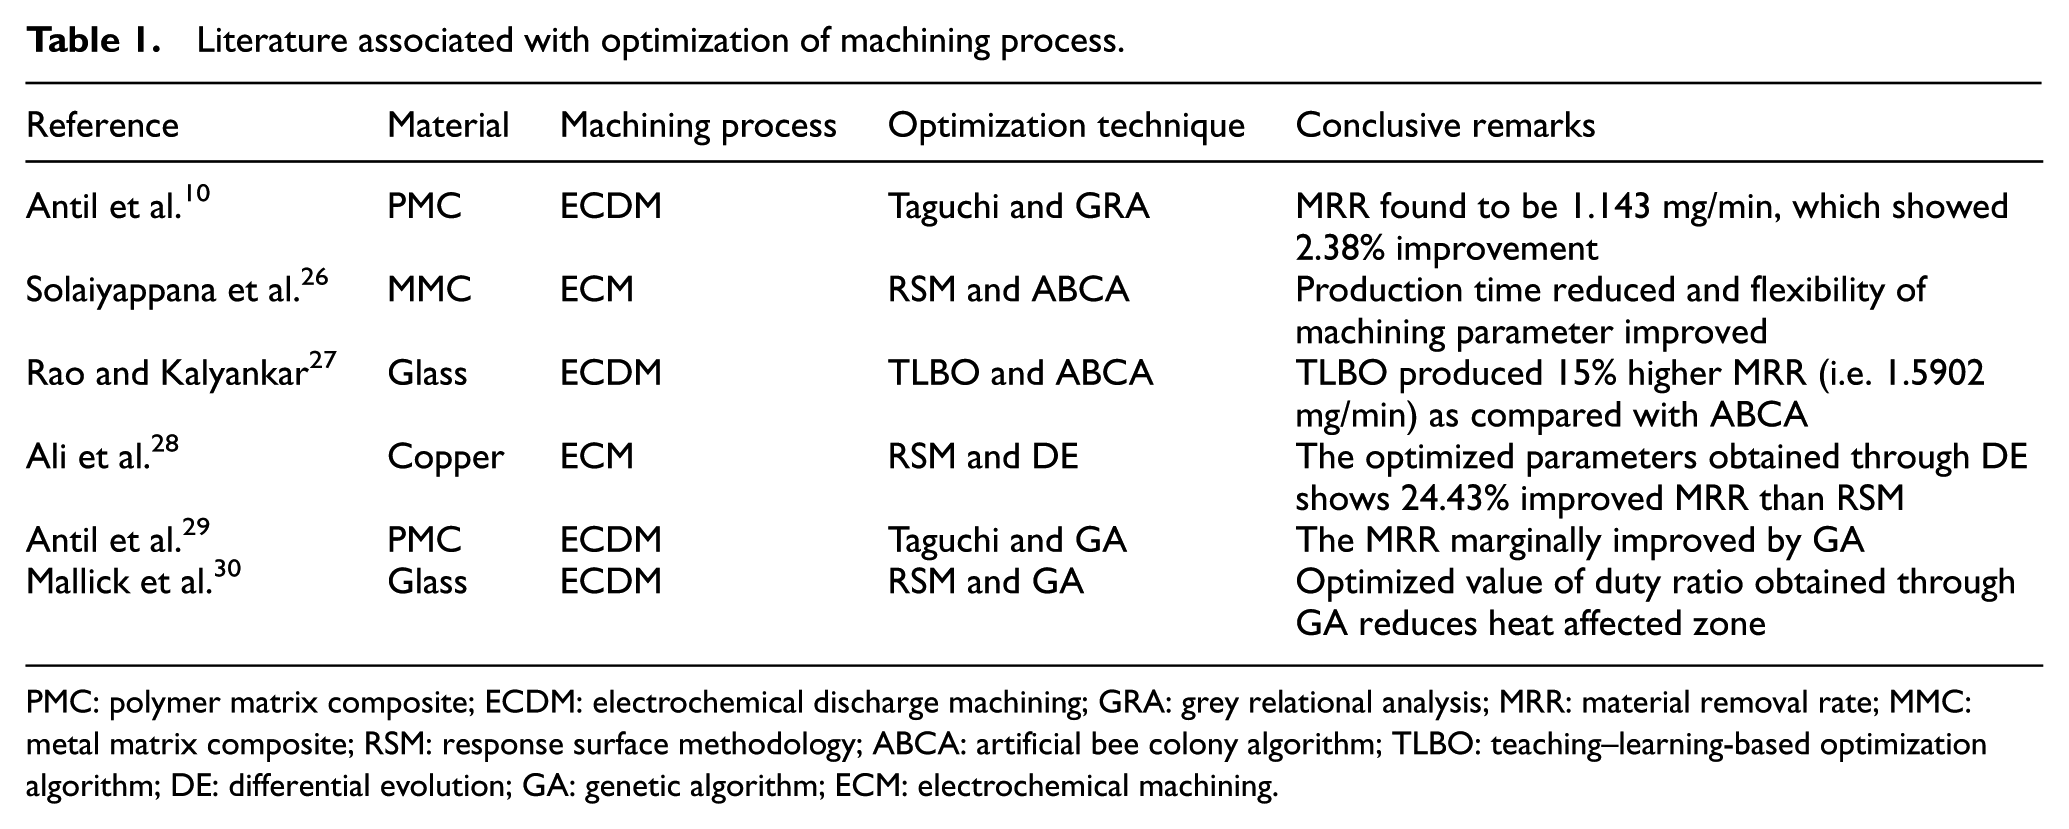
PMC: polymer matrix composite; ECDM: electrochemical discharge machining; GRA: grey relational analysis; MRR: material removal rate; MMC: metal matrix composite; RSM: response surface methodology; ABCA: artificial bee colony algorithm; TLBO: teaching–learning-based optimization algorithm; DE: differential evolution; GA: genetic algorithm; ECM: electrochemical machining.
This research work focuses on metaheuristic optimization approach aiming to improve the process parameters of ECDM for producing an enhanced material removal rate (MRR) by coupling TM with the evolutionary algorithms, that is, BA and DE. The regression equation obtained from Taguchi’s analysis was implemented in a MATLAB routine for further optimization through BA and DE to achieve a proper parametric value for ECDM of polymer matrix composites (PMCs).
Strategy formulation
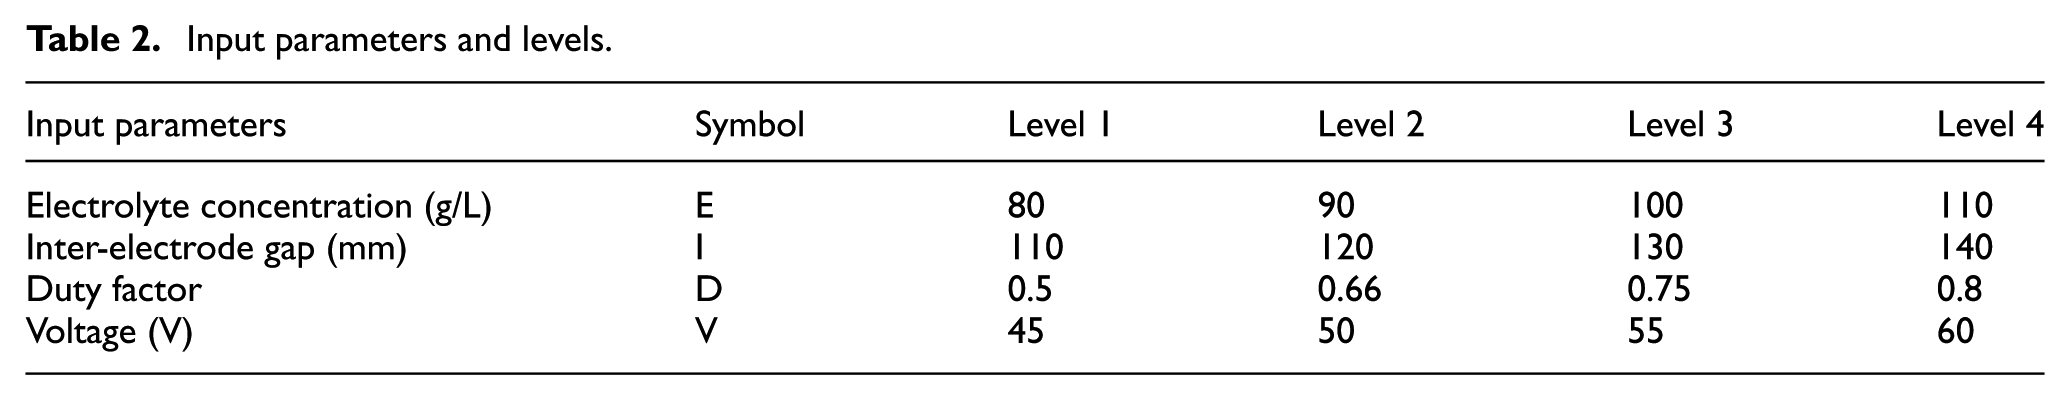
The components used in industrial applications need proper drilling actions for holding purposes. The accurate drilling in fibrous composites is evidenced as a crucial constraint in the component’s operational behavior. This survey proposes a robust investigation to overcome the concerns when it is considered under the evaluation machinability of silicon carbide particle (SiCp)/glass fiber–reinforced PMCs. The experimental protocol follows a design of experiments strategy resulting from an L16 orthogonal array. The levels of input parameters used in the investigation are indicated in Table 2. To increase the outcomes robustness of this work, some optimization algorithms were engaged to detect the process parameters on the MRR. Therefore, a BA and DE were projected.
Input parameters and levels.
Material and experiments
The samples produced from SiCp/glass fiber–reinforced PMC was employed in the experiment. The Araldite epoxy resin was implemented as a matrix, whereas two types of glass fiber mats, that is, S glass and E glass, were used as reinforcements. The SiC particles of 99.5% purity with sizes around 37 microns were mixed in the matrix to act as secondary reinforcement. The composite was fabricated using hand layup process, and the detailed procedure was explained in previously published research. 1 The experimental work was carried out using an ECDM that incorporated a robust setup depicted in Figure 1.
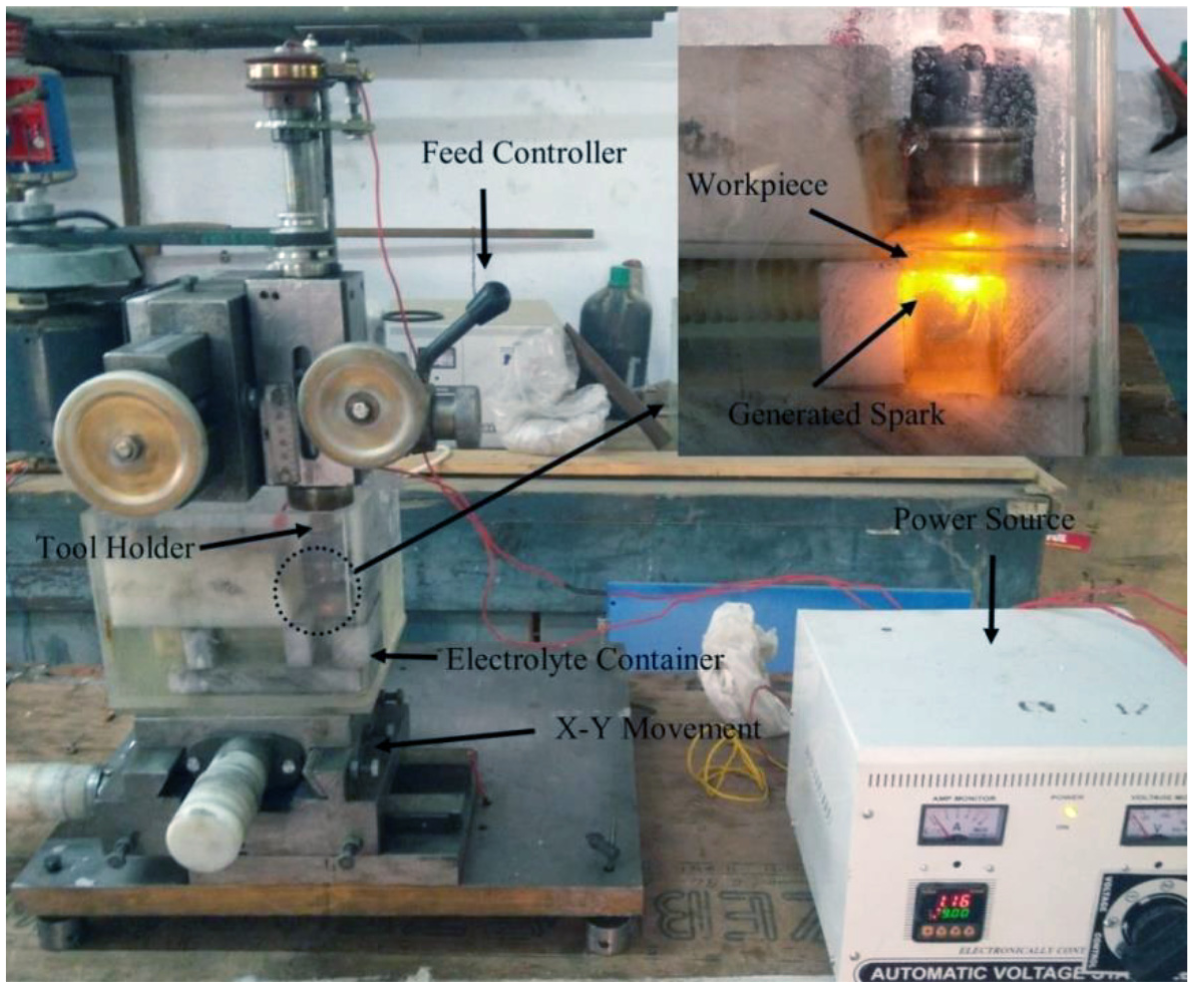
Electrochemical discharge machining setup. 31
The recommendation, from the state of art, available in this domain highlights the main parameters that potentially generate an impact in the process capabilities on the ECDM routine, which are as follows: the main voltage, electrolyte concentration (EC), inter-electrode gap (IEG), pulse on and pulse off. In this respect, this research uses the voltage figures, EC and IEG as the independent routine parameters, and pulse on and pulse off were coupled and used as fourth parameters named duty factor (DF). The range of process parameters was selected on the basis of outcomes from the pilot study31–33 and taken as voltage (45–60 V), IEG (110–140 mm), DF (0.5–0.8) and electrolytic concentration (80–110 g/L). Sodium hydroxide is employed in the experiment as an electrolyte solution. The numerical quantity of the MRR (mg/min) was detected as a response parameter. New samples of a hardened steel needle having 0.5-mm diameter were engaged in the tool electrode.
TM
TM was applied to optimize the quality of the output characteristics influenced by multiple process parameters. 34 TM helps in obtaining a well-adjusted combination of experiments and also helps to make the experimental design easy and well-organized. In this work, the L16 orthogonal array was employed to analyze the relevant optimum performance of the input parameters. The quality of deviation present in output quality characteristics (OQCs) is represented by signal to noise ratio, which depends upon the objective of OQCs. The obtained experimental results for the response parameters are depicted in Table 3.
Experimental results for OQCs.
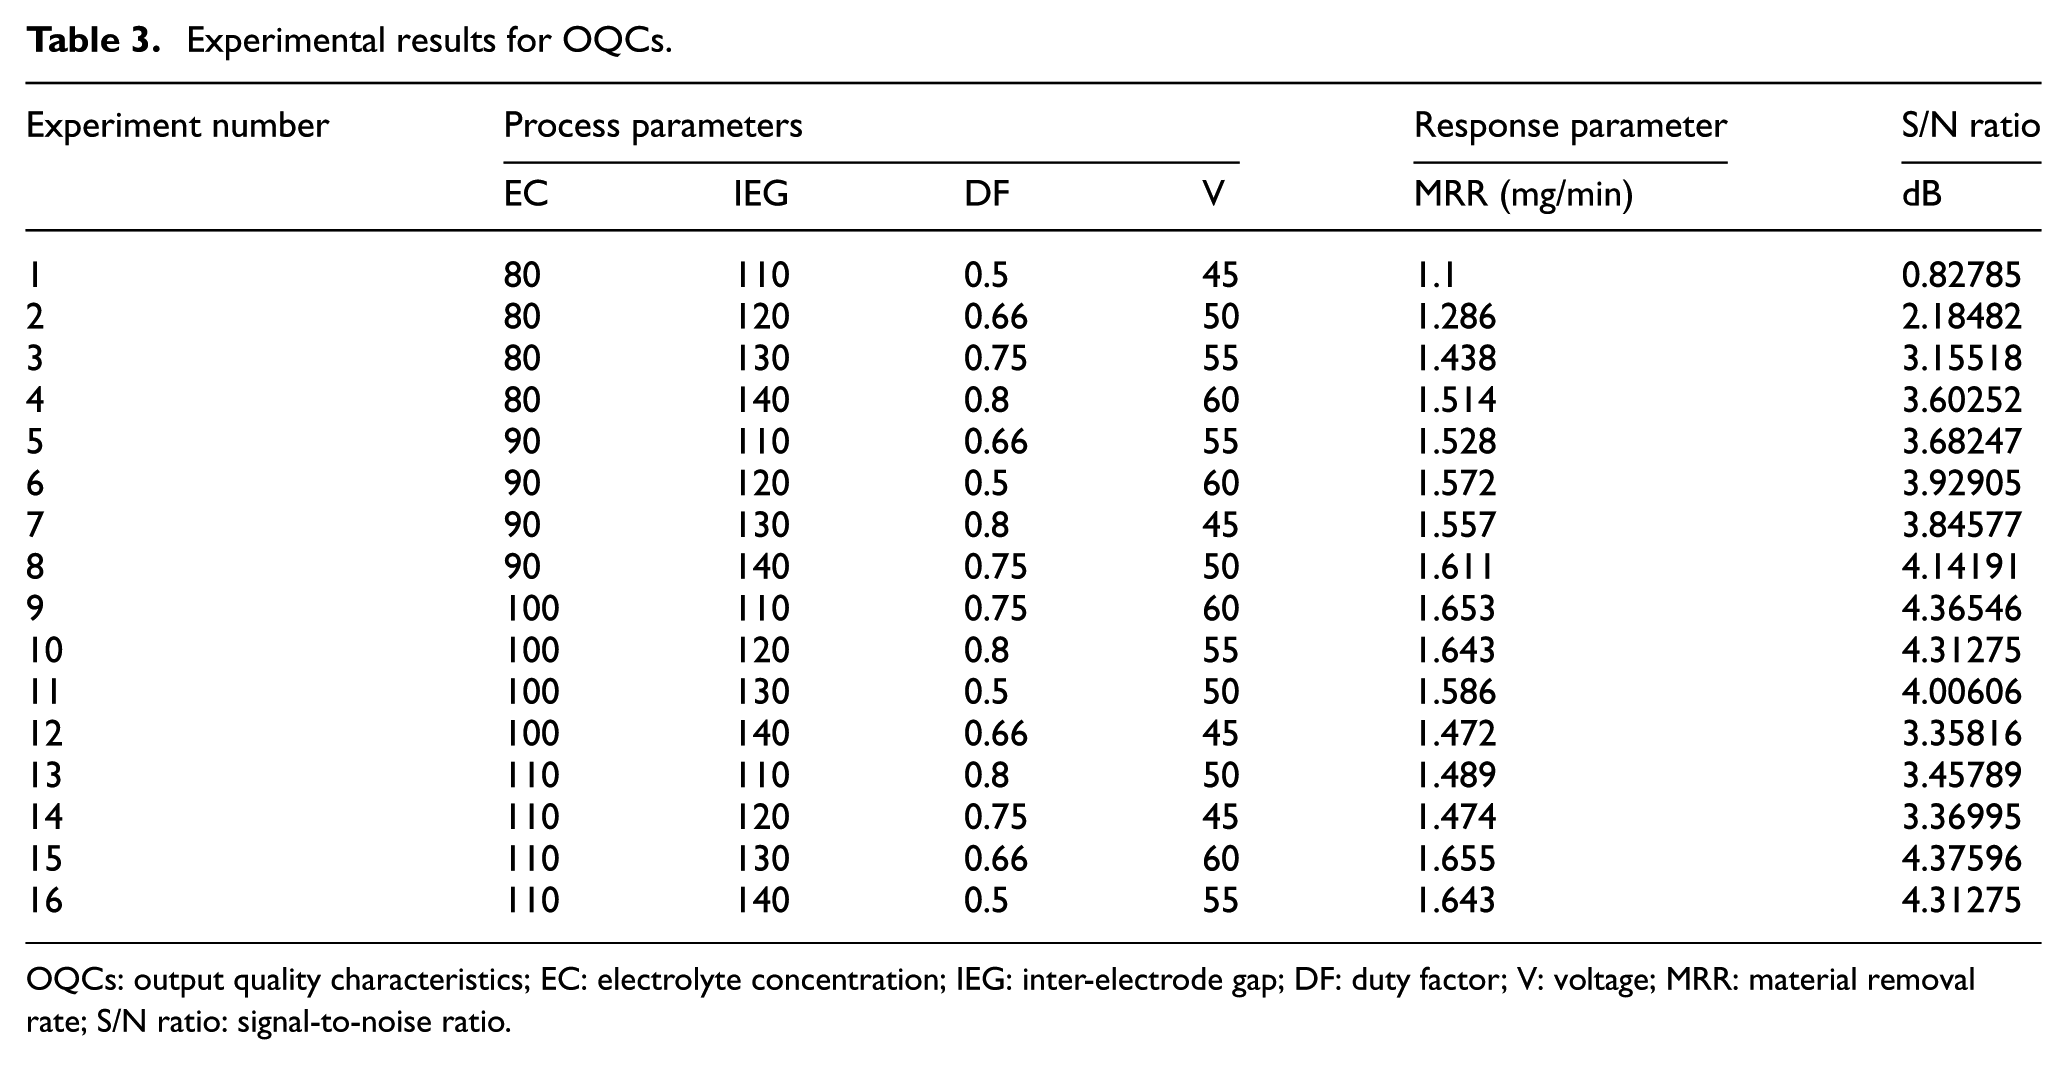
OQCs: output quality characteristics; EC: electrolyte concentration; IEG: inter-electrode gap; DF: duty factor; V: voltage; MRR: material removal rate; S/N ratio: signal-to-noise ratio.
Analysis of variance and signal-to-noise ratio
Using analysis of variance (ANOVA), performing careful investigation related to the influence of input parameters on OQCs was possible, as is depicted in Table 4. The significant parameters obtained when investigating the mechanism of MRR are sorted out comparing the process parameters, namely, EC, IEG and voltage.
ANOVA for MRR.
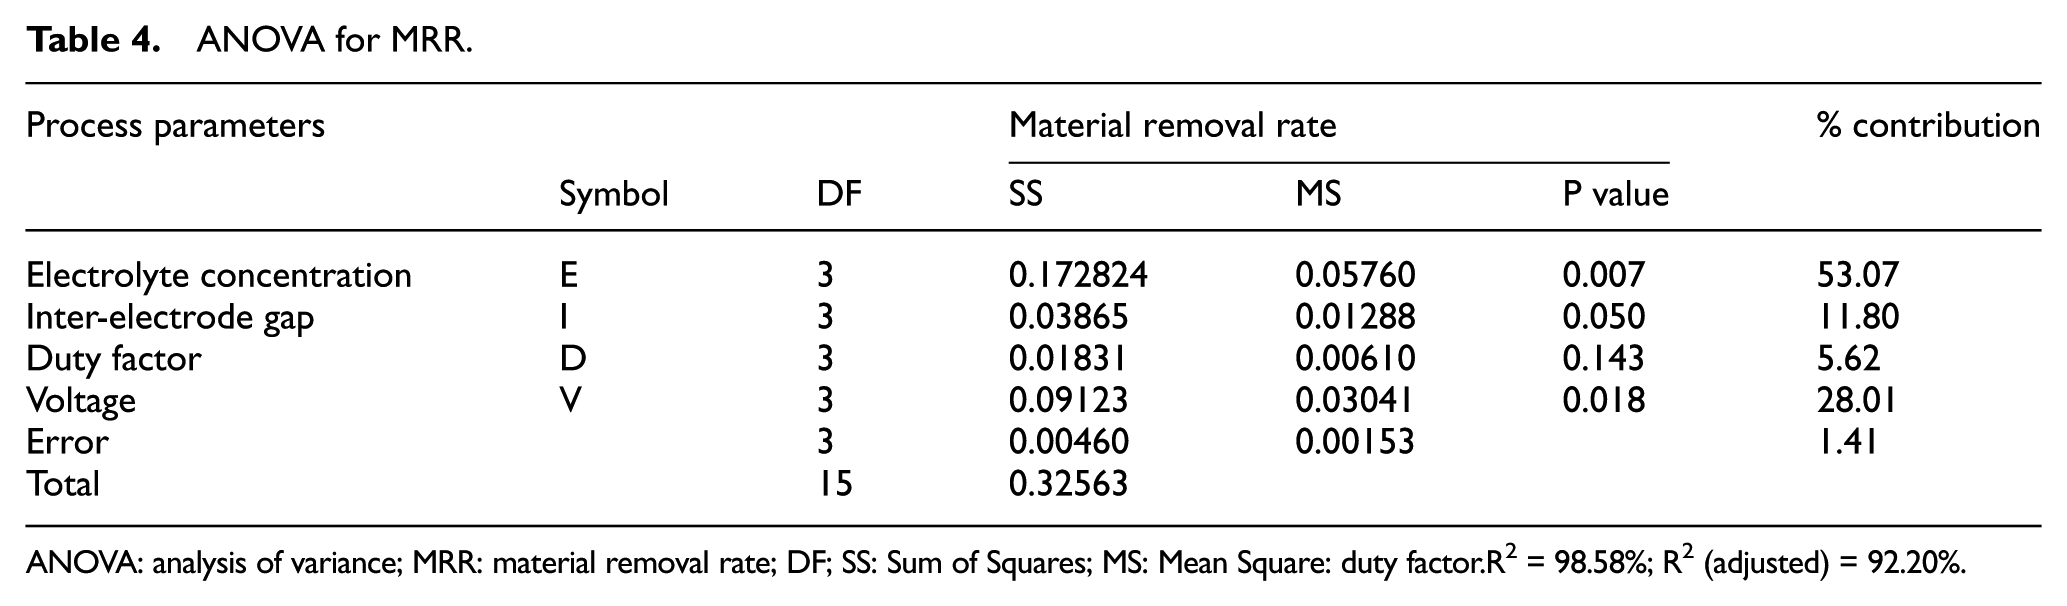
ANOVA: analysis of variance; MRR: material removal rate; DF; SS: Sum of Squares; MS: Mean Square: duty factor.
R2 = 98.58%; R2 (adjusted) = 92.20%.
Out of these three significant parameters, EC seems the most critical parameter followed by the voltage; they are having a high amount of percentage contribution at 53.07% and 28.01%, respectively. By keeping the higher the better approach for evaluating MRR, the results were obtained using following relation
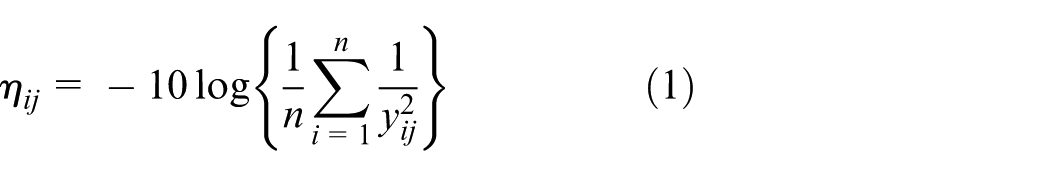
Figure 2 shows the signal against the noise (S/N ratio) during the evaluation of MRR.
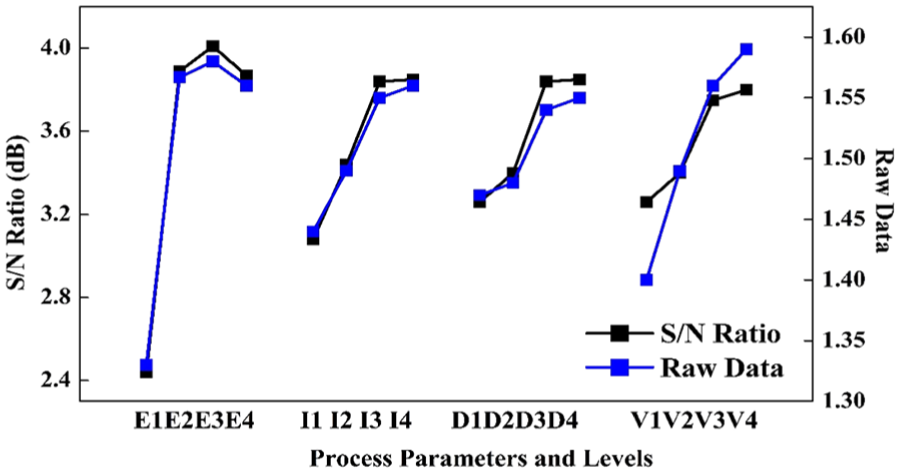
S/N ratio for MRR.
Details of Figure 2 highlight a rise in the level of EC from E1 to E2 while the MRR increases. But at the higher level, that is, from E2 to E3, the MRR increases at the relatively slow rate. Starting from level E3 to E4, a slight decrease in MRR is observed.
The fundamental cause for this behavior at greater concentration is due to the incremental unit of suspension productivity at the high level of concentration, which needs to be slightly decreased to obtain better results under small concentration. 35 The amount of MRR increases once an increase within the inter-electrode up to level I3 is generated; but at a higher level of I4, the MRR displays a decreasing trend. The reason behind this trend is the variation in spark-affected zone (SAZ).
Therefore, an increase in inter-electrode resistance is shown due to a reduction in SAZ caused by the enlarged gap between electrodes. 36 The plots for the DF also show a kind of mixed behavior at higher levels. From level D1 to D2, the MRR shows a slow increase in the material removal process; but in the phase of D2 to D3, the spark is produced at workpiece surface for longer duration and results in higher amount of material removal. However, at level D4, the removed material is not completely flushed out and reduces the rate of material removal from the work piece surface. The voltage also significantly influences the MRR. The MRR rises with a rise in the level of voltage as it helps in increasing the spark generation within the spark zone. 37 The observation demonstrated that when an increase in the level of voltage is produced, it allows increases in the MRR. The rise in the voltage values allows increases in the MRR, mainly because as long as the voltage increases, it permits generating a higher rate of spark formation within the spark zone. 38 The obtained observations for the MRR with variation in the process parameters clearly indicate that voltage, EC and IEG are the most significant parameters for the MRR. The optimal parametric combination for Taguchi’s methodology was obtained as E2I4D3V4, that is, EC (90 g/L), IEG (140 mm), DF (0.75), and voltage (60 V).
BA versus DE
BA mimics the joint exploration and exploitation for the foraging process. The algorithm incorporates the simultaneous execution of both local and global search in each search cycle. Honeybees perform long flights to search for the nectar/pollen from the flowers. These flights are random and can be multi-directional and with a dedicated group of bees searching for new flower sources. The swarm of bees perform flights over the distance to fetch the nectar/pollen from the flowers. These flights can be extended; some may extend up to 14 km. 39 Scout bees constitute the small fraction of the total population and perform the task of searching for new flower sources. These bees perform random flights in search of new flower sources close to the hive. Once the scouts are returning to their hive, they share the food and communicate the cost of the flight, that is, energy used in the search for the food source, with the hive. The scout bees with the most profitable food source perform waggle dance on a dedicated location of the hive known as dance floor. 40 The waggle dance allows communicating the coordinate for the food source location with idle onlookers, which join the search process. The dance period marks the fitness/profitability of the food source. Thus, more foragers will join a harvesting process and collect food from the most profitable flowers. The dance is performed after each search, and as long as the flower is marked as profitable, the process continues, else the scouts begin the search for newer food sources.
The algorithm tries to find the best possible solution by mimicking the foraging process of bees. The solution to the problem is the food source, that is, the flower; the population comprises of n number of bees that perform flights to search for the food in the solution space. In each iteration/flight, a bee visits a flower and returns back to the hive, where it communicates the profitability of the flower, that is, the cost of the flight. The process continues until the best global solution can be produced, and a predefined stopping criterion is met. The flow diagram of a BA is depicted in Figure 3. 36
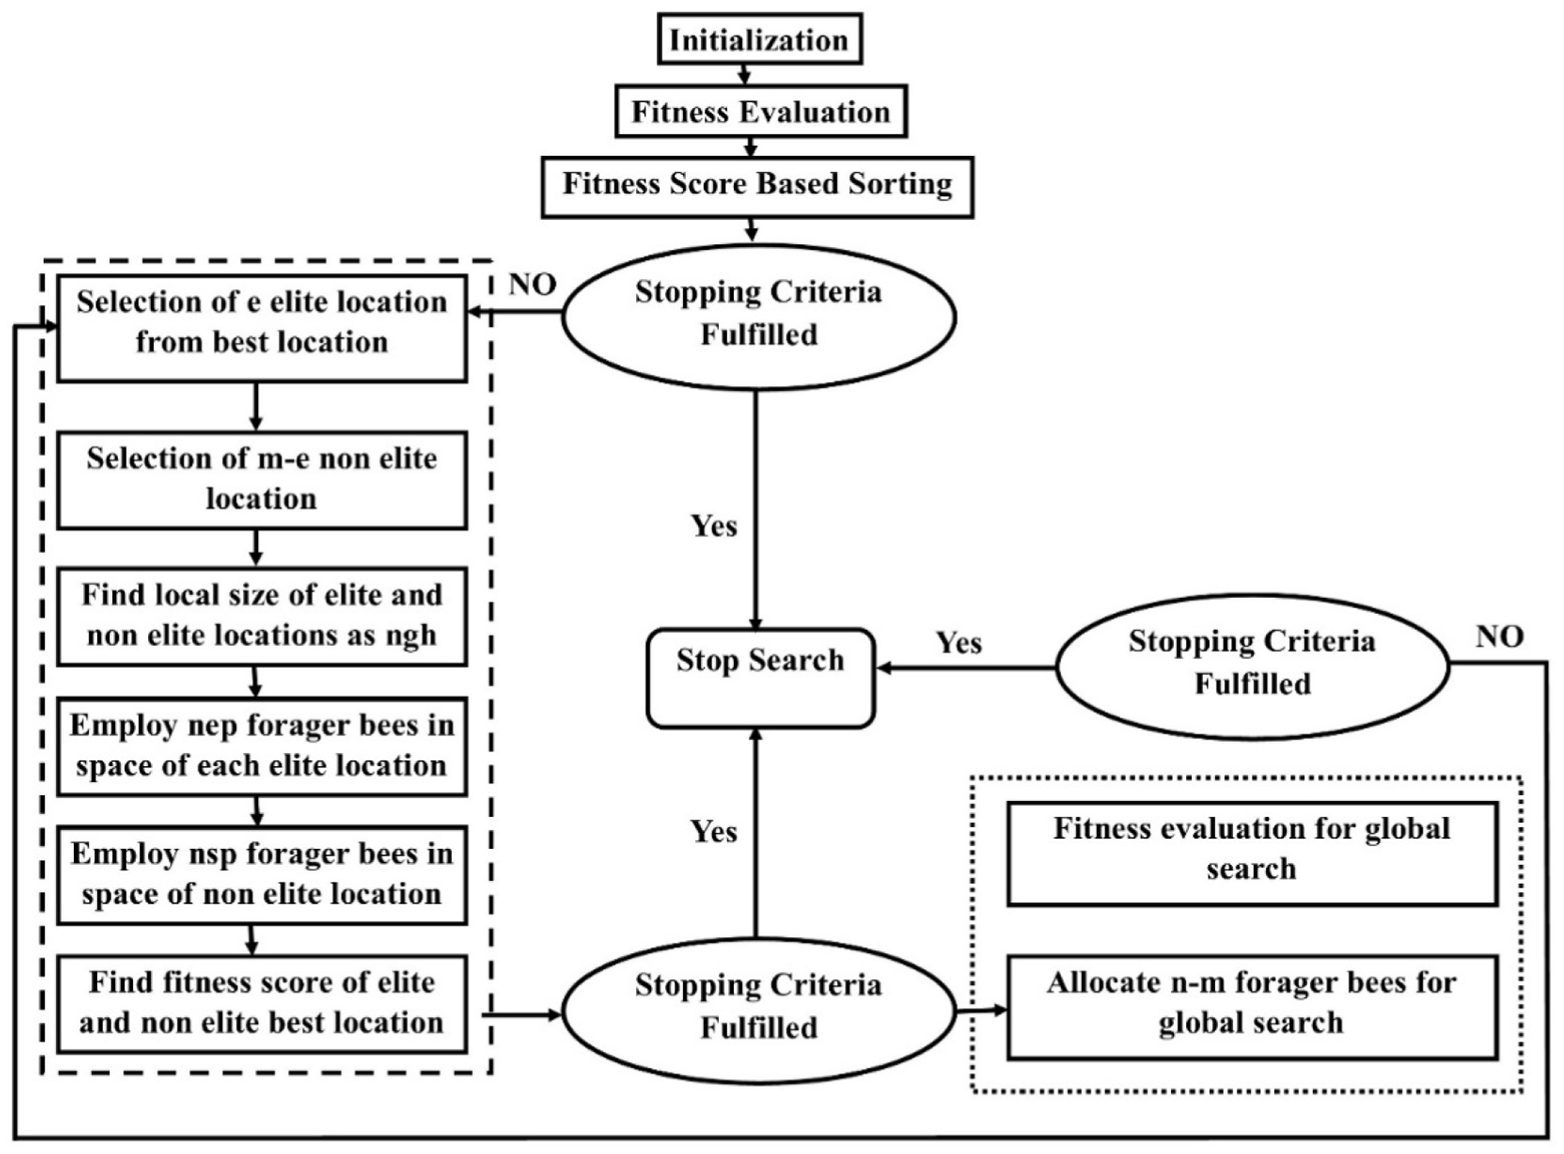
Flowchart of bees algorithm. 36
The pseudo code and the flowchart of the BA are shown below: 36
i = 0
Generate initial population n
Calculate Fitness Score for the preliminary population
Categorize the population centred from preliminary Fitness Score
Whereas i ≤ MaxIter or Fitness Valuei– FitnessValuei−1≤ Error
i = i+ 1
First-rate of an Elite Patches and Non-Elite Finest Patches of a locality search.
Employ the Forager bees to the Elite Patches and Non-Elite Best Patches.
Calculate Fitness Score for individual Patch.
Categorize their outcomes centred on Fitness Score.
Assign the remaining bees for the Universal Search to the Non-Best Locations.
Calculate Fitness Score of individual Non-Best Patches.
Categorize the population centred on Fitness Score.
Perform the algorithm until the Stopping Criteria is encountered.
DE
DE was primarily introduced by Storm et al. as a stochastic population-based optimization algorithm demonstrating successful potential to solve complex problems in engineering, operation research, statistics, finance and many other fields. DE is described as an evolutional algorithm structured on the related operators of a GA, like crossover, transformation and selection. DE can find solutions to several diverse and difficult optimization problems which are non-differentiable, non-continuous, non-linear, noisy, flat, multi-model and many more. The robustness of DE requires less computational resources and implies only a few control variables. Thus, it will be much faster and produces good convergence rate to a solution that can be obtained in a short amount of time. Figure 4 illustrates a flow chart indicating the main structure for the DE model. To generate a better solution, DE depends on the mutation operator, whereas GA depends upon crossover. In DE, the mutation operator is used for the search and assortment of the universal solution in the exploration domain. To generate improved results, dispersed crossover among the parentages introduces diversity in the solutions by intermixing the successful combinations. The DE with jitter is employed in this research investigation.
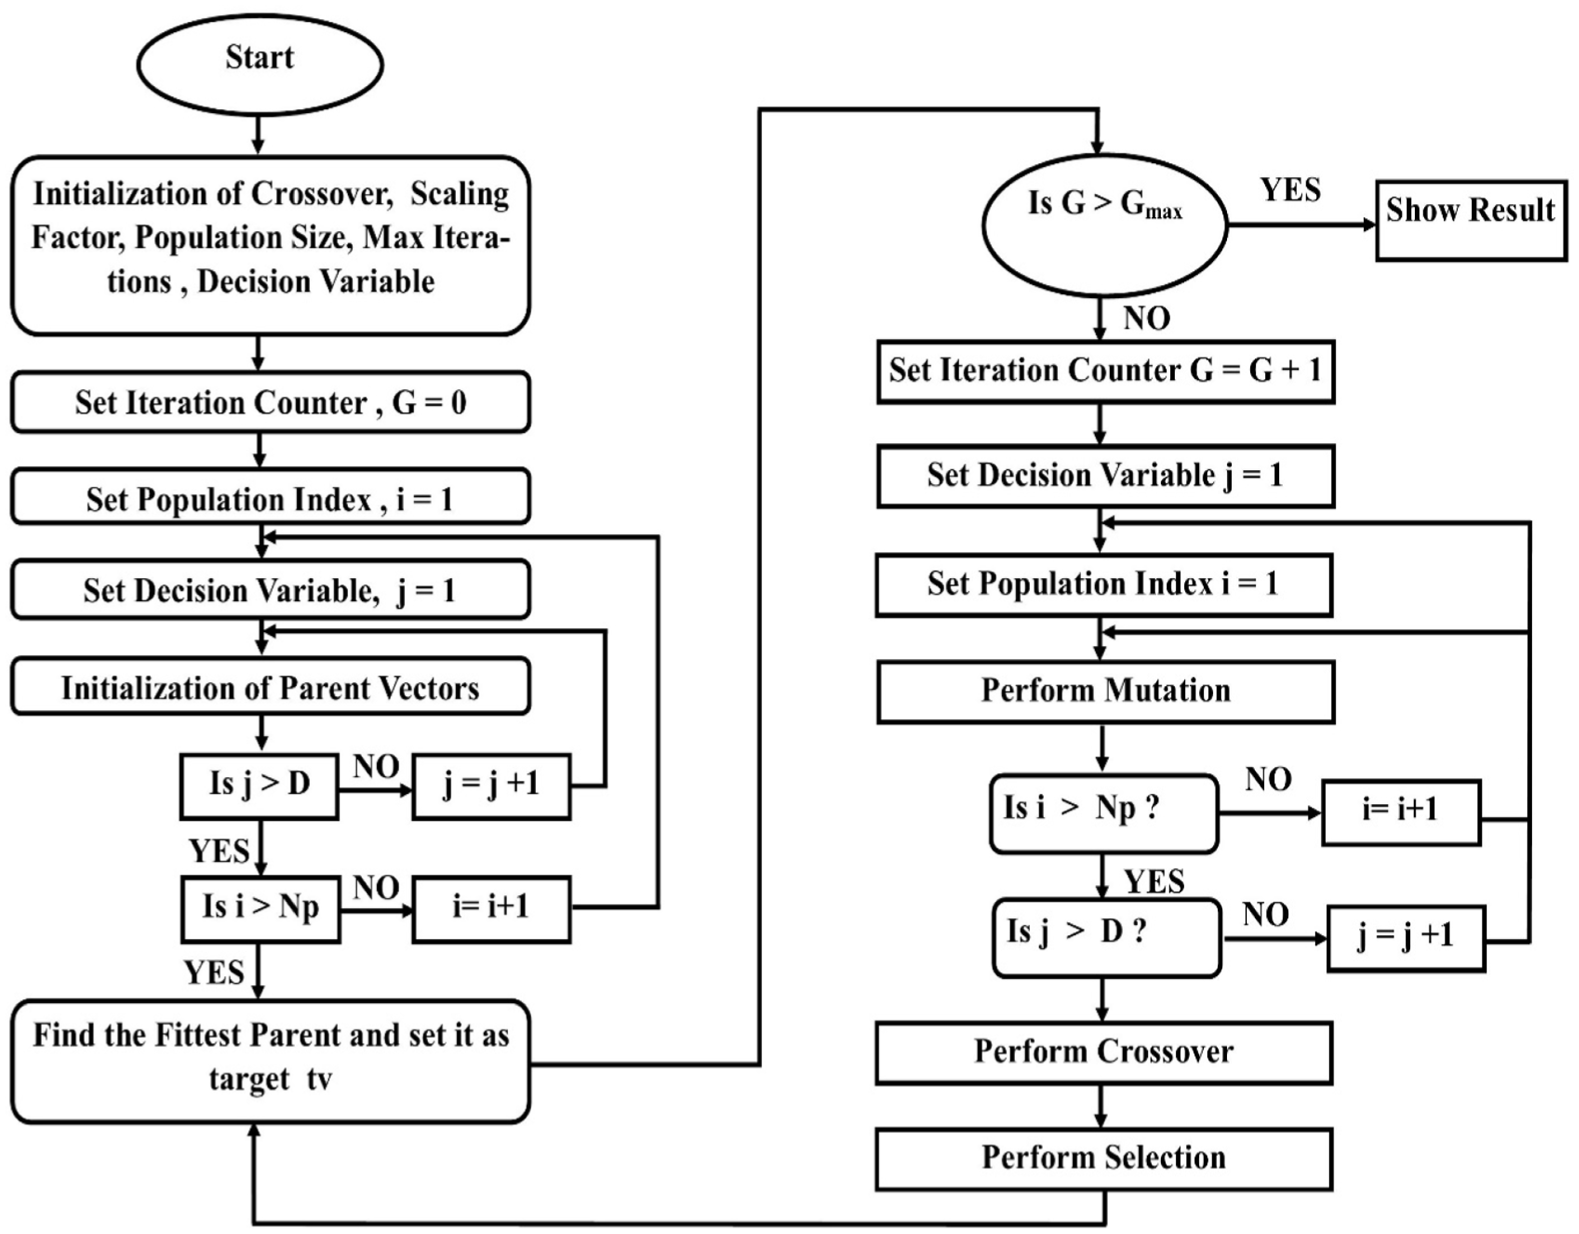
Flowchart of differential evolution algorithm.
Transformation
The target vector for each xi,G transformation vector is generated using the following equation
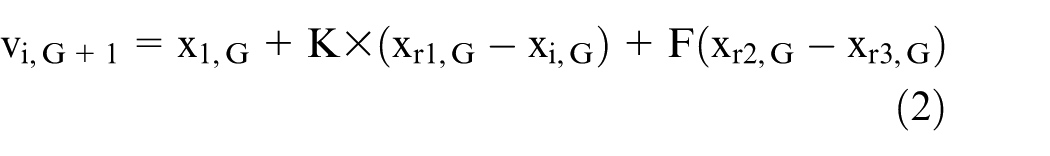
where i, r1, r2, r3 {1, 2,…,NP} are randomly generated and are all different. F is the scaling factor, and K is a combination factor. 41
Crossover
A trial vector uji,G+1 was generated by crossing over the chosen parent with the mutated vector and is given mathematically as
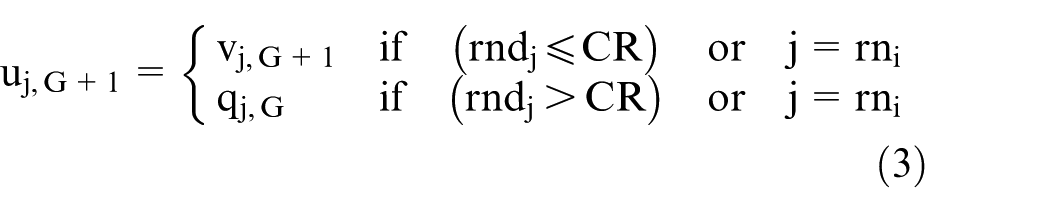
where j = 1, 2, D; random vector rj[0, 1]; constant crossover CR[0, 1]; and randomly chosen index rni (1, 2,…,D).
Selection
Parents are selected from all the individuals in the search space, despite their potential value. Once the selection is performed, the mutation and some crossover operations are applied to generate the child. Then, the child’s fitness is compared with that of the parent, and the one with better fitness is selected for further iterations.
Optimal design of ECDM for a maximum MRR
The acceptability of advanced machining process depends on the ability to produce quick and precise results. As the ECDM routine is primarily dedicated to producing machining of nonconductive compounds/materials, the high rate of machining is a difficult task to be achieved. The present design aims at finding the optimal values of EC, IEG, DF and voltage such that maximum values of MRR are obtained. The regression equation for MRR is given as
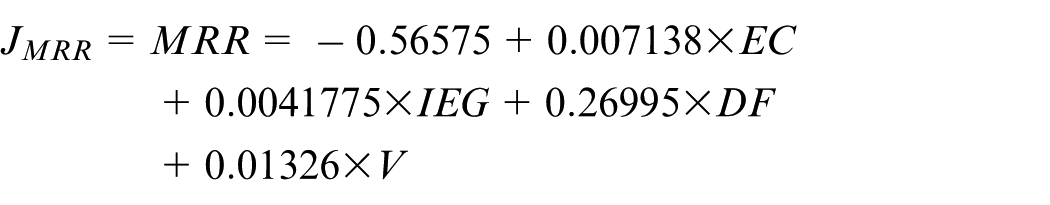
where EC is the electrolyte concentration, IEG is the inter-electrode gap, DF is the duty factor and V is the voltage. A nominal optimization problem is formulated as:
Find [EC, IEG, DF, V] which maximizes MRR,
Subject to,
80 ≤ EC ≤ 110
110 ≤ EC ≤ 140
0.5 ≤ EC ≤ 0.8
45 ≤ EC ≤ 60
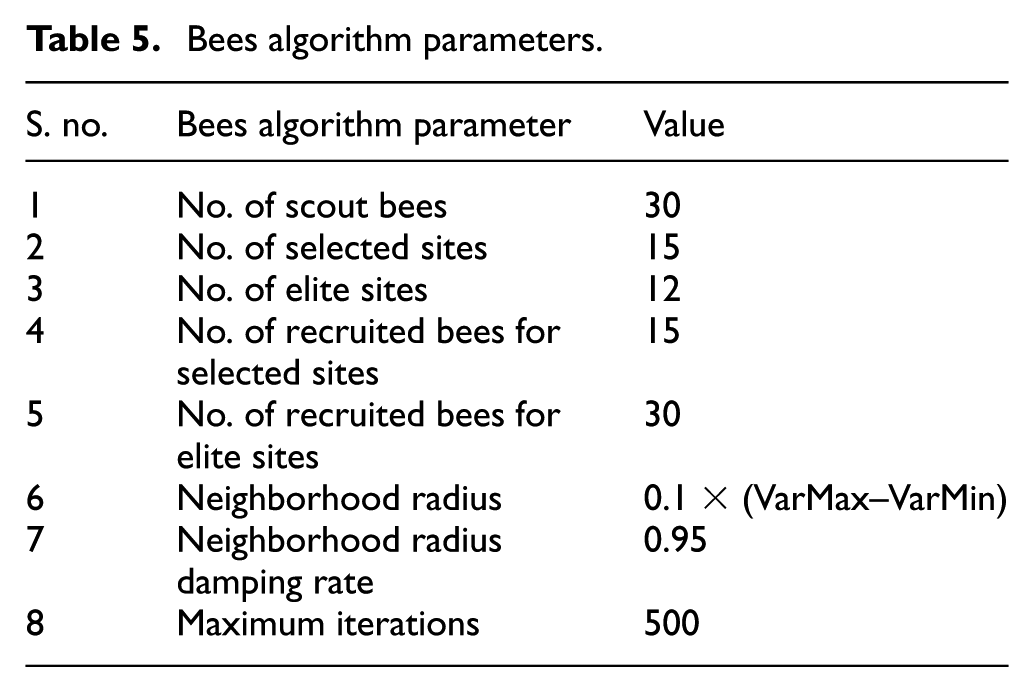
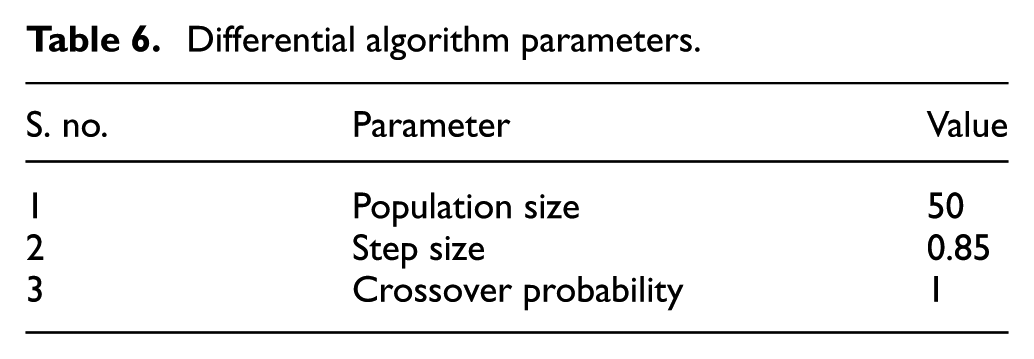
The optimization has been carried out in MATLAB 17. The BA- and DE-specific parameters used in the optimization are given in Tables 5 and 6, respectively.
Bees algorithm parameters.
Differential algorithm parameters.
Using the parametric values shown in Tables 5 and 6, the optimization was carried out for the BA and DE, respectively. After running the optimization test, the following values of MRR were obtained as shown in Table 7. The comparative analysis was performed by results obtained through TM, BA and DE. The optimized results for TM were obtained through optimal parametric combination generated by S/N ratio graph. Taguchi’s optimal parametric combination produces a better potential of MRR, that is, 1.658 mg/min, which has been improved in comparison to the results of orthogonal array experimental design.
Comparative analysis of obtained results.
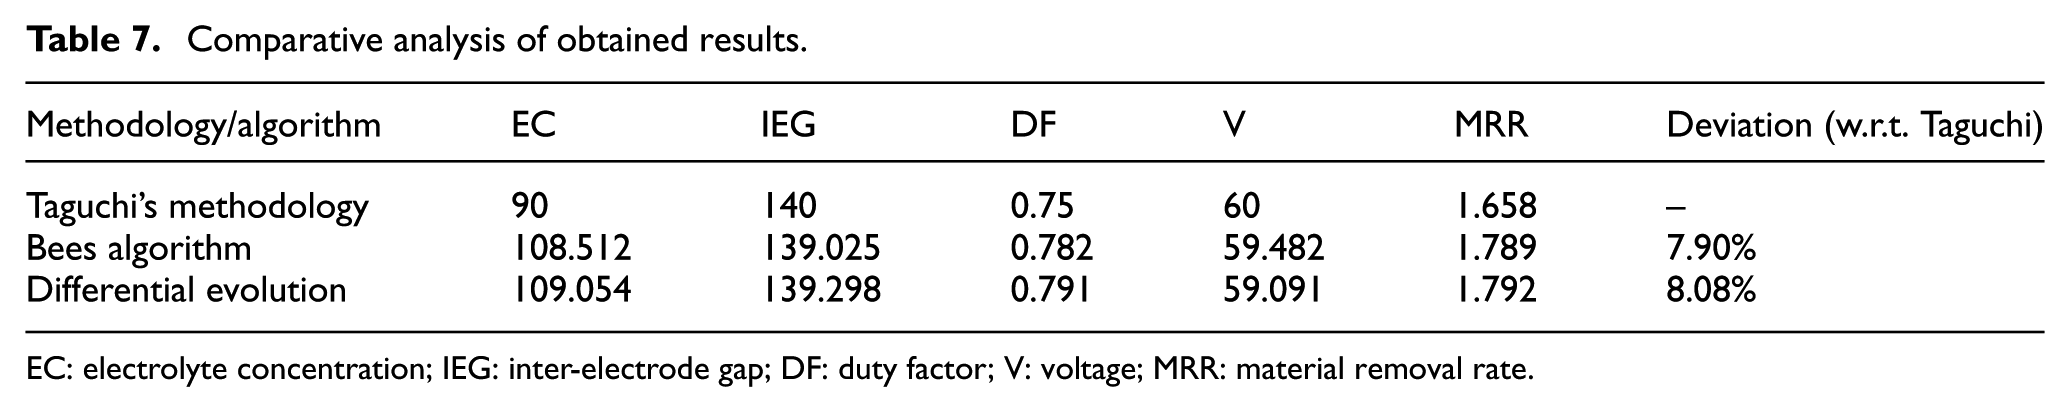
EC: electrolyte concentration; IEG: inter-electrode gap; DF: duty factor; V: voltage; MRR: material removal rate.
Further optimization was undertaken using advanced regression equation in BA and DE as per processing steps shown in flow charts. Using BA and DE, the MRR is obtained at 1.789 and 1.792 mg/min, respectively (Table 8). The results obtained through BA and DE showed 7.90% and 8.08% improvement in MRR during ECDM of SiCp/glass fiber–reinforced PMCs. The increase in the MRR (Figure 5) generates a greater potential in order to improve the MRR expectations, permitting a robust improvement in the machinability of these hard alloys, as is the machining of fibrous composite materials.
Comparative analysis of BA, DE, GA and SAA.
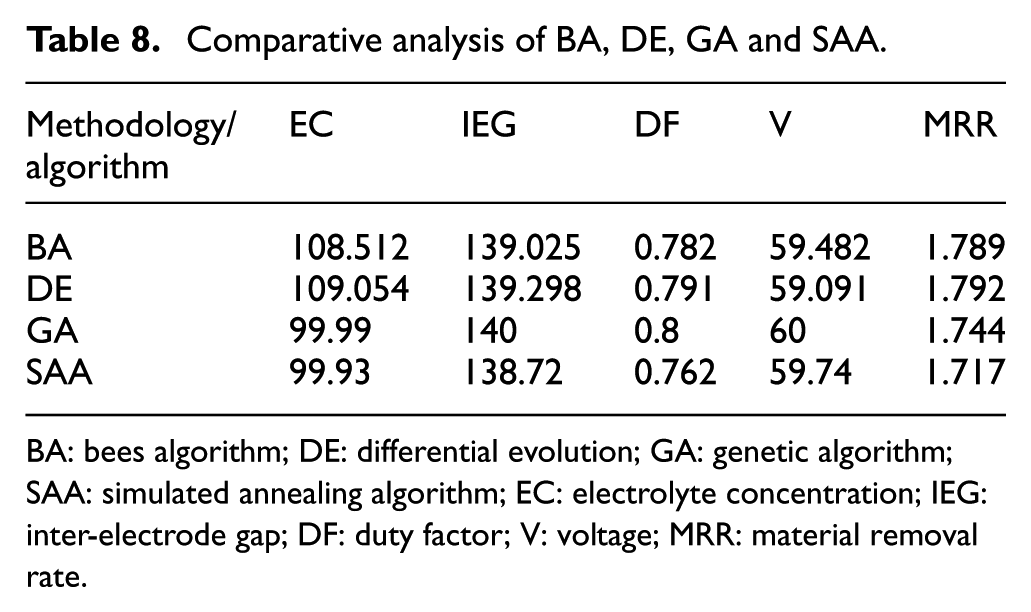
BA: bees algorithm; DE: differential evolution; GA: genetic algorithm; SAA: simulated annealing algorithm; EC: electrolyte concentration; IEG: inter-electrode gap; DF: duty factor; V: voltage; MRR: material removal rate.
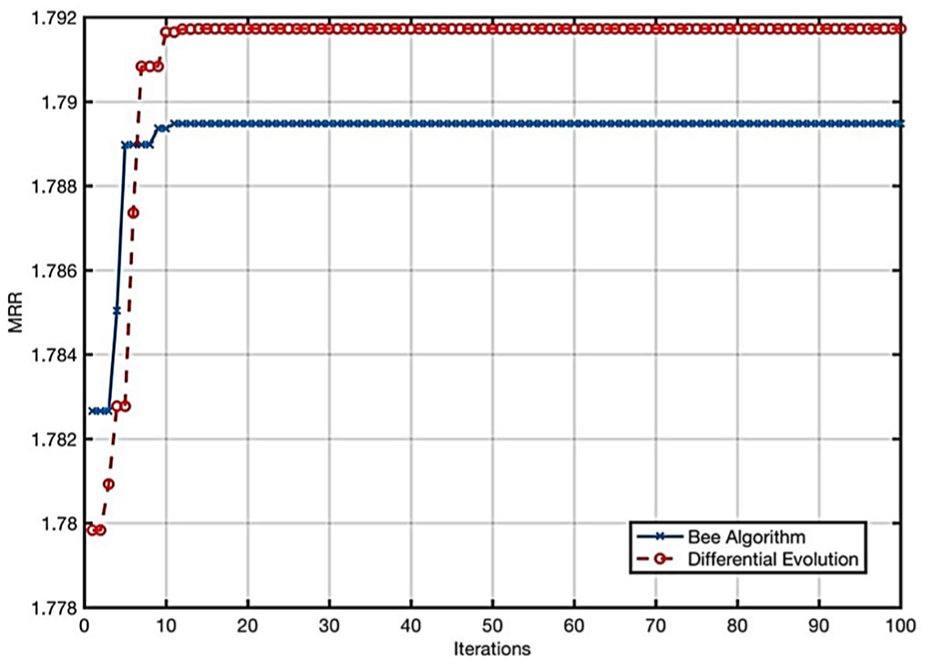
Convergence plot of DE and BA generated through MATLAB.
Keeping the same parameter and their level, the regression equation was run over GA and simulated annealing algorithm to compare the best optimized result obtained for each algorithm. The comparative analysis shows that DE produces best MRR as compared with other three algorithms.
Scanning electron microscopy analysis
The morphological investigation was performed for the pre- and post-machining analysis of composite surface. Figure 6(a) shows composite surface at 50× magnification. The scanning electron microscopy (SEM) shows nearly uniform surface all over the composite, whereas Figure 6(b) shows SEM of post-machining surface at 180× magnification.
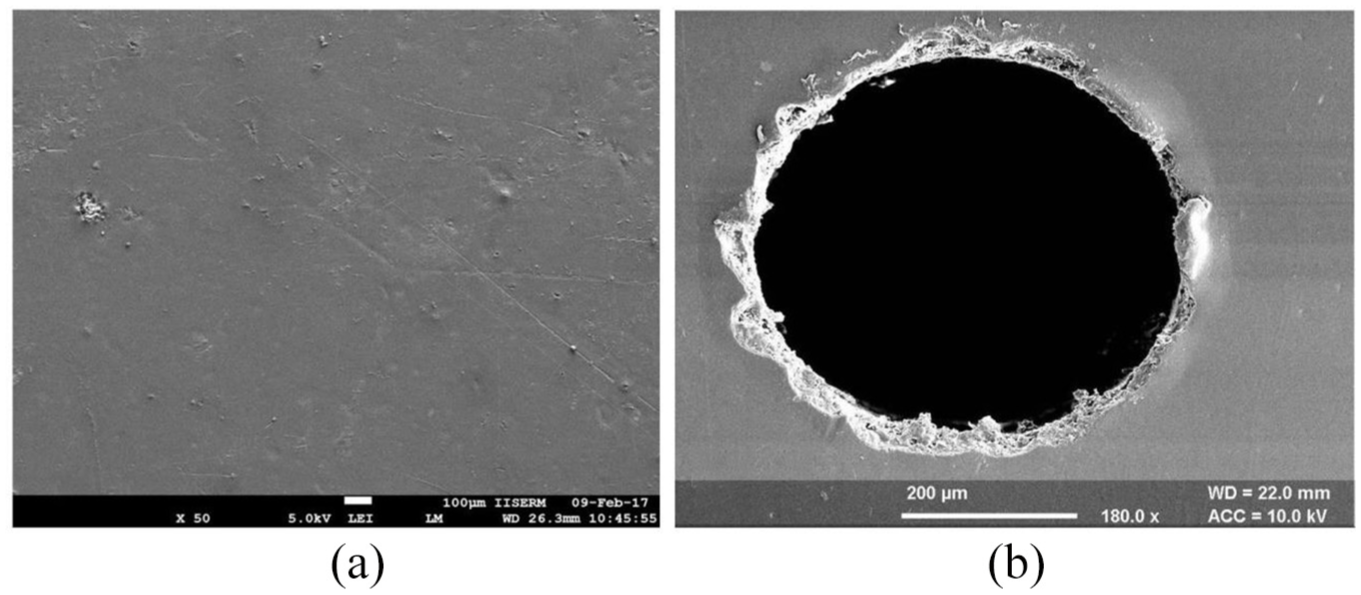
SEM of (a) composite surface before machining and (b) after ECDM process.
Conclusion
The polymer-based materials are classified in those difficult to machine materials, which produce the least machining rate. In this paper, some possibilities to produce a robust improvement of machining rate of SiCp/glass fiber–reinforced PMCs was analyzed during the ECDM process using the evolutionary algorithm. The conclusive remarks obtained from this research investigation are the following:
The potential of improving the manufacturing process by the ECDM strategy for a hard material as SiCp/glass fiber–reinforced PMCs was demonstrated successfully.
The MRR was optimized by TM, BA and DE methods to obtain a quantitative improvement.
The obtained results show that the DE approach produces 8.08% better MRR followed by BA, having 7.90% improvement as compared to TM.
The BA generates numerous trade-off solutions, whereas, in DE, the scale factor and cross factor has a crucial effect on performance regarding optimum solution and convergence ability.
The comparative study overview clearly demonstrated that the DE approach was a much better algorithm to be used as an optimization technique, having dominant comprehensive investigation capability and quicker convergence speed.
Footnotes
Declaration of conflicting interests
The author(s) declared no potential conflicts of interest with respect to the research, authorship and/or publication of this article.
Funding
The author(s) received no financial support for the research, authorship and/or publication of this article.