
Abstract
India has gradually increased its testing capacity of COVID-19 by mid-September 2020. However, the level of testing is substantially low in comparison with many high- and middle-income countries. Evidently, the pandemic in India is likely to be prolonged and affect millions in comparison to other countries, due to its huge population size. The possibility of a sudden upsurge of infections may turn overwhelming, jeopardising the health system, if an appropriate testing policy is not immediately adopted, given that the public health expenditure capacity of India has remained at a suboptimal level. Against this backdrop, a descriptive analysis has been carried out using the published data of the number of infections, tests and daily COVID-19 cases and public health expenditure data published by different sources and available in the public domain. The analysis suggests that a differential strategy is required to deal with the situation, which varies across states and depends upon the health spending capacity of individual states and their population size, among other factors. The specific strategy recommendations would be as follows. First, the testing rate should not be too high or too low, and this can be assessed using a marker: marginal return on testing. Second, India should follow the upper-middle-income-country standard in assessing the testing rate. Third, as a long-term strategy, there is a need to strengthen the public health system to avert a future catastrophe in the form of such pandemic.
Introduction
As of 15 September 2020, globally, 30 million people have been infected with the novel coronavirus disease (SARS-CoV-2, commonly known as COVID-19), with a death rate of 3.1%. In India, the total number of infected people as of the said date is more than 5 million, with a recovery rate and death rate of 79% and 1.6%, respectively, even after the imposition of a national lockdown from 24 March 2020 to 31 May 2020, in four phases. In India, five states, namely Maharashtra, Tamil Nadu, Andhra Pradesh, Karnataka and Uttar Pradesh, account for about 60% percent of the total infected people and are the worst affected states. If the states Delhi, West Bengal, Bihar, Telangana, Orissa and Assam are added to the list, then these 11 states together account for more than 80% of the total infections in India.
On 16 March 2020, the Director-General of the World Health Organization (WHO), in his opening remarks at a media briefing on COVID-19, emphasised an urgent ‘escalation in testing, isolation and contact tracing – as the backbone of the response’ and advocated for social distancing measures to reduce transmission and enable health systems to cope (WHO, 2020a). To reduce the burden of COVID-19, Government of India imposed a lockdown of the country on 25 March 2020, which was extended later till 31 May 2020 through four phases with varying levels of relaxations. The effect of the lockdown is seen to be insubstantial, as the number of new cases has been surging continuously. A study carried out by Husain et al. (2020) in the month of May concluded that the lockdown had reduced the number of COVID-19 cases by 23.65–337.73 lakh in Class I cities and towns, when COVID-19 was primarily found to be spreading in the cities and towns, and averted about 0.01–0.10 lakh deaths. However, this lockdown has not only destabilised the economy but also shattered the poor health system of the country in the form of disruption of various health-related services, which is expected to have long-term effects on the demographic rates. A study conducted by Ghosh et al. (2020) in August reveals that the disruption of health services would have a major effect in enhancing unintended pregnancy and under-five mortality rates in the states with poor health infrastructure. The study further argues that such disruption of services might destabilise the process of demographic transition, particularly in the states that are in the second stage of demographic transition characterised by high fertility and high under-five mortality.
Almost since the beginning of the pandemic, WHO has emphasised increasing the level of testing in all countries for early identification and early treatment (WHO, 2020). However, no optimum level of testing (for instance, number of tests per million people in a country or region) was defined by WHO initially; only later, on 12 May 2020, did WHO set the daily-testing benchmark of 140 per million (WHO, 2020b).
It may be noted that as on 30 May, 2020, that is, within 2–3 months of the pandemic, the United States, contributing 4.3% of the global population, was able to achieve a testing rate of 51,168 per million people. Similarly, Russia, which accounts for 1.9% of the world population, achieved a testing rate of 72,931 per million, while Bahrain, constituting only 0.02% of the world population, recorded the highest testing rate of 186,184 per million. After about 9–10 months of the epidemic (as on 15 September 2020), the testing rate increased to 119,605 per million globally. In the United States, it increased to 305,275 per million, and in Russia, it stood at 288,453 per million. As of mid-September 2020, the United Arab Emirates (UAE), one of the least affected countries, achieved the global highest testing rate of 855,877 per million people, followed by Bahrain with 764,682 tests per million.
In India, which accounts for 17.9% of the global population, the testing rate was abysmally low as on 30 May 2020—only 2,708 tests were carried out per million population. Though the testing rate in India has increased by almost nine times in recent times, it still remains as low as 23,668 tests per million people. One can estimate that if India performs as many tests as conducted on 21 August 2020 every day in the month of September, it would have tested around 5.5% of its population. However, the benchmark prescribed by WHO is a ‘woefully inadequate number’, particularly given the population size of Indian states. For instance, it prescribes to carry out a mere 14,000 tests every day for a state with a population of 100 million. Starting from 0, it would require 286 days to cover 4% of the population of the state (Sukumar, 2020). Moreover, India’s testing rates vary widely across regions. As on 15 September 2020, Delhi had tested 133,845 people per million of its population, whereas the testing rate was only 23,699 per million in the case of Madhya Pradesh.
According to Reddy (2020), the trend of infected cases in any region or country must be seen in comparison to the number of people tested per day. Ghosh and Qadeer (2020) have noted that, in India, daily detection of infected cases closely corresponds to the number of people tested daily, which is in congruence with other countries during the relatively early phase of the disease spread. The study further rightly argues that only when the number of new infections detected daily declines without a corresponding decline in daily testing can it be asserted that the spread of disease has been slowed down in that region or country. Such relationship was witnessed in South Korea and New Zealand. In India, between April and September, though the testing rate increased significantly, there has been substantial variation in the case positivity rate (new infections in per-day testing). For the country as a whole, it was 6% till mid-August and reduced to 2% by 15 September, but in the case of Maharashtra, it increased from 10% in May to around 20% in July, and this rate continued till 15 September, 2020. This observation indicates that with the increase in testing, the positivity rate did not decline in many parts of the country. The testing rate should be proportional to the infection rate, so that a substantial proportion of cases can be brought under the health system. When we were writing this article, although Government of India has repeatedly been mentioning that community transmission has not yet taken place in India, except in some pockets, a noted body of public health experts are of the opinion that recently community transmission has been detected in the country.
It is important to mention here that though India has remarkably increased its testing rate, roughly 30% of the tests are being done using the method of rapid antigen tests, while the remaining 70% are done through the reverse transcription polymerase chain reaction (RT-PCR) method (Sukumar, 2020). It is observed that though the costs incurred in the rapid antigen tests are sufficiently lower than those of RT-PCR (because it is a pooled test), there is a higher likelihood of ‘false positives’ and ‘false negatives’ when testing using the former method. The likelihood of ‘false positives’ and ‘false negatives’ is less than 5% when using the RT-PCR test; however, it is much costlier than the rapid antigen test. It should be mentioned in this context that a detailed state-wise break-up of the exact numbers of rapid antigen tests and RT-PCR tests are not readily available at present.
Initially, the price of an RT-PCR test in a private laboratory was fixed at ₹4,500. In an affidavit to the Honourable Supreme Court, the Indian Council of Medical Research (ICMR) informs that the price of the test is ‘based upon the price of specialised kits required for conducting the tests’. Taking the basic cost for all the components of a kit, it costs ₹1,500 per screening test, according to the council. An extra ₹3,000, it adds, is factored in for the confirmatory test. In view of this affidavit, the Honourable Supreme Court, on 13 April 2020, declared that private labs may charge for COVID-19 tests from individuals who can afford them. The price, however, must not exceed the upper limit set by the ICMR, that is, ₹4,500. The court also directs that free tests will be conducted in private laboratories only for the people who are covered under a flagship government healthcare programme, like Ayushman Bharat, and for the economically weaker sections of the society. However, several criticisms may be raised against such arrangements. First, critics observed that the testing should be free for everyone who is in need during the pandemic, as is done in several countries. Second, the cap of ₹4,500 is inflated; however, there is no unanimity regarding the optimum pricing of testing, and according to the critics, it can be ascertained that it may lie between ₹500 and ₹1,500 (Saikia, 2020). Finally, on 27 May 2020, ICMR removed the ₹4,500 cap on COVID-19 tests and empowered the states to decide the price of the kits (Sharma, 2020). Consequently, the price of a test has been reduced to ₹2,250 in many states. However, the unit cost of rapid antigen tests is still unknown, and it is generally conducted by the public sector agencies such as public hospitals or corporations/municipalities.
However, without loss of generalisation, it can be concluded that COVID-19 tests are mainly dependent on the public sector, particularly in towns and villages. It is important to point out that after the ‘forced’ reverse migration of labourers, during the lockdown period and in the initial phase of unlocking, from the highly infected states such as Maharashtra, Gujarat, Tamil Nadu, Karnataka, etc., the COVID-19 infection has spread to the hinterlands of the states that do not have a functional health system in place. However, there is almost no study regarding the extent of financial requirement from the health budget of respective states if India has to increase the number of COVID-19 tests at a certain level, as per the South Asian level or the level of high-income or upper-middle-income countries.
Against this backdrop, the present study has three objectives. First, we would like to find out whether the number of tests per million population has any significant effect in determining the number of infected people per million population at fortnightly intervals (or cross-sections) for the period from 16 April 2020 to 15 September 2020. Our hypothesis is that the number of tests per million people would still have a significant and positive relationship with the number of infections per million people. Second, we would like to explore the proportion of health expenditure that has already been done on COVID-19 testing in all the major states as of 2019–2020, assuming the unit cost per test to be ₹2,250, ₹1,500 or ₹1,000. Third, we would also like to estimate the proportion of health expenditure that has to be incurred by states in testing for COVID-19 infections to achieve the South Asian standard, the standard of high-income countries and the standard of upper-middle-income countries, with three sets of price assumptions. We estimate the proportion of health expenditure presuming that all the tests are RT-PCR tests, because of constraints on accessing information on the detailed state-wise break-up of rapid antigen tests and RT-PCR tests. This is an important exercise to understand current and future public health expenditure on testing during such pandemic. Finally, an attempt is made to discuss what could be the testing policy in future in order to obtain better leverage from testing in determining new infections.
Materials and Methods
Data for the present study were obtained from a variety of sources. Data on the number of tests per million population and number of infections per million population for different countries and for the states of India were obtained from the
Results
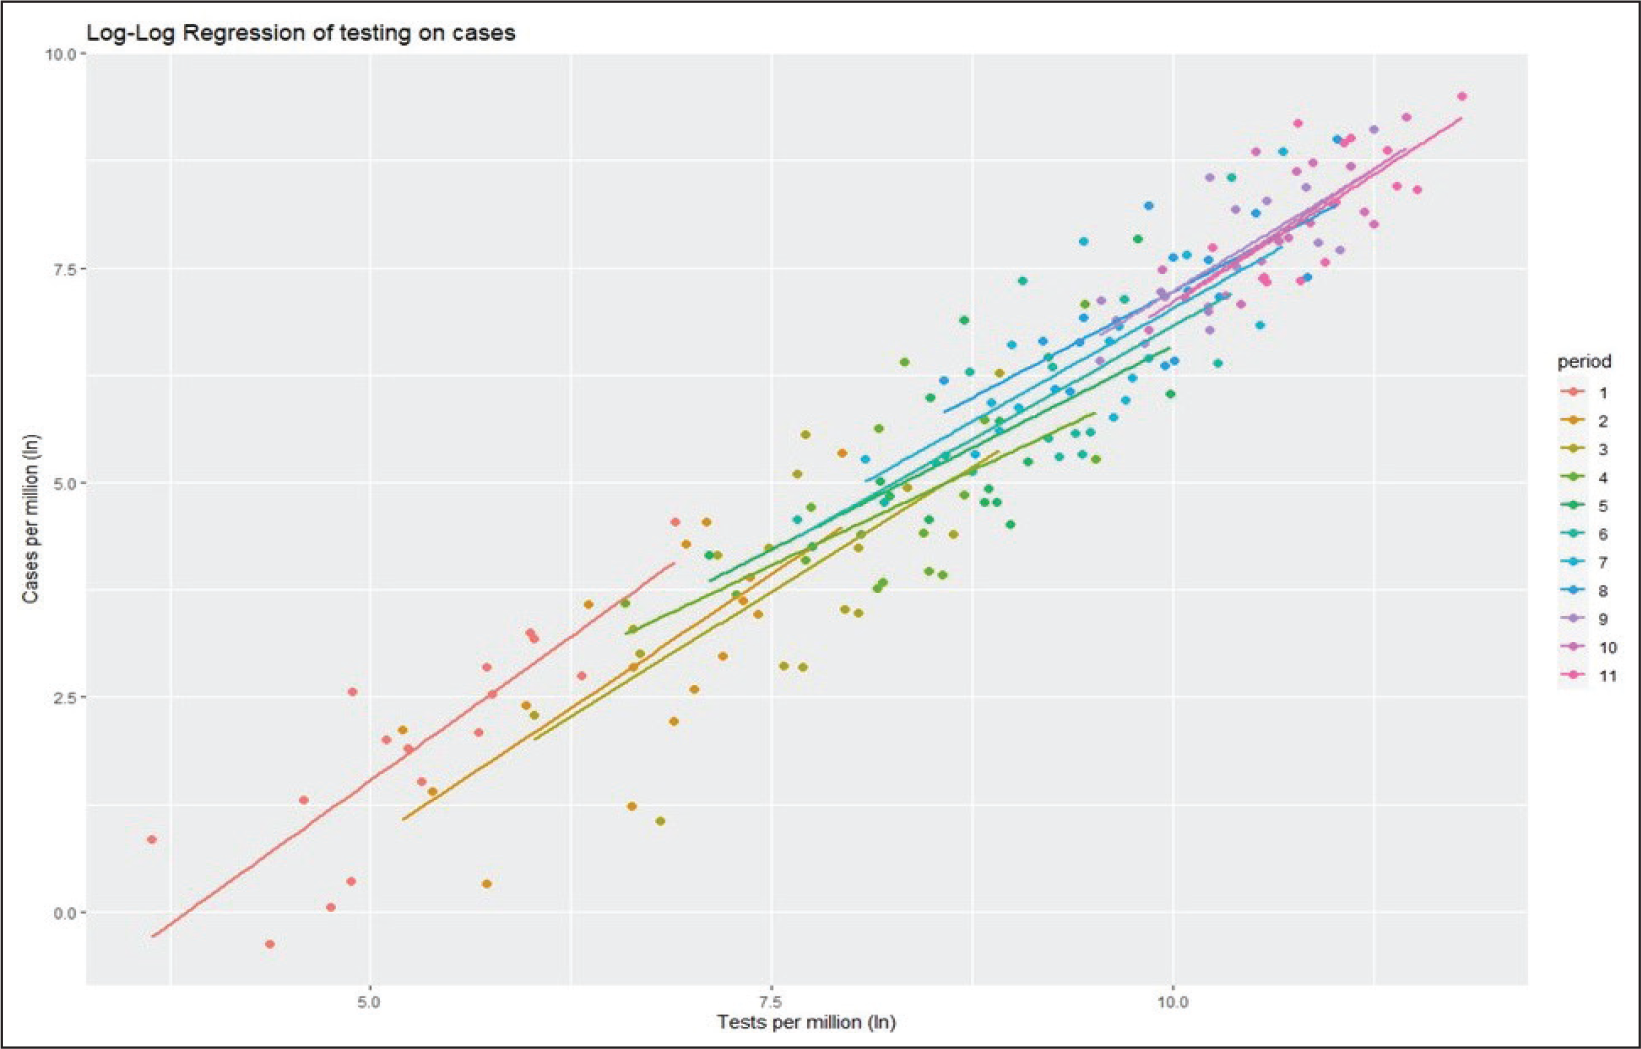
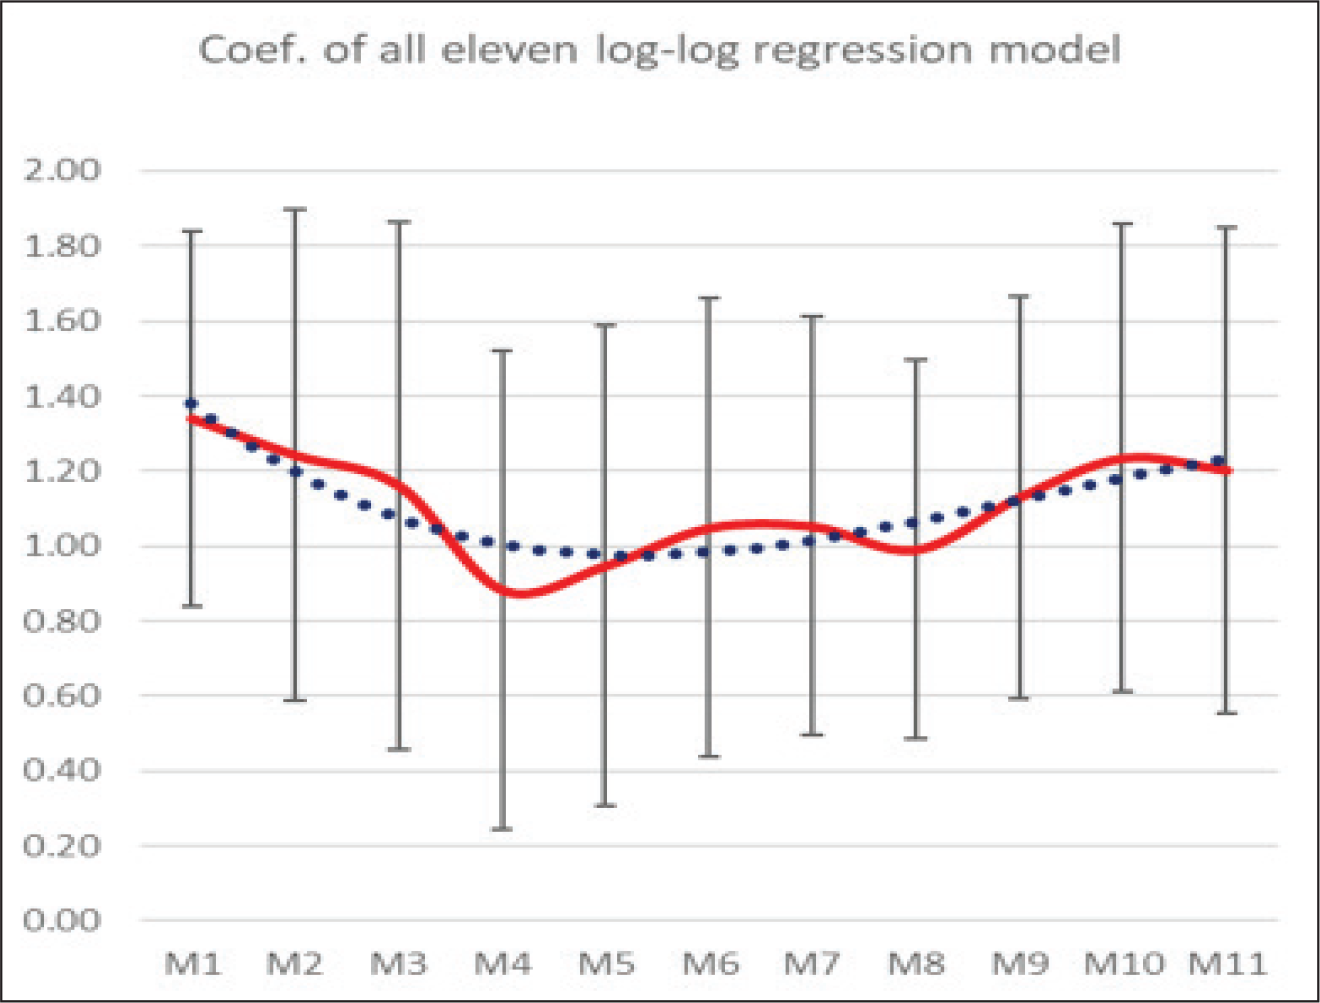
Figure 1 depicts the slopes and coefficients of the log-log linear regression obtained from the 11 cross-sectional linear regressions at 11 different time points in graphical form, while Figure 2 captures the change in the coefficients of the regression equation over the 11 points of time. Table 1 represents the actual values of coefficients and slopes with the significance level and R-squared values of those 11 linear regression models (M1–M11).
Regression Coefficients and Model Parameters of 11 Models (M1–M11) of COVID-19 Tests per Million on Cases per Million at Intervals of 15 Days from 15 April 2020 to 15 September 2020.
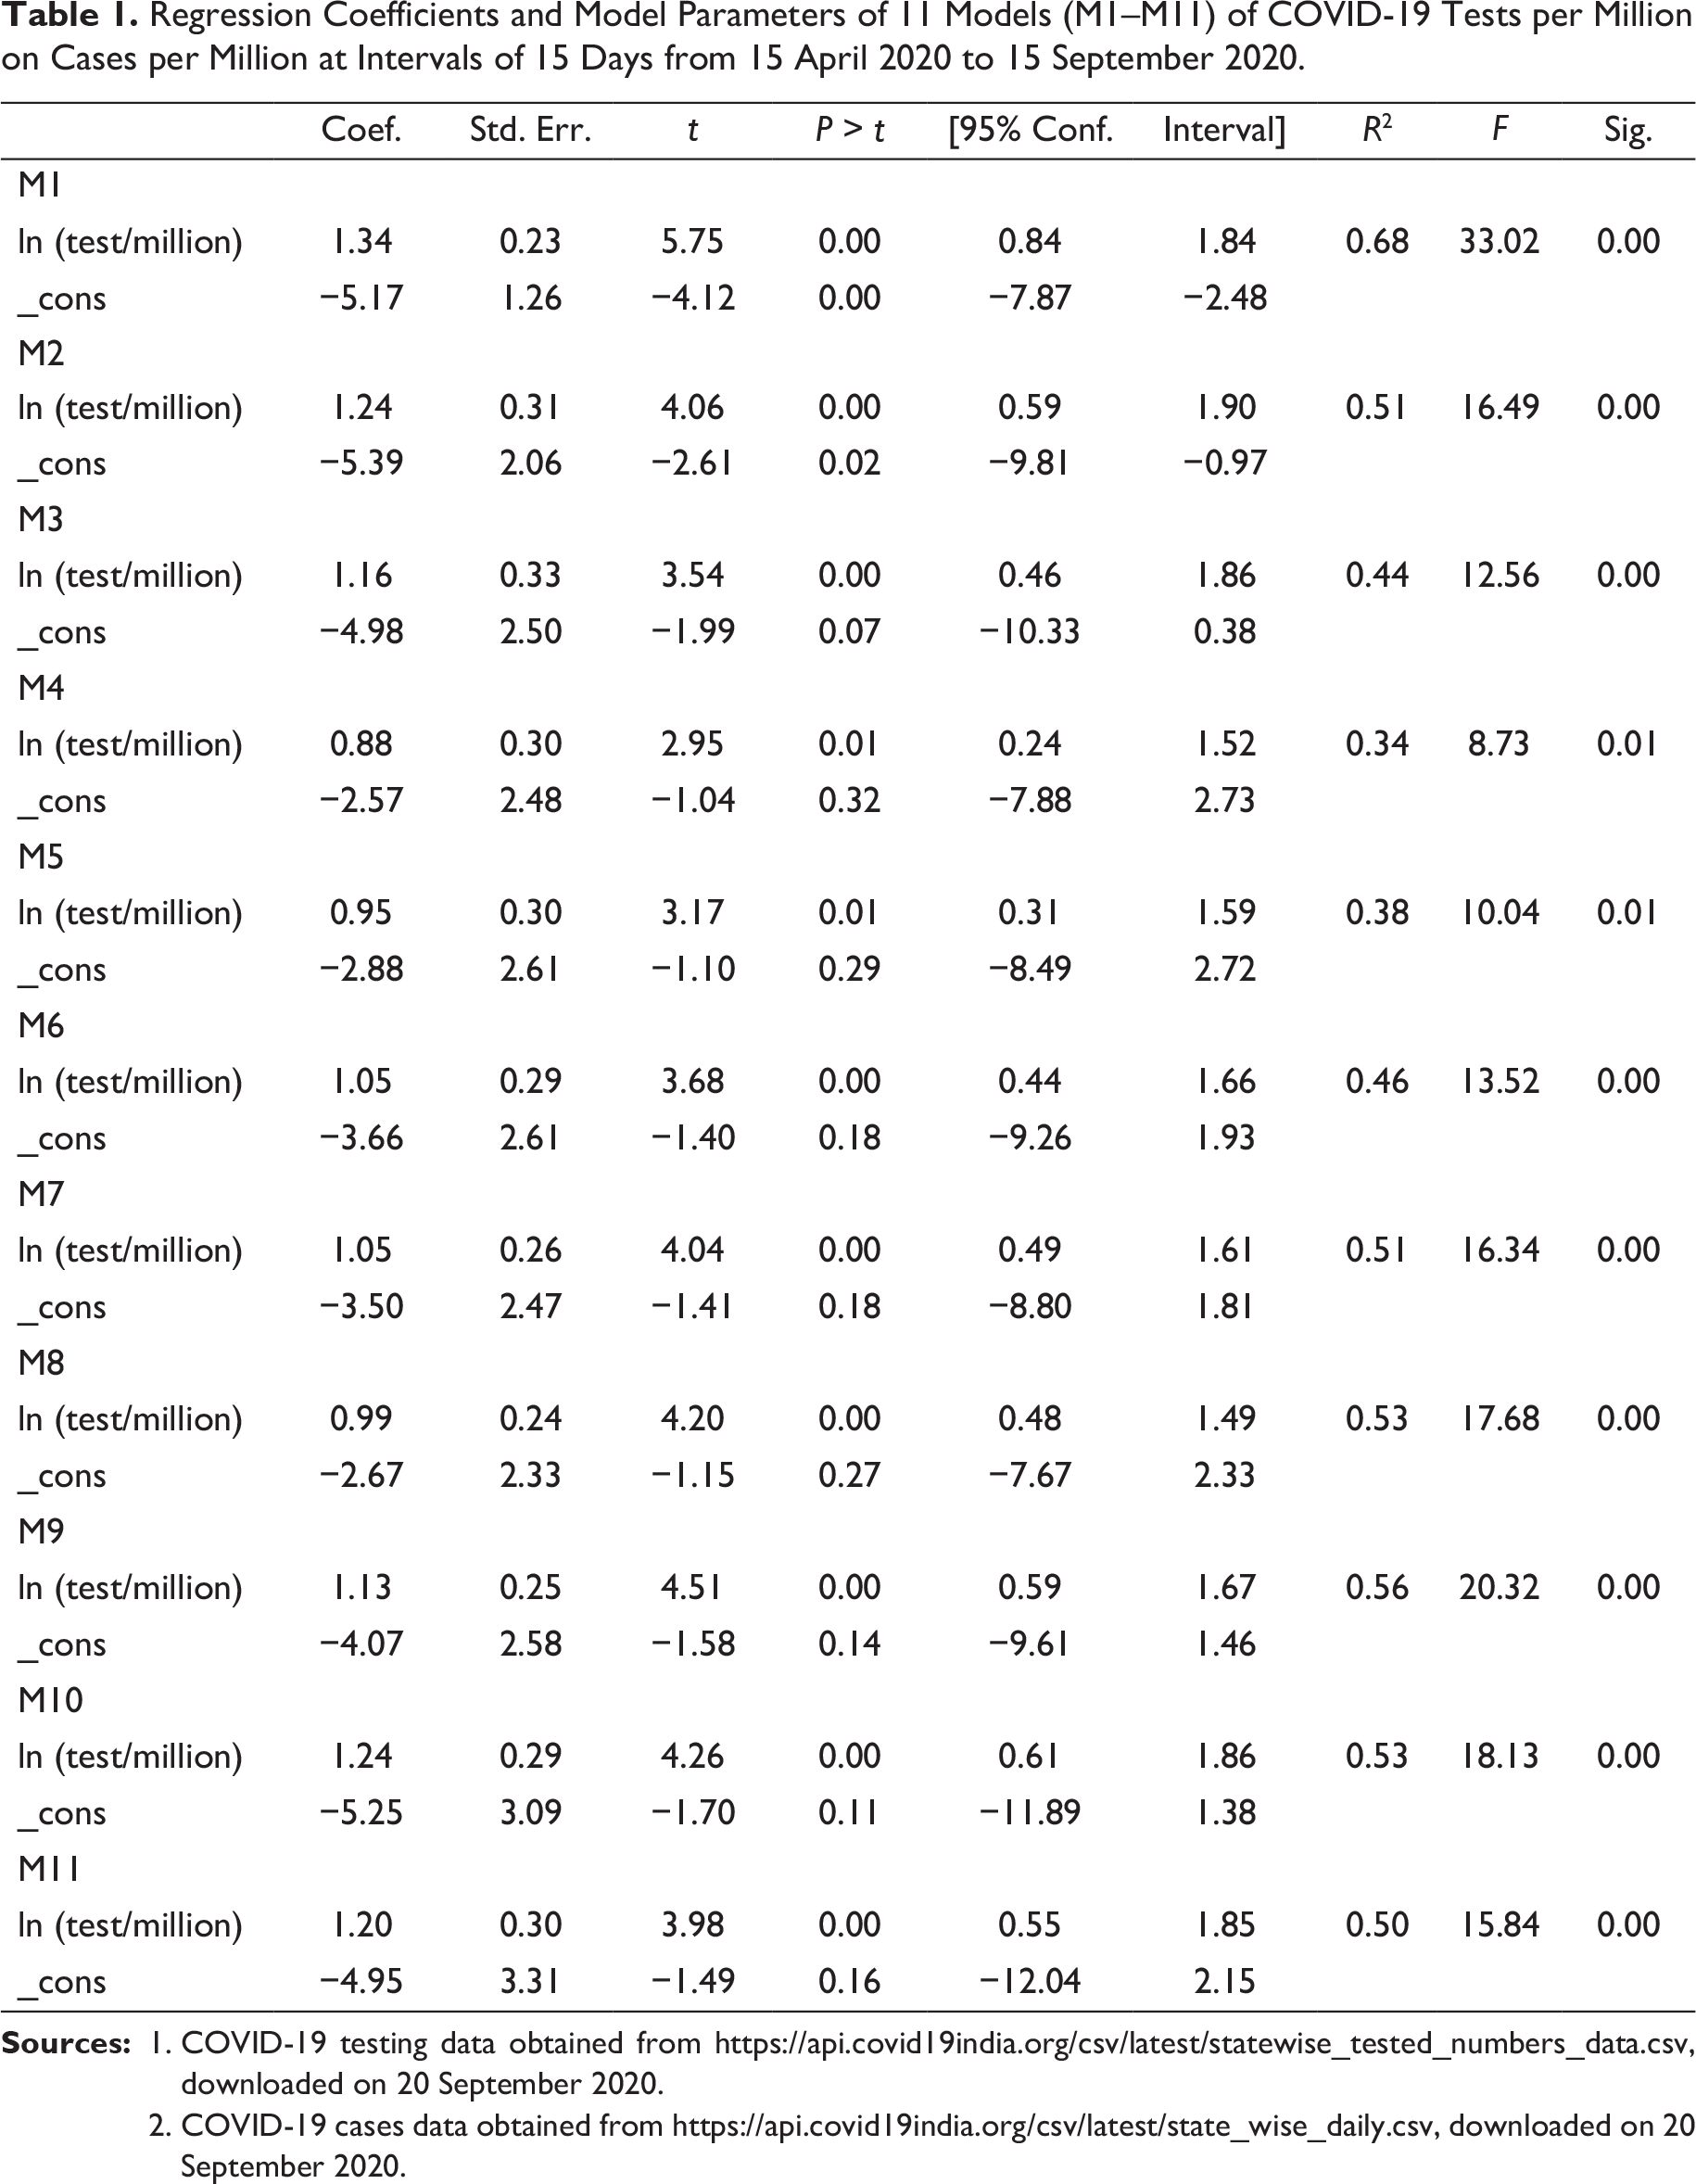
2. COVID-19 cases data obtained from
It is found that during the first two observation periods, a 1 unit increase in the testing per million population has an effect of approximately a 1.3 units increase in the number of new cases. However, as the testing increases, the coefficient starts declining and continues to decline till model M5 (i.e., 15 June 2020), after which it starts increasing again, thus forming a U-shaped pattern (Figure 2). To obtain a clear picture of the trend, we apply a polynomial of degree three on the coefficients. From the analysis, it emerges that from 15 September 2020, the trend starts declining again, which indicates the need for further increasing the testing rate at this point of time.
The reason for the U-shaped pattern is plausibly due to the fact that in India, initially, the testing rate per million was very low and was confined only to high-risk persons who came directly in contact with any COVID-19-positive patients and/or had any COVID-19-related symptoms. However, as the testing started increasing gradually among these high-risk persons, through contact tracing, quarantine and treatment, the marginal gain of testing among the high-risk group started declining. However, the rate of increase in positivity started increasing again at the beginning of July 2020, as more and more people started getting infected and the pandemic started to show a more generalised pattern, shifting from urban to semi-urban and subsequently to rural areas, where the population density is reasonably low. One can attribute such increase in the positivity of the coefficient to the ‘forced’ reverse migration of the labourers to their place of origin and the subsequent unlocking process in phases resulting in the violation of the norm of social distancing amid social gatherings.
The coefficient of change in positivity due to a 1 unit increase in testing can be considered as a marker of the force of the pandemic, indicating whether the rate of testing is adequate enough to capture the new infections in the population due to the spread of the pandemic. During the periods when the rate declines (marginal rate of infection [MRI] < 1), the pandemic is seen to be dampening, whereas MRI > 1 indicates that there is a need to increase the testing level. It is evident from Figure 2 that during the months of August and September MRI was less than 1, indicating an efficient testing strategy. There is a need of such analysis for each state and district to monitor the adequacy of testing in the concerned states and districts.
Estimated Proportion of Health Expenditure on COVID-19 Testing Assuming Three Prices per Test.
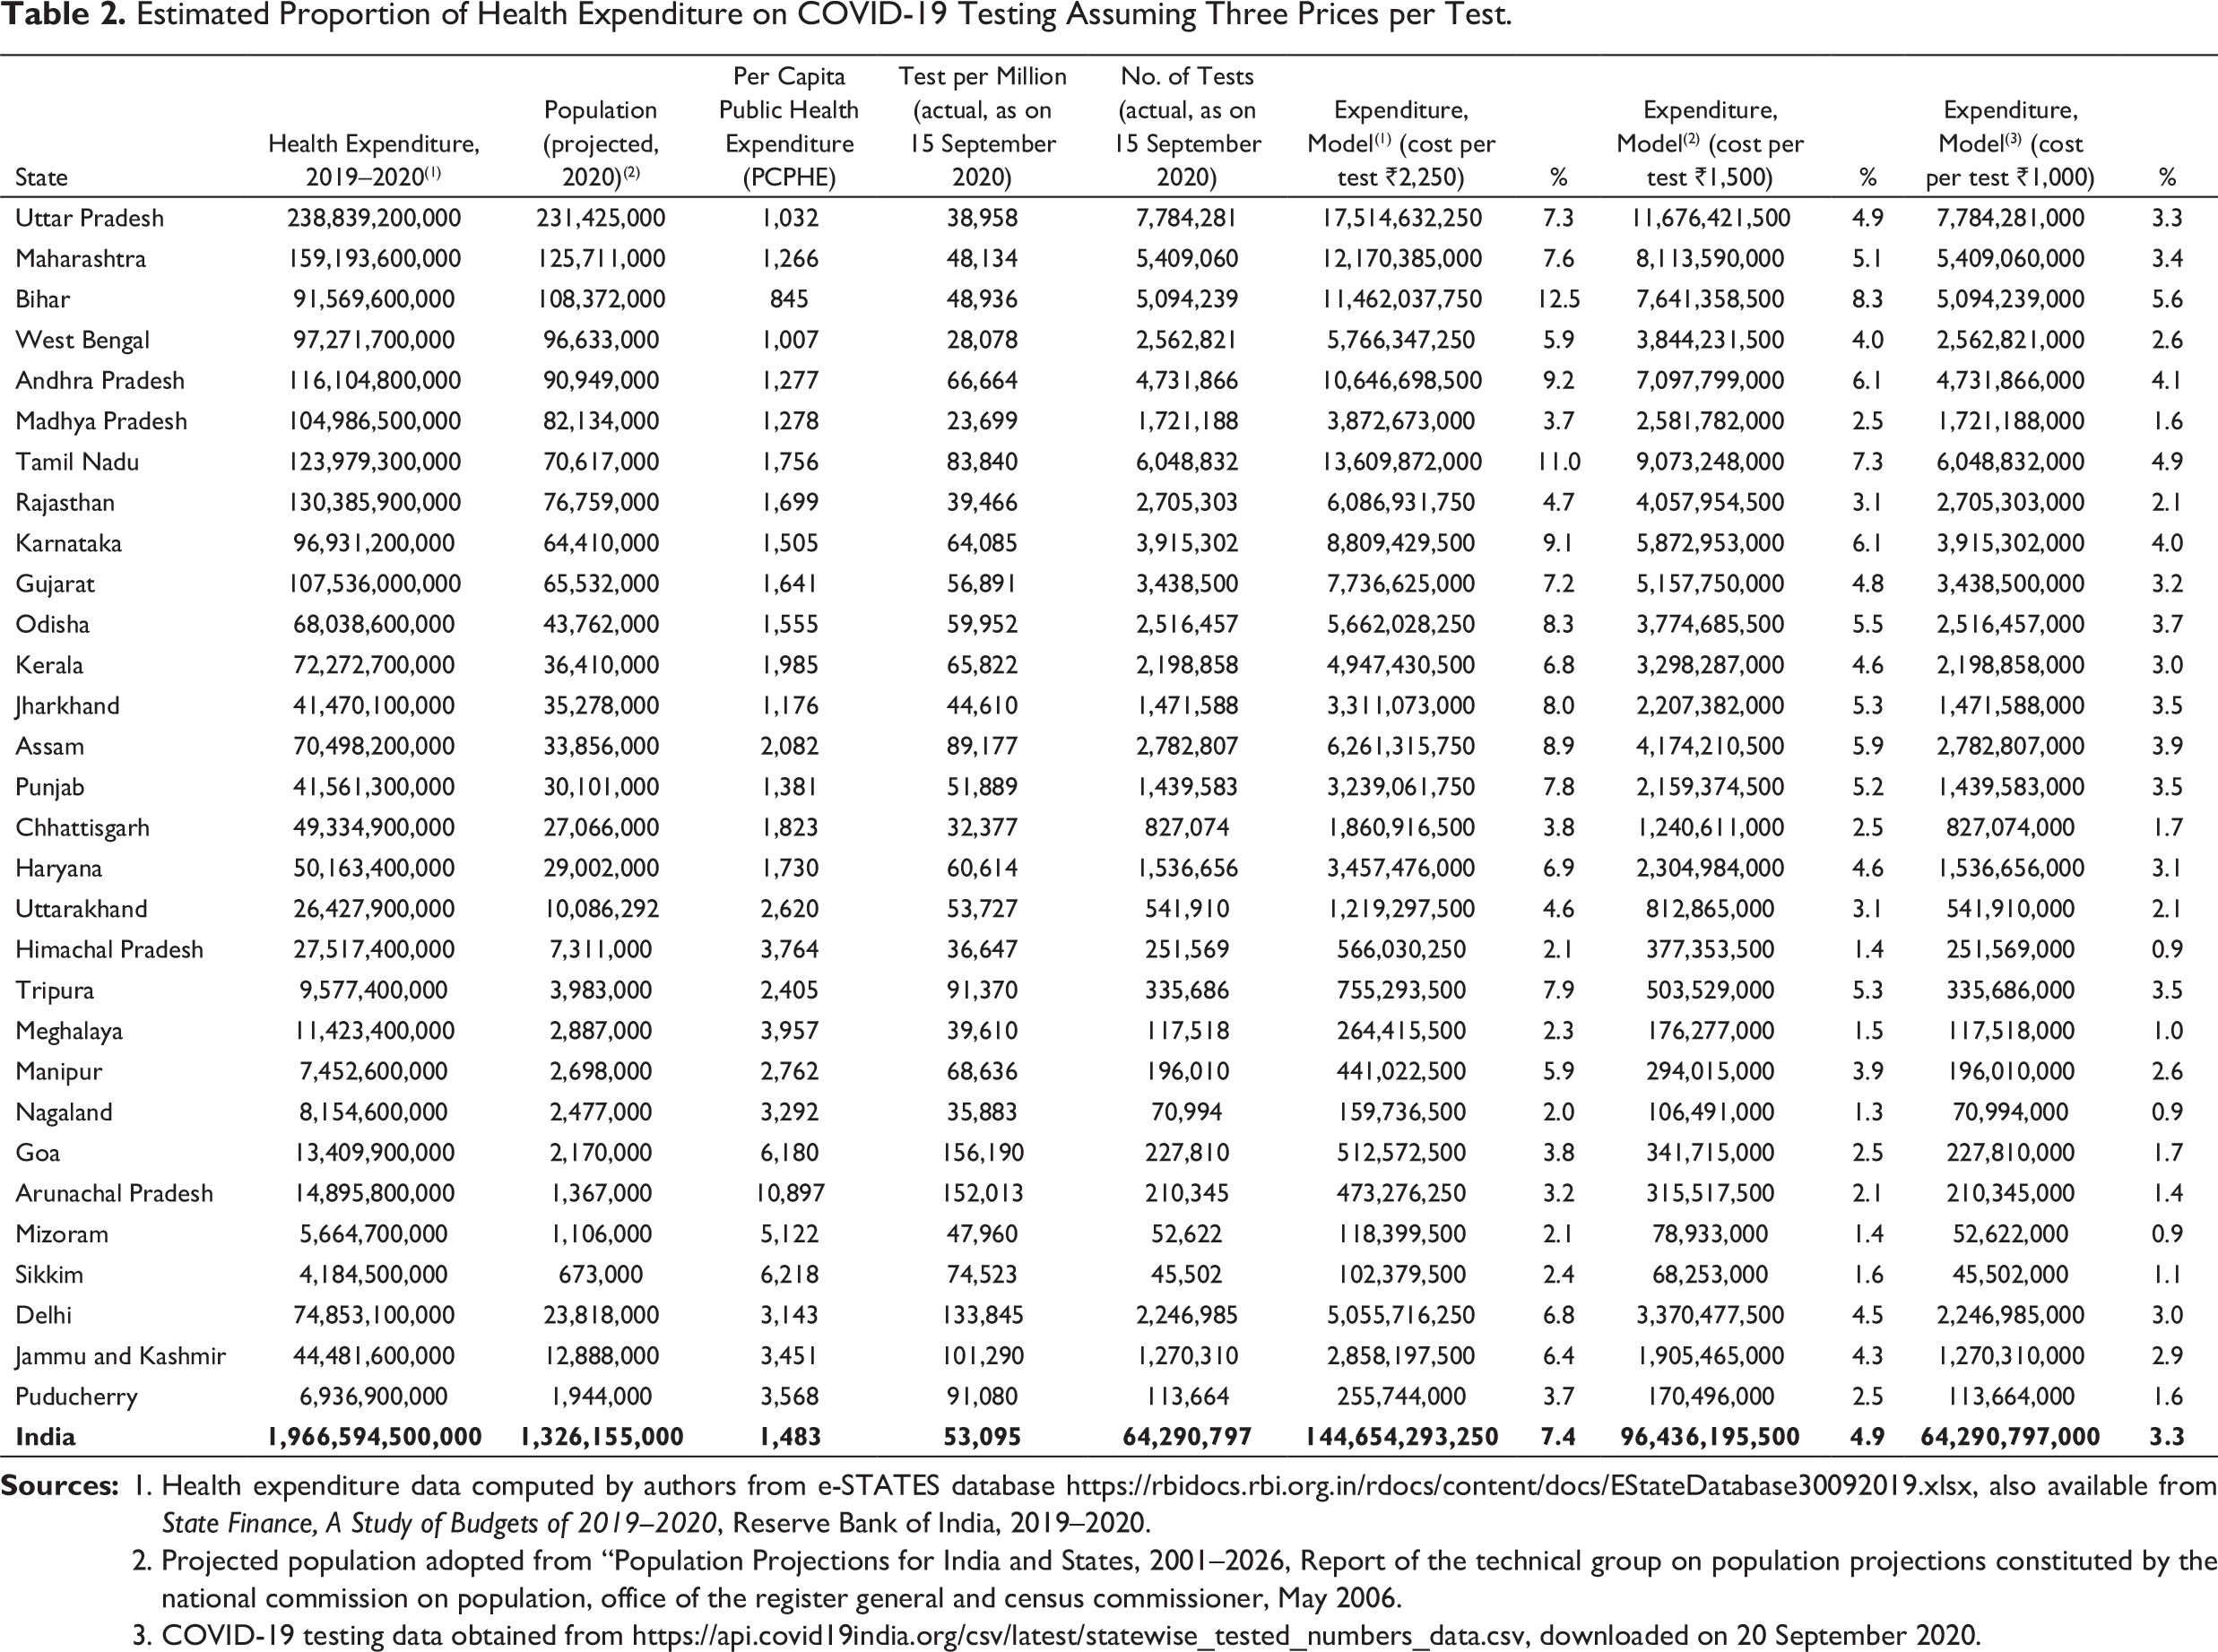
2. Projected population adopted from “Population Projections for India and States, 2001–2026, Report of the technical group on population projections constituted by the national commission on population, office of the register general and census commissioner, May 2006.
3. COVID-19 testing data obtained from
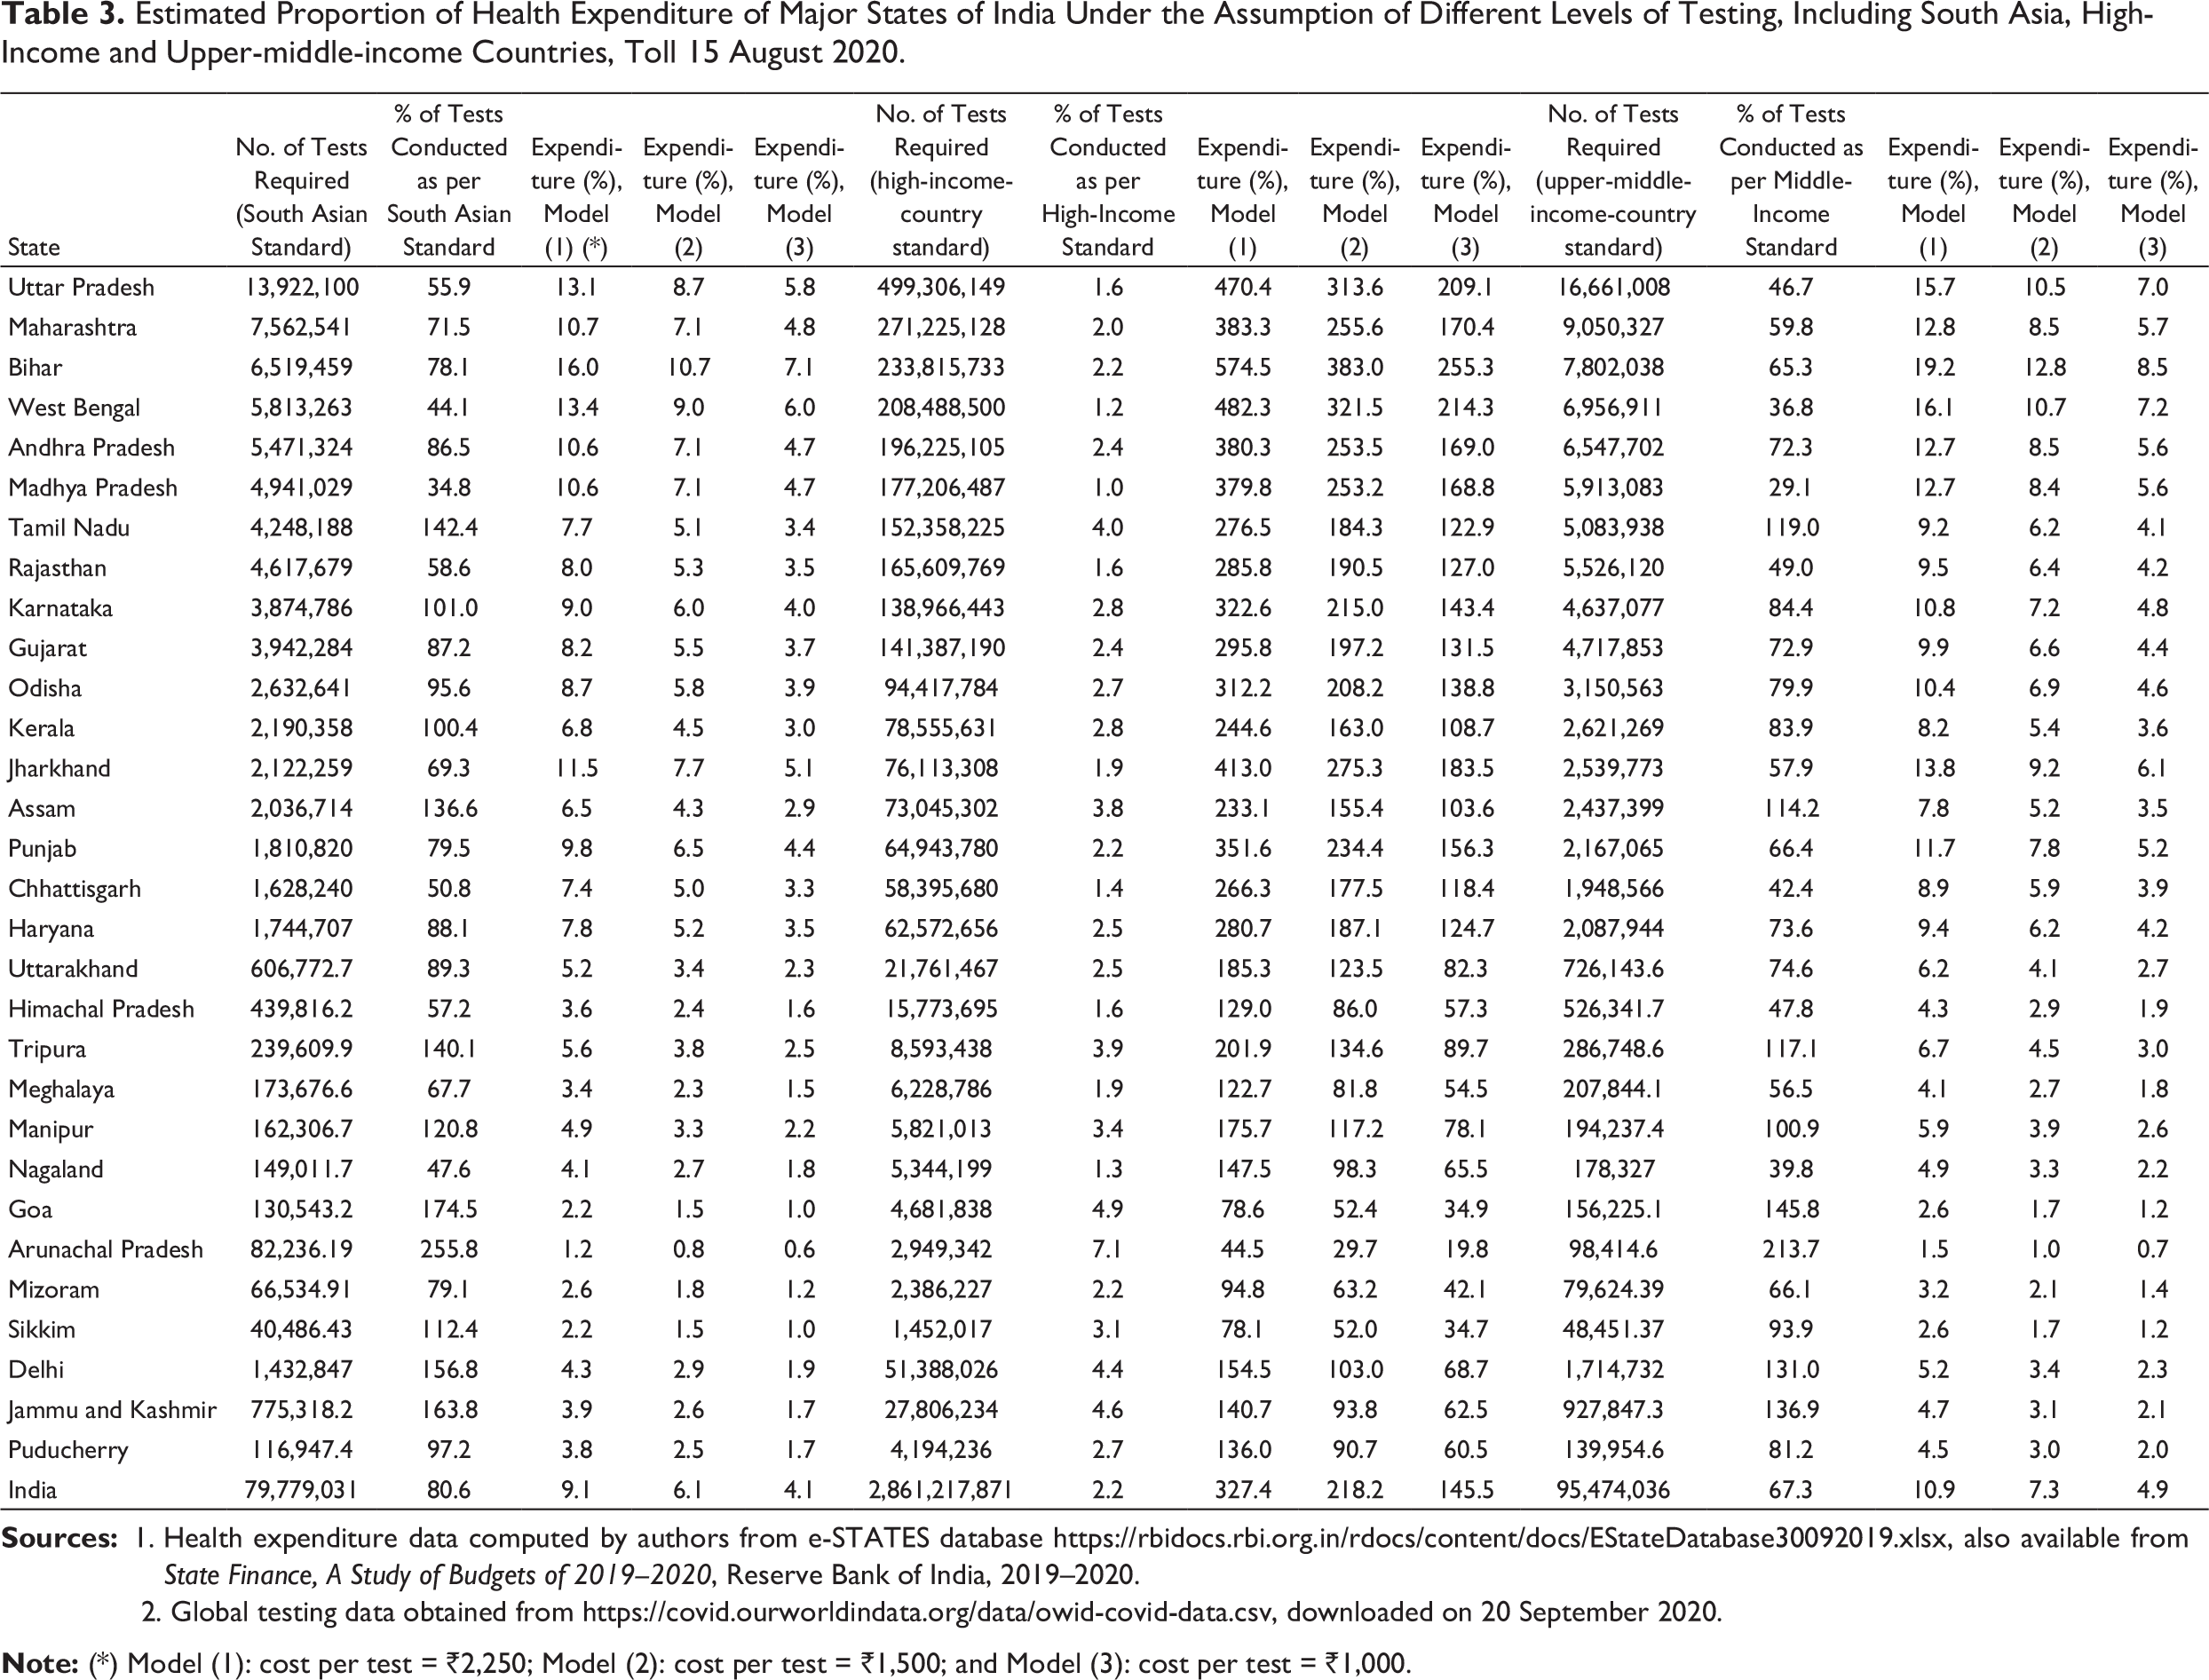
Estimated Proportion of Health Expenditure of Major States of India Under the Assumption of Different Levels of Testing, Including South Asia, High-Income and Upper-middle-income Countries, Toll 15 August 2020.
2. Global testing data obtained from
Table 3 presents the proportion of tests conducted by the different states according to various standards, such as the South Asian standard, the high-income-countries standard, and upper-middle-income-countries standard. It further depicts the proportion of estimated expenditure on COVID-19 testing to the health expenditure of individual states, provided the number of tests is increased to the mentioned standard. From Table 3, it can be observed that among the major states Tamil Nadu (142%), Karnataka (101%), Kerala (100.4%) and Assam (136%), and many of the smaller states, including Tripura, Manipur and Goa, have been carrying out more tests compared to the South Asian standard.
One can see that if the number of tests is increased to the South Asian standard, the expenditure on the testing for COVID-19 cases (out of the total health expenditure) would be 8–10% in the case of major states of India and around 3–4% for smaller states with a high PCPHE.
If the states of India want to raise their number of COVID-19 tests corresponding to the high-income countries, budgetary allocations of total health expenditure would overshoot in only testing for COVID-19 cases in the case of a majority of the states, even when taking the most conservative estimates. Even if we consider the lowest price of ₹1,000 per tests, India needs to spend, on average, 145% of the total expenditure envelop budgeted for health. However, if the numbers of tests are increased to the upper-middle-income-countries standard, such expenditure would lie between 10% and 20% in the case of the first group of states mentioned so far (as per most conservative estimates) and 5–7% for smaller states. On average, the country needs to spend 10% of its health expenditure on COVID-19 testing. Assuming a lower price per test, this can be further reduced to 7% and 3%, respectively, for price models 2 and 3.
The COVID-19 pandemic in India has created havoc and disrupted the economic and psychosocial life of millions. When we were writing this article, the country has not even reached its peak, and still a sizeable population is likely to be affected, directly or indirectly. Unlike other countries, India has failed to reap the benefits of lockdown in its full scale. Although there are claims of a low level of mortality of COVID-19, such claims have been criticised on the grounds of poor vital statistics system leading to under-reporting of deaths. The role of the pandemic in excess mortality cannot be ruled out, and the country must pay a cost in terms of demographic gain. The poor level of health system preparedness may be stated as one of the main reasons for such catastrophe.
The country has made significant progress in increasing public health expenditure from ₹370.62 billion to ₹613.98 billion between 2017 and 2020, which accounts for only 1.3% of the GDP in 2018–2019. However, the expenditure is substantially lower than that in many high- and middle-income countries (Keelery, 2020). Notably, around 70% of the total health expenditure is out-of-pocket expenditure (OOPE). This situation can be altered with a substantial increase in government expenditure on public health and the healthcare system. A review of the global health expenditure database of 2017 (WHO, 2014) suggests that a $1 increase in government expenditure reduces the OOPE by 5% in terms of the current health expenditure. The analysis based on the 71st and 75th NSSO rounds suggests that the proportion of people seeking healthcare in the public sector has been slightly increasing over the period. The study further points out that a 5% diversion of patients from the private sector to the public sector would reduce the OOPE as a proportion of GDP substantially. This is due to the fact that the cost of care in the private sector is substantially higher, and the gap is widening over time, forcing even the non-poor to access services in public facilities (Muraleedharan et al., 2020). Moreover, every year, a sizeable proportion of the population experiences impoverishment because of OOPE. The Indian Human Development Survey (2004–2005) estimated that 10% of the rural and 6% of the urban households have experienced impoverishment due to catastrophic health expenditure during this reference period. The main reason for such catastrophe was found to be inadequacy of the healthcare system in ensuring trained physicians (Ladusingh & Pandey, 2013).
However, the government at the centre has not been very keen towards increasing expenditure in public healthcare systems over the decades. India ranks 39 among the 45 nations for which data on healthcare expenditure are available, while the maximum share of public health expenditure in the case of lower-middle-income countries is found to be as high as 8.16%.
In order to provide a safety net against catastrophic health expenditure, Government of India has launched a new health insurance scheme (Ayushman Bharat Pradhan Mantri Jan Arogya Yojana [PM-JAY]) for 10.74 crore poor and vulnerable families (estimated around 40% of the Indian population) which covers ₹5 lakhs per family for in-patient care in secondary and tertiary treatment (GOI PM-JAY). The centrally sponsored scheme is being implemented on a 60:40 sharing basis with states. However, the prospect of the scheme remains uncertain, because prior experiences with PM-JAY suggest that such schemes are designed on unrealistic premises, like the premise that the majority of the population of this country is employed in the formal sector. At the same time, the limitations of the Bhore committee (1946) recommendations made the public health system weak, and the excessive focus on healthcare led to the mushrooming of the private sector. In the recent past, rather than strengthening of the public health system, the focus has been on insurance schemes, such as PM-JAY, because of the lack of realisation at the policy level that health is a socially desirable merit good. The prospect of such insurance schemes is also highly uncertain. A study to assess the effectiveness of all the health insurance schemes suggests that the Government-funded and Community-based Health Insurance Schemes (GFHIS) have shown an unfavourable net incurred claims ratio, indicating that the claim is higher than the premium. This leads to a situation of bailout of private insurance providers (Patnaik et al., 2018). From the preceding analysis, it is evident that there are substantial variations across various states in terms of spread of the pandemic in relation to the population size, existing health infrastructure and per capita spending capacity of the states. It is quite evident that Government of India should extend support to the larger states such as Uttar Pradesh, Bihar, Maharashtra, West Bengal and Madhya Pradesh, among others, due to their inherent low capacity to spend on public health. The smaller states, with a comparatively advantageous position in PCPHE capacity, should be continuously tracking the marginal rate of infection (as highlighted in this article) as a marker to shift policy gears on increasing or reducing the number of tests depending upon the rate of the spread of the pandemic. The smaller states have the capacity to spend at the level of developed nations (with a more conservative unit price), while for other states the health expenditure capacity would be exhausted if the benchmark of the high-income-countries is to be followed. Hence, for the larger states, the benchmark should be the standard of upper-middle-income countries.
Even if we enhance the testing capacity, another problem remains, which relates to the timing of testing. Should we increase testing coverage to a very high level or follow a path depending upon the spread of the pandemic? This is a problem of ‘now’ or ‘later’. If we conduct too many tests now, we would not be able to capture those who are infected in the future, for example, areas where no/less cases have been reported so far. If we conduct very less tests, we would miss out on the positive cases and those cases would further increase the transmission.
Considering the country’s global share of the population, it is quite evident that we have to increase the per-million testing to a very high level, so that the maximum population is covered over a period of time. This would include the testing of new individuals, as well as repeat testing of those who fall under the purview of testing guidelines. The testing should increase in proportion to the spread of the epidemic, at the rate of spread of the disease. In case the disease spread is faster, we have to increase daily testing; in case it is slow, then the number of tests per day can be lowered accordingly. Appropriate daily testing would help identify, treat and lower the spread of the pandemic, which would not only reduce infection but also reduce mortality. The log-log regression coefficient used in this article can be used as a suitable bellwether to assess the adequacy of the number of tests done every day.
To achieve the optimum number of daily tests, we have also to monitor a testing rate, with the number of quarantined people as the denominator. We must track and present the data on the number and proportion of quarantined people that are tested within 7–14 days of being quarantined.
Conclusion
As India is the second most populous country in the world after China, accounting for roughly 20% of the global population, it would not be an exaggeration to state that it is likely to experience a prolonged pandemic, and there is no alternative but to strengthen testing and subsequently establish an efficient model of triage in terms of quarantine and treatment care.
The evidences and arguments presented in this article suggest that there is no ‘one-size-fits-all’ strategy for deciding the number of tests to be done for all states of India. The factors that must be considered in adopting the policy of optimum number of tests per day may be as follows. First, we need to monitor and track the marginal benefit of testing at the state, district and sub-district level. Second, support to populous states by the central government to expand their testing capacity is the need of the day. Third, long-term measures to improve the health system are required, so that larger states can follow the PCPHE capacity in comparison to the smaller states, and subsequently, India should strive to reach a level where dependence on the private sector and OOPE become negligible. This is possible only with radical thinking, as the recommendations of the Bhore committee proved to be ineffective in strengthening the public health system, though we cling to this legacy for decades. Presently, the government is trying to cover up the failure following the unsuccessful health insurance model, which again fails to alter the situation, as the experience of the last couple of years suggests. At this point, there is a need for a strong public health system, and the country should be prepared for the next pandemic, so that we do not face a loss of lives and livelihoods in millions again.
Footnotes
Declaration of Conflicting Interests
Funding
The authors received no financial support for the research, authorship and/or publication of this article.